



Abstract
Based on data collected from residential aged care facility websites and the Sixth China National Population Census, this paper studies the spatial pattern of Beijing's aged care resources in the framework of spatial location of public facilities. The results show that at the township/street level, the overall distribution of public aged care resources is relatively balanced, showing positive spatial autocorrelation, while private aged care resources show partially negative spatial autocorrelation. Spatial regression analysis indicates that the dispersed and clustered distribution of private aged care resources are more sensitive to the density of local elderly population, although the distribution of two types of resources is affected by the absolute number of service objects in respective administrative areas. In short, the spatial distribution pattern of public and private aged care resources reflects the contrast between efficiency and equity in providing aging care in China, a fact that is shaped by both administrative and market forces.
Background and question
Contemporary China is undergoing the process of population aging. According to the Beijing Municipal Report on the Development of Aging and Senior Care Services (2016–2017), by the end of 2016, the city's population of senior citizens aged 60 and above was approximately 3,292,000, overrepresenting over 24% of the total population, which was the second highest level among all provinces in China, and the dependency ratio coefficient of the elderly population was 38.1%. In order to cope with the increasingly serious aging problems, the Special Plan for Elderly Service Facilities released by Beijing in 2015 for the first time specified the target of “90-6-4”, that is, 90% of the elderly population would adopt home-based aged care, 6% would use community-based nursing services, and 4% would choose admission into residential aged care institutions, which poses a considerable challenge to Beijing's available aged care resources.
According to the principles of the Beijing Twelfth Five-Year Plan for the Development of the Elderly (2011–2015), aged care resources should be developed in accordance with the characteristics of different regions and people, and various types of aged care institutions should be developed to achieve a reasonable allocation. At least one aged care institution should be set up in each township/street to ensure full local coverage of aged care resources. According to the Special Plan for Aged Care Facilities in Beijing, the spatial distribution of aged care institutions in Beijing should adopt the principle of combining centralization and decentralization. In the central city, the number of beds in aged care institutions should reach 25 per 1000 registered elderly people; in the new urban areas, the number should reach 45 per 1000 registered elderly people. According to the Three-Year Action Plan for the Construction of Aged Care Centers in Beijing (2014–2016), the spatial setting of aged care centers should be flexible and adapted to the distribution of the elderly population and the size of the administrative area. In addition, a balanced structure between the two ownership types should be maintained. In accordance with the principle of “controlling the high end, marketizing the middle end, and guaranteeing the low end”, different types of aged care institutions should all be developed to ensure that the needs of the elderly are met at various income levels. Public (i.e. state-owned) aged care facilities mainly provide beds of basic security, with priority given to the development of care beds for the disabled elderly, while private aged care institutions owned by social capital mainly provide ordinary beds, and can also develop the high-end market to an appropriate extent.
Under the policy target of the “equalization of basic public services”, what practical effect have these planning policies of aged care resources achieved? Has the equalization of aged care beds as public service resources been achieved across different regions? In an attempt to provide some answers to these questions from a spatial perspective, this study examines the distribution patterns of different types of aged care institutions and the relationship between aged care resources and population structure. In a general sense, the existence of human society cannot be separated from the spatial dimension, and public policy, which is used to guide and regulate individual or collective behavior, is also inevitably spatial in nature. 1 Yet although there has always been a call to emphasize the spatial dimension of public policies and to bridge geography and policy studies (Coppock and Sewell, 1976; Whitworth, 2019), policy analysis models have traditionally tended to concentrate on the analysis of socioeconomic factors and neglect the geographical dimension and spatial effects of policies (Ballas et al., 2003). It is only in recent years that this situation has improved, benefiting in large part from advances in geographic information systems (GIS) and spatial analysis techniques, as well as the development of disciplines such as spatial econometrics and spatial statistics. “Spatialization” (focusing on the spatial distribution and interactions of socioeconomic phenomena) is becoming an important trend in the development of social sciences (Logan, 2012; Sun, 2015; Thisse and Wildasin, 1992; Wang, 2011). In essence, the equalization of public service resources is itself a socioeconomic policy that typically aims at spatial equity, and there are regional differences in the distribution of target groups and policy effects, thus spatial analysis is more appropriate for the question about the distribution of aged care resources. 2
Furthermore, methodologically speaking, according to Tobler's first law of space, “everything is related to everything else, but near things are more related than distant things” (1970). However, as some scholars (e.g. Sun, 2015) have pointed out, despite the obvious spatial clustering characteristics of many phenomena in social research, ignoring spatial factors in practice is a common problem in the social sciences. From a modeling perspective, assuming that spatially correlated data are independent of each other threatens the unbiasedness and consistency of estimates and invalidates statistical significance tests, making the results unreliable. 3 Therefore, in terms of its technical approach, this study will use spatial analysis methods and models to quantify the spatial distribution of aged care resources, so as to explore the variability of the spatial layout of different types of aged care resources and the mechanisms that affect them.
Literature review and research hypothesis
In classical location theory, founded and developed by Johann von Thünen, Alfred Weber, and August Lösch, as well as in its modern developments, the geographical effects of resource allocation are emphasized, and locational decision-making behaviors of economic agents are studied according to the principle of efficiency through the analysis of factors such as costs and profits (Lösch, 2010; Thünen, 1986; Weber, 1990). However, characterized by non-profit and government-led characteristics with the objective of maximizing social benefits and welfare, public facilities face the question of how to achieve a balanced spatial layout within the framework of the fiscal budget. Thus, traditional location theory under purely market conditions is not applicable to public facilities.
It was against this background that Teitz (1968) first focused on urban public facilities and, with the help of neoclassical welfare economics, introduced the topic of public facility location theory, which opened up a new field of location theory. He argued that market-based location theory was often incompatible with the real world. For the location of public facilities, factors such as public demand and social welfare need to be taken into account. Due to the government's resource allocation and distribution system, the location of public facilities is not profit-driven, but mainly driven by welfare criteria. Public facility location theory emphasizes the balance between efficiency and equity, with the aim of achieving equitable allocation of public services and the maximization of public welfare. At the same time, it adopts a systemic perspective, emphasizing the analysis of the locational and spatial structure of the entire facility system, rather than the single economic agent as in the traditional location theory. This is an important feature of neoclassical location theory that distinguishes it from traditional location theory. Combining a range of geographic concepts with normative analysis, quantitative modeling, and neoclassical assumptions, Teitz extends the subject of locational choice from private firms to the public sector within a neoclassical analytical framework. Subsequent studies have operationalized equity and efficiency through some conceptual tools such as distance, mode, accessibility, and externalities, so that a research tradition focusing on quantitative analysis has formed (see DeVerteuil, 2000). 4
In summary, the locational tradition is instructive in three ways: first, the spatial layouts of private and public facilities have different dynamics and need to be treated differently; second, the spatial layouts of different types of facilities need to be evaluated in terms of equity and efficiency; and third, the spatial patterns of public facilities can be systematically analyzed in a normative and quantitative way. 5
To return to the practical level, from the perspective of equity, China's public services show an unbalanced pattern, which is mainly reflected in regional distribution differences, especially unbalanced development between urban and rural areas. For example, Wang (2011) pointed out that the existence of the urban–rural dichotomy created a social welfare divide between urban and rural areas. Ma et al. (2011) found that the overall level of quality of basic public services in China was not high and the degree of spatial differentiation was high. As a part of general public services, the distribution of aged care resources also showed an uneven spatial structure (e.g. Kang, 2016; Zhao, 2012).
This depends on the role of multiple factors. First, it is important to distinguish the different attributes of aged care institutions. By nature, public aged care institutions are open to all of society, yet their non-competitive nature cannot be maintained when the demand for admission is greater than the efficient supply. Private aged care institutions, on the other hand, reflect a market-based choice and are an efficient complement to public institutions, but they are for-profit and do not have a character of non-exclusivity. In reality, there is a mix of public and private institutions for aged care, so when considering the spatial distribution of aged care resources, it is important to focus on the forces of both administration and market, and to evaluate separately these two different types of aged care resources. However, based mainly on county-level statistics, the existing relevant studies have been lacking in terms of information in this regard, and it is difficult to differentiate between two types of aged care institutions according to their ownership.
The key point is that there is a risk of a “fallacy of composition” when different types of aged care resources are lumped together, without differentiating between specific types of micro-analytical units but rather making global inferences at a regional level. Some of the current contradictory findings reflect this problem. For example, Gao et al. (2010) argued that the spatial differentiation of public service facilities came from marketization, and that as social investments enter the public service sectors, their distribution patterns also became spatially differentiated. They argued that the reason for the uneven spatial distribution of public facilities was influenced by the profit-seeking behaviors of capital, as shown by the fact that public resources were denser in economically developed and densely populated areas, while remote suburban and rural areas experienced a relative shortage of public resources due to their lower market value. In contrast, Lyu and Wang (2008) argued that the supply of public services in China is not market-driven but politically oriented; that is, the extent of the supply of regional public services is mainly based on government capacity rather than public demand. The overall design of the fiscal system is still imperfect, and there are problems such as the lack of separation of financial powers, large differences in fiscal payment capacity, and inadequate performance of government service functions, resulting in an uneven distribution of public facilities. Evaluation based on separating different types of institutions will help to avoid such contradictory conclusions.
From the perspective of spatial-social theory, in a broader sense, the location of public facilities as a matter of spatial form is rooted in broader political-economic contexts and social processes (Dear, 1978; Harvey, 1973). For the problem of aged care institutions’ location, there are also many theoretically influential factors; however, subject to the limitations of the topic and the nature of the data (i.e. the study is not based on individual survey data of the target group), and considering the availability of the underlying data and the fact that the spatial dimension itself is embedded in these factors and regional population density which are highly correlated with socioeconomic factors, this study focuses on how the spatial distribution patterns of aged care institutions are influenced by demographic and spatial factors with the premise of distinguishing between private and public institutions. As Teitz (1968) pointed out, since decisions on the layout of public facilities are primarily made by government departments and there are no monetarily quantifiable benefits to be derived, “we are inevitably forced to consider in detail the distributional consequences of an outcome both over space and over population groups.” In empirical studies, the issue of equity in the distribution of public facilities has been analyzed in different ways and with different indicators, but as Batta et al. (2014) argue, the principles of dispersion, population, and equity should be considered in the rational distribution of public facilities. A review (Gu and Yin, 2010) also concluded that there are two main factors that influence the evaluation of the equity of public facilities: the accessibility-distribution characteristics of public facilities and the spatial differentiation of people with different needs.
Therefore, examining the patterns of distribution of different types of aged care facilities based on a GIS-based analysis controlling for demographic factors can help to further understand the dynamic mechanisms behind the spatial distribution of these resources. This is the main objective of this paper. Demographic factors play a decisive role in the distribution of aged care resources. Generally speaking, the deployment of public service facilities is linked to demographic factors in accordance with relevant planning standards and norms. For example, the aforementioned Three-Year Action Plan for the Construction of Aged Care Centers in Beijing (2014–2016) emphasized that the spatial setting should be adapted to the distribution of the elderly population and the size of the administrative area. From an analytical point of view, in relation to the issue of aged care facilities, the focus on factors such as the proportion and density of the elderly population also constitutes an indicator of the convergence of client characteristics in terms of demand, which has been emphasized by scholars of post-quantitative location theory.
However, the research method of some current studies on aged care facilities is that of basic statistical description or purely policy-oriented theoretical discussion (e.g. Jia et al., 2017; Wang, 2017; Zhou and Zhang, 2010), treating space only as an exogenous variable and failing to pay attention to the spatial correlation between the distribution of public resources. As mentioned earlier, due to policy diffusion or other structural reasons, there may be spatial correlations in the distribution of public facilities that are difficult to ignore, and in fact the allocations of public resources in neighboring areas often affect each other (Gu, 2016; Schmitt, 2011; Schmitt and Obinger, 2013). From a methodological perspective, ignoring spatial proximity or interactions can easily lead to biased estimates (Darmofal, 2015: 33, 41). Some spatial analyses are based on the spatial evaluation of single indicators (e.g. accessibility, spatial autocorrelation) (Cai et al., 2017; Cheng et al., 2012; Gao et al., 2010; Tao et al., 2014; Tao et al., 2015), or descriptive analysis of the current or historical changes in the spatial distribution of aged care resources from a city planning perspective (Shao et al., 2017; Xi and Cheng, 2015), or forecast or simulate the demand for aged care beds (Tao et al., 2015; Yan et al., 2015). However, no advanced causal model analysis considering the relevant influencing factors of spatial distribution has been applied, which makes it difficult to accurately estimate the possible spatial interaction effects of aged care resources while controlling for relevant factors. In their studies on the county-level distribution of aged care resources, Ma and Gu (2015, 2018) propose to consider both “spatial-institutional factors” and use the spatial lag model (SLM) and the spatial error model (SEM). In this research, institutional factors include indicators such as the proportion of the population aged over 65, the proportion of ethnic minorities, the number of primary school students, and the number of beds in hospitals, health centers, and social welfare institutions, etc. However, these variables are not typically institutional, but are more broad socio-demographic factors in a practical sense.
As yet, there is a lack of relevant quantitative research based on comparisons of public/private types of aged care resources. This dimension is worthy of more attention as an institutional factor. 6 In spatial analysis, although the dependence on the spatial distribution of facilities is generally considered to be a “spillover or demonstration effect” between different regions, the lack of variables in terms of ownership type makes it difficult to reveal in-depth the dynamics of the spatial distribution of aged care resources. In terms of policy design and market positioning, the aged care market is a typical dualistic structure; that is, public and private institutions serving different segments of clients who remain at different levels of the market. In terms of the dynamic mechanism behind it, the spatial distribution of public/private aged care institutions is subject to different administrative/market forces, and the distinction between ownership types helps to test the robustness of the spatial dependency effect of facilities as well as of the differentiation patterns.
In fact, the geographical pattern of dispersed or clustered public facilities is itself an expression of the principles of equity versus efficiency, under the influence of a range of socioeconomic factors. McAllister (1976) argued that there was no objective way of assessing the relative importance of equity and efficiency for the issue of public facilities, but it could be approximated theoretically by modeling the size and spacing of public facilities (corresponding to the size and number of facilities, respectively, in Teitz's terms). Equity is more sensitive to the spacing of facilities, with equity decreasing and efficiency increasing as the spacing of facilities of the same size increases. Morrill and Symons (1977) further note that efficiency and equity are often in conflict. For example, at a given spatial scale, an equity-oriented spatial allocation strategy, which does not account for variation in density or income across areas, tends to locate in areas of low density or low income more than an efficiency-oriented spatial allocation strategy. This will lead to the emergence of a large number of facilities, smaller in size and closer together, if it cannot reduce the proportion of low-income people who cannot be served effectively by only moving location. Finally, the distribution of facilities is characterized by a regular central-place-like lattice, which results in higher overall costs and lower efficiency. In summary, in a relative sense, an efficient spatial allocation strategy is more likely to minimize the number of facilities served and maximize the number of customers, thus leading to a centralized system of larger facilities; an equitable spatial allocation strategy will generally maximize the location of facilities to meet customer demand, thus leading to an overall reduction in access distances and a more discrete and localized system with a large number of smaller facilities. This meant that, as outlined by DeVerteuil (2000), on the one hand, the efficiency model is necessarily inconvenient for customers who are further away or even mostly in need; on the other hand, the equity model would reduce average transport costs but would inevitably increase operating costs.
Based on the above relevant theories and research findings, this study proposes the following working hypotheses for the spatial distribution of different types of aged care resources.
Due to the characteristics of data sources, the general level of research on aged care resources is the county level, and there is little research in which the spatial unit sinks down to the more microscopic street/township level. In practice, the basic unit of construction for aged care institutions in China is the township/street, and thus the inferences for them may be subject to the “ecological fallacy”. In this study, data were collected at the level of individual institutions and then aggregated to township/street level, so that the levels of the units of analysis are clearly hierarchical and can be analyzed at both the township/street level and as discrete entities. As some studies have pointed out, analyzing at a smaller spatial scale helps to improve the validity and predictive power of spatial models (e.g. Kang et al., 2013). The fact that the lower level of analysis is closer to distance-based accessibility measures facilitates a more appropriate evaluation of the equity of the spatial layout of aged care resources.
Data sources and pre-processing
The data types used in this study include areal data, point pattern data, and demographic data. The point data of aged care institutions is obtained from the website Senior Care (yanglao.com.cn). It should be noted that the data of aged care institutions vary considerably from one source to another due to different calibers and standards. In order to reflect the actual situation of aged care resources in Beijing as comprehensively as possible, and after checking and comparing multiple sources, the Senior Care data are more complete and regular (some of them are partner institutions of senior care). This study used a Python crawler to collect the data of aged care institutions in Beijing, including fields such as the name of the institution, address, type, nature of ownership, date of establishment, number of beds, fee range, etc. A total of 890 records was obtained, which included different types of institutions such as nursing homes, elderly apartment complexes, aged care centers, etc. 7
In the actual analysis, based on the manual verification of the address information of these institutions, the field “address + name of institution” was generated, and then the coordinates of all institutions were located using the application programming interface (API) of Baidu Map through a self-programmed R language code to obtain the latitude and longitude coordinates. 8 With reference to the list of aged care institutions on the Beijing Municipal Government Data Resource Network, a total of 781 valid records were obtained after programming and manual cleaning to remove some records that did not meet some criteria (e.g. belonging to general hospitals, non-centralized aged care service centers, etc.) or were duplicate records (branch offices counted separately). 9
The underlying population data were obtained from 2010 Beijing Township/Street Data of the Sixth China National Population Census (Beijing Sixth National Population Census Leading Group Office and Beijing Municipal Bureau of Statistics, 2012), which is the most authoritative source available in the general public data. The standard for the elderly population in this study was set at the population aged 65 and above. Population/elderly population density indicators were calculated using the information on the total population/elderly population and the area of each township/street polygon in the map. In addition, the spatial regression model also incorporated indicators of the total population aged 65 years and above in each region.
In order to maintain consistency with the spatial caliber of the underlying population data, the vector electronic map of Beijing townships/streets used in this study is also a historical version purchased from a specialist spatial information technology company. Several areas in Beijing have been adjusted at the township/street level since 2010, but this does not affect the general pattern of spatial distribution of different types of aged care resources explored in this paper. The actual analysis included 318 townships/streets (excluding very few enclaves). The indicators of the number of aged care institutions and beds at the township/street level were generated by the process of aggregation.
After the data were cleaned and processed, the spatial analysis, modeling, and visualization were carried out using the maptools, rgdal, spdep, sp, raster, PBSmapping, AMOEBA, spatstat, integrated nested Laplace approximation (INLA) and ggplot2 packages of R.
Research findings
Descriptive statistics
In the data, there are four types of institutions: “publicly owned” (487), “publicly owned and privately run” (12), “privately owned” (272), and “privately owned and publicly assisted” (10). As the number of “publicly owned and privately run” and “privately owned and publicly assisted” types are relatively small, the analysis classified the former as “publicly owned” and the latter as “privately owned” respectively according to the respective properties. Thus, the numbers of public and private institutions were calculated to be 499 and 282, respectively, with a corresponding proportion of 63.9% and 36.1%. The results of this study and the descriptive statistics of the explanatory variables are shown in Table 1. 10
Statistical description of variables.

Note: SD: Standard deviation.
In the collected data, there are 135,211 beds in all aged care institutions, with an average of 173.13 beds per institution. The total number of beds in public aged care institutions is 61,309, with an average of 122.86 beds per institution, while the total number of beds in private aged care institutions is 73,902, with an average of 262.06 beds per institution. The latter is 2.13 times greater than the former. The difference in the average number of beds (logarithm) between the two types of institutions is statistically significant (independent-sample t-test, p < 0.001). 11 As a result, private aged care institutions are more in line with the principle of spatial allocation in pursuit of economies of scale and are relatively more efficient in their provision. As such, Hypothesis 3 holds. 12 However, it is important to note that the distribution of the number of aged care beds at the street/township level is highly skewed and has a large number of zero values (see Figures 1 and 3 and Table 2 for the distribution), which makes the mean values very unrepresentative. The fact that the standard deviation is greater than the mean indicates there is an over-dispersion problem that needs to be taken into account in the subsequent modeling process.

Distribution of aged care resources at the levels of institution and township/street.
Total and mean of beds number of aged care institutions of three township/street clusters divided by spatial clustering analysis (k = 6).

Figure 2(a) shows that, relatively speaking, the aging of the population in Beijing shows a pattern of being high in the distant suburbs and central urban areas and low in the suburbs, which is consistent with the findings of some thematic studies. To analyze the relationship between aged care resources and urban spatial structure, the Euclidean distance between the center of gravity of each township/street polygon and Tiananmen Square was calculated using the gCentroid function after transforming the WGS84 latitude and longitude coordinates into coordinates with projection planes (EPSG: 32650, i.e. WGS84/Pseudo-Mercator).

Township/street population data and spatial distribution of aged care institutions.
Spatial areal analysis
The focus of this study is to analyze the balanced distribution of aged care resources at the township/street level within a municipal area, and the focus is on the analysis of the spatial areal data. 13 Therefore, based on the data of all aged care institutions, the corresponding values at the township/street level were obtained by aggregating the institution data according to all township/street boundaries. The spatial weight matrix is defined in terms of k-nearest neighbors, and the number of neighboring spatial units is set at k = 6. 14
Spatial clustering analysis
Firstly, the AMOEBA algorithm (A Multidirectional Optimum Ecotope-Based Algorithm) (Aldstadt and Arthur, 2006) was used to carry out a spatial cluster analysis of towns/streets into high, medium, and low categories, based on the average number of beds in aged care institutions per 10,000 people.
The clustering analysis results show, in terms of the number of beds per capita, there is a higher number of private aged care resources in the northwestern, southeastern, and southern suburbs, while public aged care resources are relatively abundant in the northern and mountainous regions. In terms of the number of beds per capita in the city center, there is a shortage of resources per capita, and more resources are located in the suburbs. It can also be seen from Figure 3 (and Figure 6) that at the township/street level, public aged care resources show positive spatial autocorrelation, with similar-sized townships/streets being distributed contiguously; private aged care resources are abundant in some areas, but a smaller number of private resources are scattered in the surrounding areas, and the scale difference of them is relatively wide.
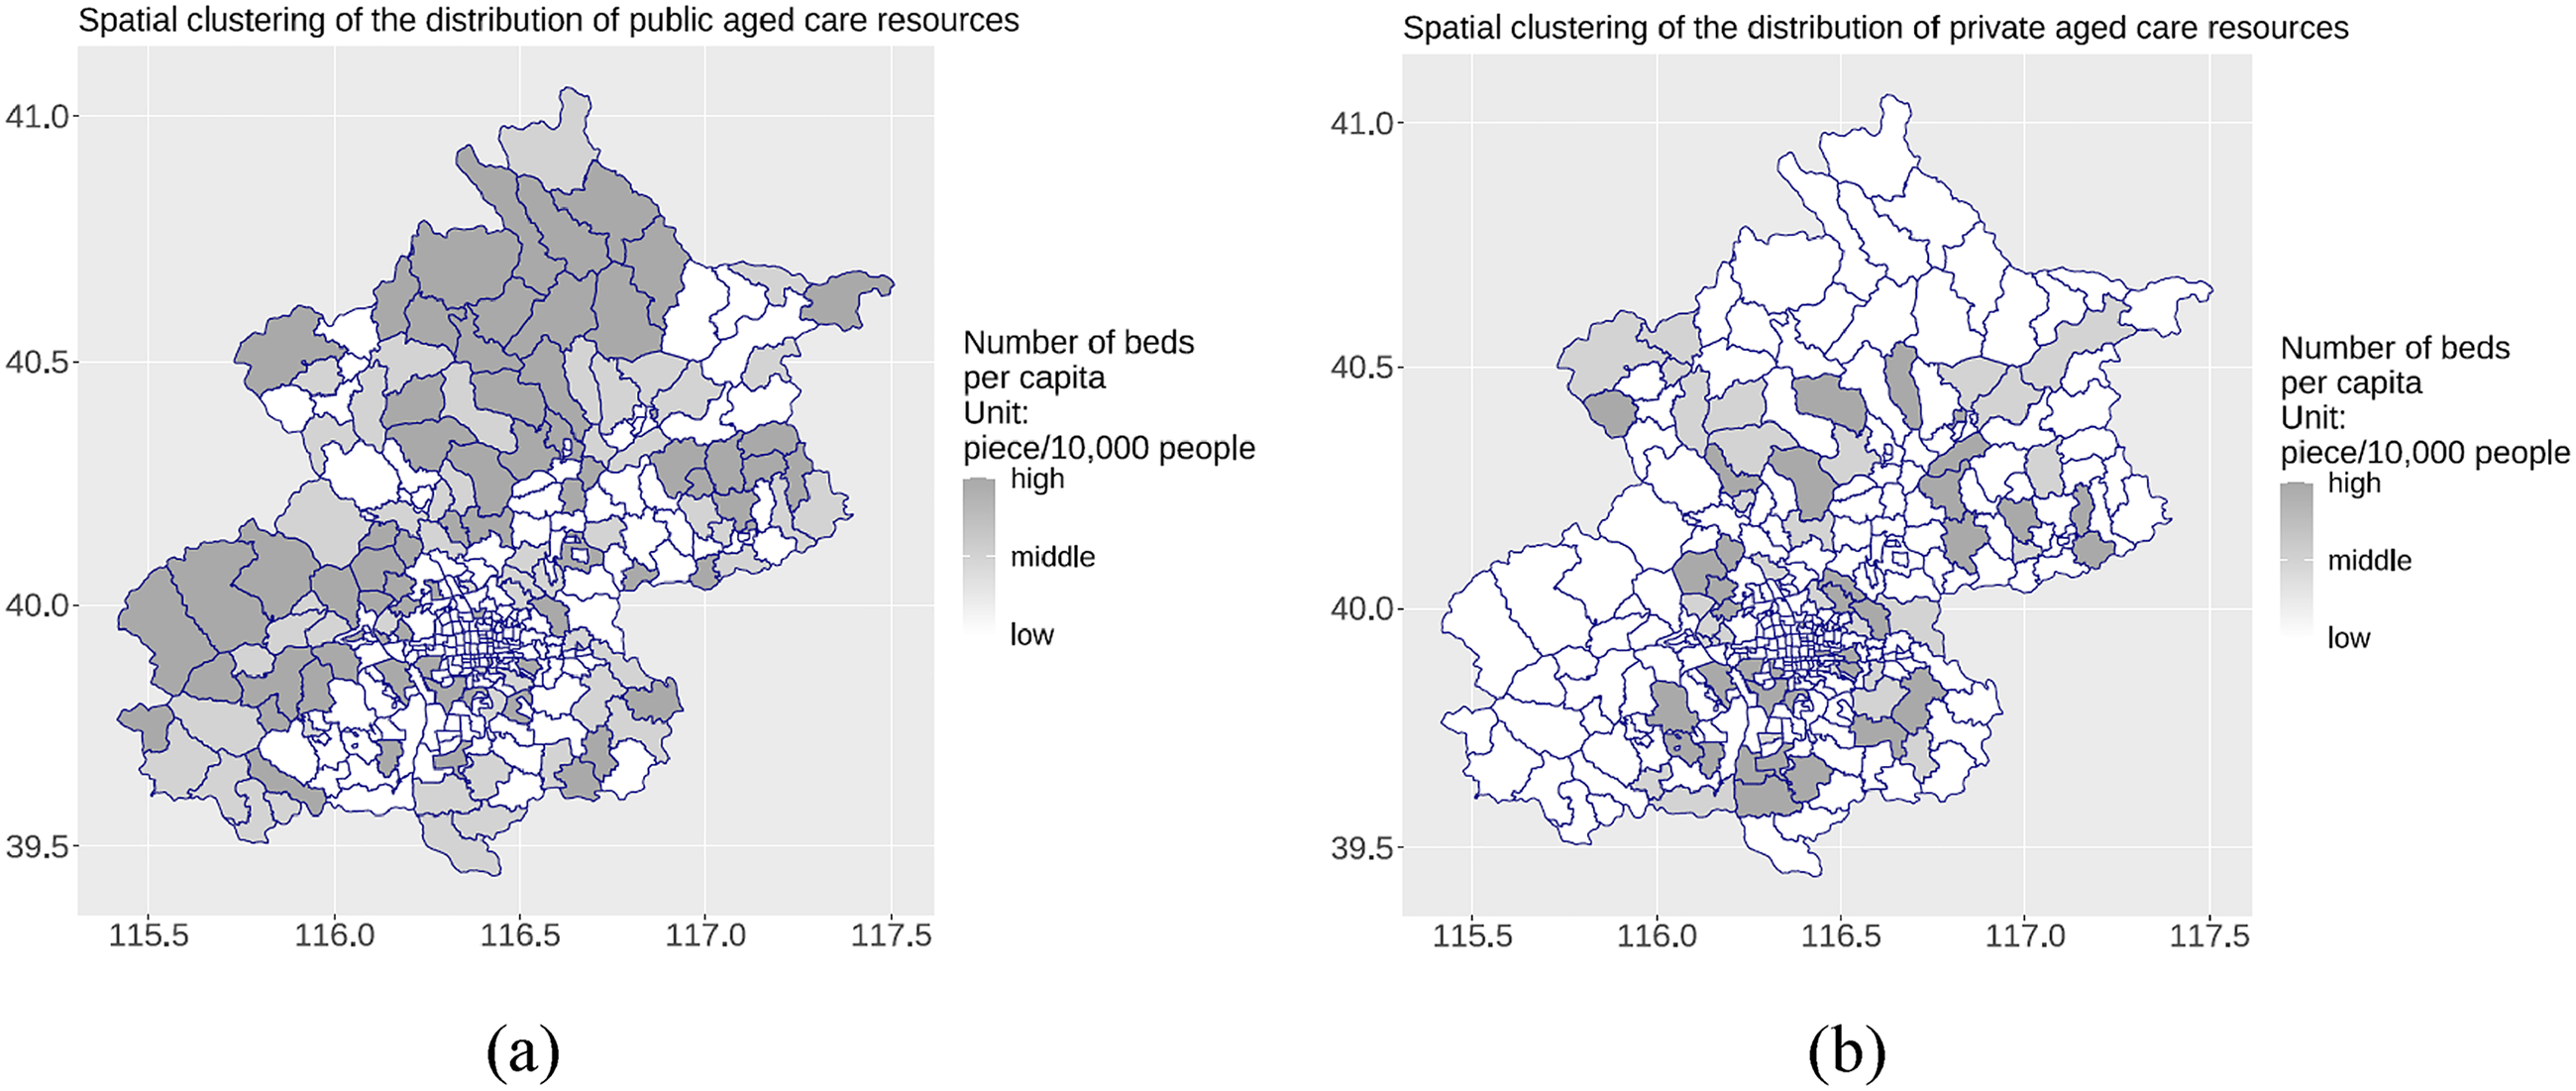
Spatial clustering analysis of aged care resources at township/street level.
Spital inequality analysis
Without considering population and space, the Gini coefficient for the number of aged care beds at the township/street level is 0.6778 for public and 0.8199 for private respectively. Decomposition using the spGini function, taking space into account (see Table 3 for the results), 15 shows that the difference is mainly between non-neighboring spatial units (nsGini), indirectly indicating a certain degree of positive spatial aggregation of aged care resources. This indicator is significantly higher for private aged care resources than for public ones. It can be seen that, in terms of the region as a whole, public aged care resources are more equitably distributed than private ones.
Gini coefficients and their decomposition for the beds number of aged care resources at township/street level.
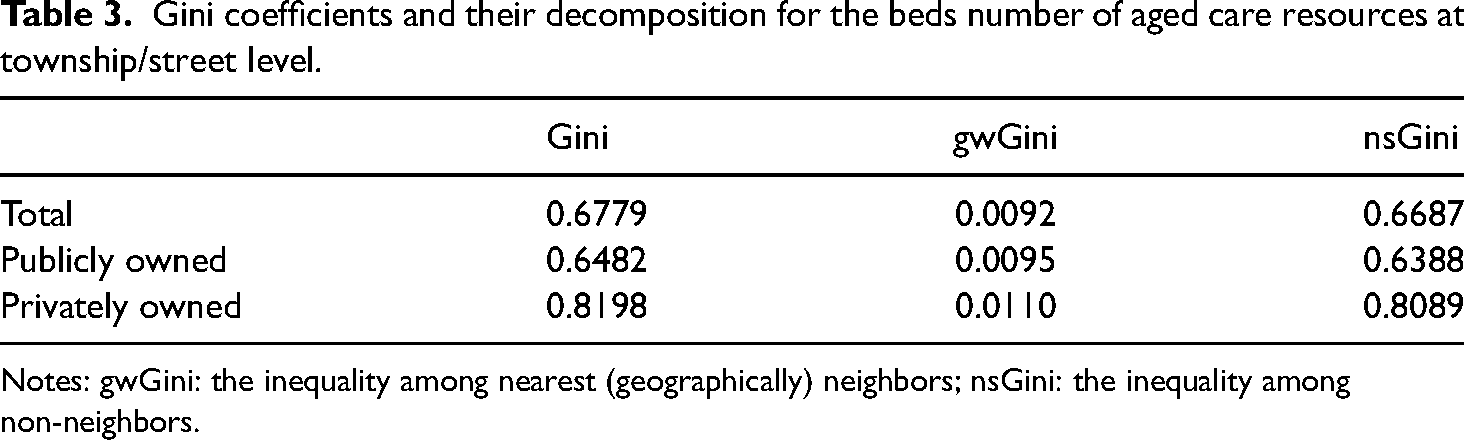
Notes: gwGini: the inequality among nearest (geographically) neighbors; nsGini: the inequality among non-neighbors.
Spatial accessibility analysis
Spatial accessibility is an important indicator for evaluating the spatial equity of public facilities,
16
and generally refers to the distance between any point in a region and a public service facility (usually also considering the quality and quantity of the service). There are many different methods and indicators for evaluating spatial accessibility (see Peng et al., 2012). Here, we adopt the definition and calculation method of Kalogirou (2017) and Kalogirou and Foley (2006) to estimate the accessibility of the population aged 65 years and above to each public/private aged care facility within a certain spatial range. The accessibility measurement function takes the SAM approach (Kalogirou and Foley, 2006):
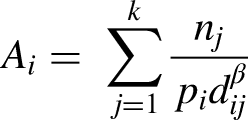
The visualization of spatial accessibility by township/street is shown in Figure 4, which shows that accessibility varies considerably by geographical unit. The overall distribution is heavily right-skewed and a few townships/streets have outstanding accessibility indicators. On the whole, the public facilities have better accessibility and are more balanced than the private ones. 17
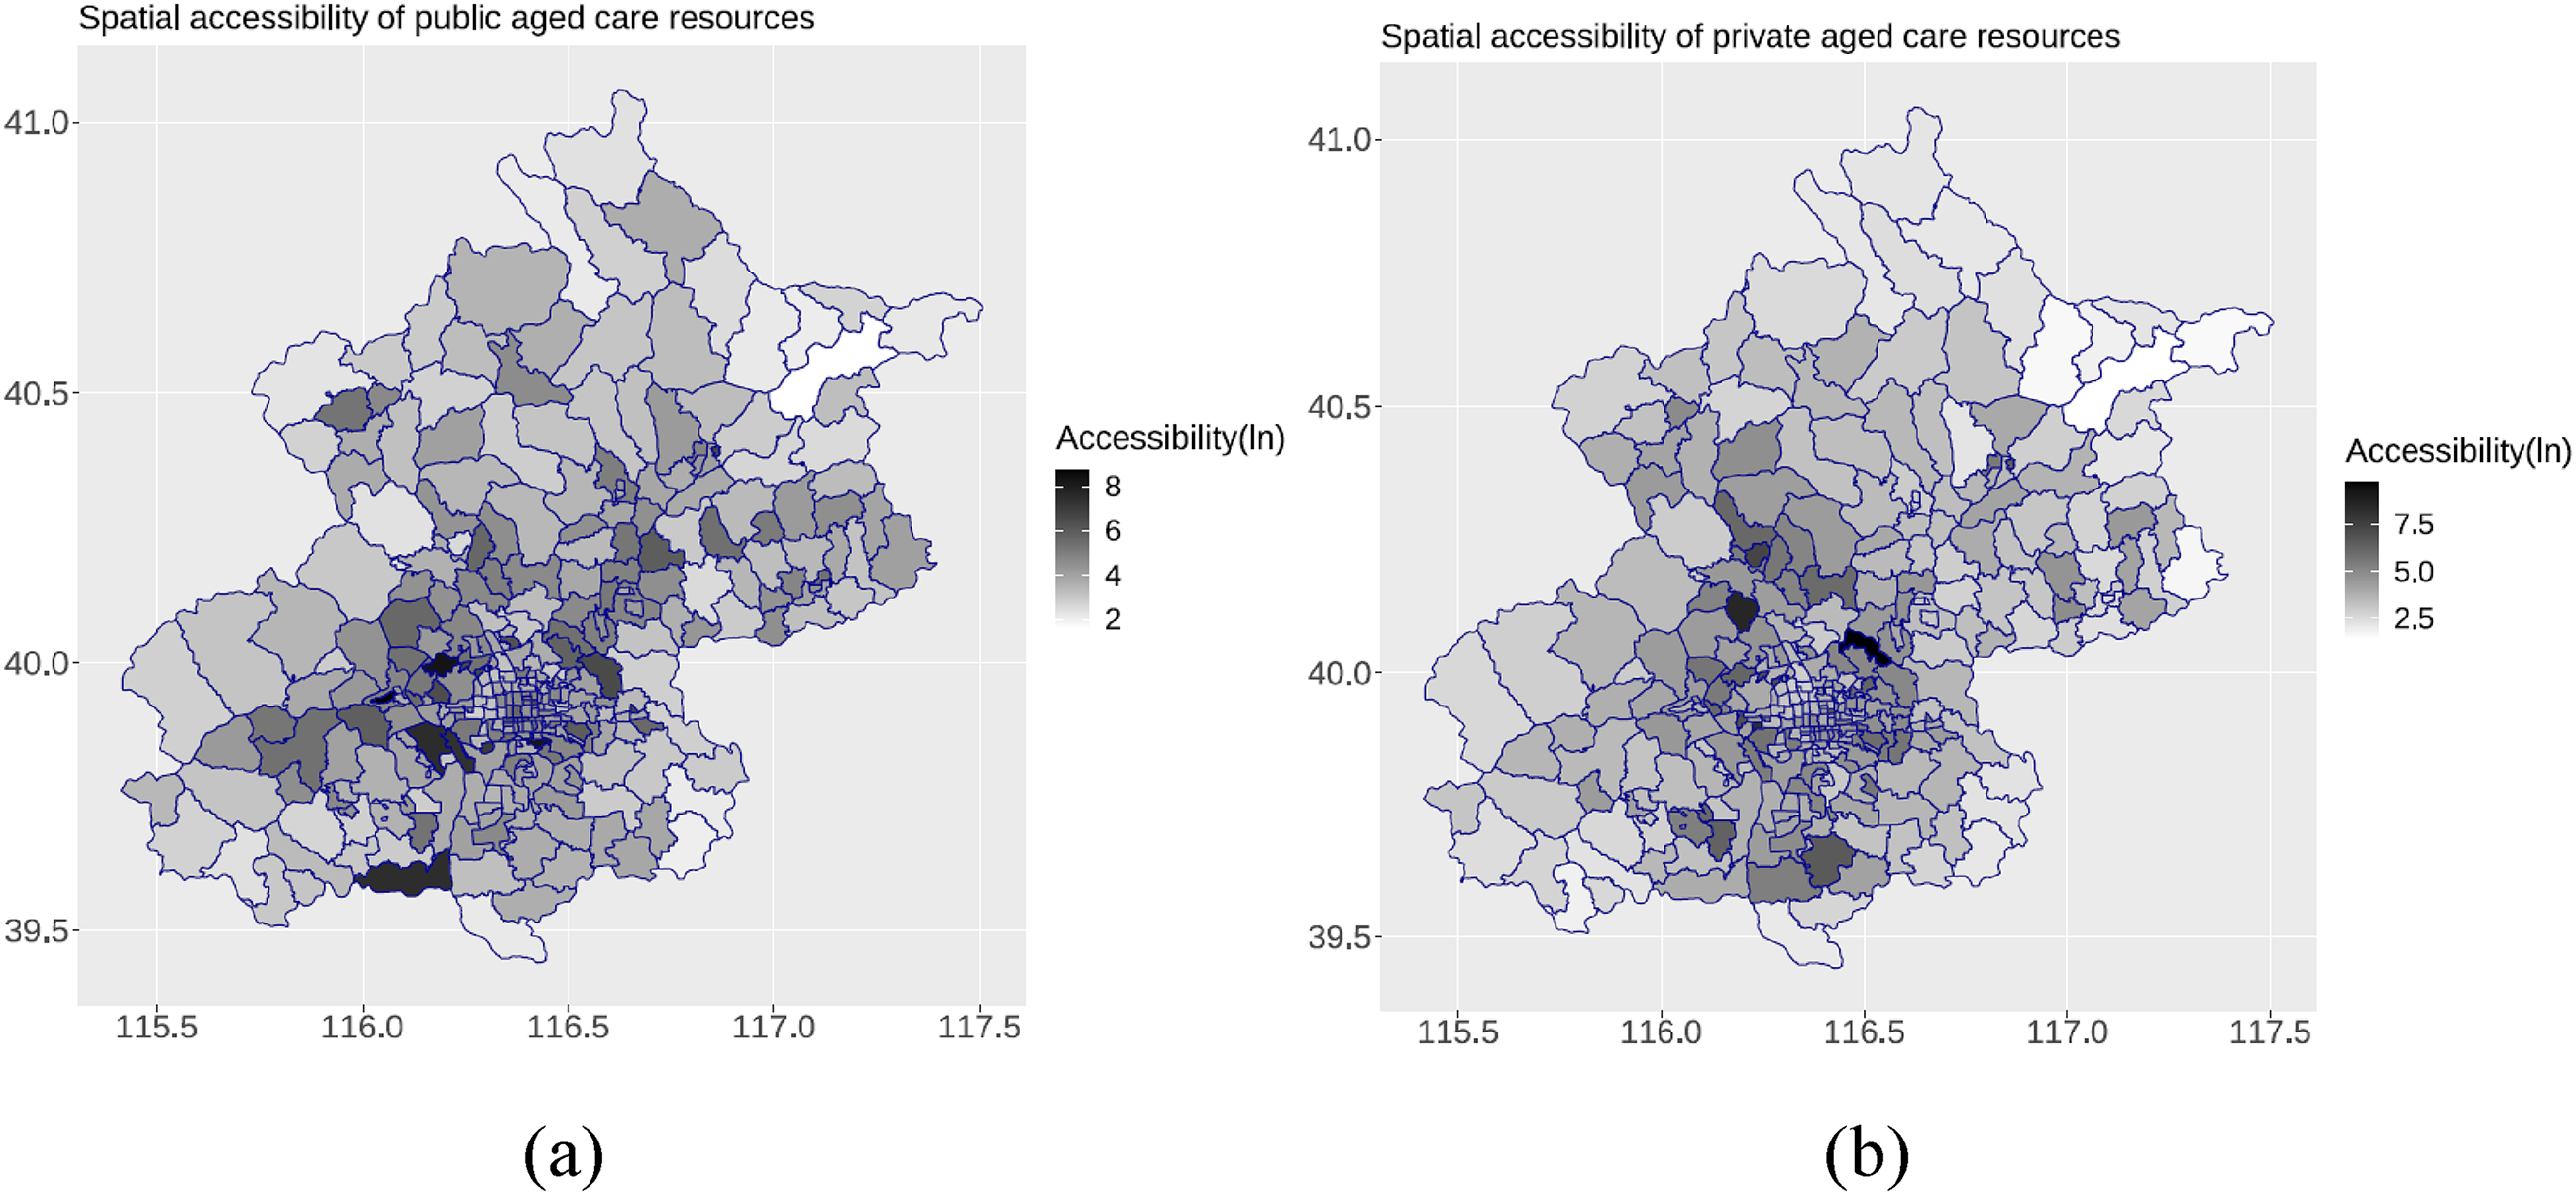
Spatial accessibility analysis of aged care beds at township/street level.
Spatial regression analysis
The Moran's I index 18 at the township/street level is calculated to be 0.0732 (p < 0.01) and 0.0899 (p < 0.01) for the number of public and private aged care beds respectively. However, at the township/street level, the number of beds aggregated from aged care institutions is not normally distributed (right-skewed), suffers from over-dispersion, and has a large number of zero values (20.8% for public and 52.5% for private 19 ), and cannot be log-transformed like the institutions’ data. 20 Therefore, there is a bias in the calculation of spatial autocorrelation in the global or local area. 21 It is also difficult to use common spatial lagged/error regression models or negative binomial distribution regression models without spatial effects to model them, as many previous studies have done. In fact, these models are misleading and statistical validity is not guaranteed (Figures 5 and 6). 22
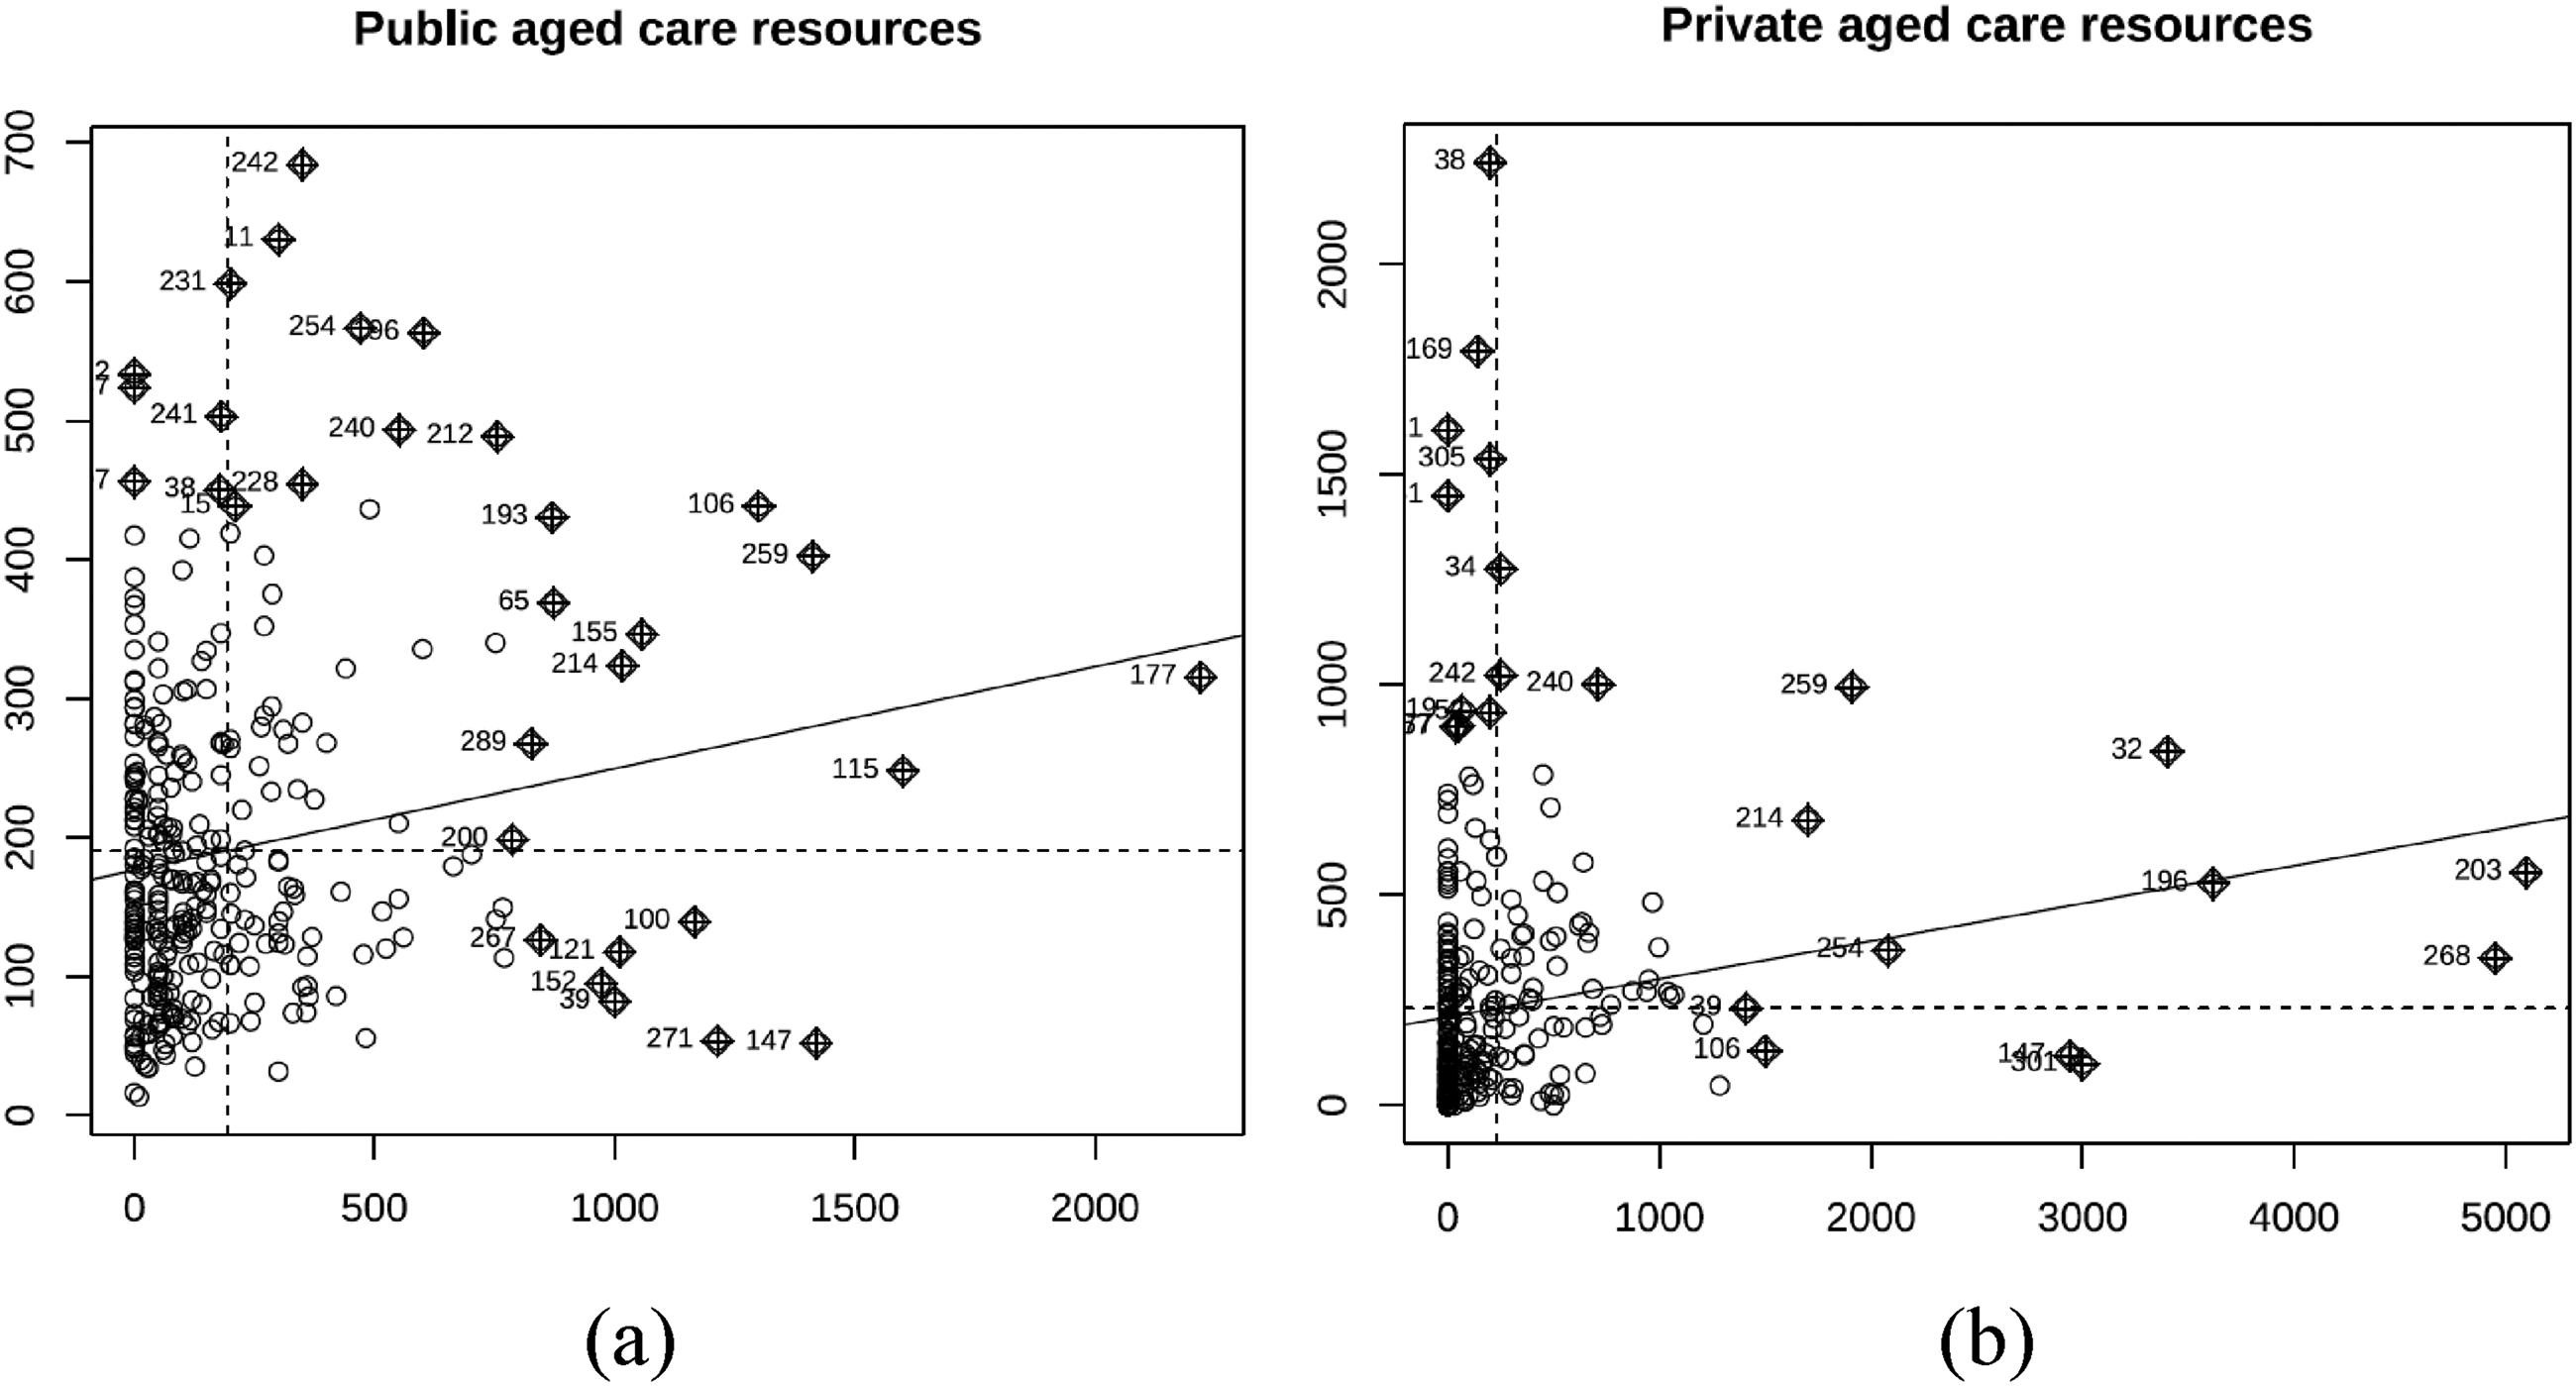
Spatial autocorrelation scatterplot of the number of aged care resources at township/street level.
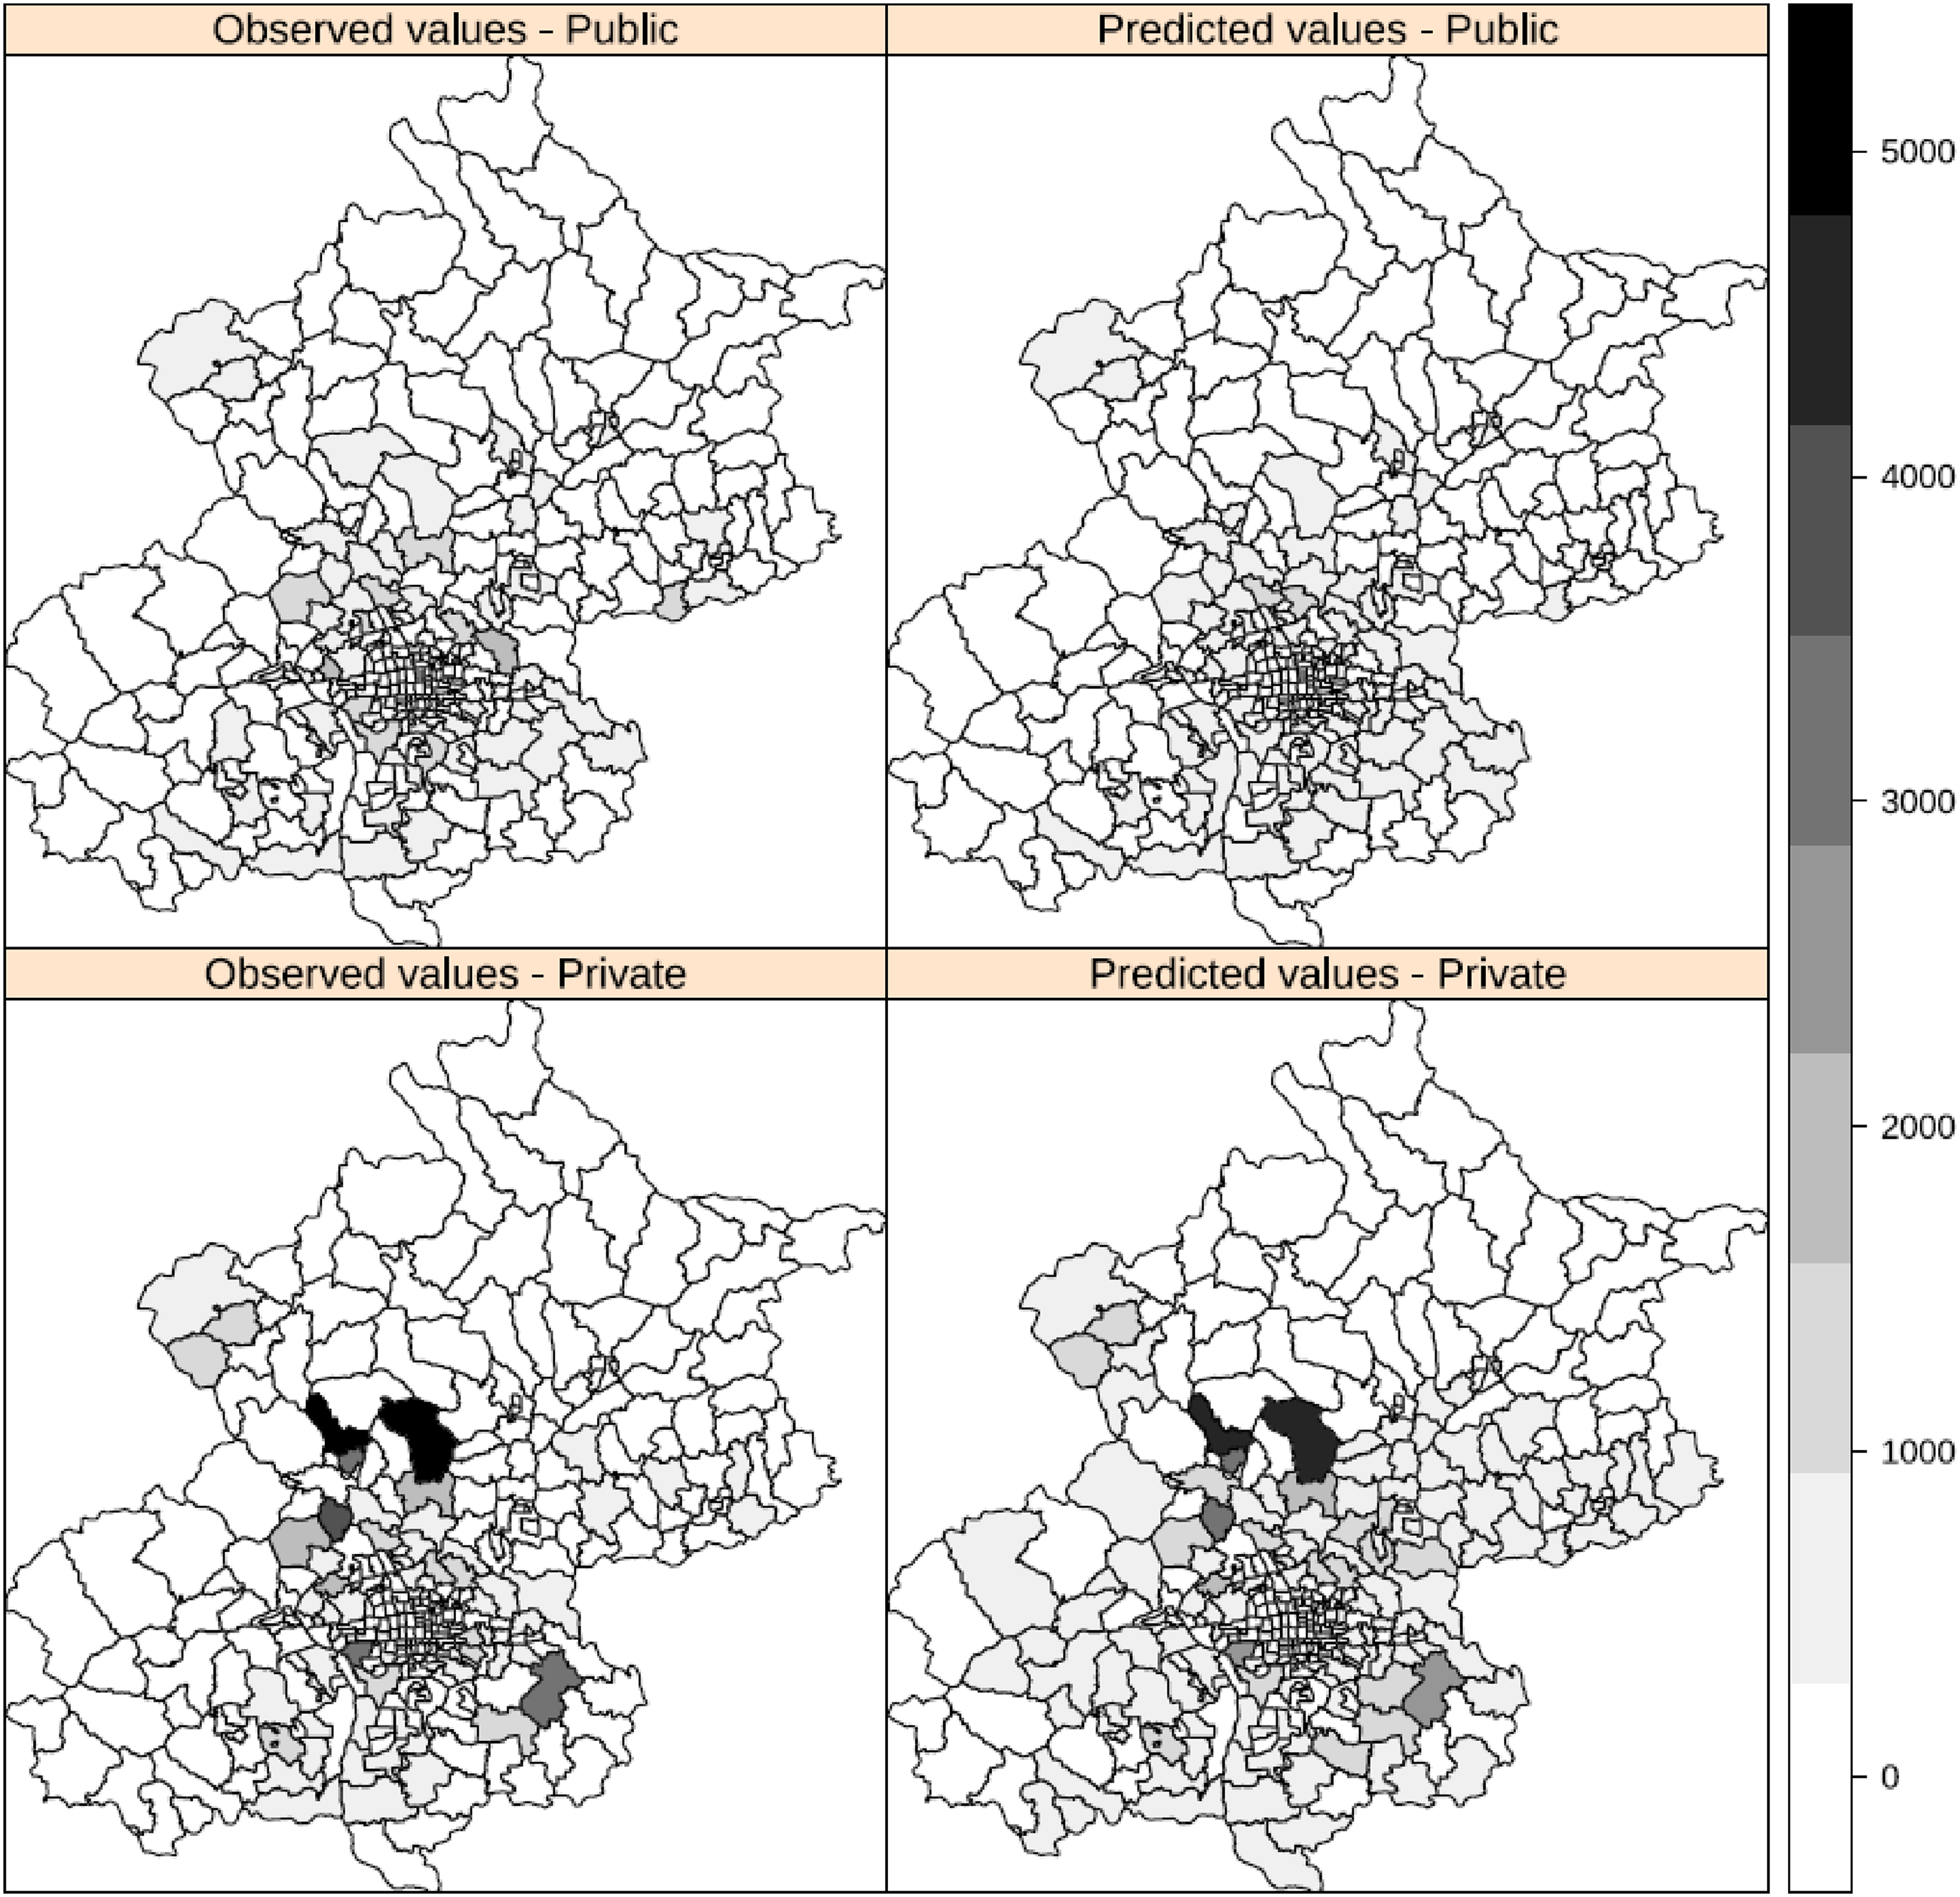
Distribution of township/street aged care resources based on spatial Bayesian model fit (spatial lag model; SLM).
Given the above characteristics of the data, spatial regression analysis cannot be carried out using simple SLM and SEM. Based on a Bayesian approach and implemented in the R-INLA package, this study adopts a zero-inflated negative binomial distribution model (Type-0 ZINB) 23 with spatially structured random effects. 24 INLA (integrated nested Laplace approximation) is a new tool for Bayesian inference based on the latent Gaussian model, created by Rue et al. (2009). The method combines Laplace approximations and numerical integration algorithms, and is more efficient than the Markov chain Monte Carlo method (MCMC). In this analysis, spatial random effects were fitted by SLM (Gómez-Rubio et al., 2021) and BYM (Besag et al., 1991) models, respectively. These models treat spatial dependency as a random effect, and the SLM contains a spatial lagged outcome variable that can characterize the spatial spillover/diffusion effect. 25 BYM is the most widely used spatial model and is characterized by splitting the random effects into spatial autocorrelation variance (i.e. spatial proximity/clustering effect, conditional autoregressive [CAR] model) and non-spatial structural variance. 26
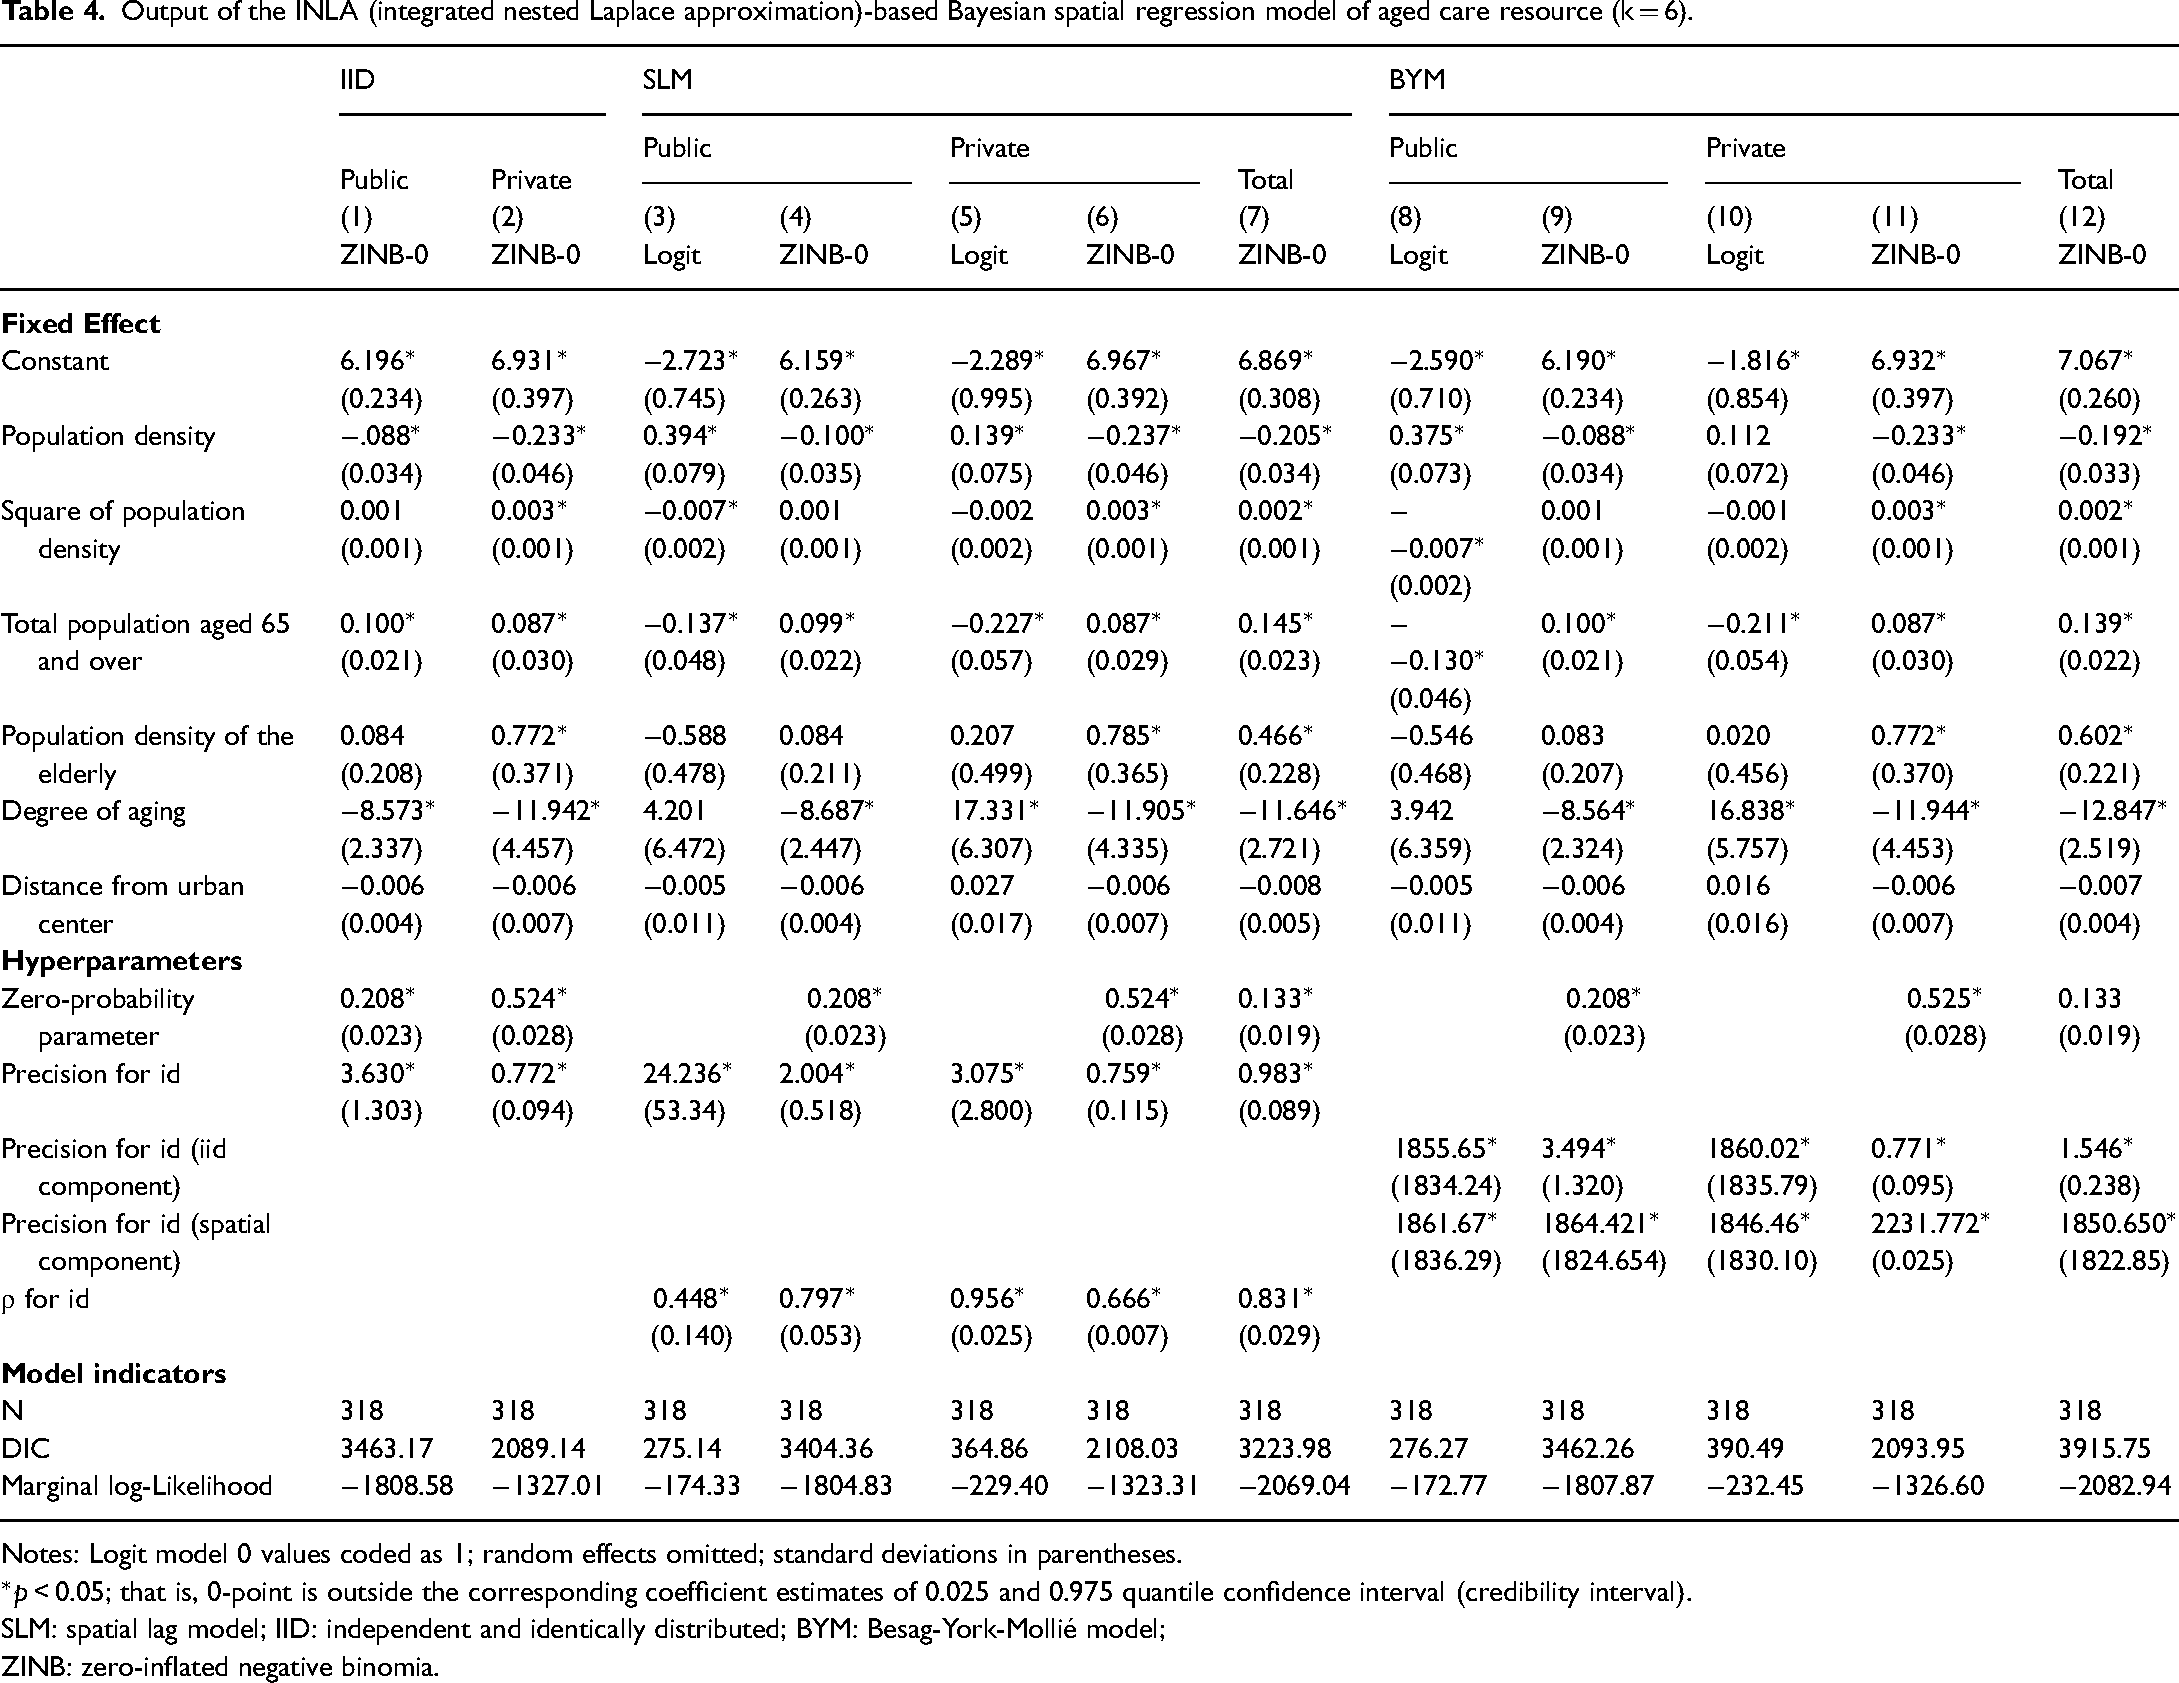
Table 4 gives the fixed effect point estimates (posterior means), hyperparameters, and model-related indicators for each model based on Bayesian estimation.
Output of the INLA (integrated nested Laplace approximation)-based Bayesian spatial regression model of aged care resource (k = 6).
Notes: Logit model 0 values coded as 1; random effects omitted; standard deviations in parentheses.
*p < 0.05; that is, 0-point is outside the corresponding coefficient estimates of 0.025 and 0.975 quantile confidence interval (credibility interval).
SLM: spatial lag model; IID: independent and identically distributed; BYM: Besag-York-Mollié model;
ZINB: zero-inflated negative binomia.
Combining the outputs of the models, several findings emerge as follows:
1. It is worth noting that in the Besag-York-Mollié (BYM) model without covariates, the proportion of spatial component variance in the random effects of public aged care resources is 69.3%, which drops to 0.464% after the inclusion of the above-mentioned covariates; for private ones, the value is 0.083%, which is 0.097% after the inclusion of covariates. 27 Based on this result, there is no spatial error effect at the township/street level for private aged care resources as a whole based on this model; the spatial error correlation for public aged care resources also largely disappears after the inclusion of the observed covariates. 28 It is for this reason that the covariates fully model the error dependence and there is no need to consider the spatial error effect. 29
Overall, when combined with the output of the SLM model, the spatial dependence of township/street (public) aged care resources is mainly embodied as a spatial lag effect rather than a spatial error effect, controlling for the relevant variables, and the results should be interpreted primarily with reference to the SLM model. 30 The SLM model is also better than the Besag-York-Mollié (BYM) and IID (independent and identically distributed) models in terms of the fitted indicator deviance information criterion (DIC). Because of this, a comparison of the coefficients of the fixed effects components of the different models shows that the BYM model is very close to the IID model estimates (including the standard errors of the coefficients), but there is a degree of bias in some coefficient estimates compared to the SLM model. 31
2. Based on a Bayesian approach, the SLM outputs a marginal posterior distribution of spatially lagged coefficients (ρ values), providing an alternative indicator for measuring the level of spatial autocorrelation. 32 The aim of Bayesian estimation is not to find a single “best” value for the model parameters, but to treat the unknown parameters as random variables, and it is the posterior distribution of the model parameters that needs to be determined. For the SLM model based on the INLA package definition (see Gómez-Rubio et al., 2021), after rescaling from the internal scale to the model scale, the posterior means of the ρ coefficients in models (4) and (6) for public and private aged care resources is 0.3168 (SD = 0.1774) and −0.1235 (SD = 0.2340) respectively (see Figure 7 for the marginal posterior distribution). As can be judged based on whether the confidence interval crosses zero, the coefficients of ρ is statistically significant for public aged care resources at the significance taken at the 0.1 level, while it is not significant overall for private ones. 33
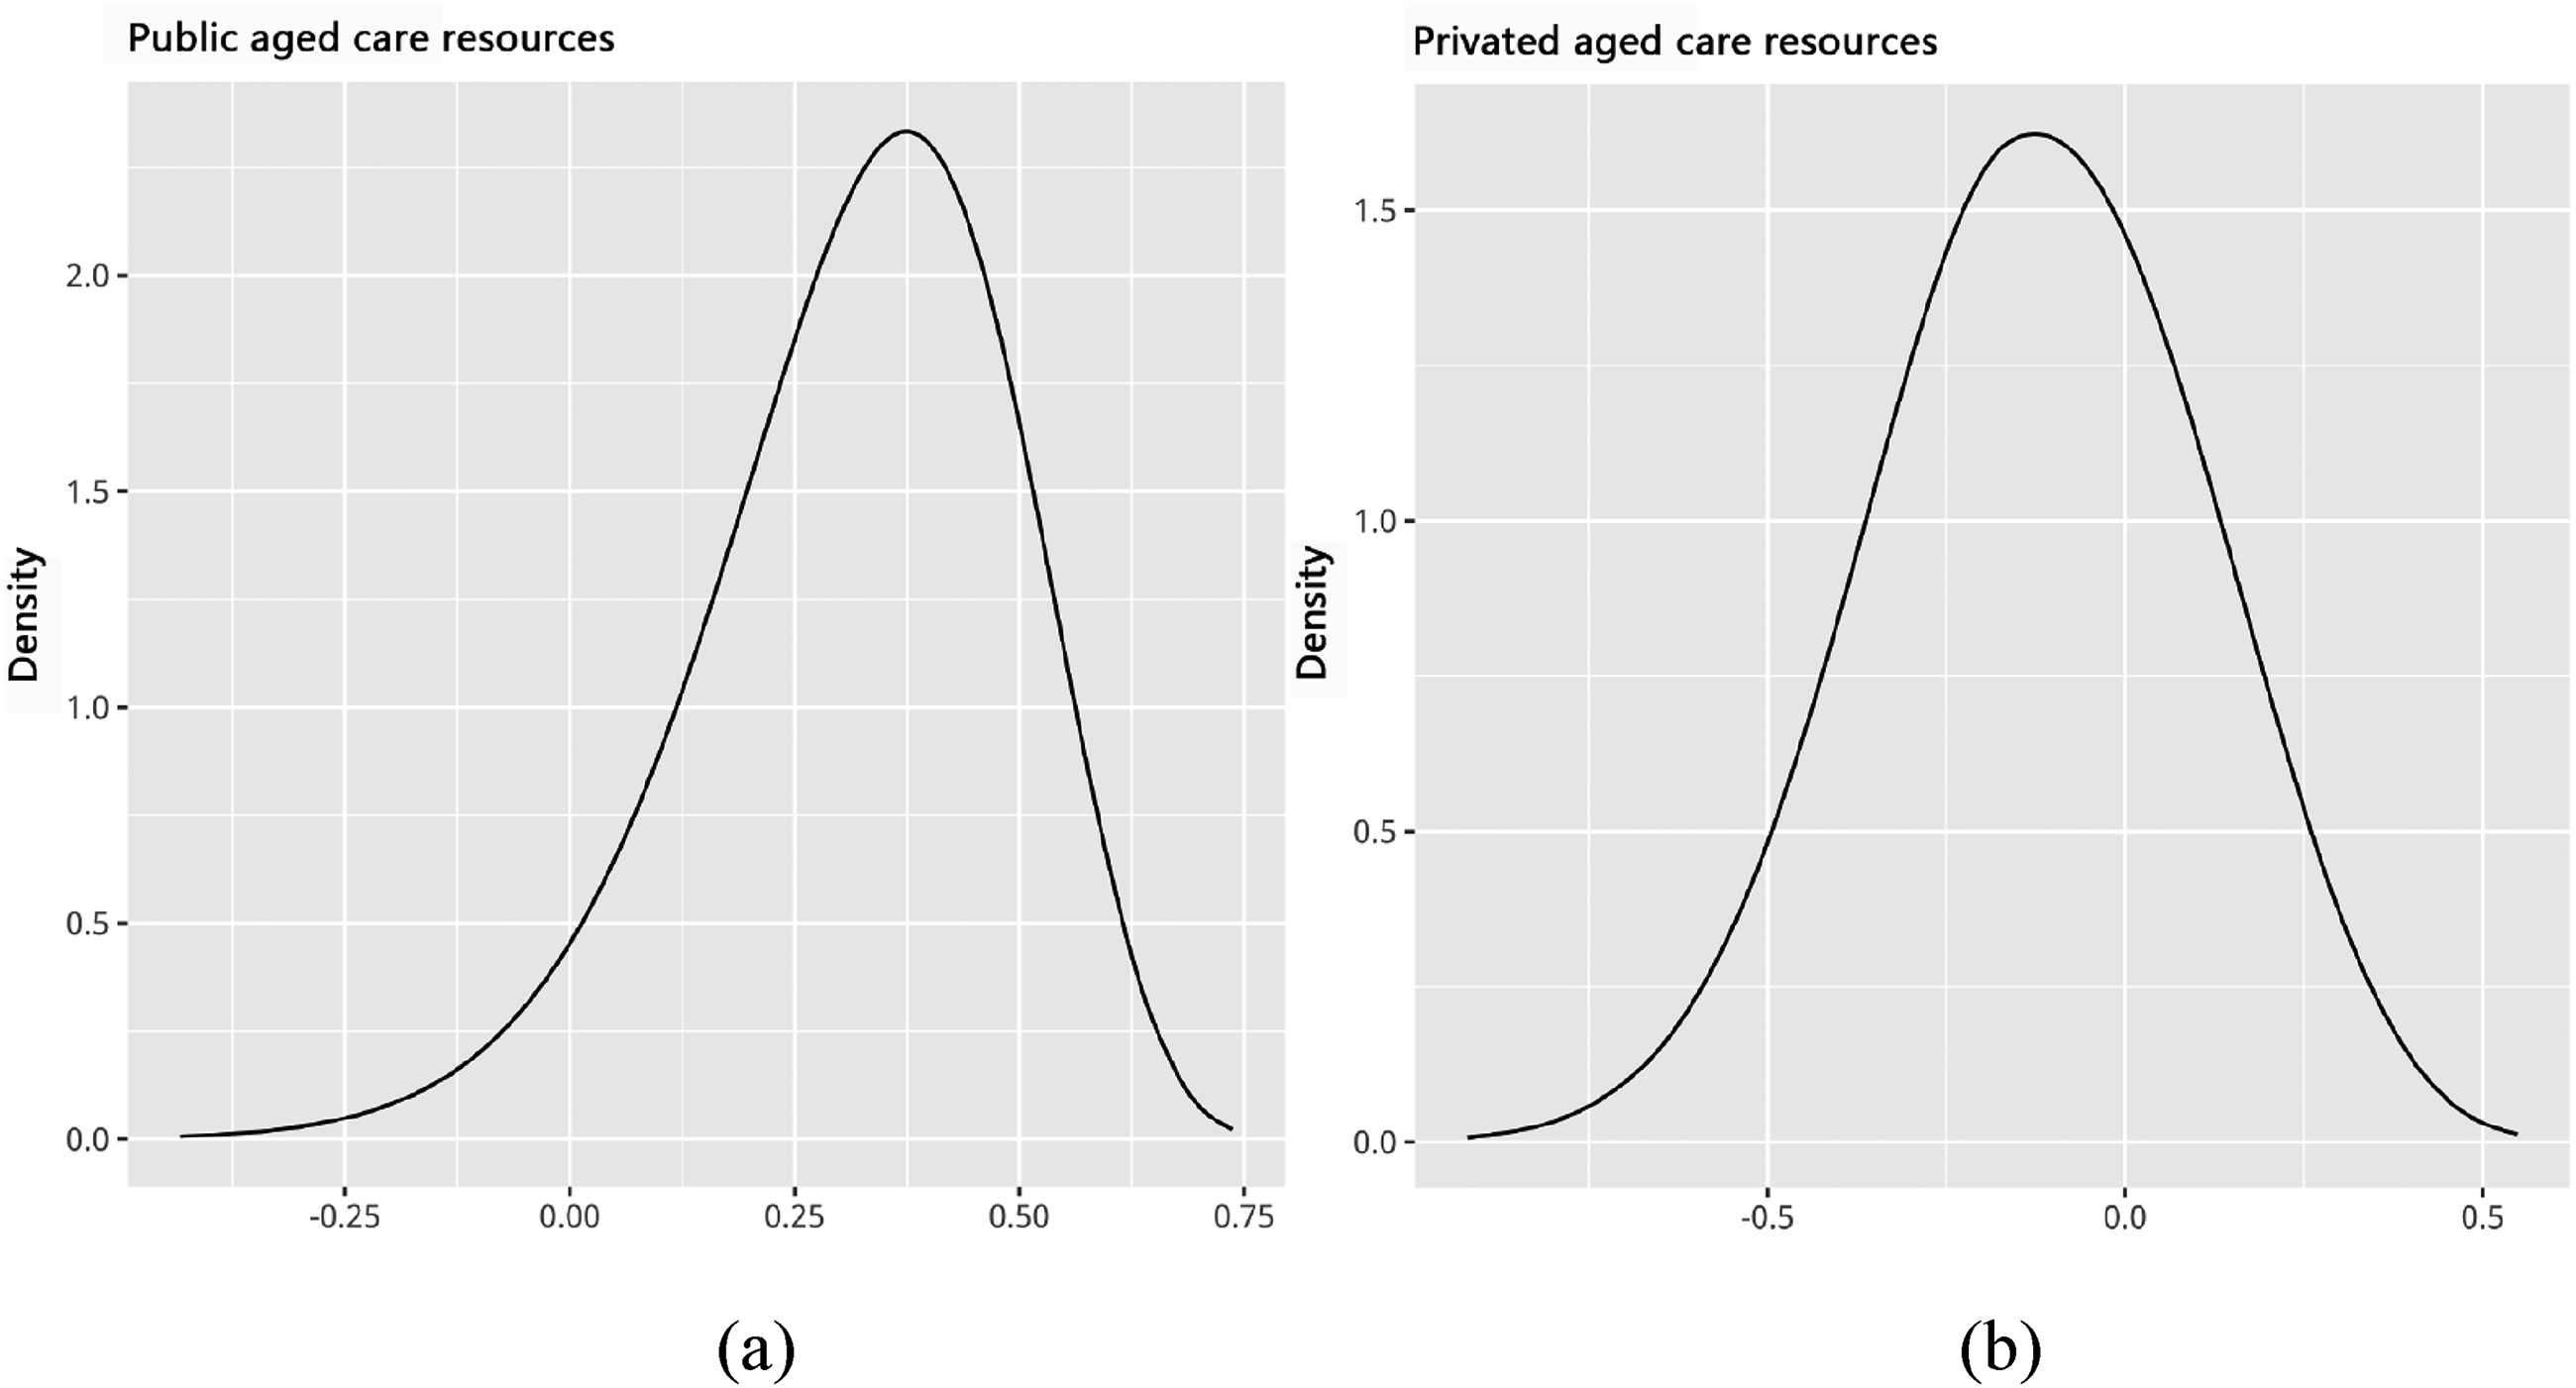
Posterior marginal distribution of the spatial lag ρ coefficient.
In the SLM model without covariates, the marginal posterior means (ρ values) of the spatial lagged effect of public and private aged care resources was 0.4617 (SD = 0.0923) and 0.4793 (SD = 0.1886) respectively, both of which were statistically significant at the 0.05 level. 34 In contrast, after controlling the relevant factors by including the observation covariates to the model, the posterior mean of ρ values for public aged care resources decreased only slightly, while that one for private aged care resources turns negative, and was no longer significant in the overall. In fact, this is mainly due to the demographic-spatial factors included in the model, such as the tendency for private aged care resources to be concentrated relatively in the areas with high elderly population densities. However, this is not actually an effect of spatial diffusion or demonstration. The allocation of public aged care resources is less of a consideration these factors. After controlling for relevant demographic-spatial factors, there is still a significant spatial spillover effect, although some of the “spurious” components is also excluded as the result. Conversely, this means that there is a real spatial spillover or diffusion effect for public aged care resources. At least based on the current model and data, the existing covariates cannot fully model the spatial dependence, and lagged effects between different spatial units need to be taken into account. Since most previous studies (e.g. Gao et al., 2010; Ma and Gu, 2015) are based on public facilities as a whole and do not distinguish between two types of ownership, the conclusion of positive global spatial autocorrelation is somewhat conflated.
Given the large heterogeneity of aged care resources at the township/street level, it is particularly important to examine the corresponding hyperparametric (marginal) posterior distribution. The results indicate that at the township/street level, the regional distribution of public aged care resources shows more scale convergence, and the posterior mean of the spatial lag effect (ρ) is more likely to fall into the positive interval and is statistically significant; the ρ values of private aged care resources are statistically insignificant in the overall, presenting positive or negative spatial dependence simultaneously, and are more likely to fall into the negative interval. The differentiated spatial patterns are shaped by the different institutional factors behind them. In a relative sense, the former are mainly influenced by regional homogenizing administrative forces or equalizing public policies, and thus has a positive spatial relationship with each other, which remains robust even after controlling for demographic factors; for the latter, without demographic factors, the ρ values of private aged care resources exceed those of public aged care resources, but after taking demographic factors into account, the ρ values turn from positive to negative, although statistically insignificant. Combined with other model outputs, this suggests that the spatial layout of private aged care resources at the township/street level is more determined by the target population (or factors related to it) and that spatial interactions are not statistically significant. In more detail, this subtle relationship of “being neither close nor distant” is a manifestation of the spatial pattern of the two trends of agglomeration and competition (both are market mechanisms) in the private aged care resources. 35
3. In Bayesian estimation, the precision is the inverse of the variance; that is,
4. Controlling for other variables, at the township/street level, public aged care resources are quadratically related to population density (parabolic opening downwards), which suggests that public aged care resources vary with population density but also flexibly adjust with the density of administrative districts, with some non-coverage in the inner city and distant suburban areas (accounting for 20.8%). For private aged care resources, the quadratic term is statistically insignificant and the primary term is positive, indicating that in terms of coverage or not, private aged care resources closely follow population density and are more likely to be located in areas of high population density. Thus, overall, the above distribution pattern of public and private aged care resources somewhat supports the claim that private aged care resources serve as an effective complement to public ones, and, in other words, reflect a certain complementary relationship between two types of aged care resources in their spatial structure.
The point pattern also shows that private aged care institutions are more distributed in inner cities, but the scale is small (see Figure 2(d)). In terms of the number of beds, at the street/township level, private aged care resources are quadratically related to population density (parabolic opening upwards), indicating that they are more likely to be located in peri-urban areas, though also distributed in certain hotspots in inner cities and distant suburbs. For public aged care resources, the quadratic term for population density is statistically insignificant and the primary term is negative. This can be explained in two ways: on the one hand, in the direction from outward to inward, public aged care resources do not increase with an increase in population density, but rather decrease, or there will be an undersupply of beds in inner cities; on the other hand, in the direction from inward to outward, they do not decrease with a decrease in population density, and there is some allocation in low population density areas, especially in distant suburban areas. The two aspects are consistent in mechanism, reflecting the role of administrative forces rather than market forces.
If population density is used as a proxy for the core–fringe structure of regional space, this result implies that, in practice, the spatial layout of public aged care resources is determined by administrative factors and, although it tends to be balanced and equitable overall, it is not effectively tailored locally to the actual needs of different regional populations. In reality, it is a reflection of the “dualistic structure” of public aged care resources; that is, the coexistence of the underutilization of beds in distant suburbs and the undersupply of beds in inner cities (Wang, 2017). The opposite is true for private aged care resources, the layout of which is more sensitive to the intensity indicators of the target population. In practical terms, at the street/township level, the focus of the distribution of private aged care resources in suburban areas is a strategy of relative proximity to the target population, constrained by other realistic factors (e.g. differential land rent). This also reflects the role of market mechanisms.
5. Controlling for lagged effects can lead to more accurate estimates of the coefficients of explanatory variables in the spatial model. After the models incorporate variables such as the population density of the township/street in which aged care resources are located, the relationship between public/private aged care resources and the number of elderly people in the corresponding region is significantly positive, indicating that the number of beds of aged care institutions is positively proportional to the total number of elderly people in the region, regulated either by planning policies or by market mechanisms.
6. From the overall models – that is, models (7) and (12) – the effect of socio-demographic spatial factors on the distribution of aged care resources can be confounded if no distinction is made between two types of aged care institutions. For example, the overall model shows a statistically significant relationship between localized elderly population density and the number of aged care beds, but in reality this relationship only holds for private care resources. This implies that because of being more subject to the role of market mechanisms, private aged care resources are sensitive to regional indicators of elderly population intensity, whereas public ones lack this sort of sensitivity. Hypotheses 1(b) and 2(b) therefore hold.
7. As mentioned earlier, the level of aging in Beijing shows a pattern of higher levels in the central city and the distant suburbs. From model (1), the relationship between the distribution of the presence or absence of public aged care resources and the level of aging at regional level is not statistically significant. In contrast, the distribution of private aged care resources shows a stronger negative relationship with the level of local aging, implying that they are more likely not to be located in central urban areas and distant suburban areas with high levels of aging. In contrast, public aged care resources are more likely to be located in such areas, although overall public aged care resources also show a negative relationship with the level of aging (with relatively less intensity). This means that, in a relative sense, public aged care resources, as a part of basic public services, have a higher equalization effect.
In summary, from a market or service perspective, the distribution of aged care resources depends more on the size and intensity of the elderly population in given spatial units. On the whole, it is not a higher level of aging in a region that results in more resource allocation for the elderly, but rather the total number of elderly people that is a statistically significant variable in determining regional aged care resources for the elderly. Private aged care resources are more sensitive to the intensity of the indicator of elderly population, while the density of the elderly population is also an important influencing factor for their location and layout.
Conclusion and discussion
From a spatial-social theory perspective, space is a materialized social product, a concrete representation of political-economic and social relations (Lefebvre, 1991: 26; Soja, 2010: 196–97). Spatial inequality embodies social inequality (see Lobao et al., 2007: 10). In the context of rapid urban growth and spatial differentiation, urban social policy must pay attention to the principles of spatial justice (Harvey, 1973; Soja, 2010) and maintain a relatively balanced allocation and layout of resources.
Based on the locational theory of public facilities, this paper analyzes and evaluates the spatial distribution characteristics of aged care resources in Beijing, using spatial analysis methods and combining indicators such as coverage rate, Gini coefficient, and accessibility under the control of relevant demographic characteristics. The results show that at the township/street level, public aged care resources are locally homogeneous in scale and show a positive spatial diffusion effect, and the overall distribution is relatively more balanced and close to the goal of equalization; the distribution of private aged care resources is more sensitive to the intensity of the target population, and the spatial diffusion effect is not statistically significant in the overall and the distribution is relatively less balanced, but the supply efficiency is relatively higher and plays an important complementary role to the aged care services. Hypotheses 1(a) and 2(a) therefore are validated in general. The differential results reflect the different dynamics behind them; that is, the location of private facilities is more regulated by market mechanisms, while the distribution of public facilities is mainly driven by uniform administrative forces. The former reflects mainly an efficiency orientation, while the latter is more of an equity orientation. As a whole, the spatial pattern of public facilities is shaped by policies, markets, and other institutions, and cannot be reduced to simply a demographic-spatial process. The institutional factor has a significant moderating effect on the relationship between socio-demographic factors and the spatial distribution of public service resources.
Some scholars (e.g. Mu, 2012) have pointed out that the development of public and private aged care institutions is uneven due to distinct government policies and financial investment. Private aged care institutions are disadvantaged in terms of access to resources and charge higher fees, while public aged care institutions have insufficient effective supply in some areas, which leads to many elderly people with genuine needs being unable to be admitted to them. In fact, public and private institutions play different roles in the allocation of aged care resources. Public institutions are important to balance the allocation of resources, while private institutions can enrich the market supply and are more efficient. In this sense, the government should continue to encourage the development of private institutions, and financially favor them, support the development of outstanding private institutions, subsidize them according to the number of elderly people having been admitted to them, and treat the two types of institutions fairly, so as to improve the efficiency of the supply of aged care resources and to alleviate the current shortage of beds in Beijing.
It must be stressed, however, that the contradictory phenomenon of oversupply and underutilization of aged care beds is actually entwined with spatial factors. According to some surveys, the problems of oversupply of aged care resources in the six inner districts (especially for public aged care resources) and low rate of utilization of aged care institutions in the suburbs coexist in Beijing. On the one hand, elderly people have a traditional preference for aged care in their neighborhoods, 36 and, due to differences in government subsidies, there are many high-quality institutions in the six inner districts, but the problem is that there are serious waiting times and it is difficult for elderly population to obtain senior care beds in their neighborhoods. On the other hand, although the resources of private age care institutions in suburban areas are generally better and their fees are lower than those of equivalent institutions in the city center, the utilization rate is lower due to reasons such as “the location is far from the city and the elderly are reluctant to go there” (Jia et al., 2017). 37 Therefore, taking into account the institutional-spatial factors simultaneously, the relevant government departments should purposefully strengthen various policy guidelines for different types of aged care institutions to balance equity and efficiency, and further optimize the spatial distribution of aged care resources.
Finally, it should be noted that although taking the form of an empirical rather than normative analysis, this study is still conducted within the framework of neoclassical locational theory, mainly considering demographic and spatial factors. To further improve the explanatory power of the model, we still need to include financial revenue and expenditure, differential land rent, transportation costs, residents’ income, and other related factors. Just as Dear (1978) said, “spatial outcomes must seek their explanations in the wider social context”. It is necessary to consider the choice preferences at the target population or community level, with more detailed indicators (e.g. accessibility considering road network density) and optimization algorithms for in-depth analysis and evaluation based on available data support. In addition, from a practical point of view, this study is limited to Beijing; however, due to policies such as the developmental planning of Beijing–Tianjin–Hebei integration, industrial transfer, and population deconcentration, the city has even introduced policies to encourage aged care institutions and elderly people with aged care needs to move to neighboring cities. Further research should also take this point into account, and monitor the dynamic spatial distribution of aged care institutions and evaluate the effects of the implementation of relevant policies.
Footnotes
Acknowledgments
This study has been assisted by Ze Liu, Fang Liu, Dezhu Gui, Xindong He, Lin Xiao, Jierong Hu, and Weihe Guo. The authors would like to thank Huashan Chen and Xiulin Sun for their suggestions on earlier versions of this paper, and we thank a number of anonymous reviewers for their valuable comments. We thank the editors for their meticulous work. The responsibility for this paper rests with the authors.
Contributorship
Xiangyang Bi is the designer and principal of the project, responsible for data crawling code writing, final model construction, paper writing and finalization. Mo Li is responsible for data cleaning and preliminary analysis, sorting out some literature, completing the writing of the early version of the paper, and assisting in the final version of the paper revision. Both authors read and agreed on the final text.
Declaration of conflicting interests
The authors declared no potential conflicts of interest with respect to the research, authorship, and/or publication of this article.
Funding
The authors received no financial support for the research, authorship, and/or publication of this article.