



Abstract
Background:
Transgender youth in the United States are at increased risk for obesity and type 2 diabetes compared with their cisgender peers due to diverse factors including minority stress, stigma, and limited knowledge regarding effective care. Given myriad factors limiting affirming weight-related care, research is needed on health behaviors of transgender youth to provide insight into their experiences and inform novel approaches to care.
Methods:
Data from the 2017 and 2019 Youth Risk Behavior Surveillance Survey were used to explore the health behaviors of transgender youth with obesity (TYO) and without obesity (TYNO) and cisgender youth with obesity (CYO) and without obesity. Differences by racial and ethnic identity were considered. The study sample included 2561 transgender youths and 21,146 cisgender youths with obesity from 15 US states.
Results:
Transgender youth had a higher rate of obesity than their cisgender peers. Few significant differences were observed when comparing health behaviors of TYO and TYNO and CYO. Describing self as overweight was the only variable that was consistently significant across comparisons. Transgender youth of all racial/ethnic identities except Other were significantly likely to endorse sleeping <6 hours a night. Health behaviors did not consistently explain obesity status. Race/ethnicity was not significant for any comparison.
Conclusions:
Results of this study indicated race, ethnicity, and health behaviors did not explain differences in obesity rates for transgender and cisgender youth. Future research is needed to understand factors contributing to the increased risk of obesity in transgender youth.
Introduction
Obesity remains a public health crisis for youth. Recent prevalence studies have found that 17% of youths aged 10–17 meet criteria for obesity, defined as having a body mass index (BMI) at or above the 95th percentile. 1 Significant racial disparities exist, with 22% of Black and Hispanic children having obesity versus 9.6% of non-Hispanic Asian children and 13.1% of non-Hispanic White children. 2 Data from the Centers for Disease Control and Prevention (CDC) found that rates of obesity have tripled in children and adolescents since the 1970s, most dramatically in Hispanic and Black youth. 3 The etiology of childhood obesity is complex and multifactorial. Factors such as genetics, food insecurity, poor sleep hygiene, socioeconomic status, and a less advantageous built environment have all been shown to impact the probability of having obesity.4–8 These factors can increase lifestyle behaviors that contribute to weight gain, including decreased consumption of nutrient-dense foods and limited physical activity. 7
Living with obesity also increases the likelihood of developing metabolic disease, including type 2 diabetes (T2D), 9 possibly due to their common risk factors: being inactive, insufficient sleep, residing in a less walkable area, and having a diet high in sugar-sweetened drinks and processed foods.8,10 Rates of youth-onset T2D are projected to increase by over 600% between 2017 and 2060. 11 Researchers expect racial and ethnic disparities to increase as well, with Indigenous communities and youth of color already disproportionally impacted by T2D.10,11
Although rates of obesity in transgender youth are unknown, it is possible that rates of obesity in transgender youth are higher than cisgender youth given social and medical factors. It is estimated that 1.4% of youth aged 13–17 in the United States (about 300,000) identify as transgender. 12 Many transgender youth are navigating unsupportive home and school environments where they may be targeted on the basis of their gender identity and/or gender expression. 13 Transgender youth report higher rates of anxiety, depression, nonsuicidal self-injury, and disordered eating behaviors compared with their cisgender peers. 14 Gender-related minority stress may increase the risk of developing T2D for transgender individuals.10,15–18 The gender minority stress model identifies distal (external and environmental) and proximal stressors (internal), as ways through which transgender youth may experience poor medical and psychosocial outcomes such as obesity.10,15–19 Minority stress may also be associated with, and contribute to, obesity and disordered eating behaviors.20–22 Additionally, research on transgender adults receiving gender affirming hormone therapy notes increases in BMI and insulin resistance, especially among transgender women.15,16
While research has begun to examine factors leading to increased obesity in transgender youth,20,21 questions regarding intervenable behaviors remain. As such, the goal of this study was to document the health status and behaviors of transgender youth with obesity (TYO) and without obesity (TYNO) and compare them with cisgender youth with obesity (CYO). It was hypothesized that TYO would describe weight, eating, and activity behaviors that increase the risk of obesity.
Methods
This study uses data from the 2017 and 2019 CDC Youth Risk Behavior Surveillance Survey (YRBSS).23,24 The YRBSS surveys a representative sample of 9th–12th graders in the United States and is administered every 2 years to collect data on health risk factors. 25 Please refer to the CDC’s YRBSS website for more detailed information on methods, including handling of missing data, and for the data used in this study. The YRBSS receives institutional review approval from the CDC, and the data are publicly available.
Participants
The present study focuses on students under the age of 18 who identified as cisgender and met criteria for obesity, and those who identified as transgender regardless of obesity status. Only 15 states asked about gender identity on the 2017 or 2019 YRBSS.26,27 Gender identity was assessed using one item that asked: “Some people describe themselves as transgender when their sex at birth does not match the way they think or feel about their gender. Are you transgender?” Students who responded with “Yes, I am transgender” were included in the transgender student sample. The analytic sample was comprised of 2561 transgender students with and without obesity and 21,146 cisgender students with obesity.
Data Variables
The YRBSS assesses six categories of health risk factors. The domains of unhealthy dietary behavior and physical inactivity were the focus of this study. Obesity status was determined through BMI percentile calculated using self-reported height (“How tall are you without your shoes on?”) and weight (“How much do you weigh without your shoes on?”). Those with a BMI percentile at or above the 95th percentile were classified as having obesity. 26 BMI information referenced sex assigned at birth. Additional self-reported demographic data included age, sex assigned at birth, grade level, and racial/ethnic identities.
Analytic Plan
All data analyses were conducted using SPSS Version 29. 28 A series of linear regressions were initially performed to assess patterns in relation to missing data. All produced significant results, indicating data were not missing completely at random. Closer exploration of missing data revealed near identical patterns in missingness across variables of interest. This suggests there is no significant bias for these variables across these three key groups in terms of missing data.
Two existing variables on obesity status and gender identity were re-coded to identify TYO and TYNO and CYO. A four-level race variable was used given concern with sample sizes. The variable (Other) combines participants identifying as American Indian or Alaska Native, Asian, Native Hawaiian or Other Pacific Islander, or Multiracial. The variable was then transformed using indicator coding to be included in bivariate analyses. The YRBSS sleep variable was re-coded as a dichotomous variable to identify students sleeping 6+ hours a night on school nights to identify those at significant risk for sleep deprivation.8,29–31 Data from nine questions on health behaviors encompassing weight, dietary habits, physical activity, sleep, and screen time were selected for analysis given prior research indicating they may contribute to obesity.1,5–7,10,20–23,29,30 An additional variable, respondent’s self-perception of weight, was included given the intersection of weight perception, body shape, and disordered eating in transgender populations and in adolescents.32–34 All variables of interest are provided in Supplementary Materials. Chi-square tests of independence were conducted to identify significant relationships with health factors between TYO and TYNO and between TYO and CYO. Binary logistic regressions were performed to compare engagement in healthy behaviors and differences in weight self-perception between different racial/ethnic groups of TYO and TYNO and between different racial/ethnic groups of TYO and CYO.
p Value Adjustments
To ameliorate concerns for Type I error, p values were corrected for multiple comparisons within each group using the post hoc Bonferroni adjustment. Chi-square analyses (10 comparisons) have a p value of 0.005. Logistic regressions (eight comparisons per variable) have a p value of 0.006.
Results
Sample and Demographics
Transgender sample
The sample included 2561 transgender youth (1.2% of YRBSS respondents). About 20% (493) of the 2561 transgender youth met criteria for obesity. A majority of transgender youth identified as White (n = 228, 49% of TYO; n = 1000, 50.2% of TYNO) and were in the 10th grade (n = 141, 29.1% of TYO; n = 596, 29.3% of TYNO). Just over 15% (15.6%) of TYNO identified as Hispanic or Latino (n = 310) compared with 18.5% of TYO (n = 86). A majority of transgender youth were assigned male at birth (n = 298, 60.4% of TYO; n = 1,142, 55.2% of TYNO) and had an average age of 15.5 years, whereas TYNO had an average age of 15.6 years.
Cisgender sample
Of the 207,564 cisgender youth, 21,146 (10.2%) met criteria for obesity and were included in the study. Most (51.8%) CYO identified as White (n = 10,697) and 15.6% as Hispanic/Latino (n = 3230). A majority of CYO were in the 9th grade (n = 6156, 29.3%) and had a mean age of 15.6 years. Almost 60% (59.4%) of CYO were assigned male at birth (n = 12,620). Demographic data are provided in Table A1 in the Appendix.
Chi-Square Analyses
Gender and demographics
Chi-square tests of independence were performed to analyze relationships between demographics of TYO, TYNO, and CYO; gender and each demographic category were compared. All were statistically significant except for race/ethnicity (see Supplementary Table S1).
Gender and health variables
Chi-square tests of independence were performed to analyze relationships between gender (TYO, TYNO, and CYO) and each health variable of interest. Results were statistically significant for each comparison except for eating green salad (see Supplementary Table S2).
TYO, TYNO, and health variables
Rates of endorsement in selected health behaviors were compared for TYO and TYNO. Sixty one percent of TYO and 23% of TYNO described themselves as overweight (x2 (1, n = 2014) = 212.896, p < 0.001). A slight majority (55%) of TYO endorsed sleeping 6 or more hours a night on school nights, as did 47% of TYNO (x2 (1, n = 1061) = 4.553, p ≤ 0.001). About 22% (22.3%) of TYO reported watching television for 3 or more hours a day, as did 14.8% of TYNO (x2 (1, n = 2087) = 13.123, p < 0.001). In terms of soda consumption, 73% of TYO and 64% of TYNO drank soda at least once a week (x2 (1, n = 2056) = 11.440, p < 0.001). Full results are available in Supplementary Table S3.
TYO, CYO, and health behaviors
Rates of engagement in health behaviors of interest were compared for TYO and CYO. A slight majority (60.8%) of TYO described themselves as overweight compared with 81.3% of CYO (x2 (1, n = 16,170) = 97.583, p < 0.001). Roughly half (55%) of TYO endorsed sleeping 6 or more hours a night on school nights, as did 46% of CYO (x2 (1, n = 11,470) = 55.606, p ≤ 0.001). When examining activity behaviors, 82.5% of TYO endorsed not being physically active for at least 60 minutes a day on 5 or more days in the past week compared with 67% of CYO (x2 (df = 1, n = 20,594) = 51.001, p < 0.001). A majority of TYO (78.1%) reported eating fruit at least once a week, as did 84.8% of CYO (x2 (1, n = 20,487) = 16.243, p < 0.001). Full results are available in Supplementary Table S4.
Logistic Regression Analyses
Binary logistic regression analyses were conducted to compare habits of TYO and TYNO, and of TYO and CYO, with racial/ethnic group. Demographic variables (age, grade, and sex assigned at birth) were held constant in all regression analyses.
Described self as overweight
The only variable significant for TYO, TYNO, and CYO of all racial/ethnic identities was describing one’s self as overweight. Comparisons between TYO and CYO of all racial/ethnic identities yielded odds ratios>1, indicating an increased likelihood for TYO to describe themselves as overweight when compared with CYO. Comparisons between TYO and TYNO of all racial/ethnic identities produced odds ratios <1, signifying TYO were less likely to describe themselves as overweight as compared with TYNO (see Table A2 in Appendix).
Sleep
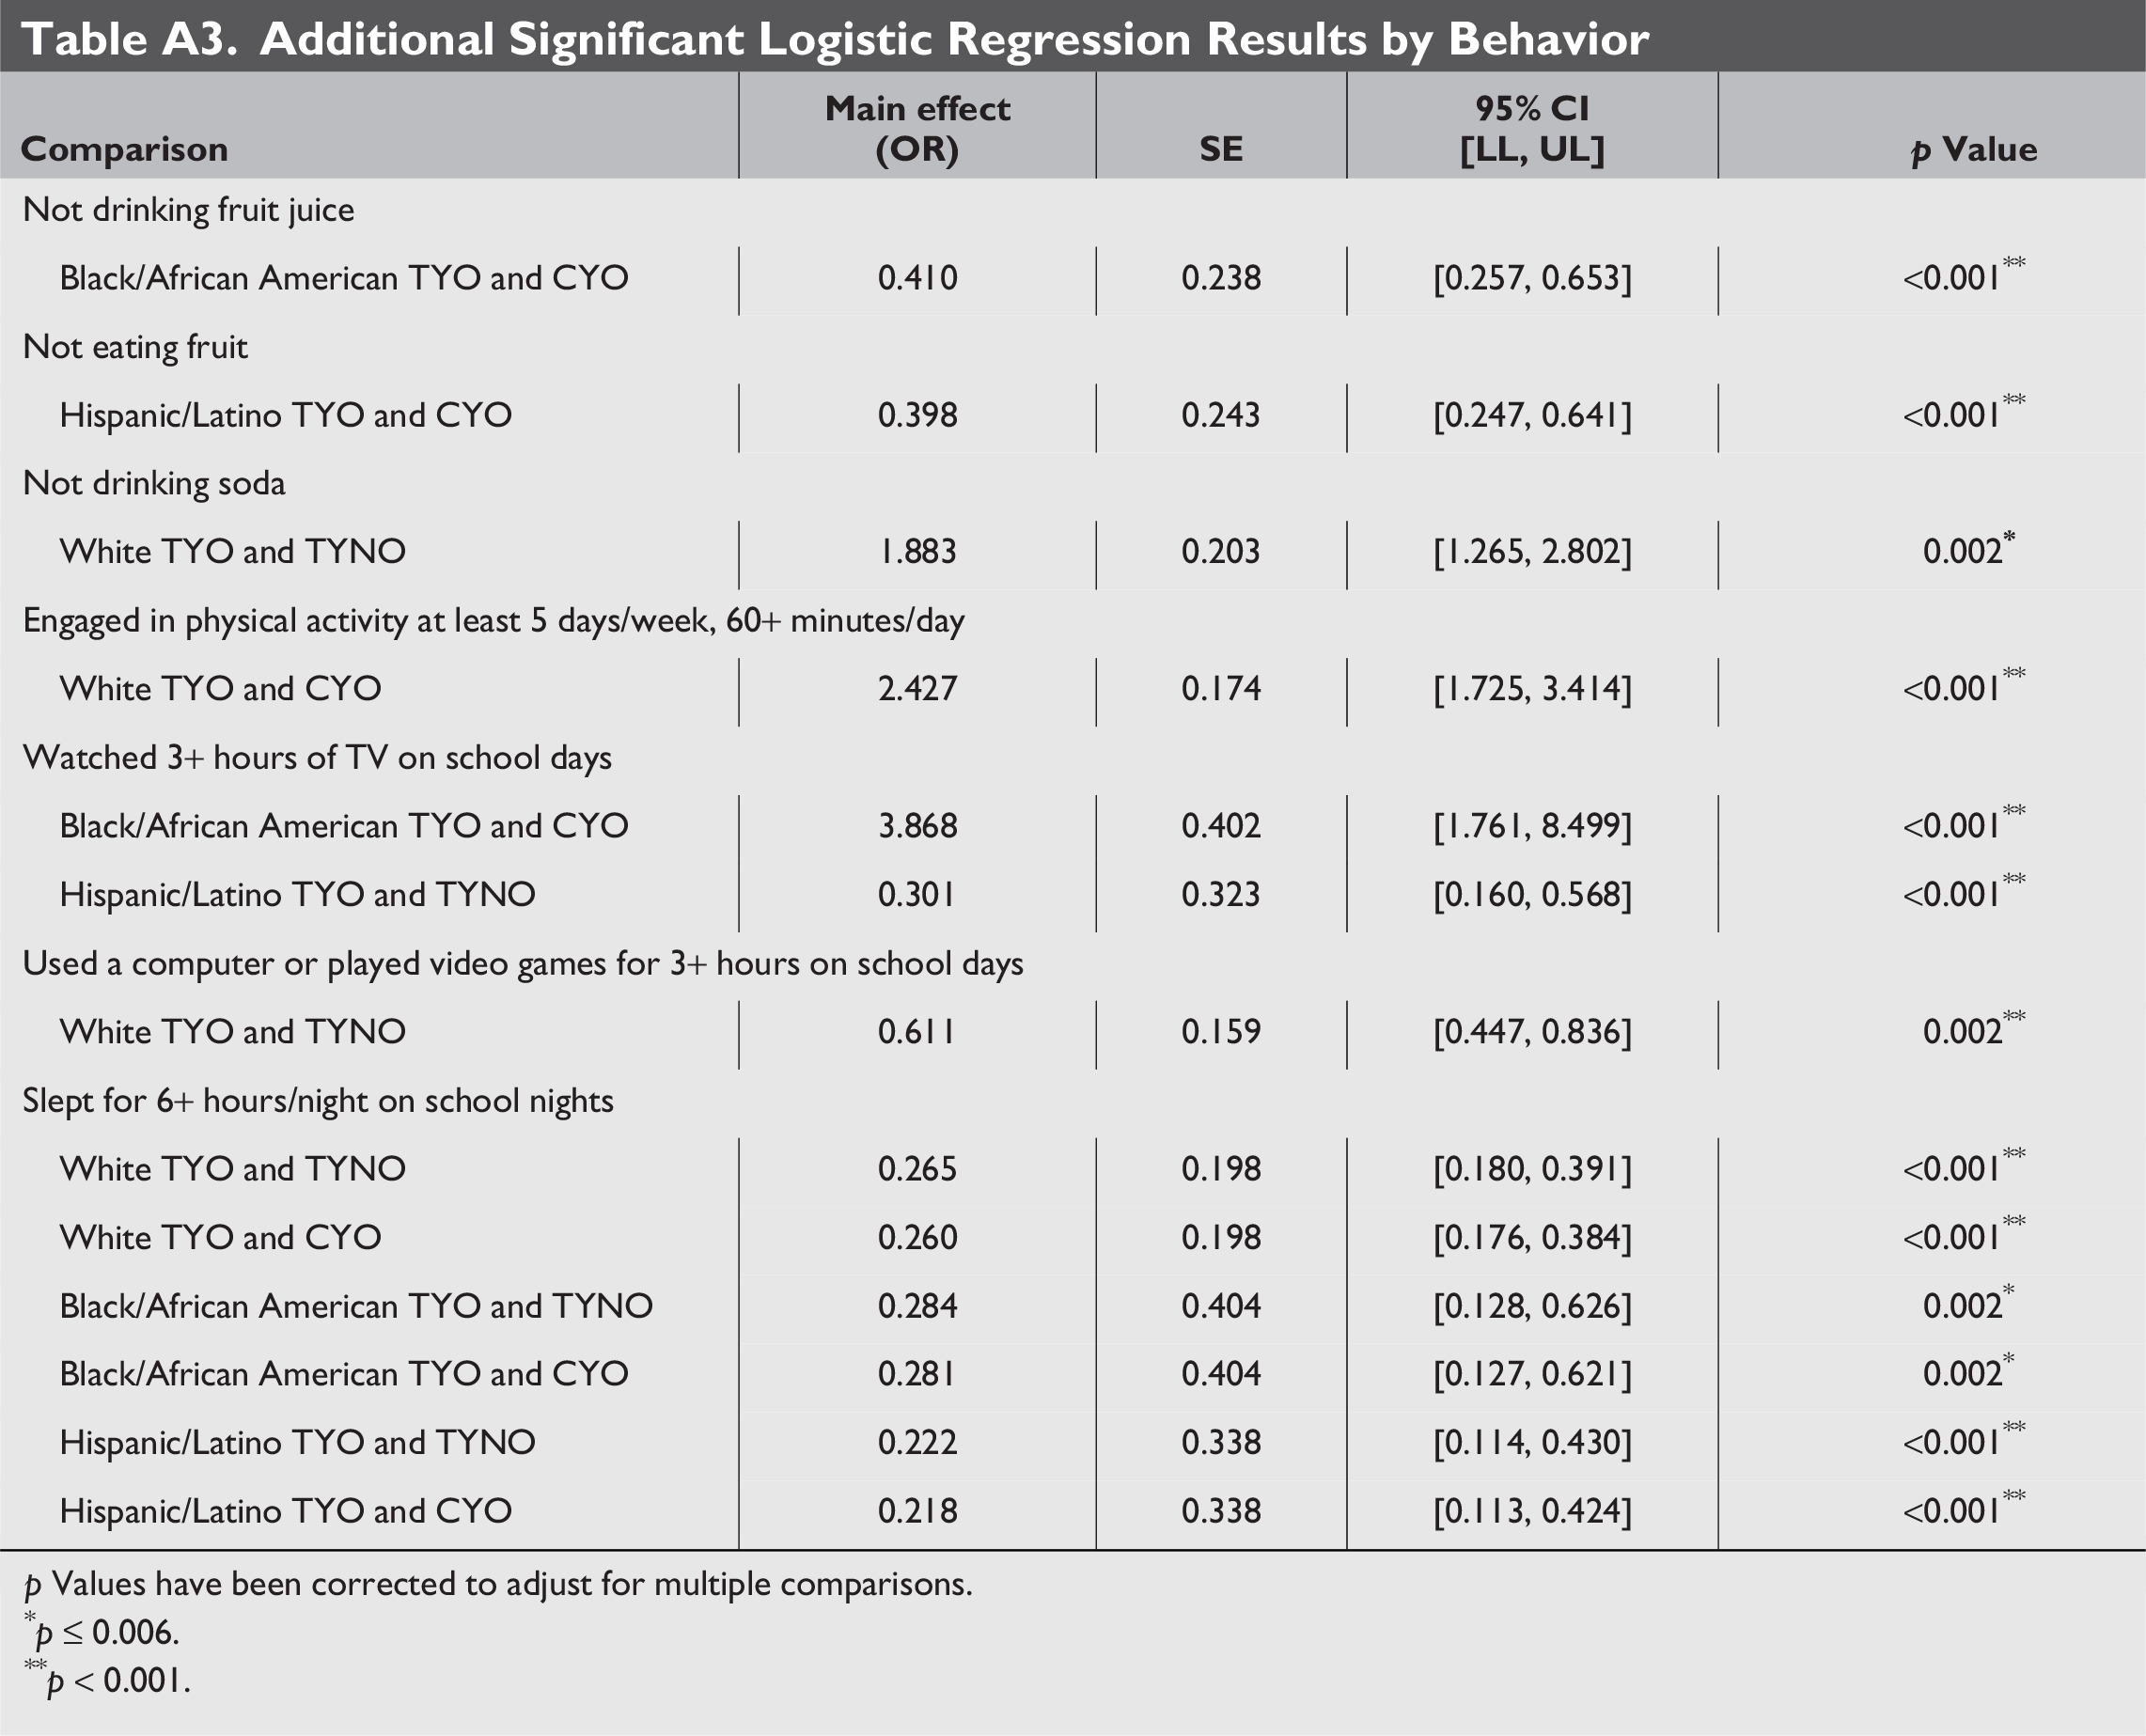
For all racial/ethnic groups except Other, TYO had odds ratios<1 for the variable of sleeping 6 or more hours on school nights when compared with both TYNO and CYO. This suggests TYO are at increased risk for sleep deprivation (see Table A3 in Appendix).
Additional significant results
Few additional significant comparisons were identified among different racial/ethnic groups, and no patterns were observed in behaviors by either racial/ethnic identity or gender identity/weight status (see Table A3 in Appendix for results of significant odds ratios).
Nonsignificant results
Two health behaviors had no significant results: not eating breakfast and not eating green salad. Most health behaviors were only significant in one or two comparisons (see Tables A2 and A3 in Appendix for logistic regression results for TYO, TYNO, and CYO).
Discussion
It was originally hypothesized that TYO would endorse health behaviors that are associated with the development of obesity and its comorbidities. Data indicated transgender youth had a higher rate of obesity compared with their cisgender peers (19%–10%), a finding that has been preliminarily identified in transgender adults.15,16 Results revealed more similarities in habits of TYO, TYNO, and CYO than differences. Additional factors such as genetics, inability to access affirming care, mental health concerns, discrimination, and greater rates of substance abuse could explain differences in rates of obesity between transgender and cisgender youth.32,33 Trends of engagement in health-promoting behaviors were not consistent among racial and ethnic groups, demonstrating some differences but not achieving statistical significance.
Only one variable was significant in all comparisons: describing one’s self as overweight. TYO of all racial/ethnic identities had odds ratios <1 when compared with TYNO and >1 when compared with CYO. Odds ratios were larger for minoritized racial/ethnic groups. This suggests TYO were less likely to describe themselves as overweight when compared with TYNO and more likely to do so when compared with CYO—and that TYO of color were more likely to describe themselves as overweight than White TYO and CYO. As TYO were more likely to endorse being overweight than CYO, this self-perception could be impacted by factors associated with gender identity. One possibility is that increased minority stress or increased gender dysphoria lead TYNO to endorse this perception more than TYO.34–38 Interestingly, TYNO—youth without obesity—were more likely to describe themselves as overweight than TYO. These data suggest that TYNO have (on average) a misperception that they are overweight when they are not or TYO have (on average) a misperception that they are not overweight when they indeed do meet criteria for obesity.34–38 More research investigating the nuance of this self-perception is warranted.
TYO of all racial/ethnic identities except Other were significantly more likely than TYNO and CYO to sleep <6 hours a night. Considering insufficient sleep can contribute to poor health and increase T2D risk, interventions supporting the health of TYO must prioritize increased sleep.29,30
Additional significant odds ratios found Black/African American TYO were more likely to drink fruit juice and more likely to watch 3+ hours of TV on school nights than Black/African American CYO; Hispanic/Latino TYO were more likely to eat fruit and less likely to watch 3+ hours of TV on school than Hispanic/Latino CYO; White TYO were more likely to engage in consistent physical activity than White CYO; and White TYO were less likely to drink soda or report excessive screen time on school nights than White TYNO. No comparison was significant for Other TYO/TYNO or TYO/CYO except perception of weight.
To our knowledge, this is the first use of YRBSS data to explore the prevalence of health-related behaviors in CYO, TYO, and TYNO, in aggregate and by racial/ethnic identity. While not consistent with the hypotheses, similarities in habits between TYO and TYNO of different racial/ethnic groups suggest a need for further exploration.
Limitations
The YRBSS team notes several limitations that apply to the overall study. First, the YRBSS is a school-based study. In 2019, 5% of 14–17-year-olds were not enrolled in high school, with higher rates for American Indian/Alaska Native, Black/African American, Hispanic/Latino, Pacific Islander, and transgender students.38,39 Students chronically absent due to health concerns, bullying, suspensions, challenging family circumstances, and other reasons may not be represented.34,39,40 Similarly, not all states or school districts administer the YRBSS, and even fewer included the question on gender identity. The YRBSS team noted students may have been questioning their identity when asked to provide their gender, not understood the question, or hesitated to disclose such information. There is also potential for over- or under-reporting of health-related behaviors. Prior research has identified a slight downward trend in BMI accuracy for students self-reporting weight and height. 41 Similarly, BMI data were calculated using students’ sex assigned at birth, which may inaccurately characterize the weight status of transgender youth. 42 BMI has also been found to misrepresent the body mass of non-White individuals. 43
A great deal of research supports higher rates of obesity and food insecurity in lower income households.6,41 The YRBSS does not collect information on household income. The exclusion of this variable may have impacted overall understanding of healthy behaviors, as income and food insecurity could be mediators or moderators. 7 Similarly, transgender youth experience higher rates of minority stress and stigma than their cisgender peers, rates that are likely compounded for youth holding multiple marginalized identities. This study did not explicitly look at the impact of minority stress (e.g., experiences of discrimination and lack of social support) on transgender youth, which could be an area of future study to determine potential contributions to the development of obesity. Secondary causes of obesity such as eating disorders, genetic variants, hypothyroidism, or use of obesogenic medications such as atypical antipsychotics 44 were not identified through YRBSS data and not considered as potential contributors to weight gain. YRBSS data are cross-sectional and descriptive; data can only indicate associations not causality. 25
Finally, we combined several racial groups (those identifying as American Indian or Alaska Native, Asian, Native Hawaiian or Other Pacific Islander, or Multiracial) into one group, Other, for data analysis. This was done due to concerns with very small sample sizes but prevents a more robust understanding of the habits of TYO, TYNO, and CYO of the aforementioned identities.
Conclusion
This study identified few differences in rates of engagement in health behaviors for TYO, TYNO, and CYO. There was a higher rate of obesity in transgender students than in cisgender students. While examination of health behaviors yielded many insignificant results, the present study contributes to the limited body of literature on the health habits and health-related factors of transgender youth. Given the potential for minority stress to compound weight-related concerns and conditions—and the fact that there were few differences between TYO, TYNO, and CYO—additional research could provide insight into the intersection of race, gender identity, and obesity. This could be used to help providers in weight management programs provide more affirming services that center those harmed by intersecting manifestations of prejudice and discrimination. Such evidence supports a need for culturally safe programs and resources for TYO, to reduce the burden of minority stress and focus on systemic and structural social determinants of health to adequately address barriers to care. This research supports a need for affirmative and effective care for transgender students that targets a more comprehensive understanding of weight management beyond increasing healthy behaviors and underscores the need for additional work to enhance the understanding of the health behaviors of transgender youth.
Impact Statement
We found a prevalence rate of obesity in US transgender youth of 19%. Although health behaviors and racial/ethnic identity did not explain their increased likelihood of developing obesity and increased risk of weight-related comorbidities such as type 2 diabetes, this research supports the development of gender-affirming weight-related care.
Authors’ Contributions
A.S.: Formal analysis (lead), writing—original draft (lead), and writing—review and editing (lead). K.O.-C.: Project administration (supporting), data curation (lead), and formal analysis (equal). S.G.: Project administration (supporting), data curation (supporting), formal analysis (supporting), and writing—review and editing (supporting). R.L.D.: Writing—review and editing (supporting). C.L.O.: Conceptualization (equal) and writing—review and editing (equal). C.F.: Writing—review and editing (supporting). M.B.: Conceptualization (equal), data analysis guidance, and writing—review and editing (equal). M.S.: Conceptualization (lead), and writing—review and editing (equal).
Footnotes
Author Disclosure Statement
No competing financial interests exist.
Funding Information
This study was funded by the American Diabetes Association (11-22-ICTSHD-17).
Supplemental Material
Appendix
Additional Significant Logistic Regression Results by Behavior
| Comparison | Main effect |
SE | 95% CI |
p Value |
|---|---|---|---|---|
| Not drinking fruit juice | ||||
| Black/African American TYO and CYO | 0.410 | 0.238 | [0.257, 0.653] | <0.001 ** |
| Not eating fruit | ||||
| Hispanic/Latino TYO and CYO | 0.398 | 0.243 | [0.247, 0.641] | <0.001 ** |
| Not drinking soda | ||||
| White TYO and TYNO | 1.883 | 0.203 | [1.265, 2.802] | 0.002 |
| Engaged in physical activity at least 5 days/week, 60+ minutes/day | ||||
| White TYO and CYO | 2.427 | 0.174 | [1.725, 3.414] | <0.001 ** |
| Watched 3+ hours of TV on school days | ||||
| Black/African American TYO and CYO | 3.868 | 0.402 | [1.761, 8.499] | <0.001** |
| Hispanic/Latino TYO and TYNO | 0.301 | 0.323 | [0.160, 0.568] | <0.001** |
| Used a computer or played video games for 3+ hours on school days | ||||
| White TYO and TYNO | 0.611 | 0.159 | [0.447, 0.836] | 0.002 ** |
| Slept for 6+ hours/night on school nights | ||||
| White TYO and TYNO | 0.265 | 0.198 | [0.180, 0.391] | <0.001 ** |
| White TYO and CYO | 0.260 | 0.198 | [0.176, 0.384] | <0.001 ** |
| Black/African American TYO and TYNO | 0.284 | 0.404 | [0.128, 0.626] | 0.002 * |
| Black/African American TYO and CYO | 0.281 | 0.404 | [0.127, 0.621] | 0.002 * |
| Hispanic/Latino TYO and TYNO | 0.222 | 0.338 | [0.114, 0.430] | <0.001 ** |
| Hispanic/Latino TYO and CYO | 0.218 | 0.338 | [0.113, 0.424] | <0.001 ** |
p Values have been corrected to adjust for multiple comparisons.
p ≤ 0.006.
p < 0.001.
References
Supplementary Material
Please find the following supplemental material available below.
For Open Access articles published under a Creative Commons License, all supplemental material carries the same license as the article it is associated with.
For non-Open Access articles published, all supplemental material carries a non-exclusive license, and permission requests for re-use of supplemental material or any part of supplemental material shall be sent directly to the copyright owner as specified in the copyright notice associated with the article.
