
Abstract
This paper presents an approach to index portfolio re-balancing, focusing on the median slice of asset performance instead of the more traditional focus on “winners” and “losers.” In the proposed approach, one constructs an equal-weight portfolio from the index’s median (by returns) component. We consider the Dow Jones Industrial Average (DJIA) as a case study and introduce a systematic re-balancing strategy that targets the middle third (“median”) segment of asset performers within the index. The proposed methodology provides significantly better returns and mitigates drawdowns compared with a passive “buy-and-hold” strategy while promoting a disciplined and simple portfolio re-balancing strategy. The study empirically evaluates the effectiveness of the median-based re-balancing strategy over historical data. We compare our strategy to a benchmark portfolio closely tracking the DJIA index and other popular re-balancing strategies focusing on winners and losers, including the Dogs of the Dow strategy. We provide a simple model to compare factor loadings offered by such strategies and show that the median strategy provides broad diversification across sectors. We also analyze factor exposures of the proposed strategy using the 3-factor Fama-French model.
The analysis demonstrates that the “median” rotation strategy consistently outperforms the Dow Jones and the broad market index S&P-500, yielding higher returns and reduced drawdowns.
Keywords
Introduction
Consider a portfolio of assets such as stocks. Suppose that an initial portfolio of these assets is chosen, and we want to re-balance this portfolio periodically. A practical problem is to choose a re-balancing strategy that provides better risk/return than a passive “buy-and-hold” strategy.
The portfolio construction problem and its re-balancing is a classical problem in finance going back to the pioneering work of Markowitz Markowitz (1952) and Fama Fama and French (1993) (for a comprehensive overview, see Fabozzi, 1998; Fabozzi and Markowitz, 2011; Guerard, 2010; Grinold and Kahn, 1999). In re-balancing a portfolio, we are faced with the following question: what should we keep, and what should we sell for the next investment phase? And for the assets to keep, how should we choose the corresponding weights? Traditional methods often revolve around labeling assets as “winners” or “losers,” guiding our investment decisions accordingly. The weights are often computed depending on the performance of individual assets or anticipated business cycles (e.g., Fabozzi, 1998; Grinold and Kahn, 1999; Biglari and Nazaripour, 2016; Herold, 2003; Isichenko, 2021 to name a few) and/or risk factors (Fama and French, 1993; Glandon et al., 2022; Jareño et al., 2016; Jorion, 2000). Recently, there has been an increased interest in applying machine learning to portfolio construction (e.g. Lopez de Prado, 2018, 2020).
Many of these methods require special skills and are difficult to implement by an average investor. This paper suggests a simple method for re-balancing the portfolio: equal weighting of the “median slice.” Instead of just focusing on winners or losers, we are advocating for paying attention to the middle ground, where assets with “median” performance (measured by returns) reside. By investing in these “median” assets, we aim to balance out the highs of winners and mitigate the risks associated with losers in future investment cycles. Any self-directed investor can implement this strategy.
The proposed “median” rotation re-balancing strategy is as follows: We are given a set of assets such as stocks. At the end of each re-balancing period (e.g. a year), we want to construct a portfolio from these stocks. We proceed in three simple steps as follows:
construct a list of all stocks ranked by performance, such as returns choose the stocks in the middle third (middle “slice”) of the list. invest capital equally among the stocks in the middle third of the list
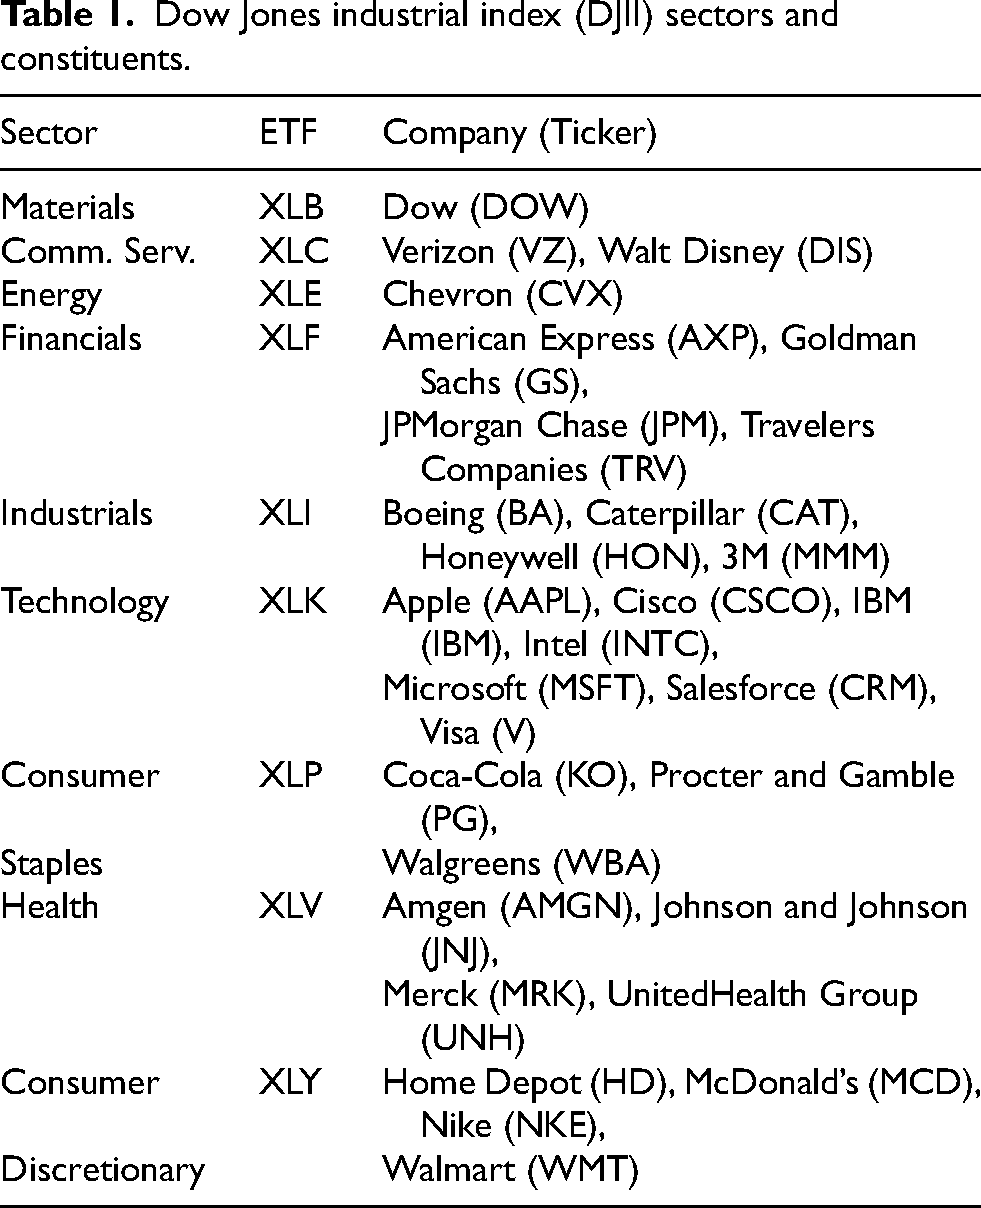
Equal weighting is an effective strategy in portfolio construction. Despite its simplicity, such a strategy is often difficult to outperform in portfolio growth and risk (e.g. Beleznay et al., 2020; Maillard et al., 2010; Schanbacher, 2014). In this paper, we demonstrate the effectiveness of the “median” rotation strategy using the Dow Jones Industrial Average (DJIA) (Dow Jones, 2024), one of the most well-known stock market indices. This index tracks the performance of 30 large, publicly traded companies in the United States grouped into 9 sectors. A summary of these stocks and their sectors (Jareño et al., 2016) is presented in Table 1.
Dow Jones industrial index (DJII) sectors and constituents.
In addition to analyzing the performance of the proposed strategy, we will investigate various factor loadings offered by the different portfolios analyzed in this paper. These loadings could identify sources of return and risk in these portfolios. There are many factor models including the Capital Asset Pricing Model, Fama-French 3-factor model (Fama and French, 1993), Arbitrage Pricing Theory (Ross, 1976) and many others (for a literature review, see Liang, 2024).
In this paper, we will investigate two factor models:
exposure to industry sectors exposure to Fama-French factors
The paper is organized as follows. In Section “Factor loadings” we describe a simplified model to analyze sector factor exposures of the proposed strategy. In Section “‘Median’ rotation” we argue for constructing the sub-portfolios from median stock performers. This is in contrast to the usual practice of buying winners or losers. In Section “A detailed example” we show how to construct the portfolios from the best, median, and worst-performing stock components of the index. In Section “Growth comparison” we compare the portfolio growth of the median with the other strategies. In Section “Detailed results” we compare returns, volatility, maximum drawdowns and other performance metrics. In addition, we investigate the performance of the strategy for different slice-sized and re-balancing frequencies and sector/industry exposures. In Section “Fama-French factor exposures analysis”, we analyze the strategy exposure to Fama French factors. Finally, we conclude with a discussion and summary of results in Section “Discussion”.
Factor loadings
Our emphasis in this paper is on simplicity. With this in mind, we will use a simplified model to analyze industry factor loading for the proposed strategy. Analysis of exposures to Fama French model will be presented in “Fama-French factor exposures analysis”.
As proxies for the factors representing sectors, we will use the SPDR exchange-traded funds listed in Table 1. Instead of the return contributions for each sector to the strategies, we will use the corresponding count of the underlying stocks in the sector and use this as a proxy for the factor exposure (on a relative basis). For example, if a strategy involves investing in 3 Dow Jones stocks from sector X, we will indicate the relative exposure to this sector as 3. Since the Dow Jones contains 30 stocks, these 3 stocks correspond to give us 10% weight in sector X.
We realize that this simplified approach has short-comings and does not attribute risk and returns properly. At the same time, it is very simple and can be easily used by an average investor. Therefore, as proxies for sector factors we will consider the following the following SPDR sector ETFs:
XLB: Basic Materials XLC: Communication Services XLE: Energy XLF: Financial Services XLI: Industrials XLK: Technology XLP: Consumer staples XLV: Healthcare XLY: Consumer Discretionary
The current components of the Dow Jones and the corresponding sector details are presented in Table 1.
We note from Table 1 that some sectors like Energy or Materials have just a single Dow Jones stock (Chevron and Dow, respectively), and others, like Technology, have 7 (or about 25%) stocks in the index. The median number of stocks in a single sector for Dow Jones is 4. The summary table for factor counts and weights is presented in Table 2.
Factor counts and weights (%) for Dow-Jones index.
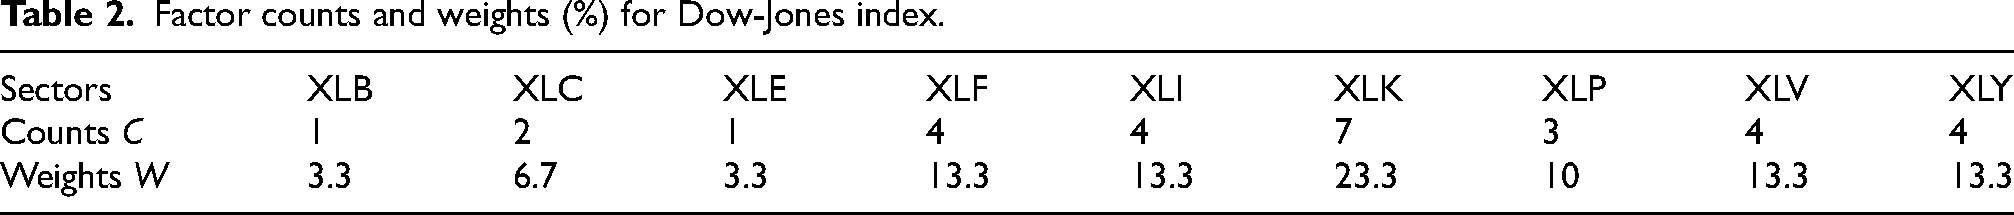
We will use the following notation to indicate the factor exposure. We define vector C to denote counts and vector W to denote % weights (with ETFs sorted alphabetically as in Table 1. Then for Dow Jones index we have

Factor weights (%) for the S&P-500 index.

The corresponding vector of factor weights is then
“Median” rotation
In this paper, we advocate the “median” rotation strategy to rebalance portfolios. This strategy is built on three key principles:
Focusing on the “median” performers: Allocating the portfolio’s capital to median performers allows investors to capture the potential upside of companies that may be overlooked by solely focusing on top-performing stocks. These companies often possess strong fundamentals, stable growth potential, and a higher likelihood of outperforming their past performance in the next cycle. By strategically incorporating median performers, investors can increase their chances of capitalizing on market shifts and generating superior returns. We do not try to predict the next phase of the stock market and look for stocks with a particular factor exposure. We consider the “median” (by performance) 10 stocks. Averaging: Once the candidate “median” stocks are identified, we invest the same amount of available capital in each such stock. Averaging is a tried-and-tested concept that has proven effective in various domains, including finance Beleznay et al., (2020). The power of averaging lies in its ability to smooth out short-term fluctuations and provide a more reliable representation of long-term trends. In the context of a re-balancing strategy for Dow Jones constituents, averaging can help mitigate the impact of individual stock performance on the overall portfolio. This simple averaging solves the difficult problem of determining the proper allocation of the chosen assets or incorporating the appropriate factor exposures. Simplicity: many re-balancing strategies are too complex for an average investor to implement, requiring specialized tools. Many such strategies involve predicting market cycles or exposure to factors. Finally, many strategies are difficult to compare in terms of simple measures. The proposed strategy is simple. We do not predict market cycles or focus on factors—we just average the middle slice at the end of each re-balancing time cycle. The results are compared using two simple measures easily understood by an average investor: portfolio growth and maximum drawdowns. Maximum drawdown is a crucial metric for understanding risk (Fama and French, 1993; Jorion, 2000) and potential loss.
By regularly re-balancing the portfolio, averaging allows for the redistribution of investments among constituents, ensuring that the influence of any single stock’s performance is minimized. This helps diversify risk and increase the stability of the portfolio over time. Averaging provides a disciplined approach to investment management, reducing the potential for emotional decision-making and enabling investors to benefit from the overall upward trajectory of the market.
Such median strategy of using sector exchange-traded funds (ETFs) was considered in our previous paper Yang and Pinsky (2022). It showed that one could achieve significant performance gain by considering 9 ETFs representing major sectors and by equal-weight investing in the median 3 ETFs. However, the paper did not provide any comparison with other strategies such as focusing on winners or losers. This paper provides a detailed analysis and comparison of the proposed strategy, illustrated with stocks from the Dow Jones Industrial Index.
This paper is organized as follows: in Section ““Median” rotation”, we describe the proposed strategy in more detail and show how it differs from other popular strategies that focus on winners and losers, including the so-called “Dogs of the Dow Strategy.” (Domain, 1998; Dogs of the dow, 2024; Rowlett, 2012; Tissayakorn et al., 2013). In Section “Growth comparison”, we compare the growth of portfolios under different strategies and show that the proposed “median” rotation strategy offers the highest total return. We provide a detailed comparison of annual returns and tracking errors and show that the proposed strategy outperforms the other competing strategies in most years. In particular, we present a detailed comparison of the proposed strategy with the “Dogs of the Dow” strategy (Dogs of the dow, 2024; Soomro and Haroon, 2015). In 20 years, from 2000 to 2020, the proposed strategy outperformed DOD by more than 2:1. In Section “Comparison of maximum drawdowns between strategies”, we show that the proposed strategy offers an attractive risk profile, outperforming other strategies in most years. In Section “Comparing different sizes of the median slice”, we address the issue of computing the optimal size of the median. We show that the optimal size is the middle
A detailed example
We illustrate the proposed median rotation strategy for the Dow Jones Industrial Index. Recall that our strategy requires ranking of stocks based on their performance and then investing in the middle slice of these stocks. The constituent stocks are assessed over a defined investment cycle: daily, weekly, biweekly, monthly, quarterly, half-yearly, or annually. By sorting the stocks based on their returns and selecting the middle slice, we aim to capitalize on the potential opportunities presented by median performers of the index, which have shown consistent but not exceptional performance. We hypothesize that this approach can yield higher returns than the overall index or focus on winners and losers
We will compare the following Dow Jones index rotation strategies:
“Buy-and-Hold”—passive index investing “Winners”: invest an equal amount in the top-performing ten stocks from the last investment period “Median” (proposed strategy): invest an equal amount in the median ten stocks “Losers”: invest an equal amount in the worst ten stocks from the last investment period Equal Weight (EW): invest an equal amount into each of the 30 components of the Dow Jones. This is equivalent to investing equal amounts into “winners”, “median” and “losers”. “Dogs of the Dow”: invest an equal amount in the ten stocks from the last period with the highest dividend yield. The Dogs of the Dow strategy is a popular strategy when investors bet on the beaten-down blue chip stocks in the index. It is a strategy of investing in the losing stocks of the index. These are typically companies whose stocks declined the most without the corresponding dividend cuts. In practice, this strategy is similar to investing in “losers.”
We illustrate this by the following example. Let us consider the end of the year 2021. We sort 30 stocks of Dow Jones in decreasing order by their annual returns We have the following groups of 10 stocks
The corresponding factor weights (%) W for 2021 are
The “Median” strategy, advocated in this paper, would invest all capital equally among the 10 median stocks. These 10 stocks are distributed across 8 sectors, shown in
The “Losers” strategy would invest all capital equally among the worst-performing 10 stocks. These 10 stocks are distributed across 6 sectors, shown in
These numbers suggest that for 2021 investing, the median slice would use more sectors (more diversified) and less concentration in any single sector than “winners” or “losers”. We will show similar average statistics for 1998–2023 in Section “Growth comparison”.
The Equal Weight (EW) strategy would allocate capital equally among all 30 components. The “Dogs of the Dow” is a popular stock-picking strategy. The strategy involves investing an equal amount in the 10 highest dividend-yielding Dow stocks yearly.
If we use annual re-balancing, we again sort our 30 stocks after one year and identify winners, median, and losers. This is illustrated in Table 4 and repeated the above procedure for 2021.
“Winners”: CVX , MRK , TRV , AMGN , CAT , IBM , KO , UNH , JNJ , HON “Median”: MCD , WMT , V , PG , BA , DOW , GS , AXP , JPM , VZ “Losers”: CVX , MRK , AMGN , IBM , KO , DOW , VZ , WBA , MMM , INTC “Dogs of the Dow (DoD)”: CVX , MRK , AMGN , IBM , KO , DOW , VZ , WBA , MMM , INTC
with their annual returns and sectors shown in Table 5.
2021 % returns of Dow Jones stocks sorted in decreasing order.

2022 returns of Dow Jones stocks sorted in decreasing order.

The corresponding sector weight vectors W for 2020 are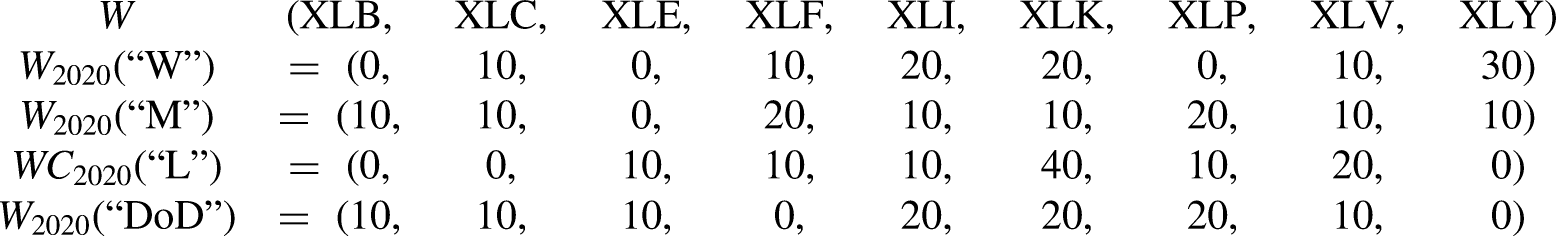
Annualized returns from the strategies for 2021 and 2022.

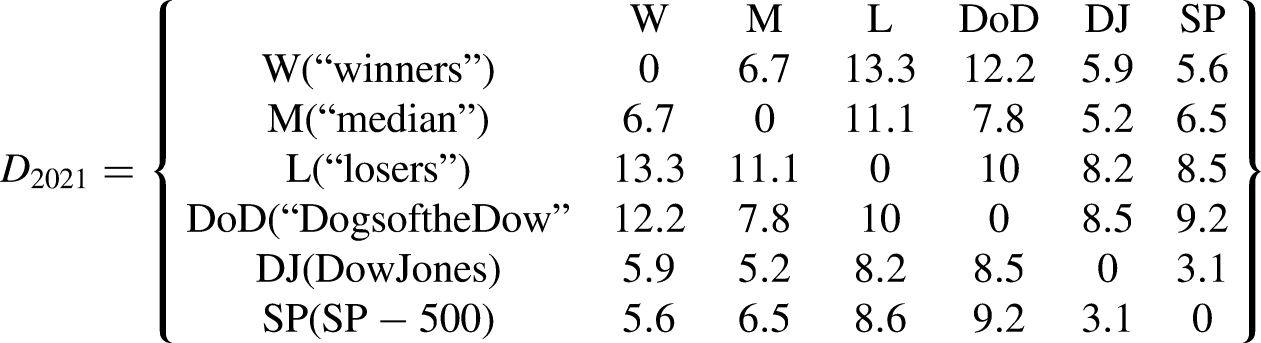
To compare the factor exposure in more detail, we compute the differences (“distances’) 
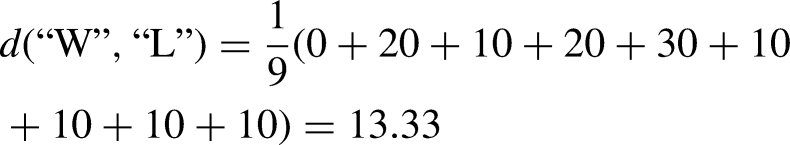
For 2020 we have the following: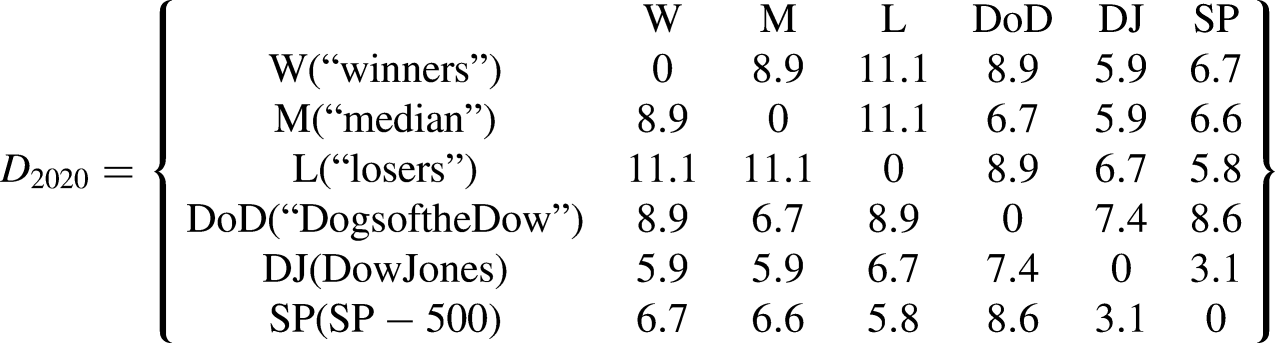
Finally, let us compute the average difference in factor weights from 2020 to 2021: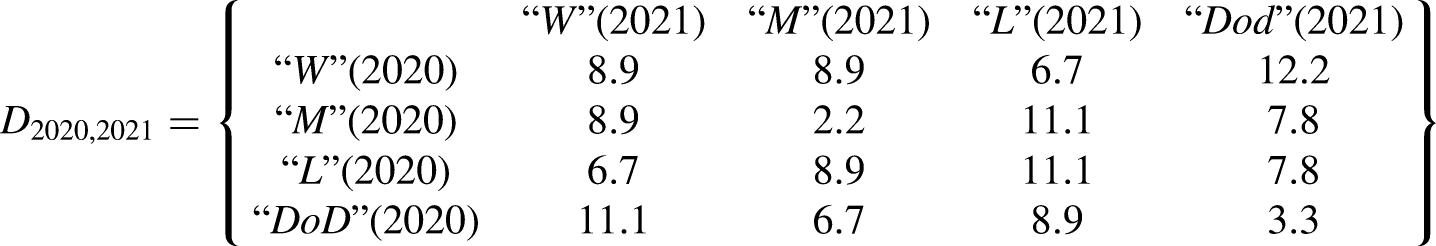
In the computation of performance, we ignore transaction costs and tax implications. These would be comparable to strategies that focus on winners or losers or with periodic re-balancing for the equal-weight portfolio. The proposed strategy would most likely be attractive in tax-deferred and retirement accounts.
Growth comparison
To evaluate the effectiveness of the proposed re-balancing strategy, we first compute portfolio growth using historical data of Dow Jones and its constituents over more than 20 years. We implemented the strategy by re-balancing the portfolio at the end of each investment cycle and reallocating the capital to the middle slice of performers. For comparison, we also analyzed the performance of a benchmark portfolio that closely tracked the DJIA index, the “losers,” the “winners,” equal-weight rotation strategies, as well as the broad market S&P-500 index. For the S&P-500 index we used the “SPY” ETF pricing data. A comparison of results is shown in Figure 1.
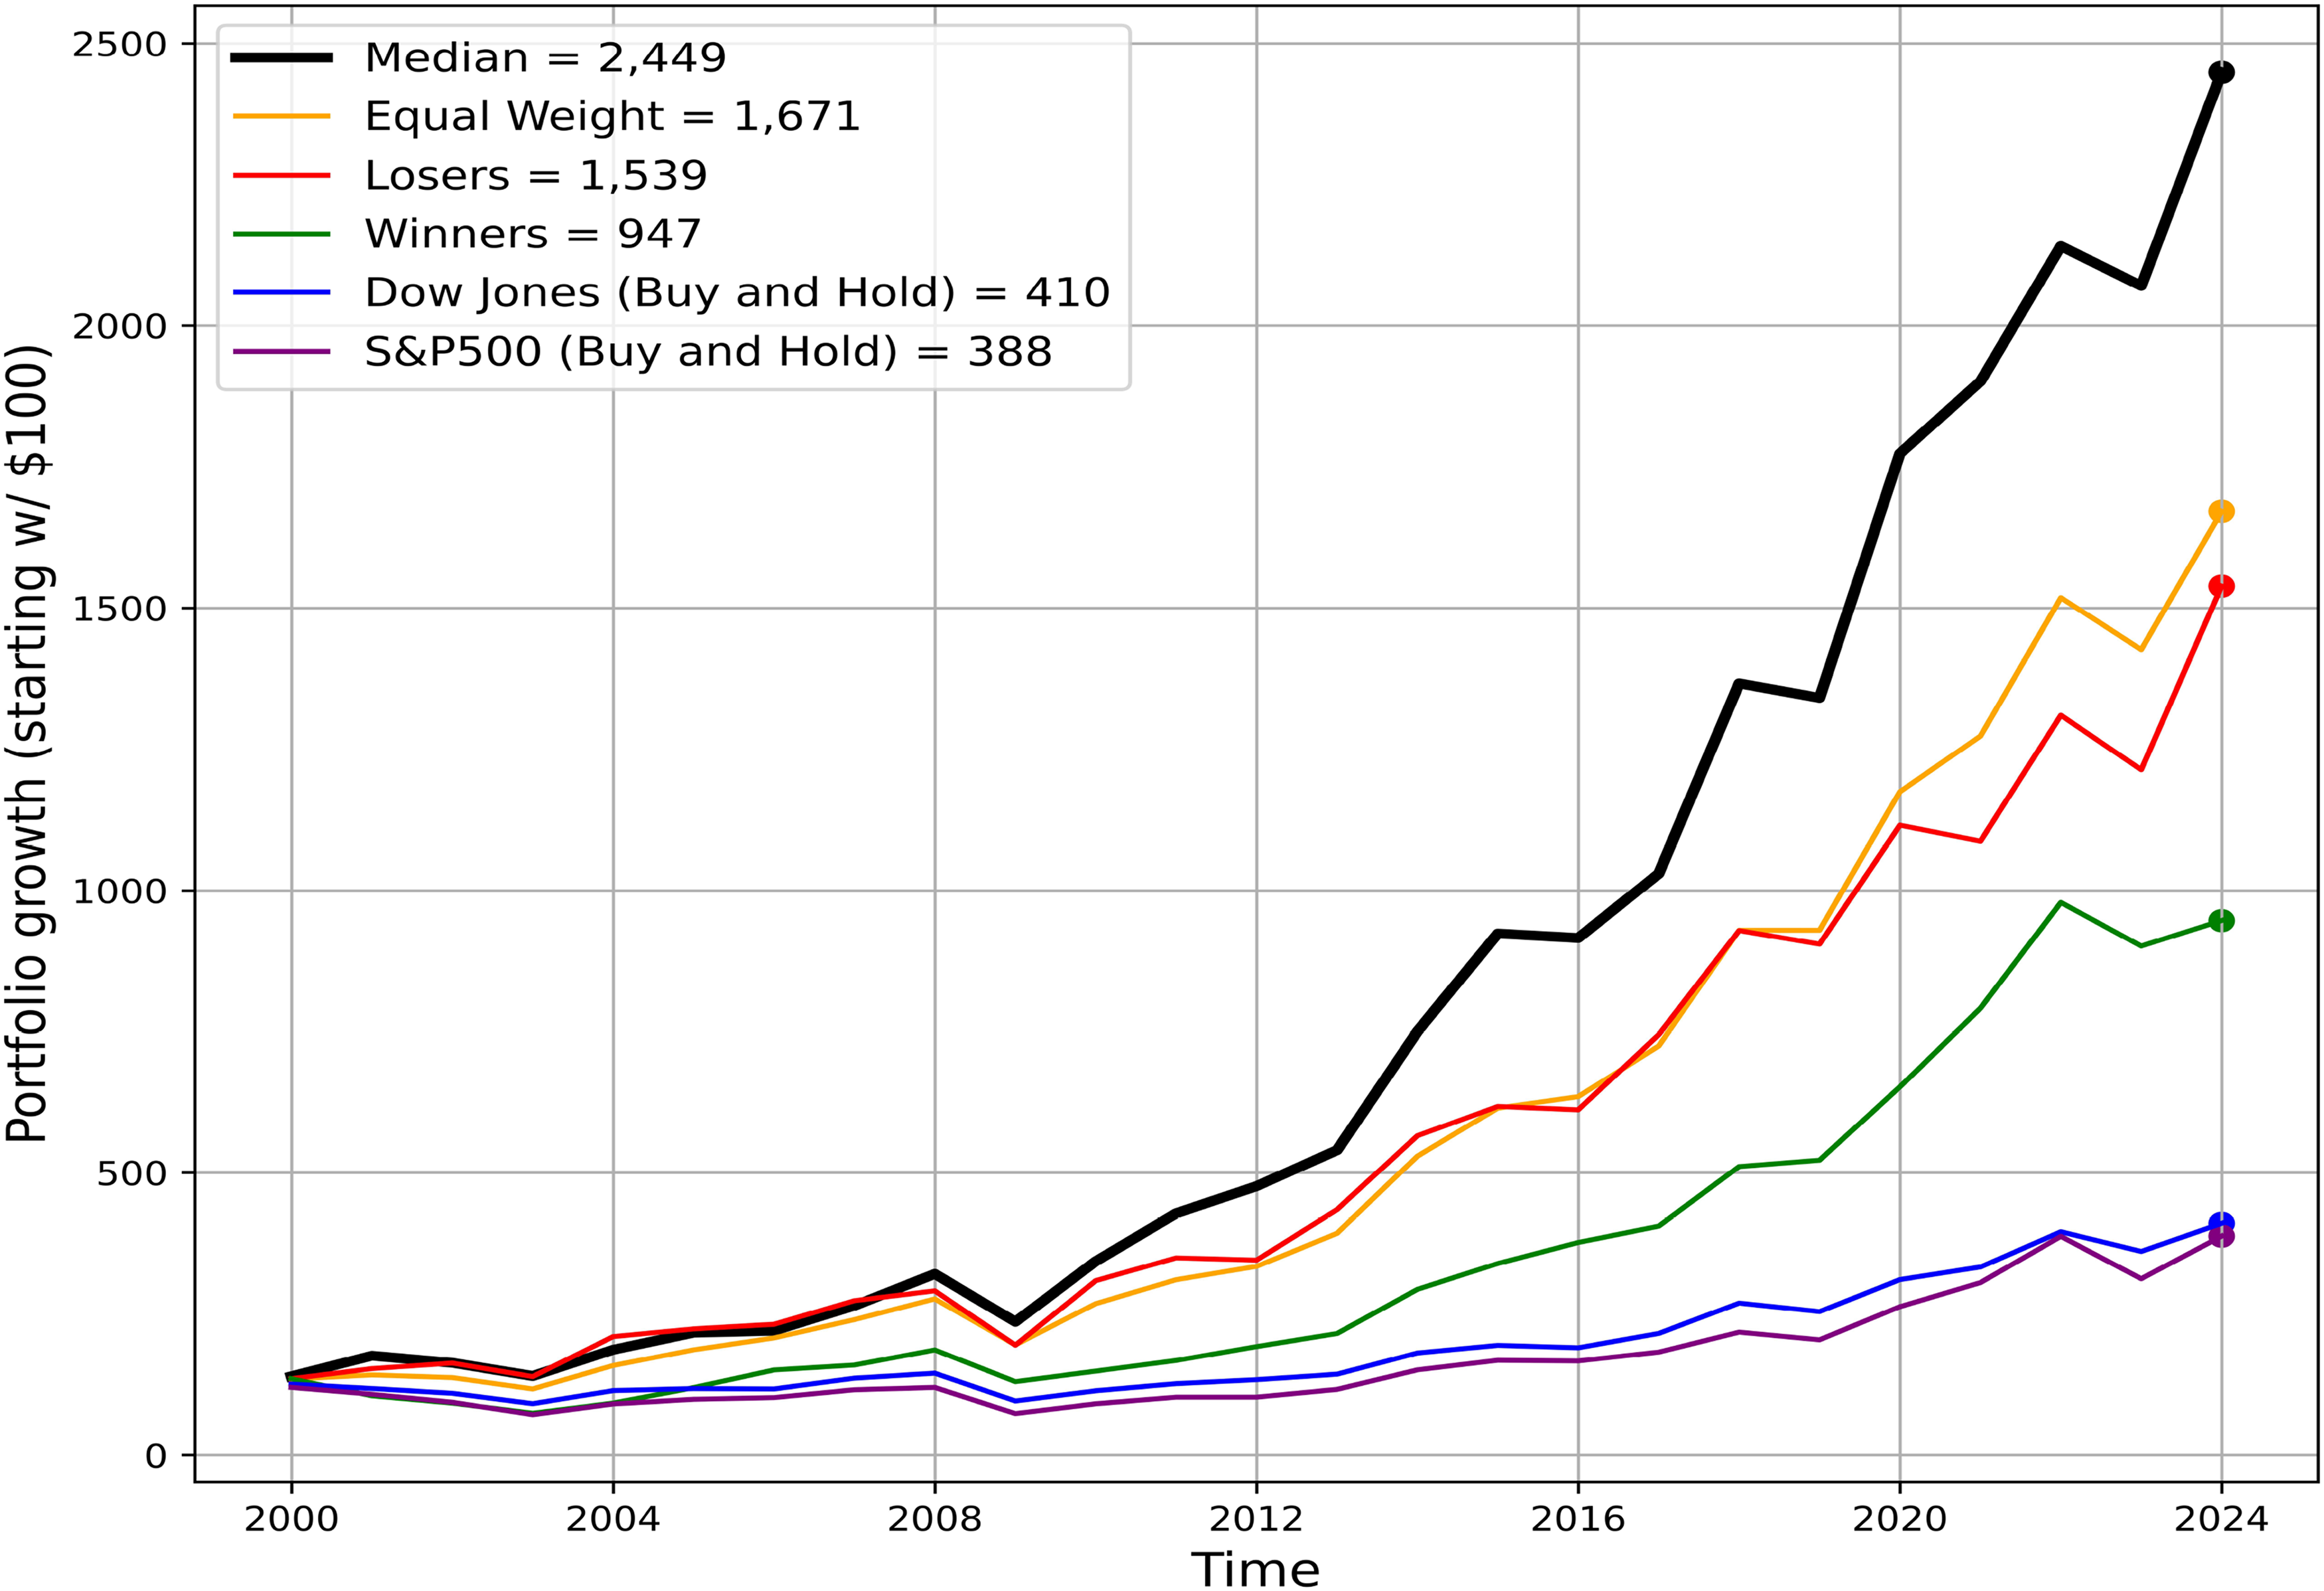
Comparison of the different strategies and Dow Jones index.
These results indicate that our simple re-balancing strategy consistently outperformed both the Dow Jones and the S&P-500 index. The returns generated by the strategy surpassed those of the index, indicating the superior performance of this approach. Additionally, we observed that the strategy exhibited higher stability and reduced risk compared to the index, further highlighting its potential as a risk-mitigation tool in times of crises Pagano et al. (2020). Moreover, the proposed strategy generated higher growth compared to other strategies focusing on winners or losers. We discuss the performance comparison between these strategies in more detail in Section “Comparison of annual returns between strategies”.
Our results indicate that all three rotation strategies: “winners,” “median,” and “losers,” significantly outperform the benchmark indices, with the “median” rotation strategy as the clear winner.
Detailed results
This section presents a detailed analysis of the results of the proposed “median” re-balancing strategy for Dow Jones constituents. Our examination covers various dimensions, offering insights into the strategy’s out-performance, risk management capabilities, and adaptability to market conditions.
We begin with a detailed comparison of returns between strategies in Subsection “Comparison of annual returns between strategies”. We show that the proposed median rotation strategy generates higher annual returns in most years, more frequently than other strategies considered. Further, we explore the annual returns tracking error, providing a comprehensive view of the strategy’s performance relative to traditional benchmarks. In Subsection “Comparison of maximum drawdowns between strategies”, we focus on maximum drawdowns and show that the average maximum drawdown of the proposed strategy is better than the other strategies. As mentioned above, we focus on maximum drawdowns to assess the risk, not other portfolio metrics such as standard deviation of returns, Sharpe’s ratio, Jensen’s alpha, Treynor, Sortino ratio, or Calmar ratios used in portfolio evaluation Fabozzi (1998). Maximum drawdown is a simple measure that is both intuitive and easy to understand by an average investor. Subsequently, we focus on evaluating maximum drawdowns, a crucial metric for understanding risk (Fama and French, 1993; Jorion, 2000) and potential loss. In Subsection “Comparing different sizes of the median slice” we consider different sizes for the “median” slice. We find the middle third is the best choice. For larger and smaller sizes we get lower performance and higher drawdowns. In Subsection “Comparison of strategies during market meltdown” we show that the proposed strategy was more resilient during market meltdowns such as Internet-related market meltdown in 2001-2002, the financial crisis in 2008–2009, and COVID-related decline in 2020. The proposed strategy provided lower drawdowns and higher returns compared to the other strategies. In Subsection “Summary comparison of strategies over different time-frames”, we compare returns and drawdowns for different re-balancing frequencies. We find that at shorter periods, the proposed strategy does not offer an improvement over other strategies. However, as we increase the re-balancing time period to one year, we can see significant improvement both in growth and drawdowns. Many self-directed investors would prefer annual re-balancing.
Our results show that the proposed strategy, with its focus on the middle slice, offers better returns and drawdowns. We believe that the proposed strategy offers valuable insights for investors seeking a deeper understanding of its performance characteristics.
Comparison of annual returns between strategies
In Table 7, we present a comparison of annual returns and summary statistics for the buy-and-hold (DJIA), ‘Winners”, “Losers,” “Equal-Weight,” and the proposed “median” rotation strategy. We also provide the tracking error (TE) between strategies and the index.
Annual % returns and tracking error (TE) comparison.
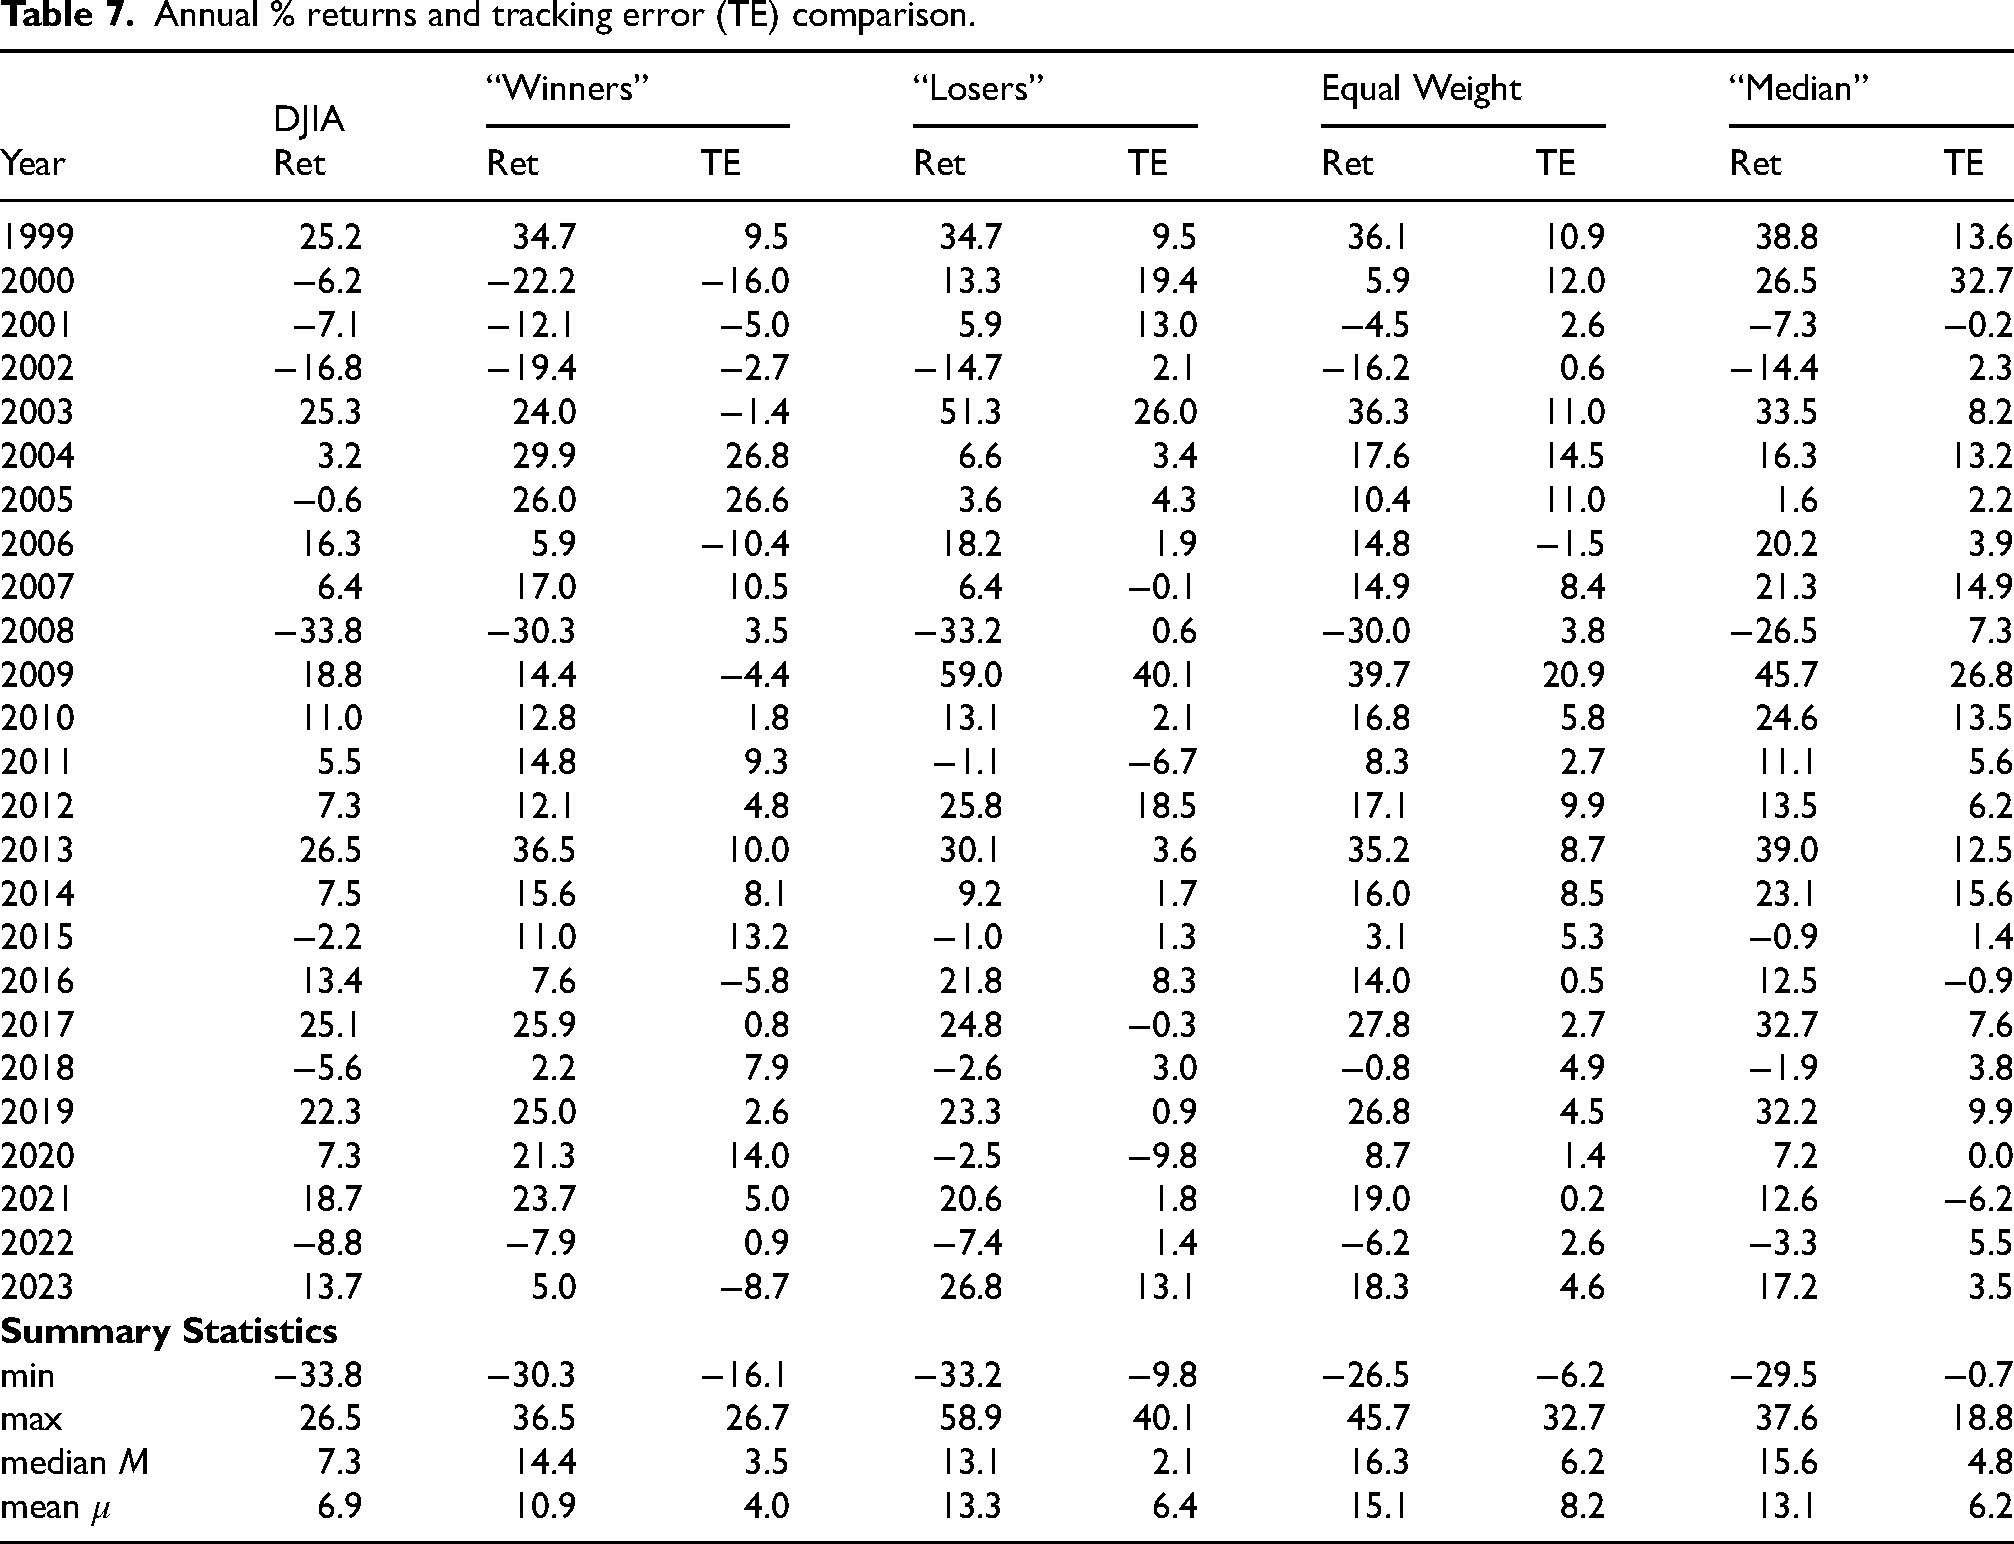
In 24 years, from 1999 to 2022, the proposed “median” rotation strategy had a higher annual return in 12 years, or 50% of the time. By contrast, the “Winners” strategy had the highest return in 7 years or about 30% of the time, and the “losers” strategy had the highest return in 5 years or about 20% of the time. In all 24 years, the “Equal-Weight” was never the best or the worst strategy. Moreover, the “Median” strategy” had the lowest annual return in only 2 years, whereas the “Winners” strategy had the lowest annual return in 11 years and the Losers” strategy had the lowest annual return in 12 years. Note that in 1999, both “winners” and “losers” had the same annual return of
We notice that the highest annual returns of 59.0% in 2009 and 51.3% in 2003 were achieved by the “Losers” strategy after huge market declines of 2001-2002 and 2008-2009. If we look at the median M of annual returns, the “median” strategy is the best at
If we compare our strategy by the mean
Finally, if we look at the lowest annual returns, we note that all of them happened in 2008. In that year, the proposed “median” strategy had a return of
The out-performance of the proposed re-balancing strategy can be better understood by examining several key factors. Firstly, the strategy’s focus on the middle slice of performers enables a diversified exposure to companies within the Dow Jones Industrial Average. This diversification reduces the risk of relying solely on top-performing stocks, which may be subject to higher volatility or temporary fluctuations. By including median performers, the strategy captures the potential upside of companies that have demonstrated consistent performance but may need to be noticed by traditional investment approaches.
Additionally, the regular re-balancing aspect of the strategy plays a crucial role in its out-performance. By reassessing and reallocating the portfolio at the end of each investment cycle, the strategy adapts to the current market conditions (Sharpe, 1994) and aligns the portfolio with emerging trends. This dynamic approach allows investors to capitalize on the performance potential of companies that may be positioned to outperform their past performance in the next market cycle. Regular re-balancing also helps to eliminate the tendency to hold onto underperforming stocks for too long or chase after overvalued high-performers, reducing the potential for significant losses.
Furthermore, relying on a simple rule of always investing the same amount in each stock in the middle slice of performers mitigates emotional biases. It promotes a systematic approach to investment decision-making. This helps investors avoid making impulsive or sentiment-driven choices that can negatively impact overall portfolio performance. Adhering to a clear and rules-based methodology provides a consistent framework that can be applied irrespective of market conditions or individual biases.
It is important to note that while the proposed re-balancing strategy has shown promising results, giving higher returns compared to the index, it may not always outperform in every market scenario Soomro and Haroon (2015). The strategy’s performance can be influenced by factors such as overall market conditions, sector-specific dynamics (Jareño et al., 2016), and macroeconomic trends Glandon et al. (2022). Therefore, investors should exercise caution and conduct a thorough analysis before implementing the strategy, considering their risk appetite and investment objectives.
In summary, the out-performance of the proposed re-balancing strategy can be attributed to its ability to diversify exposure, adapt to changing market conditions through regular re-balancing, and enforce a simple yet disciplined approach to investment decision-making. Understanding these factors provides insights into the strategy’s potential to achieve higher returns and mitigate risks associated with concentrated positions or emotional decision-making biases.
Comparison of “Median” with “Dogs of the Dow” strategy
Similar to common strategies like “Winners”, “Losers”, and “Equal Weight”, we also compare the “Median” slice strategy against the “Dogs of the Dow” (DoD) strategy that has been popular among many investors since the early 1990s (Domain, 1998; Dogs of the dow, 2024; Rowlett, 2012; Tissayakorn et al., 2013). The strategy is based on selecting high-yielding stocks from the DJIA at the beginning of each calendar year. “Dogs” refers to stocks with relatively high dividend yields, indicating that these companies may be temporarily undervalued. The strategy assumes that these high-yield stocks have the potential for future price appreciation, and investors can benefit from both dividend income and capital gains.
In Table 8 we compared the Dow Jones Industrial Average index against the Median strategy and Dogs of the Dow strategy for 24 years from 1999 to 2022 based on available data in Dogs of the dow (2024).
Comparison of returns with Dogs of the Dow (“DOD”) between 2000 and 2020.

In these 24 years, the “Median” strategy significantly outperformed the Dogs of the Dow Strategy with higher annual returns in 15 out of 24 years, or 63% of the time. The maximum annual return for the “Median” strategy was
Our strategy significantly outperforms the Dogs of the Dow. While the Dogs of the Dow strategy involves selecting high-yielding stocks at the beginning of each year, the Median Slice approach demonstrated adaptability and stability, emphasizing the median performers. The provided annual returns show how “Median” Slice strategy outperforms the “Dogs of the Dow” and the DJIA in terms of returns, affirming its potential as a compelling alternative for investors seeking a balanced, risk-aware investment strategy.
Comparison of maximum drawdowns between strategies
A crucial aspect in comparing strategies is the evaluation of risk. There are a number of measures for portfolio risks Fabozzi (1998). As indicated in the introduction, in this paper we focus on maximum drawdowns to assess the risk,
In Table 9, we compute annual maximum drawdowns for the Dow Jones index, “Winnders’, “Losers”, “Equal Weight” and the proposed “median” strategy.
Annual maximum drawdown (MDD) comparison.
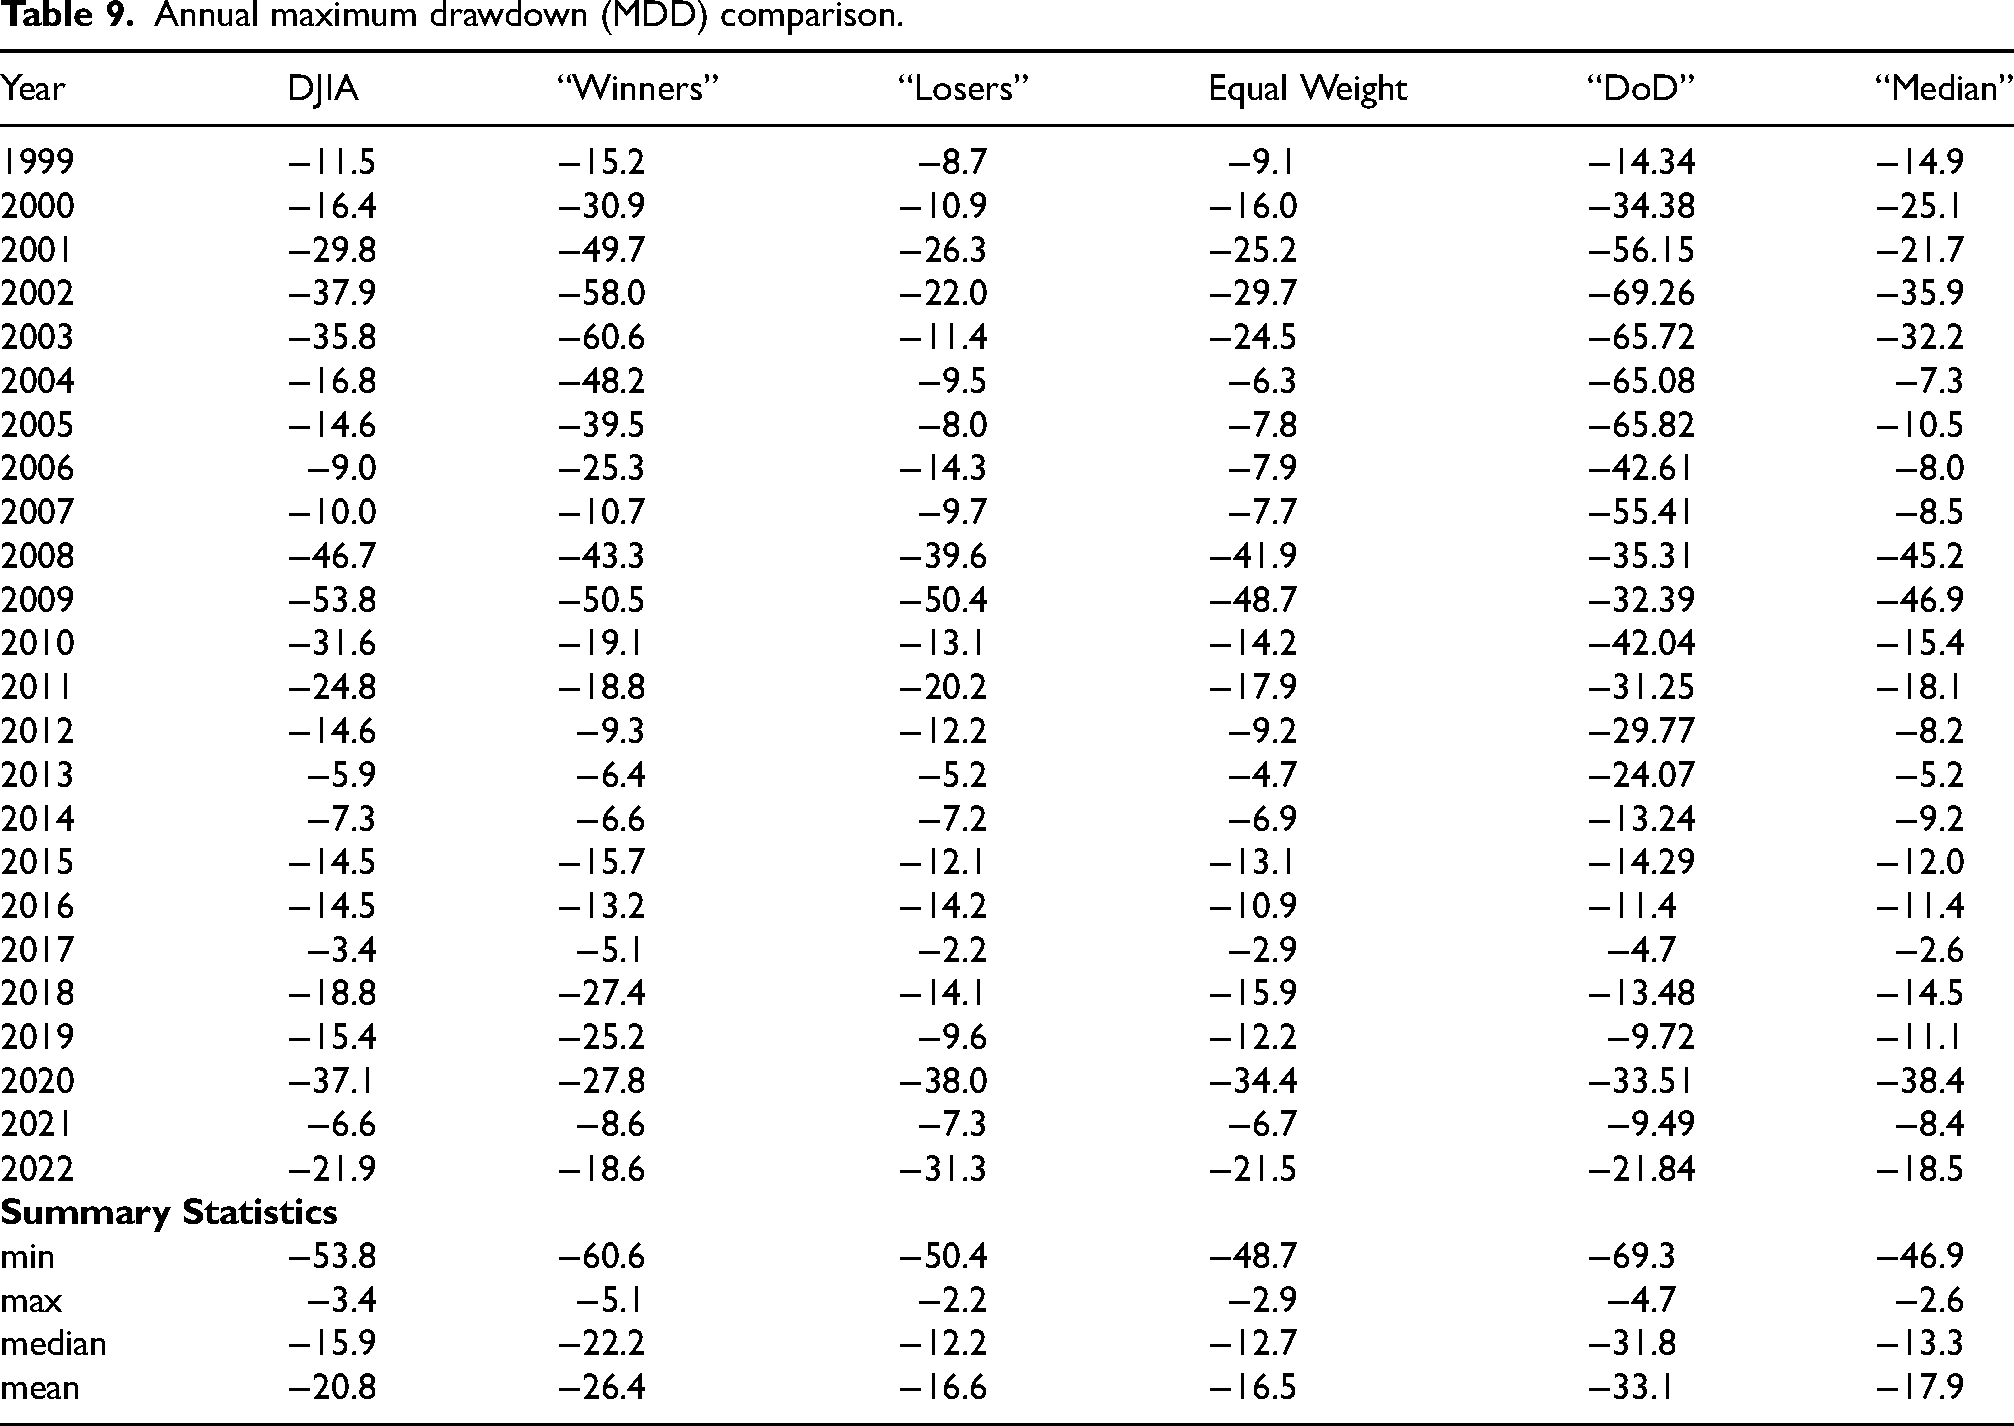
The “Median” strategy has the worst annual drawdown of
In combination with higher returns, we believe that this makes the proposed “Median” strategy superior to the other strategies, especially the “Dogs of the Dow” strategy, in terms of portfolio growth and maximum drawdowns.
In this research, a detailed examination of the maximum drawdowns was conducted to assess the relative stability and risk management capabilities of the proposed re-balancing strategy compared to the Dow Jones index. The maximum drawdown represents the largest decline in value experienced by the portfolio during a specific period, providing insights into the potential downside risk.
In the example explained in Section “Factor loadings”, we saw that Dogs of the Dow performed better in 2022, where it was the only one that gained profits. We can observe how the drawdowns are poor. The median strategy has the best risk profile, as shown in Table 9.
The comparative analysis of maximum drawdowns provides valuable insights into the risk management characteristics of the proposed strategy. By re-balancing the portfolio based on the middle slice of performers in each investment cycle, the strategy aims to mitigate the impact of underperforming stocks and potentially reduce the severity of drawdowns during market downturns.
However, it is important to acknowledge the limitations of analyzing maximum drawdowns in isolation. While they provide valuable risk information, they do not capture the entire risk profile of the strategy. Risk measures, such as volatility, downside deviation, or tail risk, should also be considered to comprehensively understand the strategy’s risk characteristics.
Additionally, it is essential to recognize that historical data was utilized for the analysis, and future market conditions may differ significantly. The performance and drawdown behavior observed in the past may not necessarily repeat in the future. Therefore, the findings should be interpreted cautiously, and ongoing monitoring and evaluation of the re-balancing strategy’s performance are necessary to ensure its continued effectiveness.
In conclusion, comparing maximum drawdowns provides valuable insights into the risk management capabilities of the proposed re-balancing strategy for Dow Jones constituents. The strategy demonstrates the potential to limit downside risk and preserve capital during market downturns. However, further analysis and consideration of additional risk measures are essential to comprehensively evaluate the strategy’s risk-adjusted performance and suitability for different market conditions.
Comparing different sizes of the median slice
One of the important questions to consider is choosing the size of the median slice. So far, we considered that slice to contain the middle
Returns were computed over the designated time frames. We defined drawdowns as the percentage drop from a peak value to the subsequent trough to gauge drawdowns. The maximum drawdown within each slice was documented to gauge the potential worst-case loss scenario, and we computed the tracking errors for each strategy versus the Dow Jones Industrial Average index.
In Figure 2, we computed the growth of portfolios when different sizes of the “Median” slice.
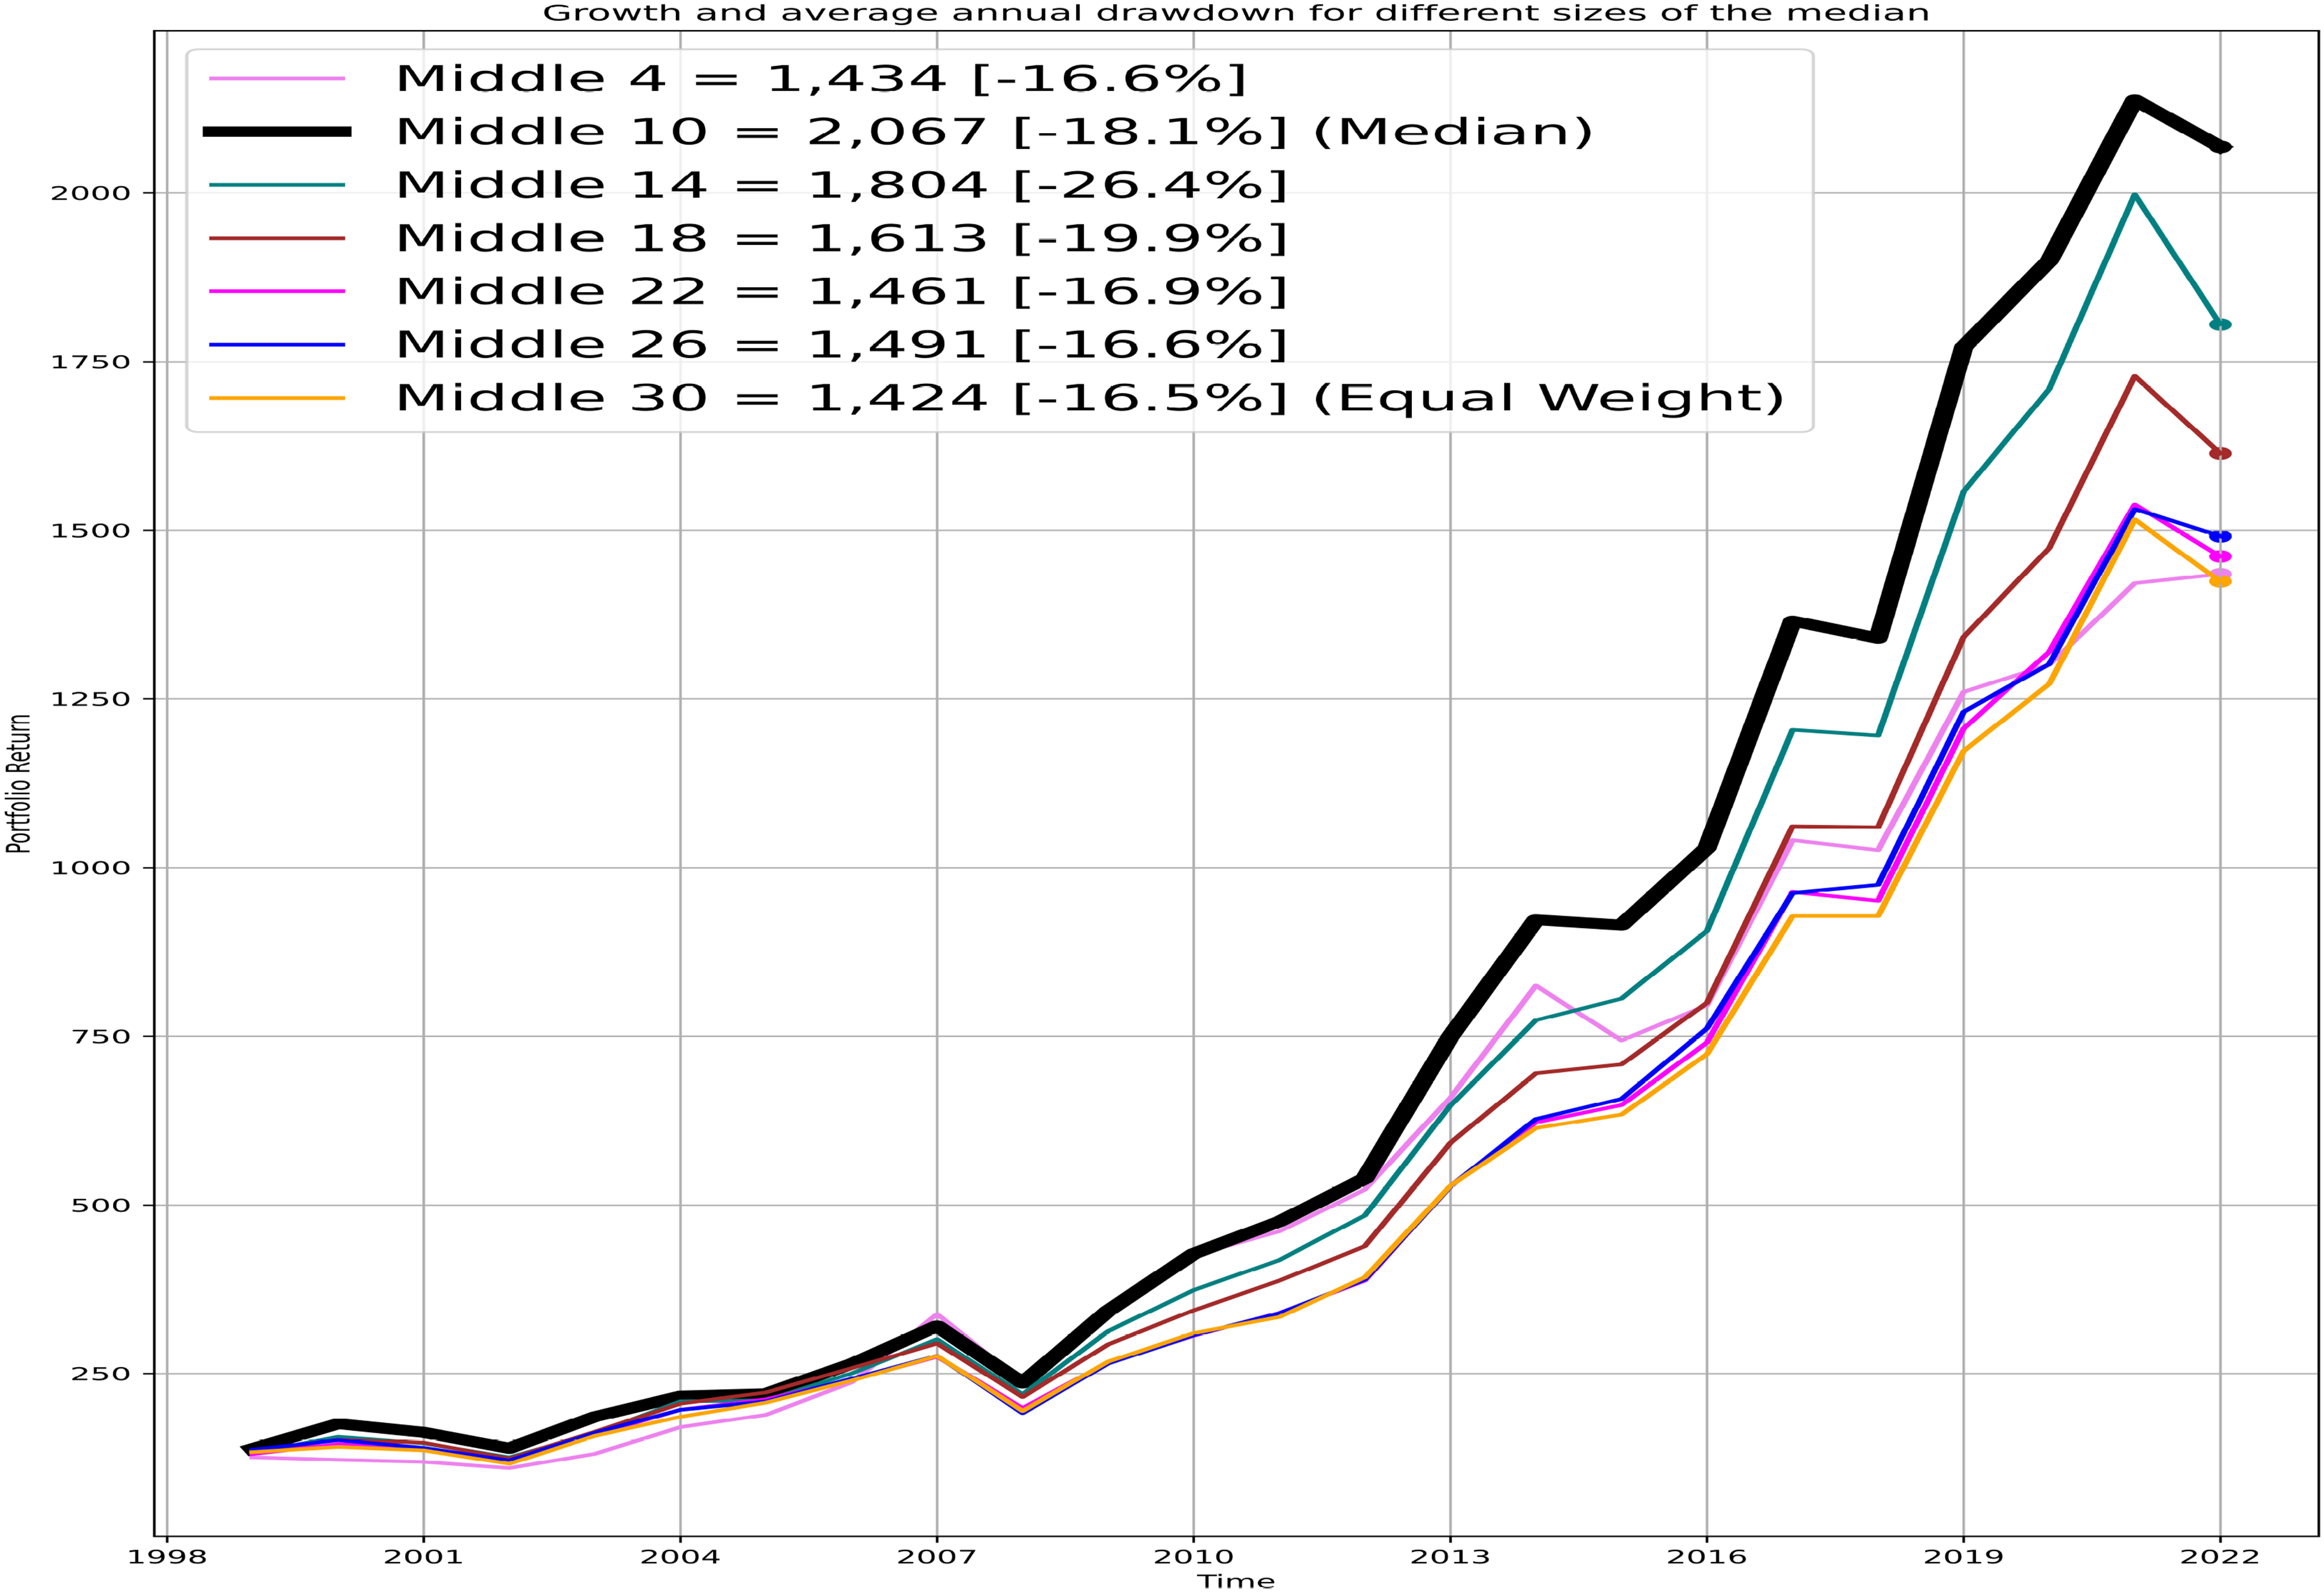
Comparing growth and average annual drawdown of median slices.
As we can see, the “median” slice of 10 stocks gave us the highest growth. As we increase the size of the “Median” slice, our performance converges to that of the “Equal Weight” with a small reduction in maximum drawdown. On the other hand, decreasing the size of the slice decreases the returns significantly with a decrease of maximum drawdowns. Therefore, we suggest using the middle 1/3 of the stocks as the “Median” slice. This rule gives a simple and consistent approach to investing.
We believe that our analysis uncovered insightful revelations regarding the optimal portfolio-slicing strategy within the DJIA components. By investigating slice sizes and temporal resolutions, one configuration consistently stood out: a slice size of 10 constituents, as highlighted in the black line in Figure 2. This slice size demonstrated exceptional promise in terms of both returns and drawdowns.
Comparison of strategies during market meltdown
In 2002, the financial markets faced significant challenges, with the dot-com bubble burst, causing widespread turbulence. All the strategies, including the median-based strategy, experienced negative returns during this period. However, the median-based strategy outperformed the Dow Jones Industrial Average (DJIA), which had the lowest annualized return of −16.8% Pagano et al. (2020). While it didn’t achieve positive returns, the median strategy’s performance was more resilient than traditional approaches that relied heavily on high-performing stocks.
In 2009, the global financial crisis significantly impacted the markets. Traditional strategies like “Winners” and “Losers” experienced mixed results, with “Losers” posting a notably high return of 59.0%. However, the median-based strategy performed exceptionally well, with an annualized return of 45.7% with the lowest maximum drawdowns, surpassing the Dow Jones Industrial Average (DJIA), which had a return of 18.8%. The strategy demonstrated its ability to generate substantial returns during a crisis by focusing on median performers, who had shown consistent but not exceptional performance.
The COVID-19 pandemic and economic uncertainty marked the year 2020. During this challenging period, the median-based strategy focused on the middle ground of asset performers. While “Winners” achieved a respectable 21.3% return, the median strategy and the Dow Jones Industrial Average (DJIA) posted returns of 7.2%, demonstrating the strategy’s resilience and stability in the face of a global crisis. The strategy effectively balanced returns and risk, offering investors a reliable option in a year marked by economic turbulence.
Analysis of re-balancing frequency
The proposed strategy involved re-balancing on an annual basis. We investigated the effect of choosing shorter time-periods for re-balancing: monthly, quarterly and half-yearly. The results are shown in Figure 3.
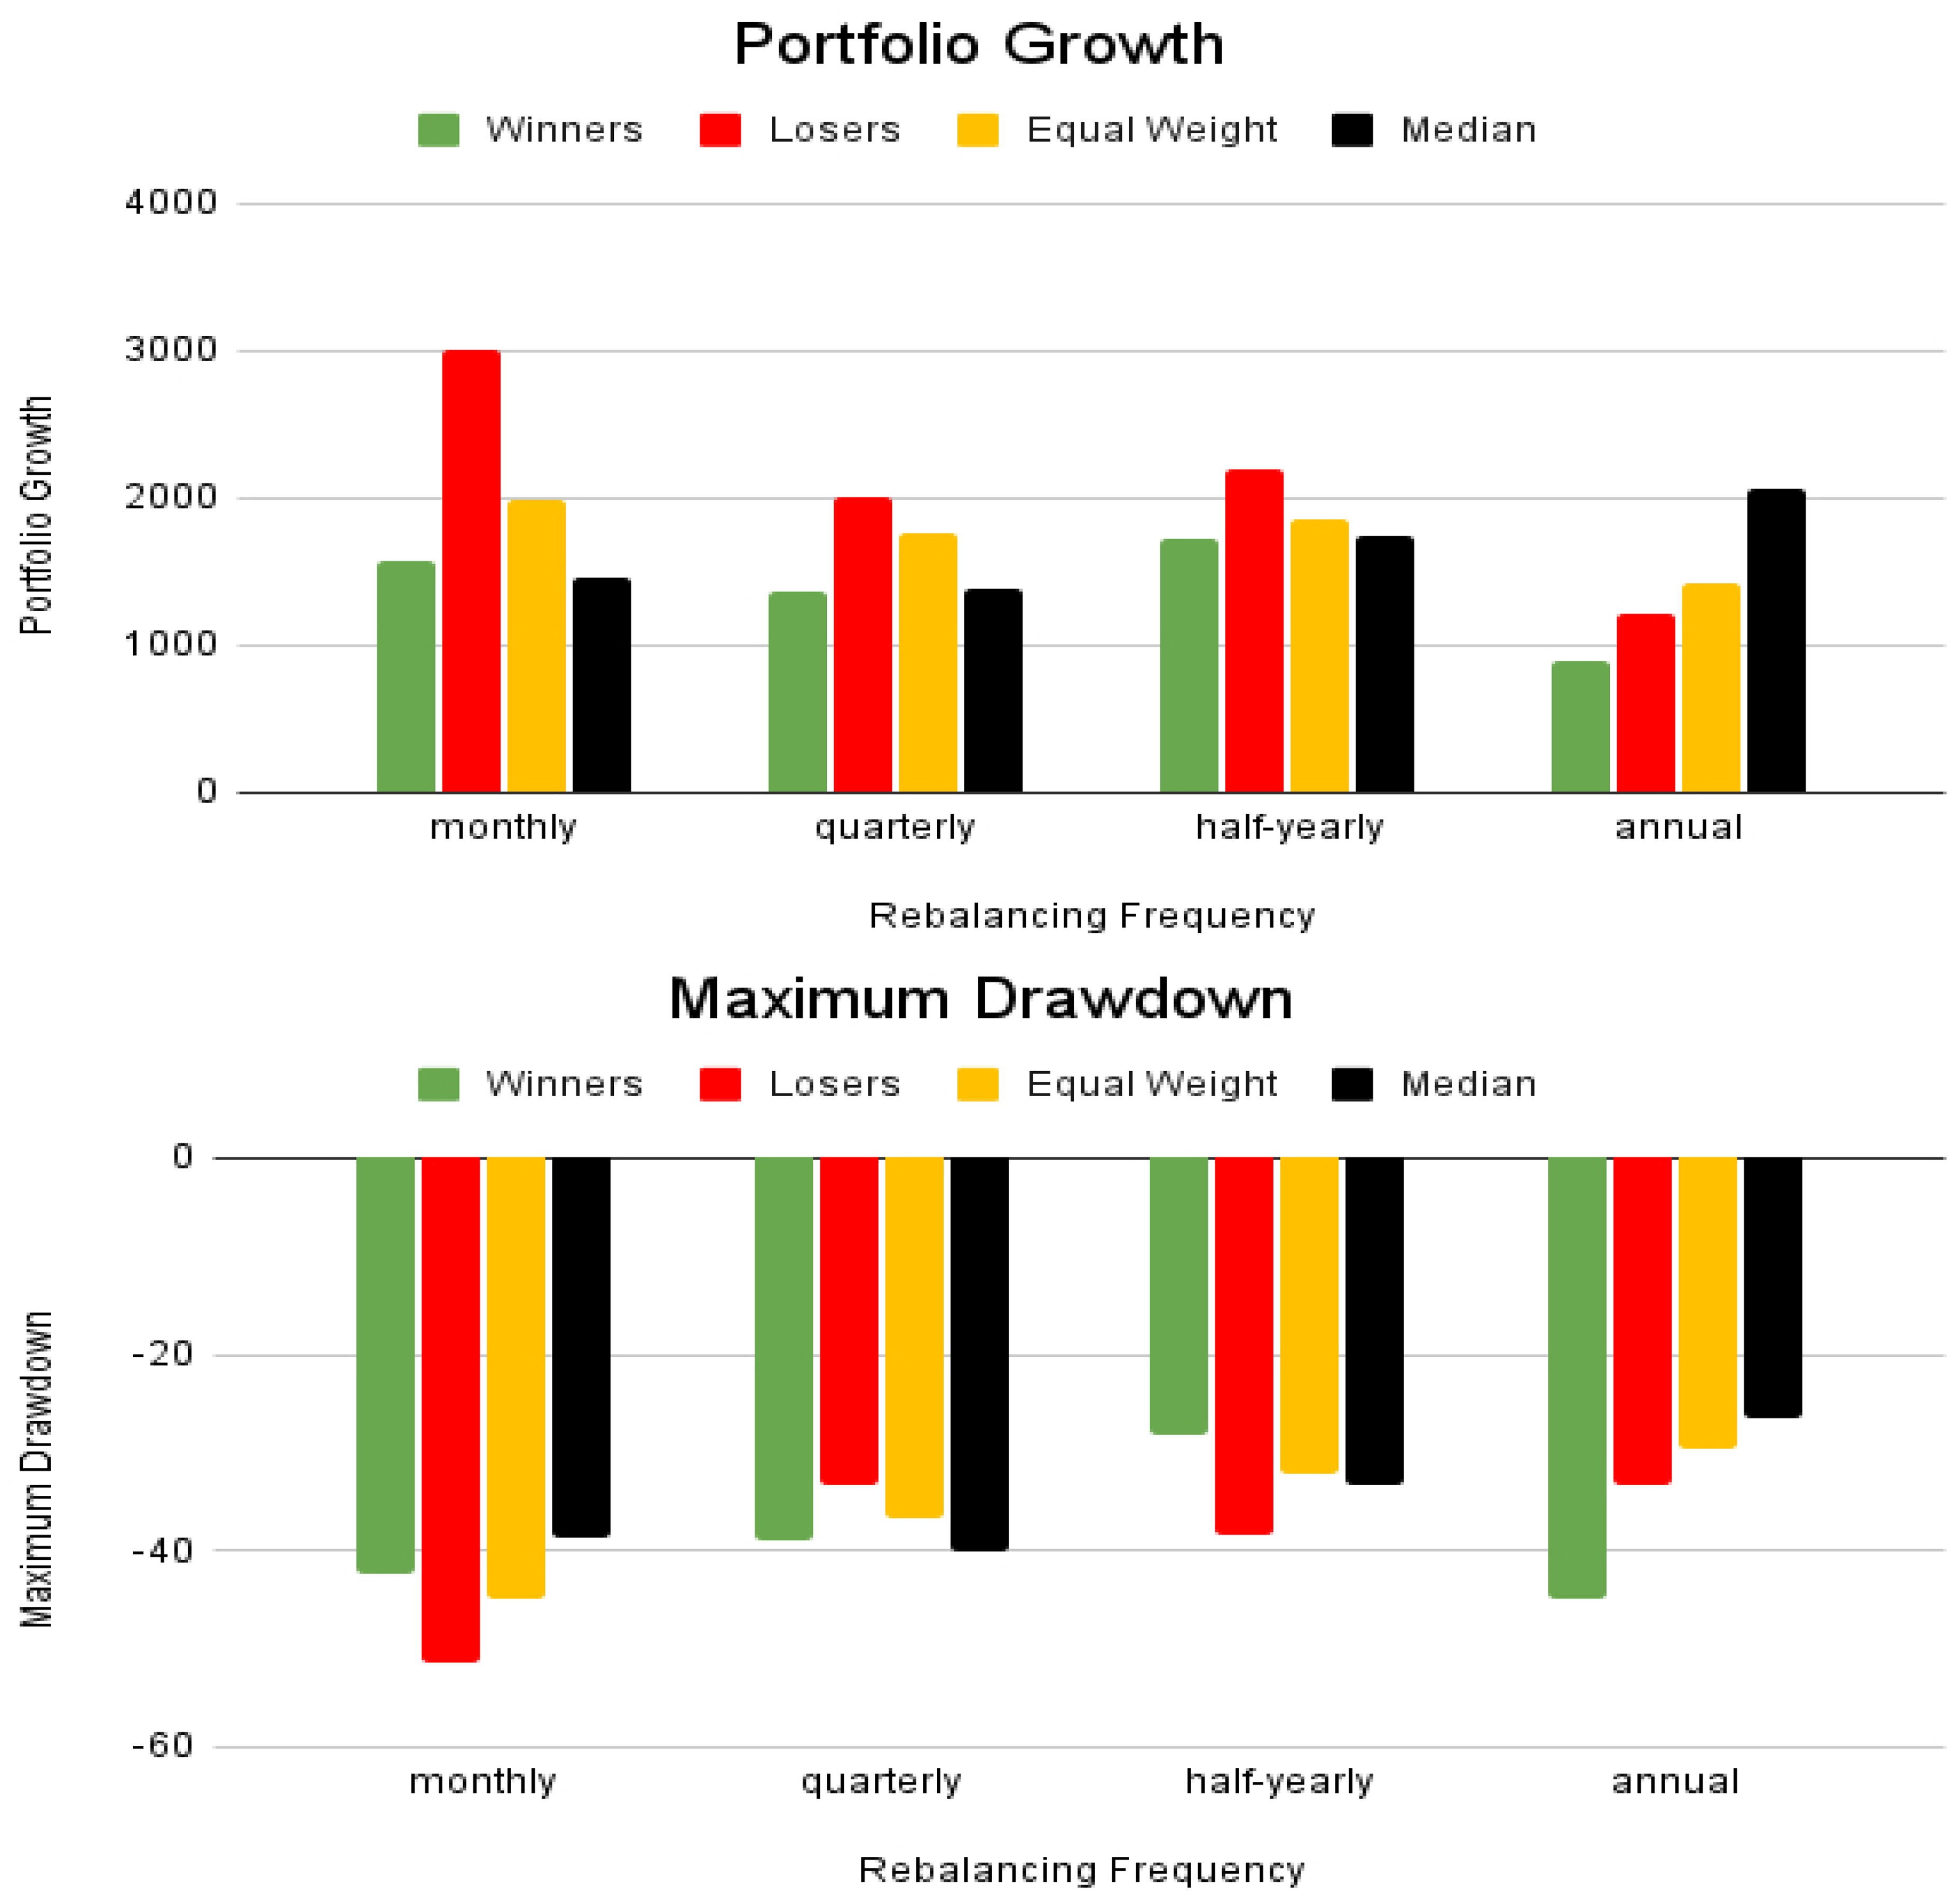
Growth and drawdown comparison.
As we can see, the proposed “median” rotation strategy does not perform well at higher frequency of re-balancing. For example, the “Losers” strategy significantly outperforms the “median” strategy with monthly re-balancing (more than twice the growth: $3,014 for “Losers” vs. $1,469 for “median”) but with higher drawdowns (
As we increase the time-period for re-balancing, we see that both, growth and maximum drawdowns for the “median” strategy improve and are better than other strategies when re-balancing is done annually. Such a time frame is attractive for average investors who typically re-balance their portfolios once a year.
Summary comparison of strategies over different time-frames
Let us compare how different investment strategies perform over various periods. The tables cover five different time frames: 3 years, 5 years, 10 years, 15 years, and 20 years.
We start by comparing the returns. This is shown in Table 10.
Annual returns over last 3, 5, 10, 15, and 20 years for various strategies.
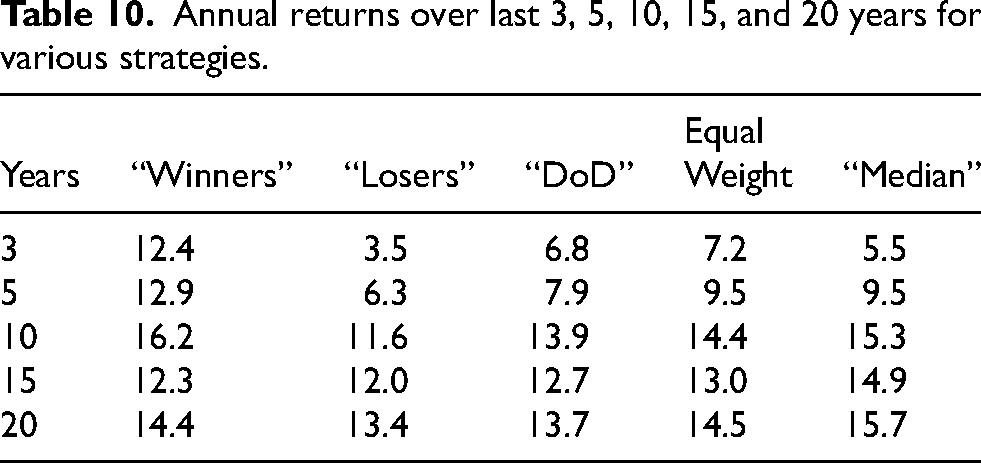
As we can see, over a long horizon (15 years or above) the proposed “Median” strategy significantly outperforms the other strategies. Therefore, the “Median” strategy is a long-term strategy.
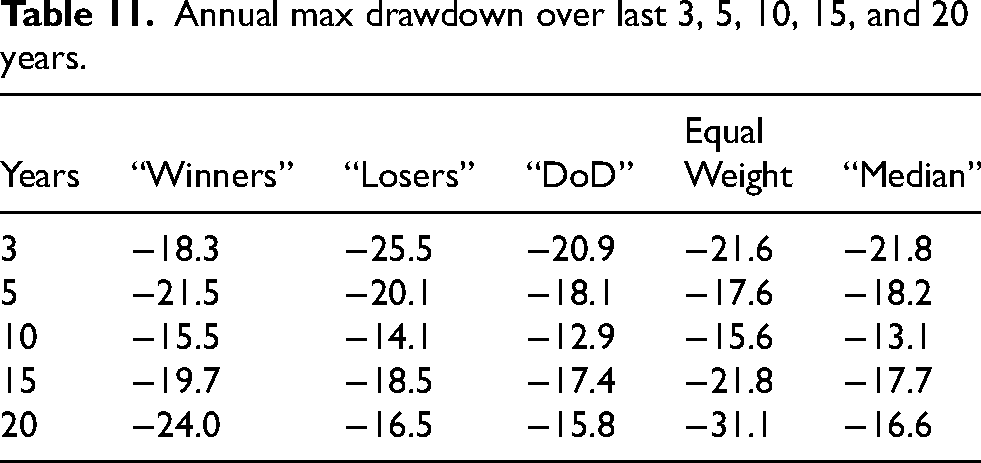
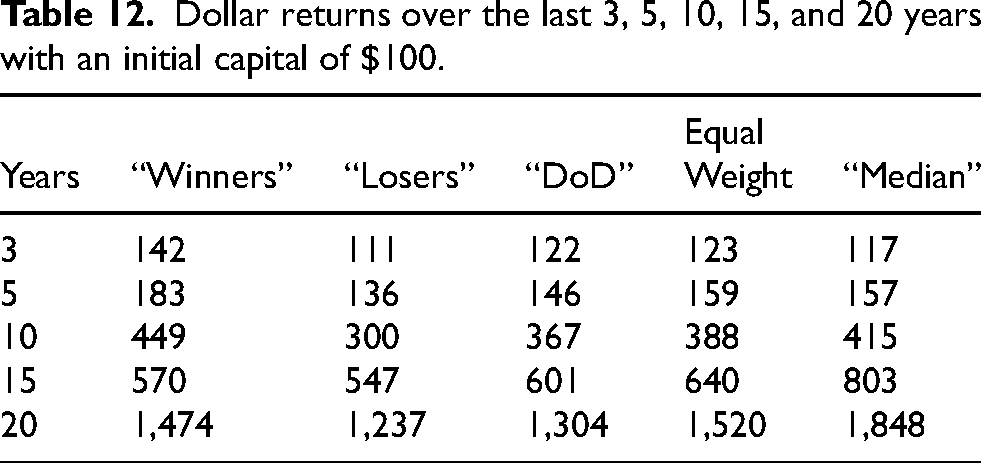
Next, we look at the Drawdowns of these strategies as shown in Table 11. Again, we see from Table 11 that the “Median” strategy has better drawdowns than other strategies when taken over longer time-horizon. Finally, in Table 12 we show the growth of $100 investment over different time periods. As seen in Table 12, the difference in final amounts by the “median” strategy becomes more significant over a longer time horizon.
Annual max drawdown over last 3, 5, 10, 15, and 20 years.
Dollar returns over the last 3, 5, 10, 15, and 20 years with an initial capital of $100.
The data reveals distinct trends across the examined time frames. Over a shorter duration, winners exhibit stronger performance, outpacing both “Losers” and “Dogs of the Dow”. Notably, the “Median” strategy consistently positions itself as a stable benchmark throughout the analyzed periods. it should be looked at as a “long-term” strategy.
Comparison of sector counts and weights
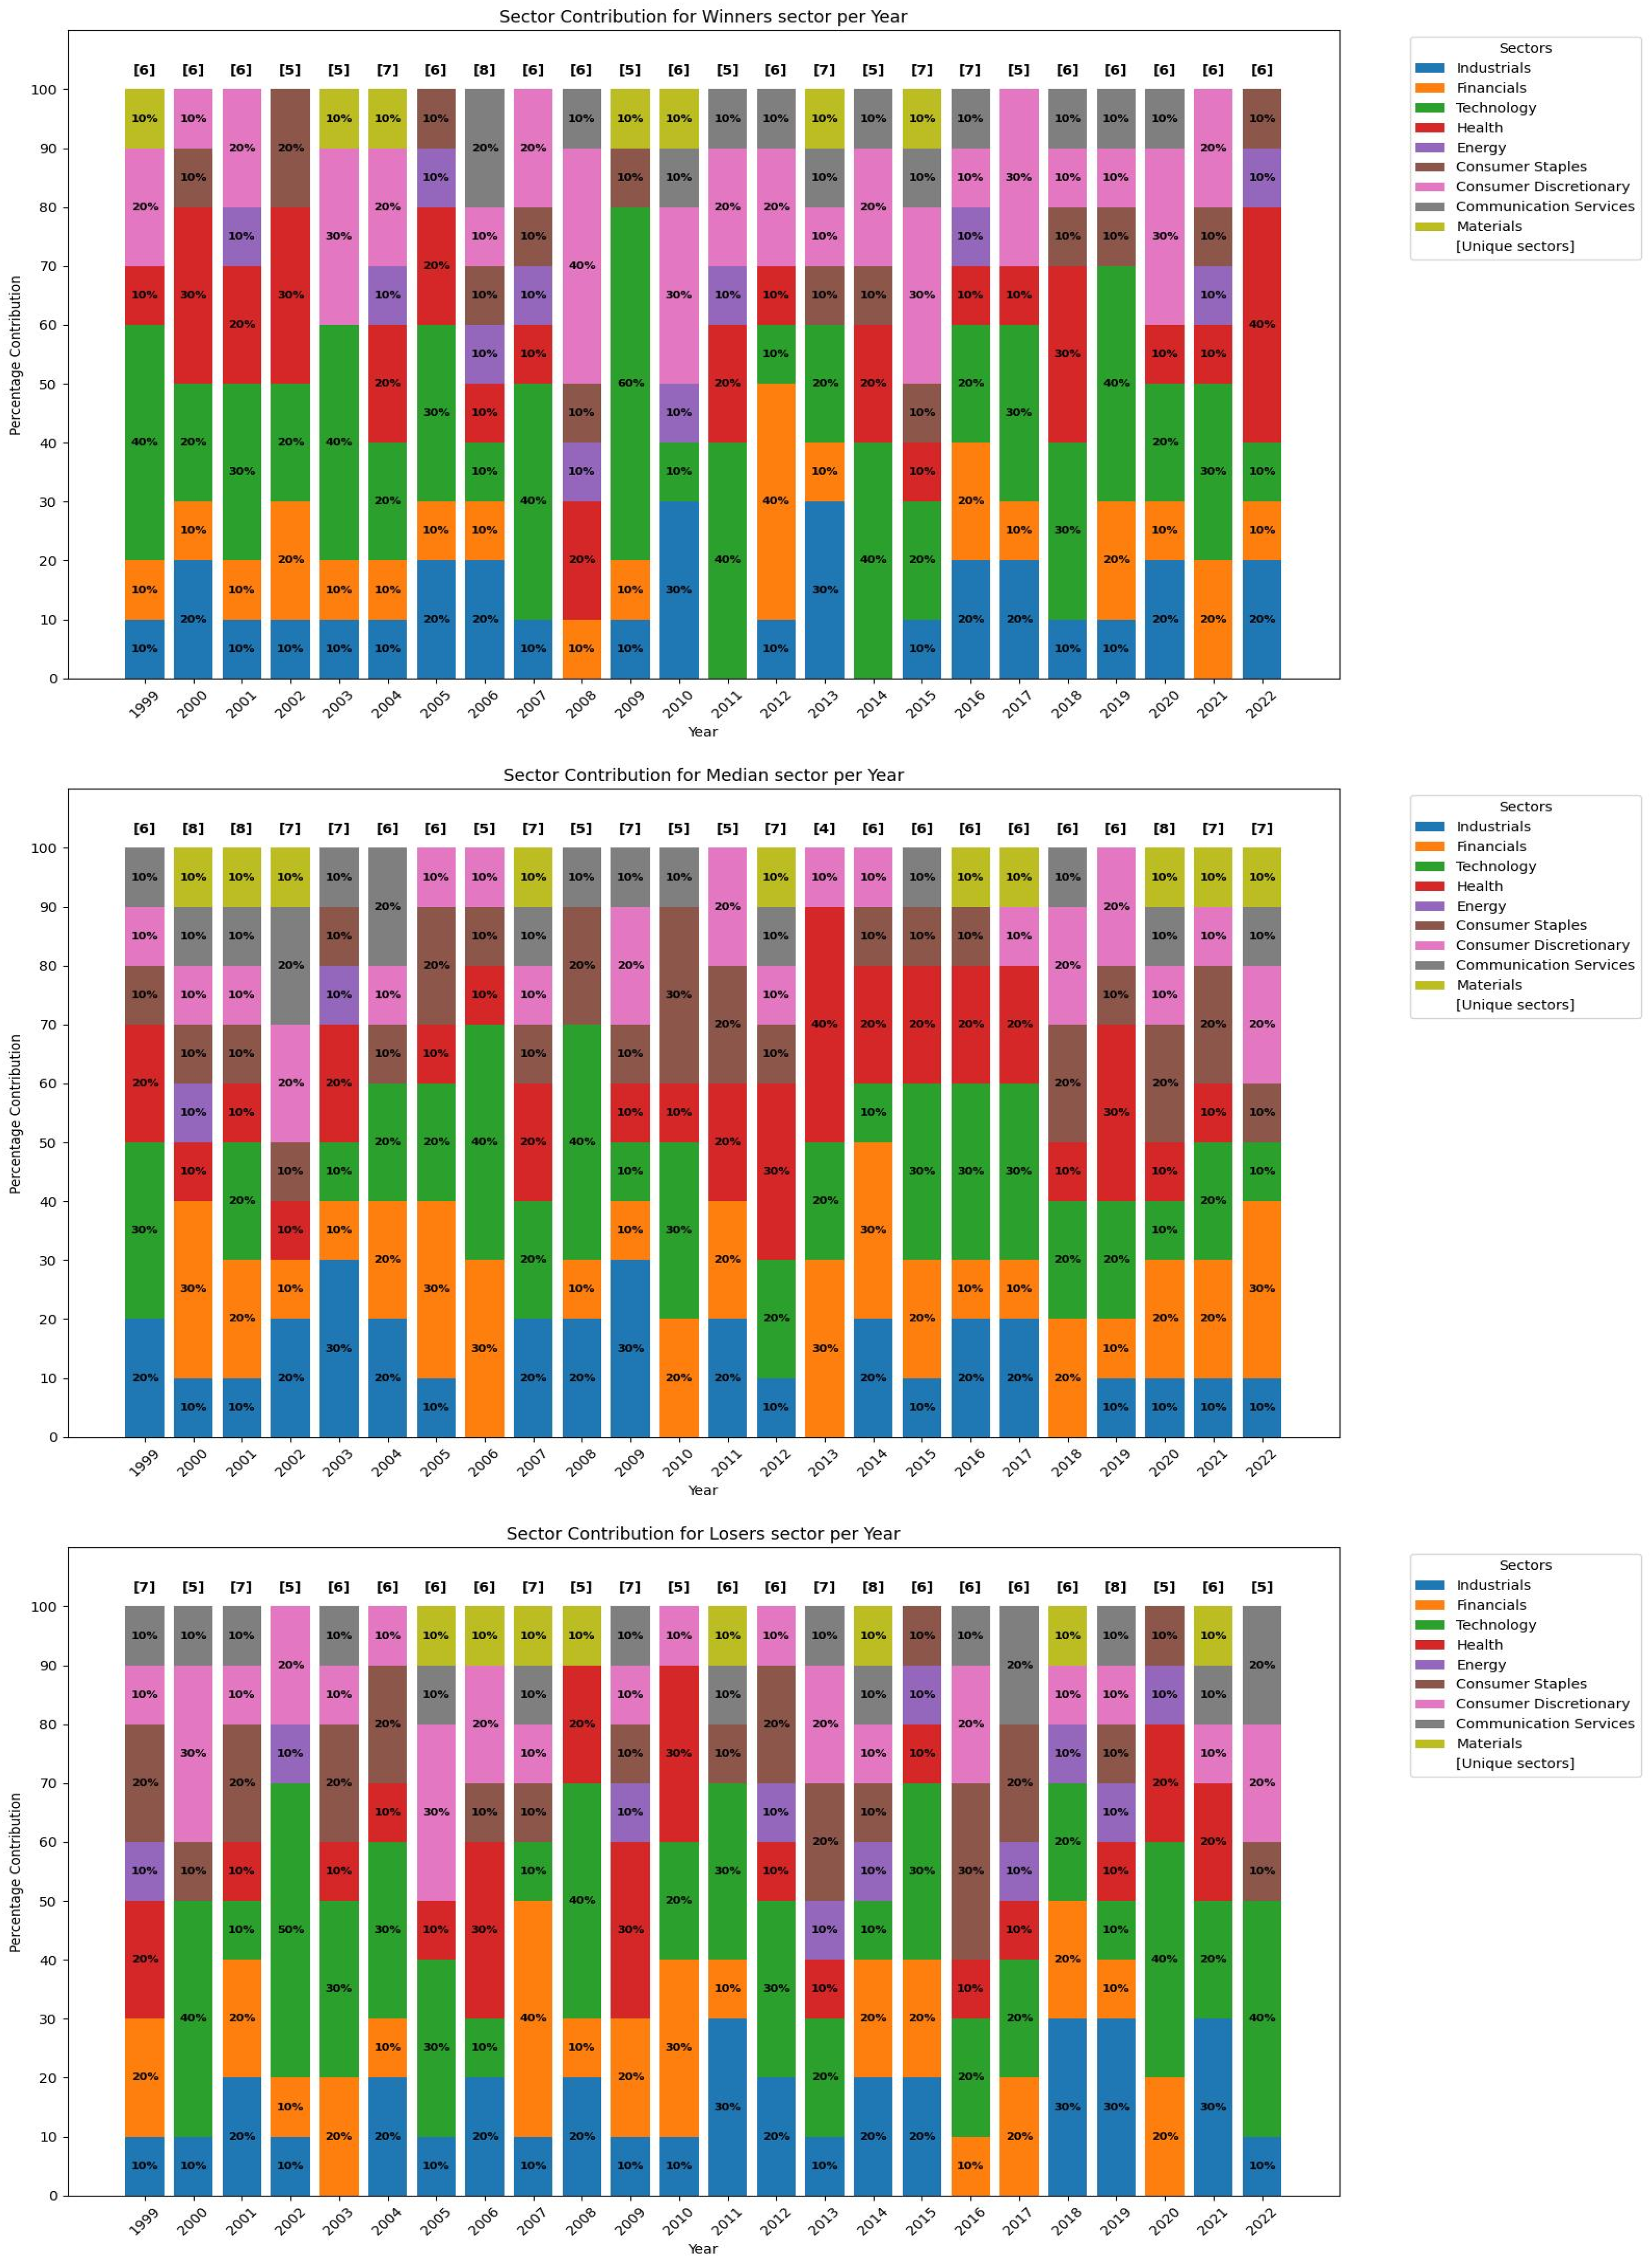
We start by comparing the number of sectors used in each strategy. This is shown in Figure 4.
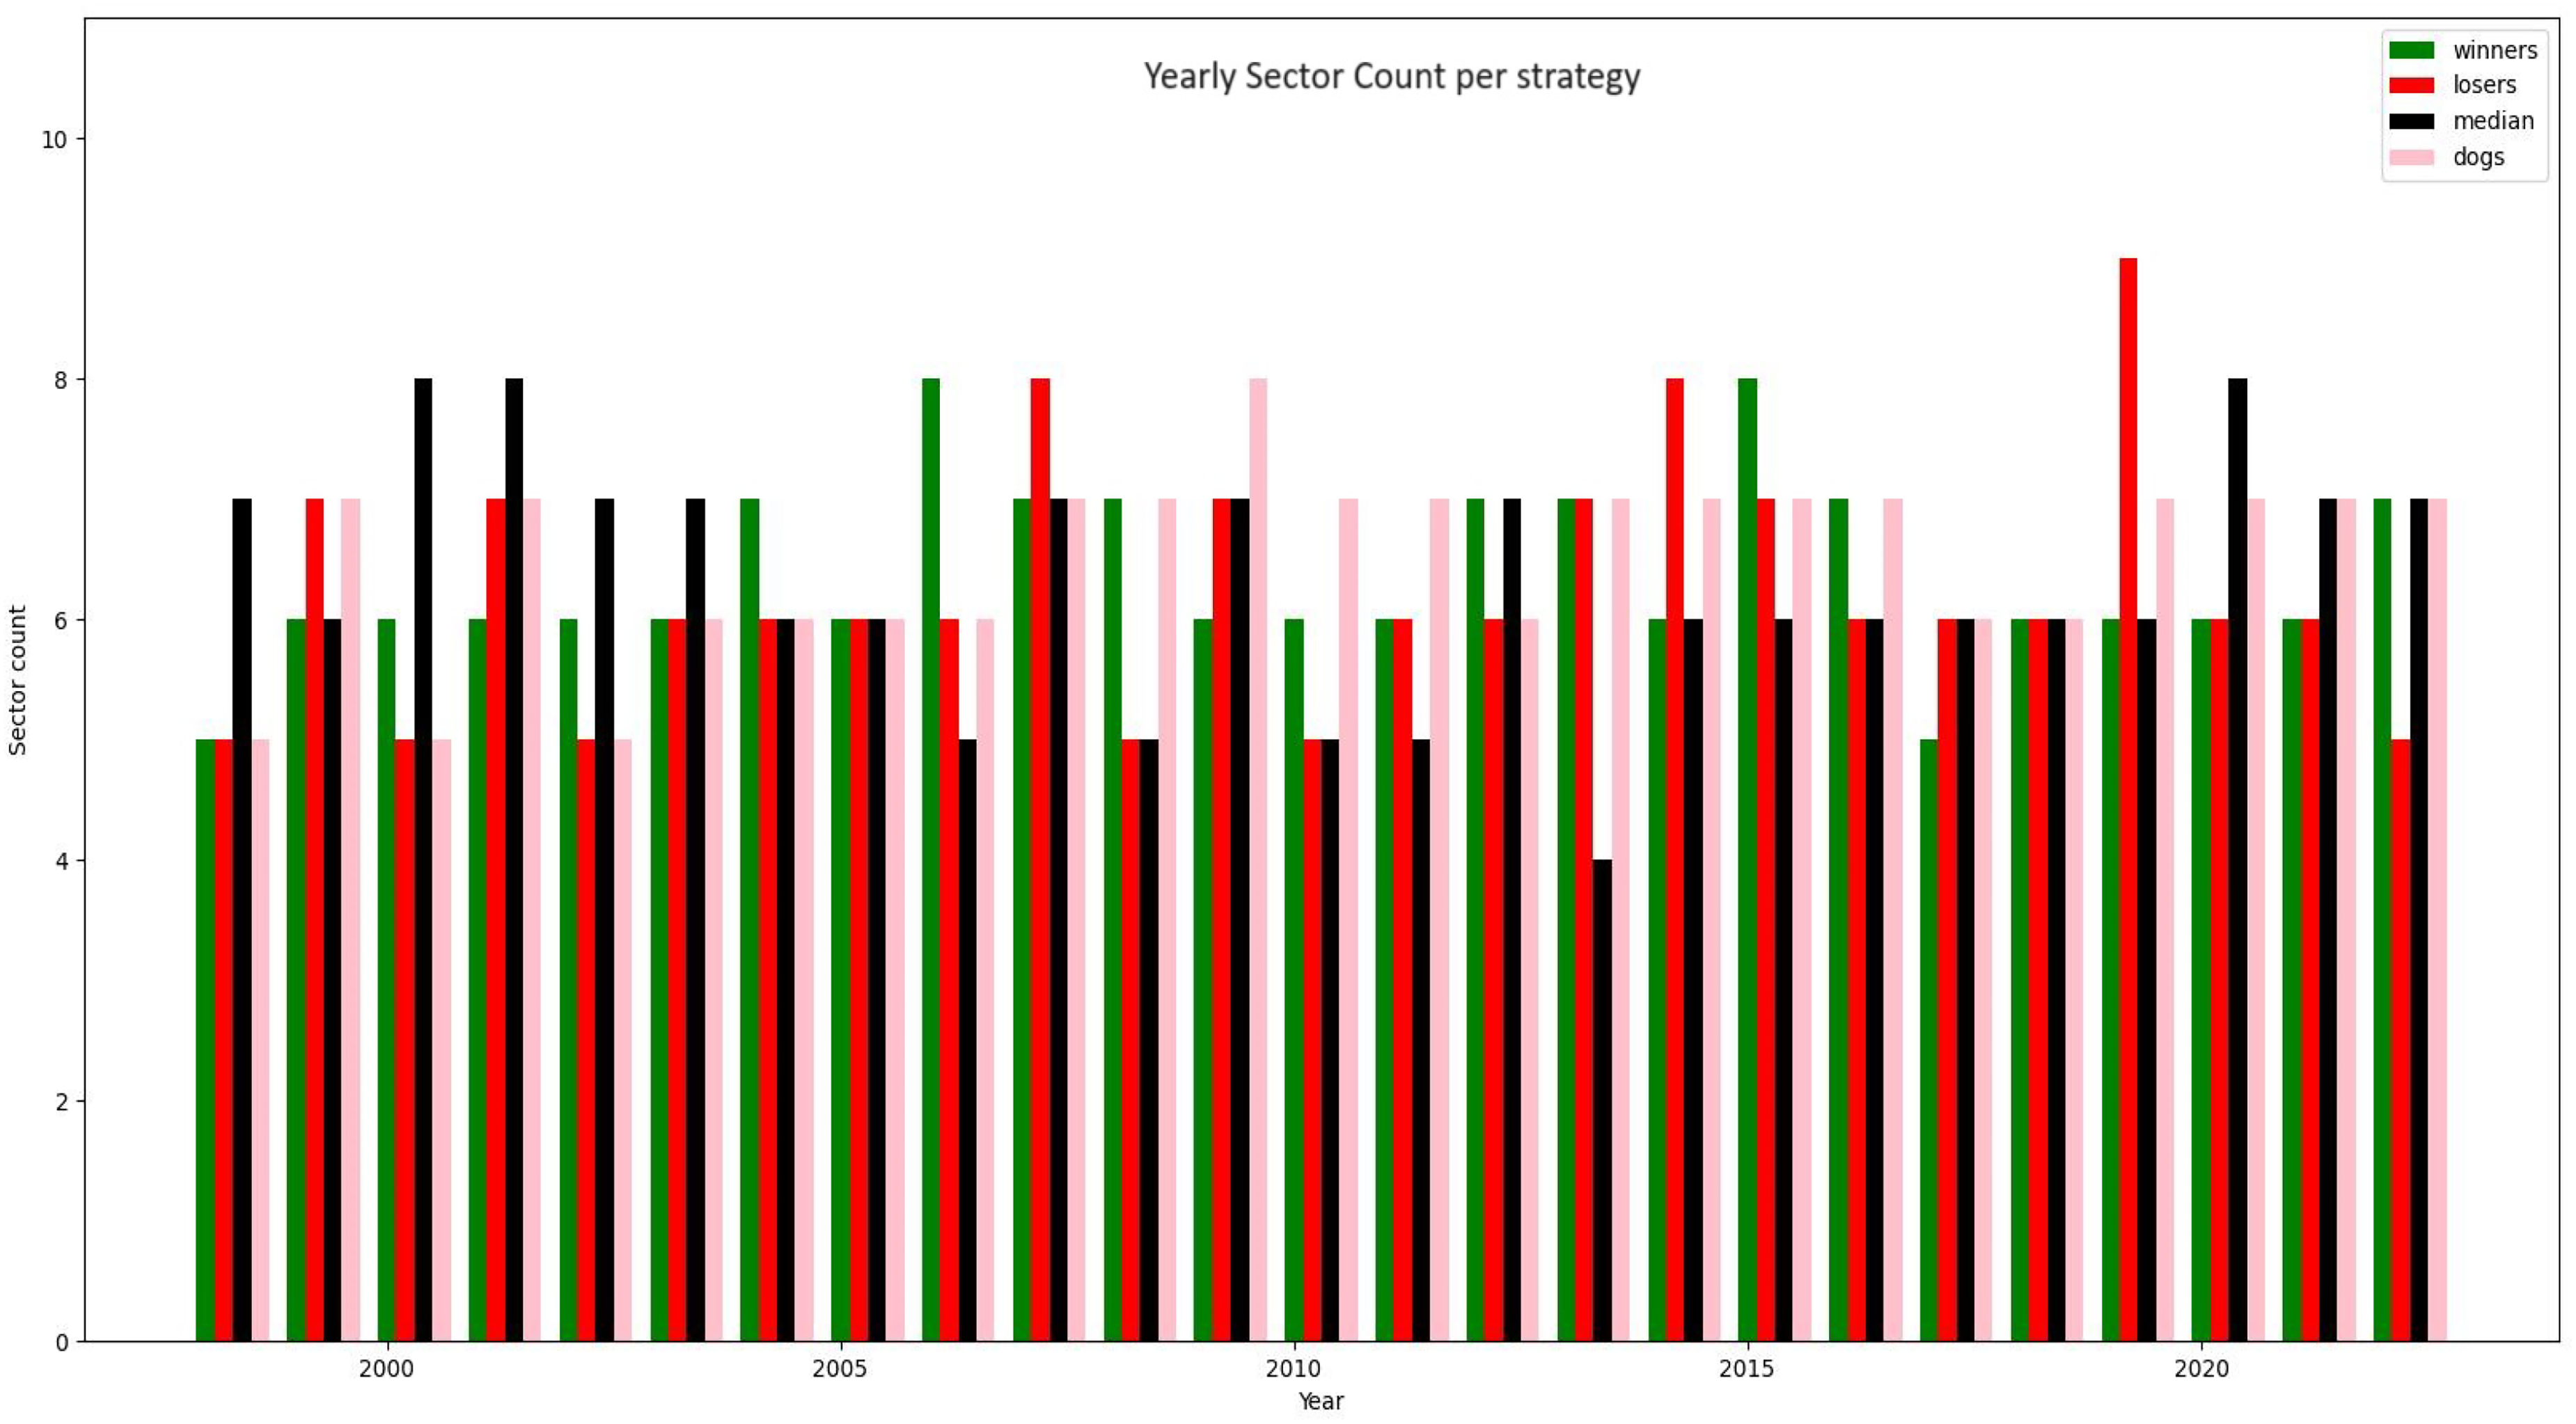
Annual sector counts for strategies.
For the passive buy-and-hold investing in Dow Jones or S&P-500 we used all strategies. For the “Winner”, “median”, “loser” and “Dogs of the Dow” we have the following statistics of Sector counts summarized in Table 13 From 13 we see that there is not much difference in the number of sectors (“factors”) used by strategies. The “Dogs of the Dow” strategy uses most sectors on the average and has the least standard deviation. This suggests that this strategy uses more sectors, and the number of such sectors is not as volatile as for other strategies, which have practically identical statistics.
Comparison of average sector counts (1999–2023).

Next, we can examine differences and similarities between average sector weights of the “winner’, “median”, and the the “loser,” strategies for 1999–2022. This is illustrated in Figure 5 and the details of these weights (including ‘Dogs of the Dow”, Dow Jones, and S&P-500) are presented in Table 14.
Detailed sector counts for winners, median, and losers strategy.
Comparison of average sector weights (1999–2022).
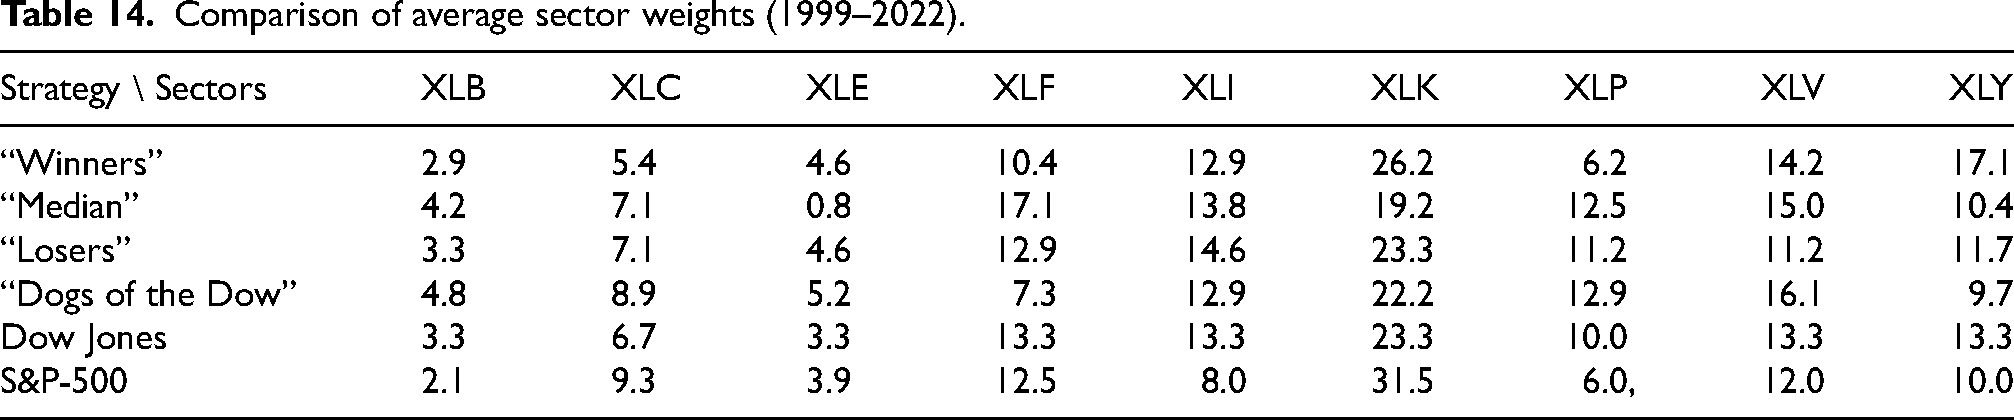
As can be seen from both the from Table 14 and Figure 5, most of the average sector weights are similar across strategies. For the median strategy, one noticeable exception is much lower exposure to the technology sector (XLK) than other strategies or passive index investing. Since technology is highly volatile and has a very large weight in indices, our strategy successfully balances this sector volatility by a decreased factor exposure. Another interesting observation is the very low weight of the energy sector. This sector has only one stock (ExxonMobil - ticker “XOM”) in the recent composition of the Dow, just like the basic materials sector (Dow Chemicals - ticker “DOW”) but its appearance in the median strategy is much lower. This can probably be explained by the higher volatility in annual returns of the energy stocks.
Finally, we can compute the matrix 
Fama-French factor exposures analysis
In this section, we analyze the returns of our strategies in the context of the 3-factor Fama-French model. The Fama-French model describes the returns in terms of the following factors:
To apply the model, we proceed as follows: for every year we take the daily values for the three factors available from the Kenneth R. French - Data Library:
We proceed as follows. For each factor i, consider the term
Percent contribution to strategy returns by 3 Fama factors.
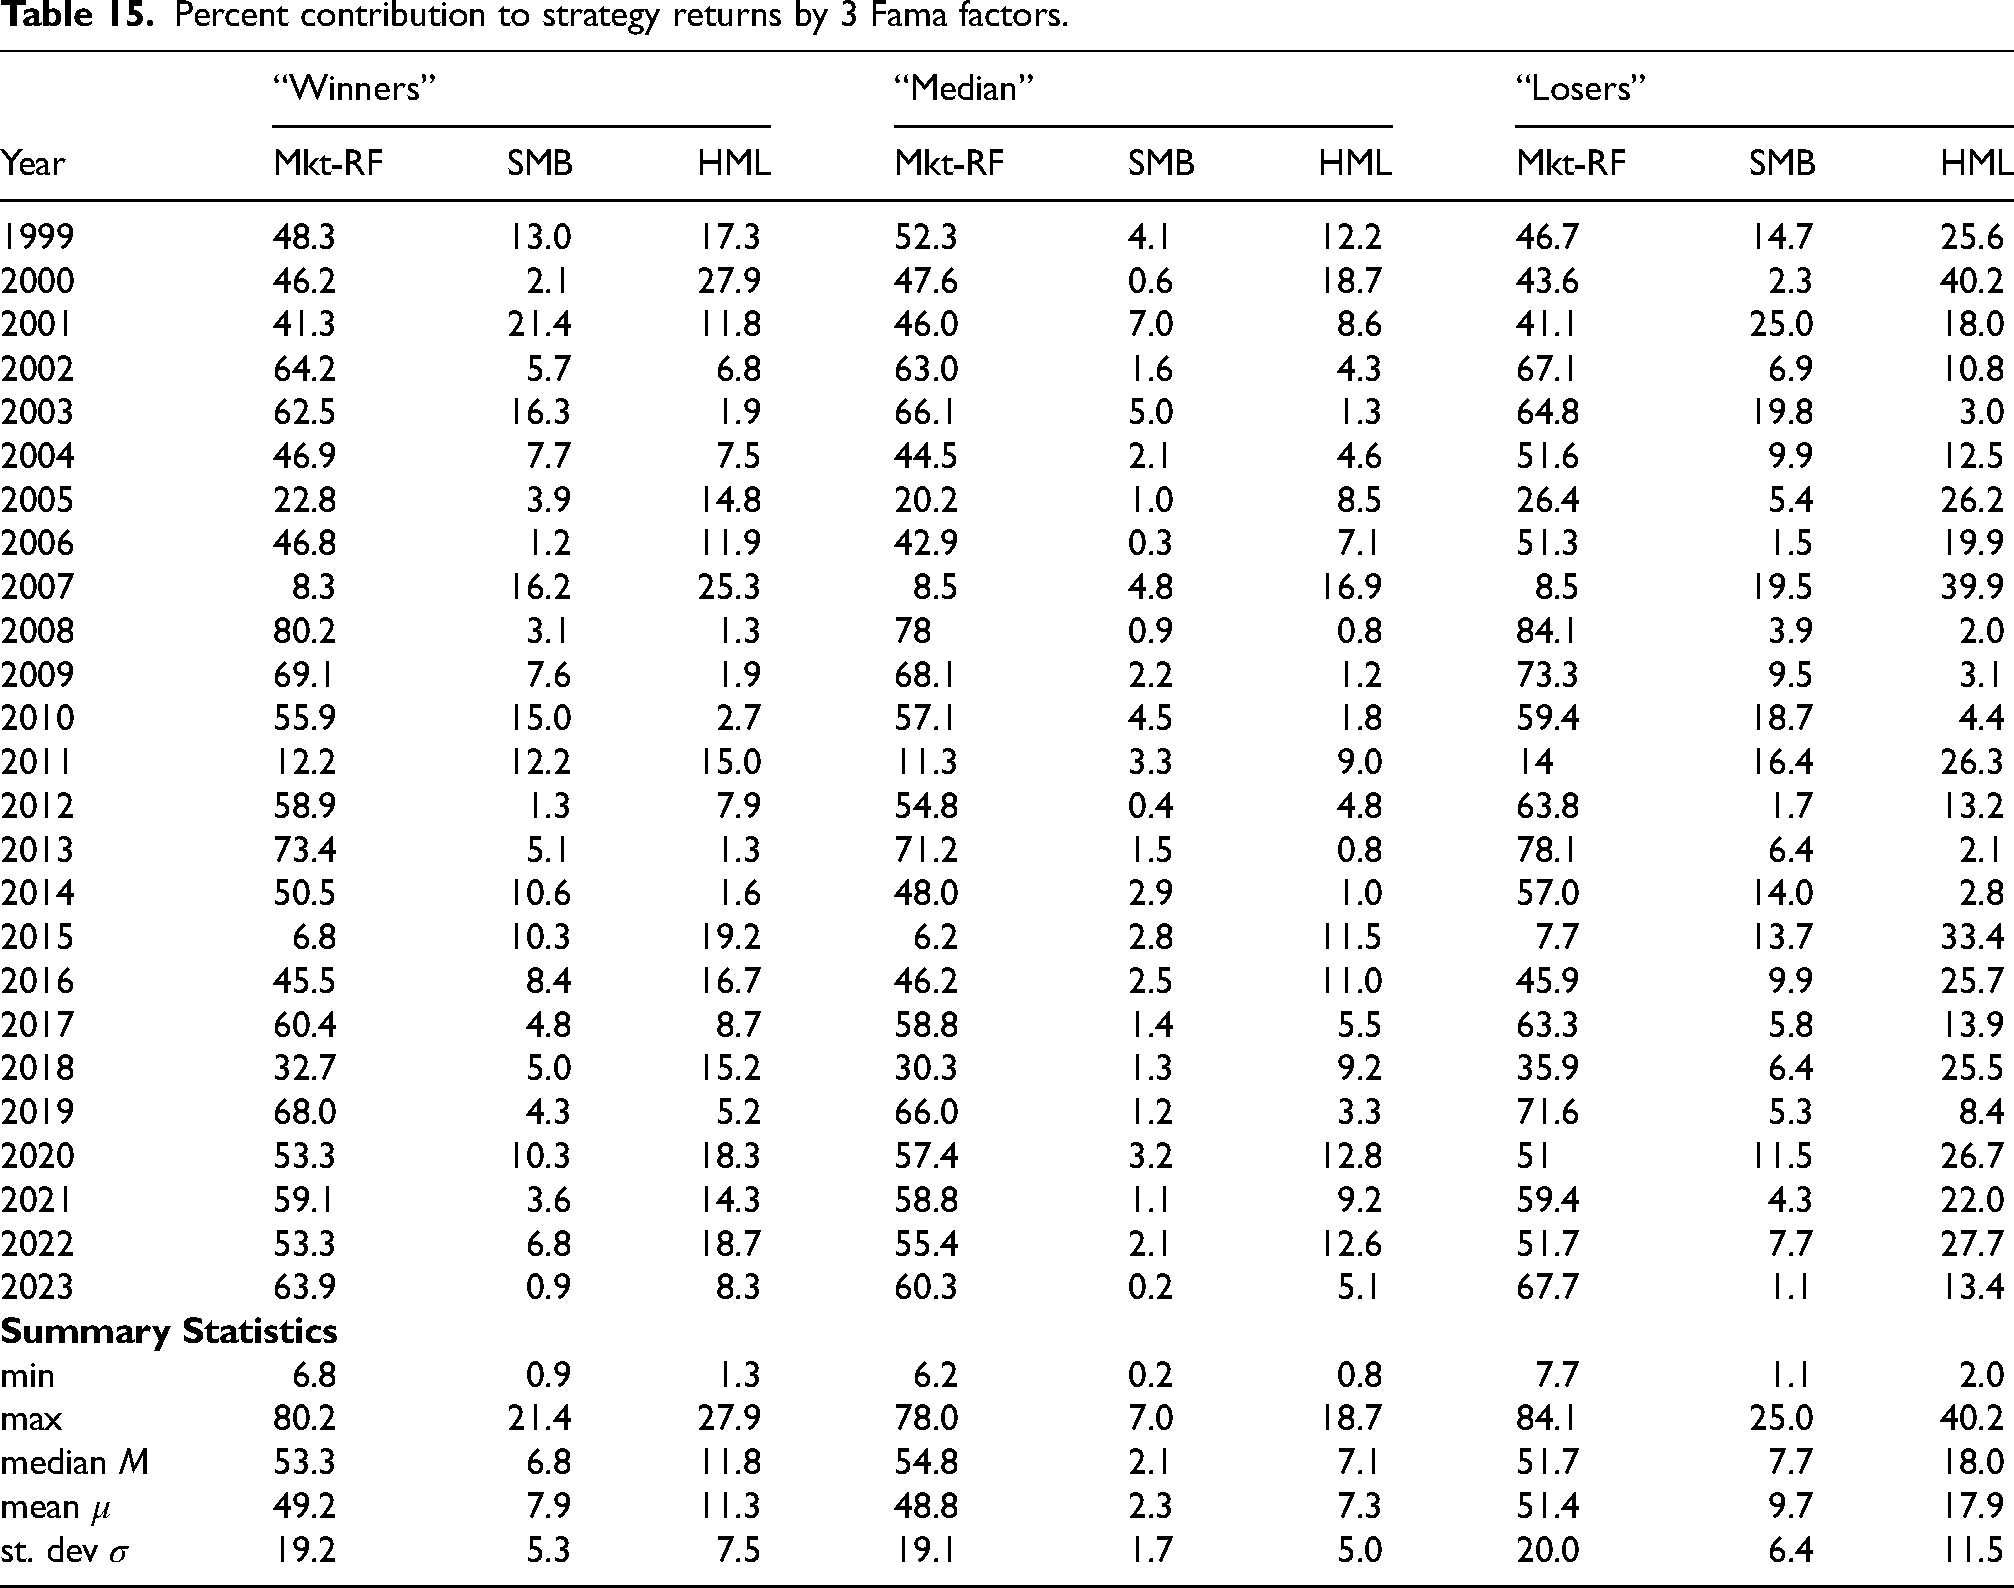
In Figure 6 we show the annual contributions of Fama factors in to the annual returns of “Winner”, “Median” and “Loser” rotation strategies.

Contribution of French Fama factors.
As we can see, the total contribution of the three factors to returns is the highest for the losers rotation strategy, based on a quick comparison of the mean and median values (about 70–75%), followed by “Winners” (about 65–70%) and the “median” rotation (about 60%). Of the three rotation strategies, the return of the median strategy is least explained by the three factors. Of the three factors, the market risk factor is the most significant, and its contribution to each strategy is about the same, at about 50%. According to this model, only 50% of the returns of the strategy can be explained by the market.
If we examine the contributions of the other two factors: SMB (“Small Minus Big”) and HML (“High Minus Low” factor) then we see that their contributions are different for each strategy. The SMB factor has minimal contribution to the median rotation strategy (around 2%) and the HML factor only around 7%. The contribution of these two factors are more significant for “losers” and “Winners” rotation strategies. The most striking difference is almost 20% contribution from HML factor for the “Losers” strategy. We should note that by construction, the “losers” strategy invests in companies with the lowest returns from the previous year and the “winners” strategy invests in DOW components with the highest returns from the previous year compared to other components of the Dow Jones. Perhaps these “winners” and “losers” companies experienced larger percentage change in their book values and that in turns, could explain their higher percentages in return attribution of strategies.
Finally, it is interesting to examine the factor exposures during and in the aftermath of a major market meltdown such as 2008-2009 financial crisis. In 2008, the three factors explained 85% of the return for the “winner”, 80% for the “median” and almost 90% for the “losers” strategy. Most of these contributions are attributed to Market Risk Factor, with practically negligible contributions from the other two factors.
Discussion
Our research introduces a fresh perspective on portfolio re-balancing. Rather than just looking at top and bottom performers, we focus on the middle ground—the median slice of asset performance. Through studying the Dow Jones Industrial Average (DJIA), we have presented a simple re-balancing strategy that targets this middle segment. Our results indicate that it can increase returns while lowering risk (measured by maximum drawdowns) substantially if this rebalancing is done frequently (more than annually). short time frames.
Our analysis compares our median-based re-balancing strategy with a DJIA index benchmark and with a broader S&P-500 index. Results consistently reveal our strategy’s outperformance, delivering higher returns and lower drawdowns. This, in combination with the simplicity of our strategy, should appeal to stability-seeking investors.
Why is our strategy attractive when we rotate once a year but not as attractive when we decide to rotate more frequently?
Our intuitive explanation is based on the following analogy. 1 Imagine that our 30 stocks in the index are athletes, and their current coach represents the market conditions. This coach decides that the best sport is swimming and that all athletes should train for swimming. Some athletes do well, some do poorly, and some are in the middle. After some time, there is a new coach, representing changed market conditions. This new coach decides that the best sport is basketball and that now all athletes should train for basketball. Many top swimmers may not perform well in basketball, but perhaps the middle tier of athletes can adjust the best. Market conditions do not change overnight but could take some time, after which the middle group of athletes can outperform the best and the worst in the previous sport. The proposed strategy of focusing on the median performs well after market changes occur. It is, therefore, a long-term strategy when re-balancing is not done too frequently, such as once a year.
This analogy and our comparison results provide valuable insights for investors seeking to optimize their portfolios based on different time frames, offering an understanding of the performance dynamics of the strategies over time. Our median re-balancing strategy is a long-term strategy that is very simple to implement. The strategy diversifies exposure, adjusts to market changes through regular re-balancing, and promotes simple, disciplined, rule-based decision-making. Equal weight investing in the median slice of stocks balances returns and drawdowns, making it appealing for risk-aware investors.
Conclusion
In this paper, we presented a simple portfolio re-balancing strategy. The strategy involves equal-weight investing in the portfolio’s median third (by performance) segment. This strategy is simple to implement by any self-directed investor, is explainable, and provides better returns and lower drawdowns than strategies focusing on winning or losing assets.
We strongly believe that the simple median rotation strategy described in this paper for the Dow Jones index works well in different markets and for different indices. It can be easily implemented by an average investor and offers a simple approach to higher returns and lower drawdowns than passive index investing or trying to predict economic cycles and future winners. We plan to extend our work to consider other indices, including international stock indices, fixed-income instruments, and commodities.
Footnotes
Author contributions
Both authors contributed equally to the effort.
Funding
The authors received no financial support for the research, authorship, and/or publication of this article: This research was conducted without any external funding. All aspects of the study, including design, data collection, analysis, and interpretation, were carried out using the resources available within the authors’ institution.
Declaration of conflicting interests
The authors declared no potential conflicts of interest with respect to the research, authorship, and/or publication of this article.
Data availability
All the relevant data, Python code for analysis, detailed annual tables and graphs are available via: