




Abstract
The severe X-linked degenerative neuromuscular disease Duchenne muscular dystrophy (DMD) is caused by the loss of dystrophin through reading frame disruptive mutations in the DMD gene. Dystrophin protein is crucial for the stability of the muscle. Targeting specific exons with antisense oligonucleotides (ASO) will prevent inclusion of the exon during pre-mRNA splicing, which can restore the reading frame, facilitating the production of partially functional dystrophin proteins. For DMD, four ASOs of the phosphorodiamidate morpholino oligomer (PMOs) chemistry are FDA approved. It is anticipated that improved delivery to skeletal muscle and heart will lead to larger therapeutic results. With our research, we sought to identify muscle-homing peptides that can achieve increased delivery of ASOs to muscle or heart when conjugated to PMOs. We applied in vivo phage display biopanning mouse models for DMD to identify muscle-homing peptides while simultaneously negatively selecting peptides that home to unwanted organs, such as the kidney and liver. After confirmation of the muscle homing ability in vitro, we conjugated selected candidate peptides to PMOs to be tested in vivo, where we found that conjugation of one specific muscle homing peptide led to significantly improved delivery to muscle, with a small improvement in exon skipping and dystrophin restoration.
Introduction
Currently, over 20 RNA therapeutics have been approved by the respective governmental bodies in different countries to use as clinical treatment for different diseases. Antisense oligonucleotides (ASO) are one of the tools included in the arsenal of the oligonucleotide strategies. 1 These include eteplirsen, golodirsen, casimersen, and viltolarsen for the treatment of Duchenne muscular dystrophy (DMD). 2
DMD is a rare X-linked degenerative neuromuscular disease. Muscle wasting generally presents itself already in early childhood. 3 There is biochemical evidence of muscle damage too, presented by creatine kinase (CK) leaking from the muscles into the bloodstream, which is used as a diagnostic marker in Duchenne patients.4–5 Other molecules that are elevated in serum are alanine aminotransferase (ALT), aspartate aminotransferase (AST), and lactic dehydrogenase (LDH). These enzymes are generally thought of as markers for liver damage, but are also abundant in muscle and can be used as biomarkers of muscle damage as well. 6 With progressive muscle loss during their lifetime, these patients ultimately die prematurely from cardiac or respiratory failure, commonly in their late twenties, although current standards of care have improved life expectancy up to the 4th decade.7–9
DMD is caused by the lack of dystrophin protein in muscles. 10 Dystrophin is involved in stabilizing and protecting muscle cells during contraction by connecting the cytoskeleton with the surrounding muscle fibers’ extracellular matrix. 11 Without dystrophin, muscle fibers are more susceptible to contraction-induced damage, leading to chronic inflammation. Eventually, regeneration fails, and damaged fibers are replaced by fat and fibrotic tissues, which is accompanied by loss of muscle function.12–13
The lack of dystrophin is a result of mutations, mainly deletions, in the DMD gene that prevent the production of functional dystrophin. 10 When deletions maintain the open reading frame, this is associated with Becker muscular dystrophy (BMD). This muscle-wasting disease is milder with a later onset of symptoms and slower progression. Based on this finding, exon skipping therapy uses ASOs to restore the mRNA reading frame for patients with DMD, to allow the production of an internally truncated but partially functional dystrophin protein, similar to that observed in the patients with BMD.14–15 Despite the approval of four exon skipping ASOs for DMD, there is potential for further advancements, as currently approved ASOs induce low levels of dystrophin, and higher levels may lead to a larger therapeutic effect.16–17 The ASOs that are currently approved are of the phosphorodiamidate morpholino oligomer (PMO) chemistry. One of the limitations of these PMOs is low bioavailability and limited delivery to skeletal muscle and heart tissue. However, the neutral charge of the PMO chemistry has the advantage of easily facilitating conjugations of peptides or other conjugates. Like so much research has been undertaken on conjugates to improve the delivery of this therapeutic to the target tissue of interest. 18 Cell penetrating peptides (CPPs) have been studied most extensively.19–20 The use of CPPs enhances tissue infiltration and cellular uptake of PMO therapies, however, their positive charge can lead to renal toxicity. 21 Muscle-homing peptides, an alternative to CPPs, hold promise for improving delivery to muscle. These peptides are, in contrast to CPPs, generally not highly cationic, which should reduce the likelihood of inducing adverse reactions and toxicity.
Identifying the right homing peptide for tissues of interest has become more easily achievable with the introduction of the phage display biopanning technique, which has previously been successfully used to identify peptides with muscle homing potential.22–23 This method uses bacteriophages that each display specific peptides, the sequence of which is embedded in the phage DNA. Phages are incubated with a target, whereafter washing is performed. Sequencing the DNA of phages from isolated samples can reveal which peptides were enriched and therefore may have the potential to bind a molecule of choice, or to enter a specific cell type, or to home to a specific tissue.
Here, we used this method in vivo to identify 7-mer linear muscle homing peptides for conjugation to PMOs. We planned the Ph.D.−7 Phage Display Peptide Library from New England Biolabs (NEB) in two mouse models of DMD to identify muscle homing-peptides while simultaneously negatively selecting peptides that homed to unwanted organs (kidney and liver). In vitro experiments were carried out to confirm the muscle uptake of these candidate peptides, and in vivo testing was performed to test their safety and efficiency when conjugated to a PMO in the mdx mouse model for DMD. Through our analysis, we found several candidate linear peptides, which were muscle-specific with minimal homing to off-target organs, liver and kidney. Peptides that showed the most promising uptake results in vitro were conjugated on the PMO to test in vivo, where we found that the muscle homing characteristics of these peptides were variably effective compared to naked PMO treatment.
Methods
Animals
All experiments described were approved by the Leiden University Medical Center (LUMC) animal welfare body (PE.17.246.025, PE.17.246.041, performed under CCD number AVD1160020171407) and carried out according to Dutch law. Animals were housed under pathogen-free conditions at 20.5°C on a 12-hour light/dark cycle. Mice had ad libitum access to water and standard chow.
For the in vivo biopanning experiment, male wildtype (C57Bl./10ScSnJ/Jax), mdx (C57BL/10ScSn-Dmdmdx/Jax), and D2.mdx (DBA-Dmdmdx/Jax) mouse models were used, which were recruited from our in-house breeding program. Our in vivo testing of the PMO-peptide conjugates included eight male mdx mice per treatment group.
In vivo phage display biopanning
The 7-mer phage library (Ph.D.−7™ Phage Display Peptide Library kit, New England Biolabs), which includes all possible 1.28 × 10⁹ linear heptapeptides represented by different individual bacteriophages, was intravenously (IV) injected into a wild-type (WT) mouse, and two different DMD mouse models to account for the different stages of phenotypes in the disease, namely the mdx mouse and the D2.mdx mouse that display a hypertrophic and atrophic phenotype respectively. In a maximum volume of 100 μL, 2 × 10¹¹ phages were injected via the tail vein of the mice. After 1 h of circulation, the mice were put under general anesthesia using isoflurane. Anesthesia was induced using 4% isoflurane and maintained with 1.5%–2% isoflurane. The mice were perfused with saline to wash away unbound phages. Hereafter, the diaphragm, gastrocnemius, triceps, and heart were isolated for selection of muscle-homing peptides (positive selection). Tissues from off-target organs, liver and kidneys were isolated as well to be able to negatively select peptides that target these organs. Next to that, brain tissue was harvested to serve as a negative control. Using a MagNaLyser instrument, all tissues were homogenized in 1 mL of Tris Buffered Saline in zirconium bead-filled tubes for 10 s at 7000 RPM. If samples were not fully homogenized, repetition was executed after cooling down the sample tubes on ice for 5 min. The homogenized tissue samples were each added separately to an E.coli culture (1:100 dilution of an overnight grown culture) and cultured for 4.5 h at 37°C to enrich the phages present in the tissue for ‘strong affinity binders.’ To correct for possible amplification biases in the protocol, the unpanned phage library was amplified in E.coli as well. Next to amplification, titration steps were performed, all according to the manufacturers’ protocol. Briefly, before carrying out the amplification protocol for each phage pool from each tissue, 30 μL was kept separate and used to make serial dilutions. When the phage pool was undergoing amplification in E.coli, the titration protocol was carried out. For this, 10 μL of each dilution from the serial dilutions was used to infect one separate culture of 200 μL of E.coli. Bacteria were infected at an optical density (OD600) of ∼0.5 (mid-log phase) to ensure that the diversity of the bound-phage pool is kept, that is, each bacterium is infected with only one bacteriophage. The samples were plated on previously prepared IPTG/Xgal plates. Colonies were grown overnight and counted to determine the titer. The next day, this titration protocol was repeated with the amplified phages as well. Hereafter, phages from the amplified phage pools were isolated according to the manufacture’s protocol. Using the titer information, the volume needed from each amplified phage pool was calculated, ensuring that for each sample, 2 × 10¹¹ phages in a volume of 500 μL were used in the subsequent DNA isolation steps, which are described in the manufacturer’s protocol. DNA of the phages from the unpanned-amplified library (UAL) and the unpanned library (ie, naive library, as supplied by NEB) was isolated as well, to be able to determine amplification bias by comparing the naive library to the unpanned amplified library.
Next generation sequencing and quality control
Phage DNA was prepared for next generation sequencing (NGS) by PCR amplification to incorporate adapter and barcode sequences. The NEBnext High-Fidelity 2× PCR master mix was chosen in our protocol since this includes an enzyme with a high rate of proofreading, making sure PCR errors that would result in the wrong peptide translation were minimized. Custom primer pairs for each sample were designed to ensure specific barcodes and flow cell adapters were incorporated in the PCR product. The primers were designed to amplify directly around the peptide insert sequence in the phage DNA. PCR mix was prepared using 1 ng of DNA and a final concentration of 0.5 μM forward and reverse primers. Subsequently, PCR amplification was carried out using the following steps: 30 s at 98°C followed by 25 cycles of 10 s at 98°C, 30 s annealing at 72°C, and 10 s of extension at 72°C. Then a final extension of 2 min at 72°C. A fraction of the PCR product was used to check for proper generation of the product on a 2% agarose gel. Hereafter, PCR products were cleaned up using the Qiaquick PCR purification kit (Qiagen) according to the manufacturer’s’ instructions. The concentration of the samples was determined by making use of the bioanalyzer lab on a chip DNA1000 assay (Agilent 2100 bioanalyzer—DNA 1000 kit). Hereafter, NGS was performed using Illumina NovaSeq6000 sequencing. Following this, FastQ files were extracted, and several quality control steps were performed:
Reads that did not start with CCT TTA GTG GTA CCT TTC TAT TCT CAC TCT and ended with GGT GGA GGT were excluded. Peptide insert sequences in the phage DNA are described by (NNK)7. All Ks in this sequence need to be either G or Ts. Next, reads were trimmed to only the insert sequence, representing 21 nucleotides of the 7-mer peptide. DNA was translated into peptide sequences where TAG stop codons are considered a glutamine codon when translating (according to the manufacturer’s instructions). Any ‘parasitic sequences’ (due to amplification bias) were excluded. A sequence was deemed parasitic when UAL-naïve library (NL) was >2 when comparing the peptides from the naive library to the UAL. Hereafter, candidate selection was performed, which will be explained in the next section.
NGS data analysis
A top 10,000 list for each sample library was generated as a first filtering step to condense the data. These lists were combined, and abundancy counts per peptide for each tissue were evaluated. First, the cut-off points for considering peptides as candidates per tissue was determined. The percentage of abundancy counts from peptides in a specific muscle tissue compared to the highest-ranked peptide in this tissue was used to evaluate the possible homing ability of a peptide in that specific muscle. In our data, if the percentage for a peptide was below 10% in one of the muscle tissues, it was excluded. Next, we calculated the ratio between abundancy counts in muscle tissue and negatively selected tissues (liver and kidney). A ratio of 5:1 between positive selected peptides from muscle tissues and peptides from negative selected tissues was used to exclude peptides from the list, but 3:1 was allowed if needed (eg, 5:1 was too rigorous to generate a sufficient candidate list for a specific muscle tissue). Hereafter, the abundancy count of a peptide was evaluated over all positively selected muscle tissues. Peptides with overall slightly lower abundancy counts in all tissues compared to a peptide that had a relatively high abundancy count in one tissue and lower in the other muscle tissues were considered of higher interest. After this, the sequence of a peptide was considered. Since we know from previous research that a positive charge helps with general improved delivery, we prioritized peptides with one or two R or K amino acids. Lastly, we reevaluated the abundancy counts in negatively selected tissues. Peptide can be in compliance with the 5:1/3:1, ratio rule but their abundancy score in off-target tissues could still be relatively high, depending on their abundancy score in muscle tissues. When narrowing down the peptide candidate list, this was taken into consideration.
Around 30 candidate peptides remained after filtering using the above-described steps. We selected four muscle-specific candidates from our list to continue to test these in vitro. Next to that, we chose three peptides that had higher abundancy counts in the muscle tissues but had high counts in off-target organs, liver and kidney as well. In addition, we chose two peptides that were found back in high abundancy in only brain tissue as negative controls for homing towards muscle.
In vitro evaluation of muscle homing peptides
Preparation of the FAM-labeled peptides
The candidate peptides were labeled using fluorescein amidites (FAM) and dissolved in ultrapure Milli-Q water, with, when needed, the addition of a maximum of 6% dimethylsulfoxide (DMSO) to ensure a proper homogenous solution. Using the ‘labels’ setting on a nanodrop device, the concentration of the peptide solutions was determined. The stock peptide solutions were diluted 1:40 in Tris-HCl (pH 7.5) to be able to perform measurements under the right pH conditions. When a peak at 495 nm was observed, a measurement was deemed correct. These measurements were used to calculate the volumes needed for a final concentration of 22.5 μM in 1 mL of the medium of the cultured cells.
Cell culture
Human control (KM155) and patient-derived (8036) skeletal muscle cells were cultured in a 6-well plate containing a glass coverslip and an overall 0.5% gelatin coating at 37°C and 5% CO2. These cells were cultured in proliferation medium that consisted of skeletal muscle cell growth basal medium (PromoCell, C-23060) supplemented with growth medium supplement Mix (Gibco C-39365), 15% heat-inactivated (HI) fetal bovine serum (FBS) (Gibco) and 50 μg/mL Gentamicin (Sigma, G1272) until a confluency level of 80%–90% was reached. Subsequently, the medium was switched over to differentiate the cells from myoblasts into myotubes (contents differentiation medium: Dulbecco’s Modified Eagle Medium (DMEM) (1X)+GlutaMax-I (Gibco, 61965-026) supplemented with 2% HI-Horse serum (Gibco) and 1% penicillin/streptomycin (Gibco, 15140-122)). Human cardiomyocytes (SV40) were cultured as well in a 6-well plate containing a glass coverslip and overall collagen coating in Prigrow I medium (Applied Biological Materials TM001) containing 10% HI-FBS and 1% penicillin/streptomycin.
In vitro uptake experiment
Cells were washed twice using plain DMEM. Next, 1 mL of DMEM containing 22.5 µM of the FAM-labeled peptide was added to the cells and incubated for 32 h (final DMSO concentration is below 0.5%). Hereafter, an equal amount of serum-containing media was added to the cells for another 16 h. After a total incubation time of 48 h, cells were washed 3 times using plain DMEM and fixed in ice-cold methanol for 5 min. Coverslips were retrieved and mounted on microscopy slides using 4′,6-diamidino-2-phenylindole (DAPI) containing ProLong Gold Antifade mounting media. To evaluate the green fluorescent signal, cells were imaged using a light microscope (Keyence, BZ-X700) using the same exposure time for each sample.
In vivo evaluation of the PMO-peptide conjugates
Compounds
The qualitiy control results of PMO-peptide conjugates are provided in the supporting information section.
In vivo experiments
Mice were IV injected weekly with 30 mg/kg of the exon 23 skipping PMO or the molar equivalent for PMO conjugates via the tail vein for 4 weeks from the age of 4 weeks onwards. Every week up until one week after the last injection, body weight was recorded. Then, mice were put under a heating lamp, after which blood was drawn using capillary tubes (microvette CB300 CAT, Sarstedt) via an angled tail vein cut. The collection tubes were left to stand for 30 min to 2 h, whereafter they were spun down for 15 min at 2400 RPM (612 g) and 4°C. Serum was retrieved and stored at −80°C until further use. Mice were sacrificed through cervical dislocation, and tissues of interest were harvested. Gastrocnemius, tibialis anterior, quadriceps, triceps, diaphragm, heart, liver, and kidneys were collected and frozen using liquid nitrogen. One of the gastrocnemius muscles per mice was prepared for cryosectioning by snap freezing this tissue in liquid nitrogen-cooled isopentane.
Safety profile evaluation by serum marker screening
The collected serum samples were evaluated for clinical chemistry by IDEXX BioAnalytics (North Grafton, MA) using a custom panel measuring the following markers: alkaline phosphatase, ALT, AST, total bilirubin, blood urea nitrogen (BUN), globulin, total protein, albumin LDH, and CK. When elevated hemolysis was measured, serum samples were excluded from the dataset.
Exon skipping analysis
To evaluate exon skipping levels, RNA was isolated from triceps, gastrocnemius, diaphragm, and heart tissues. On ice, TRIzol isolation reagent was added to tubes containing 1.4 mm Zirconium beads and the muscle tissue, whereafter the samples were disrupted using the MagNaLyzer at 7000 RPM for 20 s, which was repeated if needed after chilling the samples on ice. When the samples were fully homogenized, they were put on ice, and half the volume of chloroform was added to the samples, followed by vigorous shaking by hand. To separate the phases, the samples were spun down for 10 min at 4°C at 13000 RPM (15700 g). The upper aqueous phase was retrieved and at least double the volume of isopropanol was added. The RNA was precipitated by spinning down at 13000 RPM (15700 g) for 10 min at 4°C. After removing the supernatant, the pellet was washed twice with 70% ethanol. The pellet was left to air-dry and resuspended in Milli-Q water. A nanodrop was used to assess the concentration of each sample. For each sample, 1000 ng of RNA was used to synthesize cDNA, using random hexamer primers (40 ng/µL) and dNTP mix (containing 10 mM of each nucleotide). This mix was incubated at 70°C for 5 min, whereafter M-MLV reverse transcriptase (Promega, 200 U/µL) and rRNasin (Promega, 40U/µL) were added. Reaction mixes were incubated for 60 min at 42°C, followed by 10 min of 70°C incubation to terminate the reaction. Using the following primers 10 pmol/uL: atccagcagtcagaaagcaaa (forward primer targeting mouse Dmd exon 22) and cagccatccatttctgtaagg (reverse primer targeting Dmd exon 24), Taq DNA polymerase (5 U/µL) and dNTPS (10 mM), PCR amplification was performed. The PCR amplification protocol consisted of the following steps: 5 min at 94°C, followed by 30 cycles of 30 s at 94°C, 30 s at 60°C, and 30 s at 72°C, and a final extension time of 7 min at 72°C. Products were run on a 1.5% agarose gel for 1 h at 130 V using the 100 bp GeneRuler DNA ladder of Thermofisher as a size standard to visualize the fragments. The bioanalyzer lab on a chip DNA1000 assay (Agilent 2100 bioanalyzer—DNA 1000 kit) was used to semi-quantify exon skipping levels in each of the samples. Exon skipping levels were determined by comparing the molarity of the skipped product to that of the total product (skipped and WT products).
Evaluating dystrophin protein levels
Dystrophin protein restoration was evaluated using the JESS automated western blot system. Per sample, 1 mL of protein isolation buffer, containing 10% glycerol, 10% sodium dodecyl sulfate (SDS), and 1.5 M Tris at a pH 6.8, was added to the muscle tissue in zirconium bead-filled tubes, whereafter the standard operating protocol of the MagNalyzer instrument was applied (7000 RPM for 20 s). When tissues were not fully homogenized, tissues underwent another round in the MagNaLyzer after being sufficiently chilled on ice and briefly spun down at 4°C. The solution was transferred into a clean Eppendorf tube, whereafter the samples were heated at 95°C for 10 min. Using the Protein Assay Kit of ThermoFisher, protein concentrations of the samples were determined. Using the JESS Simple Western machine (ProteinSimple®, Bio-Techne, Minneapolis, MN, USA), with the 66–440 kDa Jess chemiluminescence separation module (SM-FL005-1) with 25 capillaries, samples were analyzed according to the manufacturer’s protocol, with the deviation of loading 4 μL instead of 3 μL in the plate wells. To prepare the samples for loading on the separation module, all samples were set at a total protein concentration of 0.5 μg/μL using the protein isolation buffer mentioned, the 5× fluorescent master mix included in the EZ standard pack 3, and a 1:100 sample buffer that is included in the separation module kit (Bio-Techne, SM-FL005). In our experiments, we used antibodies for dystrophin and vinculin (mouse-anti-rabbit, AB154168, mouse-anti-rabbit, REF70062, respectively), both diluted 1:100 in antibody diluent 2 for our primary antibody solution. Anti-rabbit horseradish peroxidase (HRP) antibody was used as a secondary antibody (Bio-Techne, #042–206). As a secondary antibody, anti-rabbit HRP was used (Bio-Techne, #042–206). Using the compass for simple western software (Protein-Simple, version 6.3.0), the area under the curve for both dystrophin and vinculin peaks was identified. Dystrophin values were normalized to vinculin to determine the level of dystrophin restoration per individual sample. Percentages of dystrophin restoration were determined using linear regression to a WT dilution curve with known percentages of this protein that were taken along on each plate. Dystrophin restoration was found to be lower than 2.5% in diaphragm and heart tissues, which was found to be below the lower limit of quantification of the JESS system. To allow comparison between these samples, the percentage of restoration was expressed as a prediction based on an overall WT curve that was generated with data from all WT curve measurements across different experiments.
Muscle histology and immunofluorescence analysis
Using the gastrocnemius muscles of the three mice that showed the highest exon skipping levels per group, serial cryosections (Leica CM3050 S) were generated. Sections of 8 µM were made throughout the muscle and put on superfrost PLUS slides (Menzel-Glaser, Fisher Emergo) to have representative sections spanning the whole muscle. Until needed for staining, slides were kept at −80°C.
To examine overall pathology, hematoxylin and eosin (H&E) staining was performed using the following steps: slides with frozen tissue sections were defrosted at room temperature (RT) for 30 min. Fixation was performed using ice-cold acetone incubation for 5 min. Slides were air-dried for 30 min and rinsed using Milli-Q water. Using hematoxylin (Mayer’s, Agilent #S330930-2), staining was performed for 3 min, whereafter slides were washed with Milli-Q water. Then, a more thorough washing was carried out by using running tap water for 5 min. Slides were quickly dipped in acid-ethanol (70% ethanol with 1% glacial acetic acid, MilliporeSigma #1000562500) for 10 times, to de-stain and were then washed under running tap water, twice for 1 min. Another rinsing step was performed using Milli-Q water for 1 min, whereafter the slides were submerged in Eosin Y solution (Sigma-Aldrich, #HT110232, with the addition of 0.5 mL glacial acetic acid per 100 mL eosin) for 35 s. Dehydration was performed by submersion for 1 min in 80% ethanol, then for the same time in 90% ethanol, and again in 100% ethanol. Lastly, slides were put in xylene (J.T. Baker) baths for 5 min, whereafter they were air-dried and mounted with coverslips (24 × 60 mm, Menzel Gläser, Fisher Emergo #360209) and Pertex mounting medium (HistoLab, #00801). The mounting media was left to dry overnight, whereafter imaging was performed at 20x magnification using a Pannoramic 250 Flash III scanner (3DHISTECH). The middle section of the slide was used for analysis. In this section, corrections, where background dirt and noise were removed, were performed using Adobe Photoshop (2022). ImageJ software was used for analysis (version 2.3.0/1.53f51), where the color deconvolution plugin was used to split images into three channels (green, blue, pink). The pink channel provides a clear contrast between healthy muscle tissue and pathological elements. In this channel, the threshold function was used to distinguish inflamed and fibrotic tissue from healthy tissue. Comparison of this measurement to whole tissue measurements was carried out to determine the total percentage of measured pathological tissue. Two independent observations by different researchers were used to quantify the pathology. The mean of these measurements was used for our results.
For immunofluorescent staining, the slides were thawed and fixed in the same manner as described in the H&E protocol. A hydrophobic pen was used to select a section from the middle of the tissue. Using PBS, sections were washed twice for 2 min. Hereafter, blocking reagent containing 0.05% Tween in PBS with 5% horse serum was applied to the section for 60 min. This was removed to add the primary antibody solution, which was incubated overnight at 4°C. Primary antibody solution consisted of blocking reagent containing the following antibodies: rabbit-anti-dystrophin (ab152777 GR3443483-4) diluted 1:250, mouse-anti-MYH3 (sc-53091, #J0233 IgG) diluted 1:20, and rat-anti-laminin α−2 (sc-59854, G1217 IgG) diluted 1:50. The next day, sections were washed twice for 2 min, using PBS. Secondary antibodies were applied to the section and incubated for 60 min in the dark at RT. The secondary antibody mix consisted of fresh blocking reagent containing goat-anti-rabbit Alexa Fluor 594 (A11037), diluted 1:1000, mouse-anti-MYH3 Alexa Fluor 647 (A21235) diluted 1:1000, and goat-anti-rat Alexa Fluor 488 (A11006) diluted 1:1000. After this, sections were washed twice with PBS for 2 min and left to air-dry in the dark. Using ProLong Gold Antifade containing DAPI (Thermofisher P36935), slides were mounted. Imaging was performed using a ZEISS Axio Scan.Z1 Slide Scanner with a 20× objective. ZEN software (Carl Zeiss Microscopy GmbH) was used to export images with the same settings for all tissues. Then, Adobe Photoshop was used to remove background noise. MyH3 and dystrophin-positive fibers were counted manually by making use of the point tool in ImageJ. The number of fibers was divided by the total area of the muscle tissue to calculate the number of fibers per square millimeter.
Analyzing PMO concentration in muscle tissue
The concentration of PMO was determined by enzyme-linked oligonucleotide hybridization assay (ELOHA). For this, oligonucleotide capture probes were designed that hybridize to the 5′ end of the PMO sequence. Incubation of the coating solution (500 nM capture probe, 2.5% sodium bicarbonate solution) for 1 h at 37°C ensured the capture probes were covalently attached to Pierce™ Maleic Anhydride Activated Plates (ThermoFisher 15110). Then, plates were washed and blocked overnight at 4°C using 10% milk/PBST. Tissue samples were lysed in ELOHA lysis buffer (10 mM Tris-HCl, pH 7.5, 0.5% IGEPAL, 100 mM NaCl, 5 mM ethylenediaminetetraacetic acid (EDTA)) using 20 μL of buffer per mg of protein and then digested with Proteinase K (Qiagen 19134) for 30 min at 60°C at a final concentration of 1 mg/mL. Hereafter 30 μL of this solution was incubated with 120 μL Detection Probe Solution (333 nM biotinylated oligonucleotide detection probe targeting the 3′ sequence of the PMO, 500 mM guanidine thiocyanate, 0.04% lauryl sarcosine, 3 mM sodium citrate, and 1.25 mM DTT in PBST) and incubated overnight at 4°C on the blocked, capture probe coated maleic anhydride plate. Next, the plates were washed using PBST and incubated for 1 h with streptavidin-AP conjugate (Sigma-Aldrich 11093266910). Another wash step was performed, and AttoPhos® AP Fluorescent Substrate System (Promega S1000) was added for 20 min, whereafter the reaction was stopped with 10 μL of EDTA (0.5M Solution/pH 8.0) (Fisher Scientific 8BP2482100). Using a Spectramax i3 reader (Ex 440, Em555), fluorescence was measured. Each sample was interpolated to a standard curve prepared for each compound with a Sigmoidal, four-parameter logistic model to determine ng PMO per μL of tissue lysate. The final tissue concentration value was reported as ng PMO per gram of tissue (ng/g).
Statistical analysis
To determine if the results between groups and control differed significantly from each other for the outcome measurements of our experiments, one-way Analysis of Variance tests with a Dunnett’s multiple comparison test were applied. When assumptions of equal variances (Brown–Forsythe test) or normal distribution (Shapiro–Wilk test) were not met, the non-parametric alternative, a Kruskal–Wallis test, was performed with a Dunn’s multiple comparisons test. All reported data are mean values with standard deviation. The result was deemed significantly different when P values of <0.05 were observed.
Results
Biopanning and NGS
The phage library displaying 7-mer linear peptides was IV injected in WT, mdx, and D2.mdx mice. After 1 h, mice were perfused with saline to wash away unbound phages. Bound phages in tissues of interest (gastrocnemius, triceps, diaphragm, heart, liver, kidney, and brain) were amplified in E.coli bacteria. Subsequently, an equal number of phages was isolated per sample using titer information (Supplementary Table S1), whereafter the DNA of the phages was isolated. The phage DNA was also isolated from the NL and UAL, and all samples were prepared for NGS sequencing. After sequencing, using the quality control checks described in our methods section, we found that 50–75% of the reads per specific sample were translatable into correct 7-mer peptide sequences. Since the library size was not the same for each sample, the abundance counts of each peptide per tissue were normalized to the size of the library for each sample. Hereafter, we filtered out any peptides for which the abundance count UAL-NL was >2, since these were deemed parasitic. After normalization and parasitic sequence filtering, we found that the distribution pattern of the data per sample was similar, however the number of unique peptides with a certain (relatively high or lower) abundancy count differed somewhat between mouse models for different tissues (Fig. 1). This meant that in each mouse model, for each tissue, there were always more unique peptides with relatively lower abundancy counts present instead of many unique peptides with high abundancy counts. The highest number of unique peptides was found in brain tissue (Fig. 1).
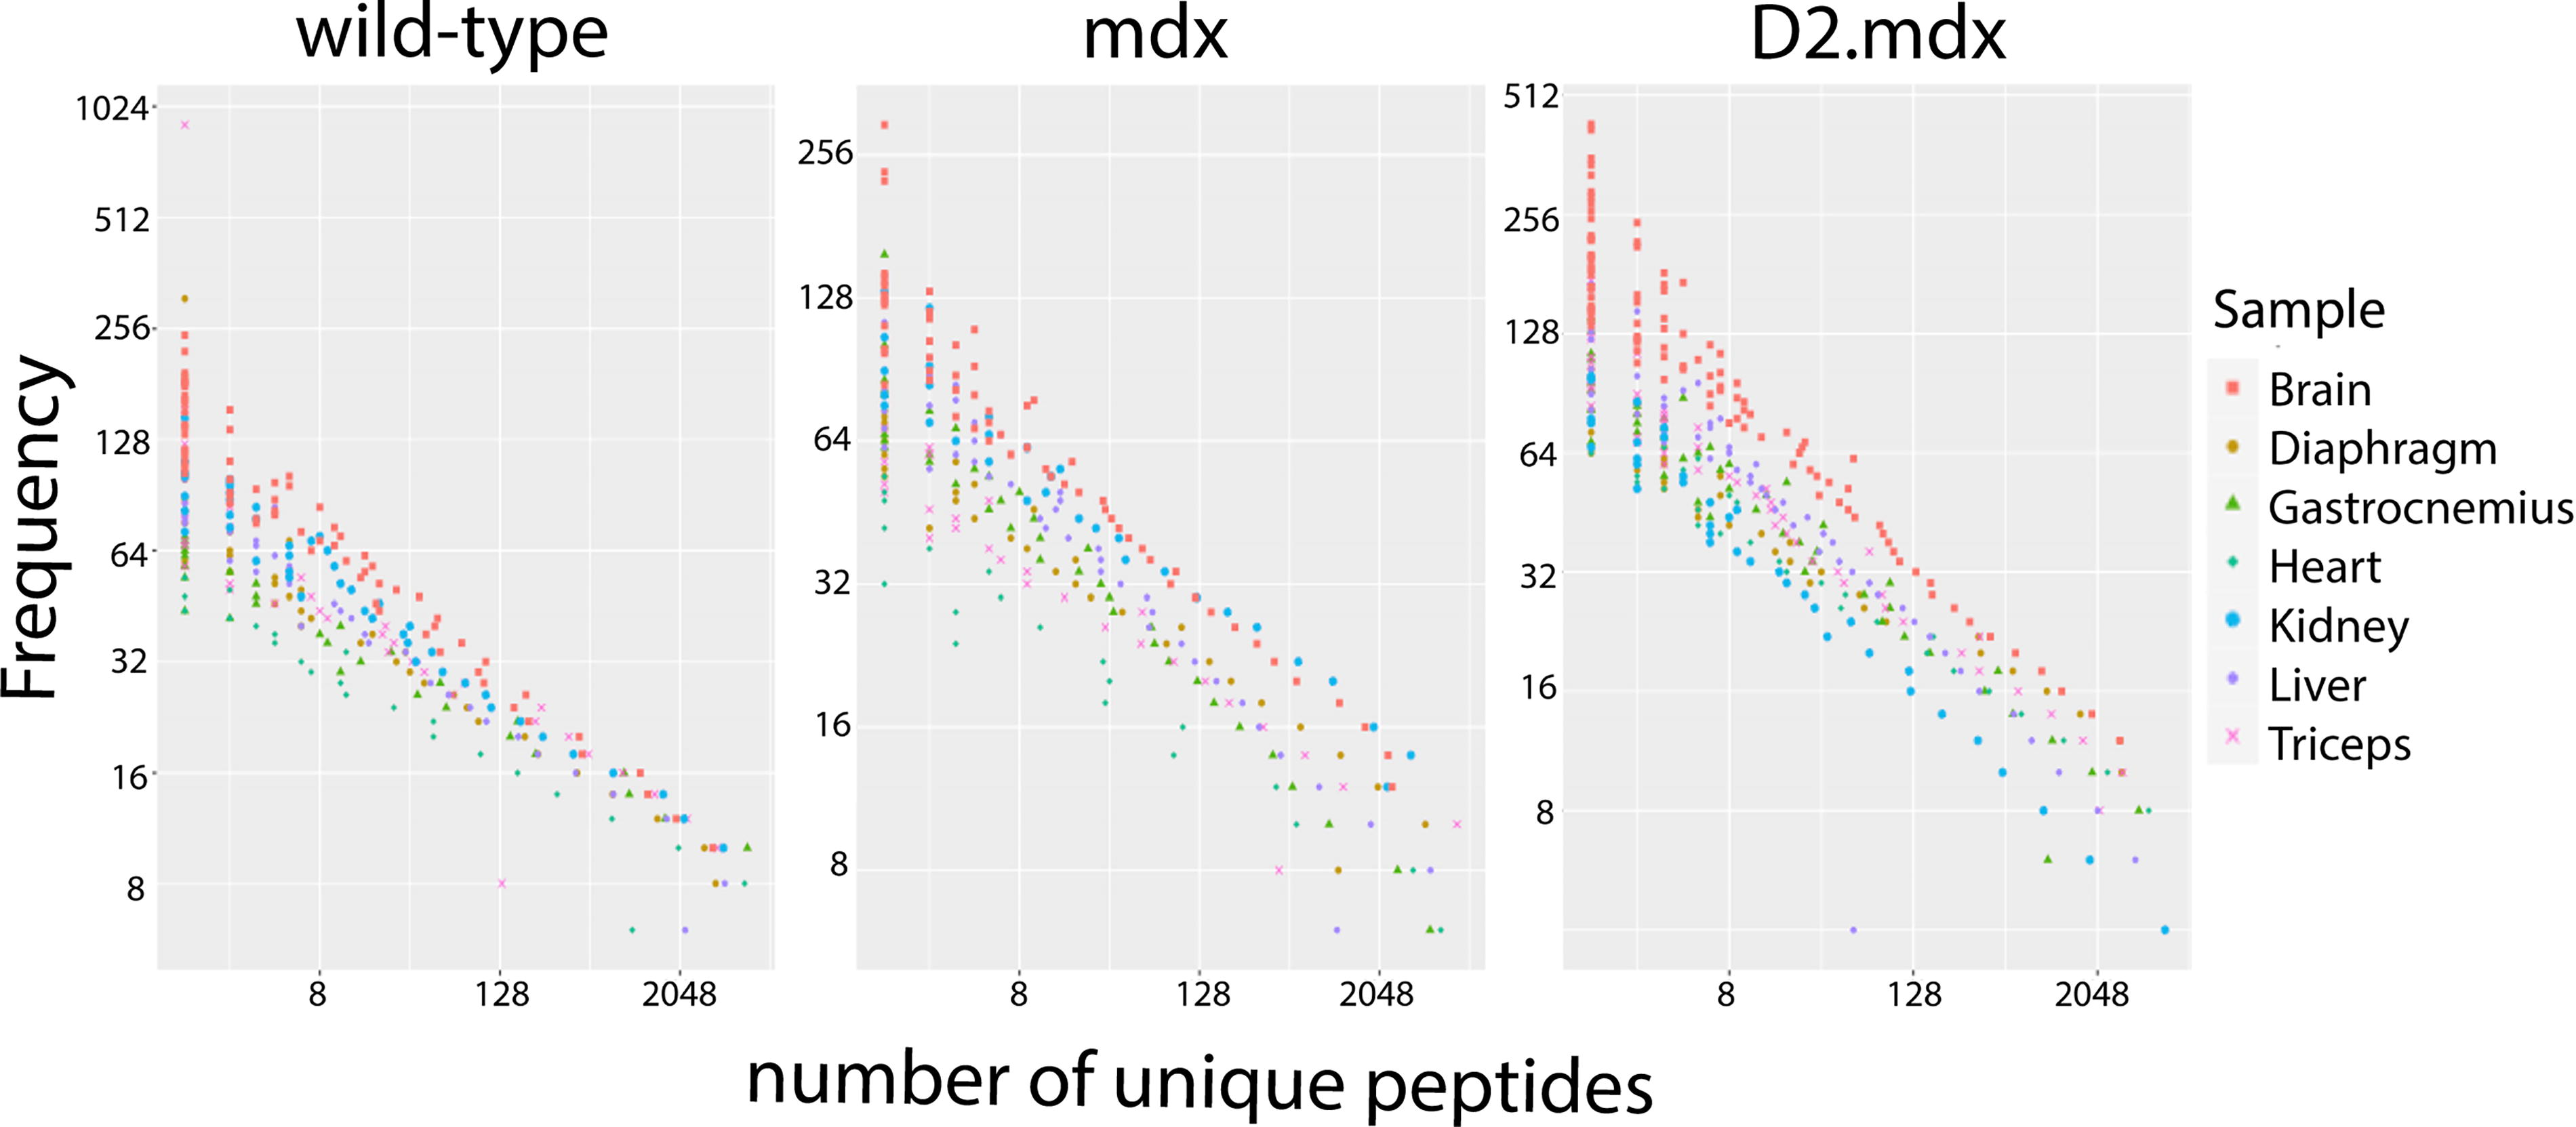
Overview of normalized and filtered data. Representation of abundancy counts of peptides detected in each sample is shown for each of the mouse models evaluated.
Candidate selection
The highest abundant 10,000 peptides per tissue were selected to identify candidate peptides. We observed that peptides identified in high abundance in the muscle tissues of one mouse model were not similarly abundant in the muscle tissues of other models. Therefore, we chose specific candidate peptides for each disease model and excluded WT, as the peptides were intended for delivery to dystrophic muscle. We also observed that the peptides that ranked highest in muscle tissue due to their high abundancy score were also identified with similar high abundancy scores in liver and kidney tissues (ie, not specifically muscle homing (NS-MHP) (Fig. 2). Therefore, a ratio rule, as described in our methods section, was applied. This resulted in specific muscle-homing peptides (S-MHPs) that were identified with somewhat lower abundancy scores than the highest ranked peptides in muscle tissues, but these peptides were not identified in high abundancy in the liver and kidneys (Fig. 2). Additionally, we identified peptides that were not found in any of our tissues of interest (either positively or negatively selected) but were detected exclusively in brain tissue with relatively high abundance scores, serving as a negative control (Fig. 2).
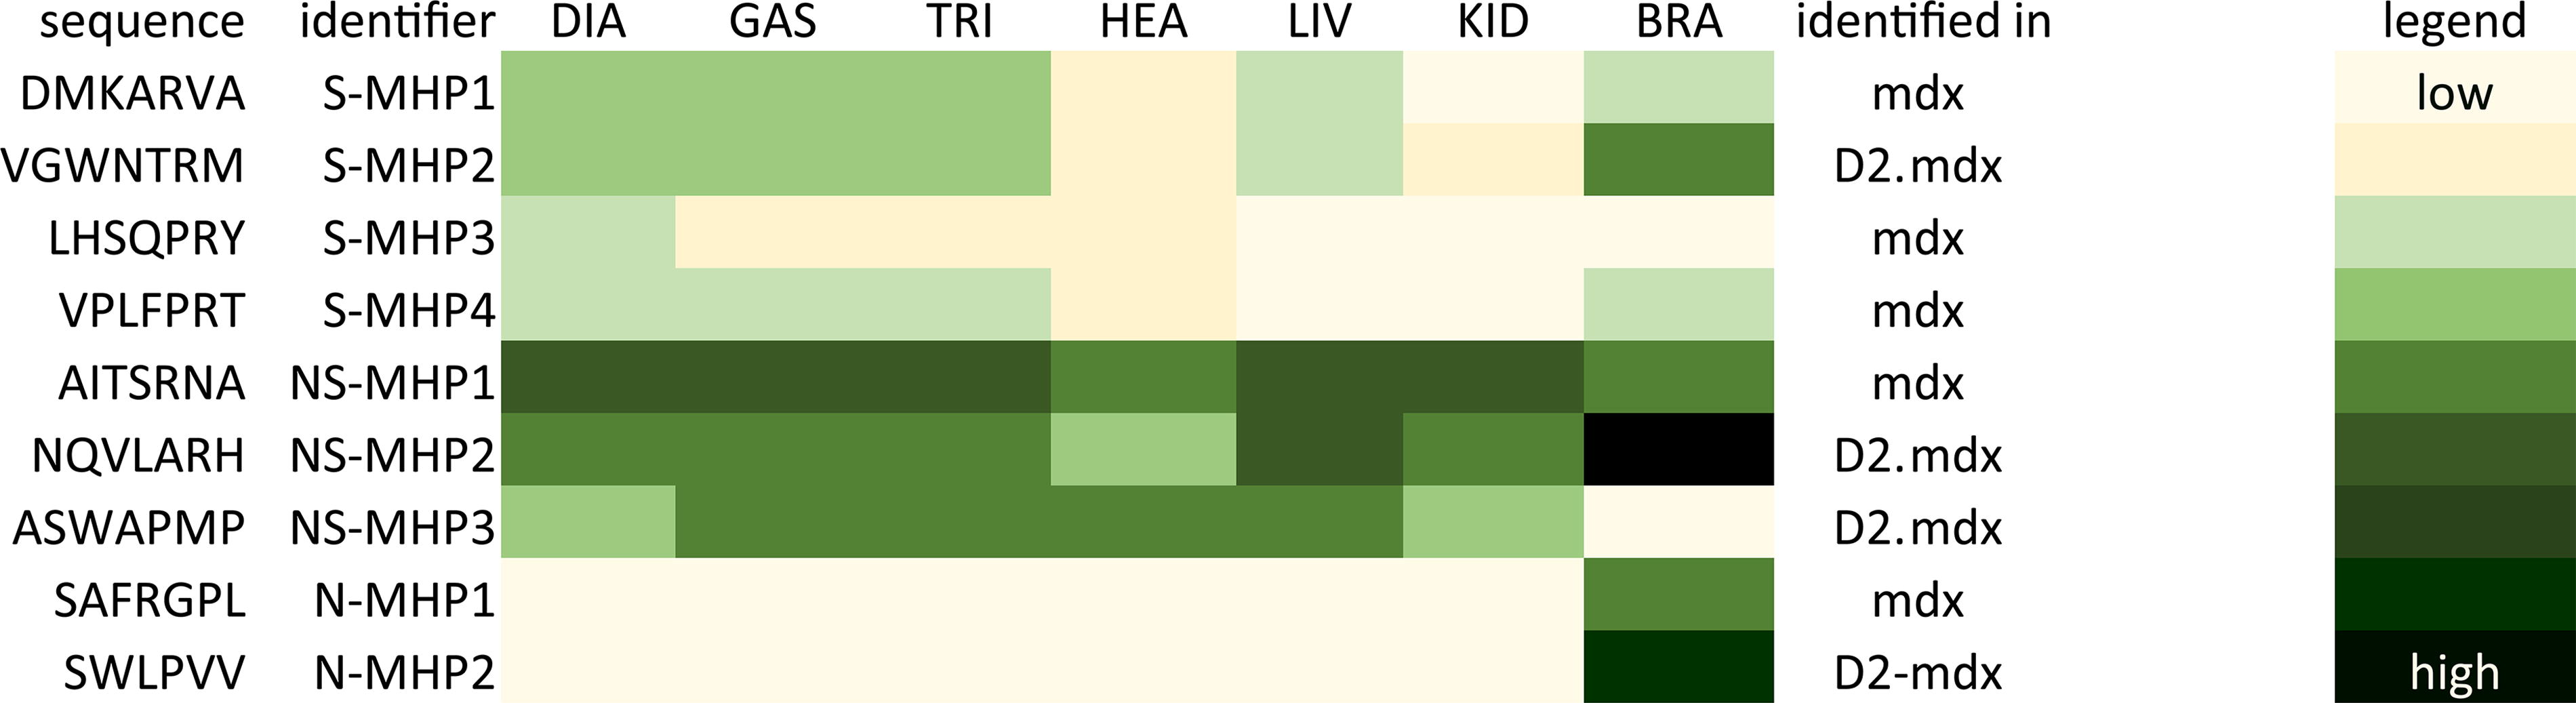
Heatmap of selected 7-mer linear peptides. Representation of abundancy counts of the selected peptides to test in vitro, depicted from high to low in a yellow to green scale for each of the analyzed tissues. DIA, diaphragm, GAS, gastrocnemius, TRI, triceps, HEA, heart, LIV, liver, KID, kidney, BRA, brain, S-MHP, specifically muscle-homing peptide, NS-MHP, non-specifically muscle homing peptide (ie, high abundancy in muscles but also liver and kidney tissue). N-MHP, non-muscle homing peptide (ie, only identified in brain tissue).
Muscle uptake could be confirmed for several linear peptides
We evaluated the nine FAM-labeled peptides, as described in Figure 2, for their uptake in human myotube cultures. The series of peptides included four peptides that were identified as S-MHP from our in vivo biopanning data analysis, three peptides that were found to be muscle-homing but also highly abundant in liver and kidney tissues, that is, NS-MHP, and two peptides that were only found back in brain tissue, that is, non-muscle homing peptides (N-MHP). Peptides were added to the media of patient and control myotubes and incubated for 48 h, after which we evaluated the green fluorescent signal. We found that a higher level of green fluorescent signal could be observed in patient derived myotubes compared to control cells (Fig. 3). Overall, we found that green fluorescent signal was mostly present in more mature myotubes, indicated by a larger number of nuclei in the cells where a more intense green signal could be observed (Fig. 3). As expected, for peptides that were not found in muscle tissues through biopanning, no green signal was observed in either control or patient derived myotubes (N-MHP1, N-MHP2). For the S-MHPs and NS-MHPs, we observed varying levels of green fluorescence signal, which was also cell line dependent. In control myotubes, the highest level of green fluorescence was observed for S-MHP1. In contrast, patient-derived myotubes showed the highest fluorescence for S-MHP2. S-MHP3 did not show a high level of green fluorescence in control cells, but did in patient-derived myotubes. This same observation was made for S-MHP4, however, the difference between cell lines was less prominent. In general, NS-MHP1, NS-MHP2, and NS-MHP3 showed less green fluorescence signal as compared to the S-MHPs in control myotubes, whereas this difference was not observed in patient-derived cells. In cardiomyocytes, no green fluorescent signal for any of the tested peptides was observed (data not shown).
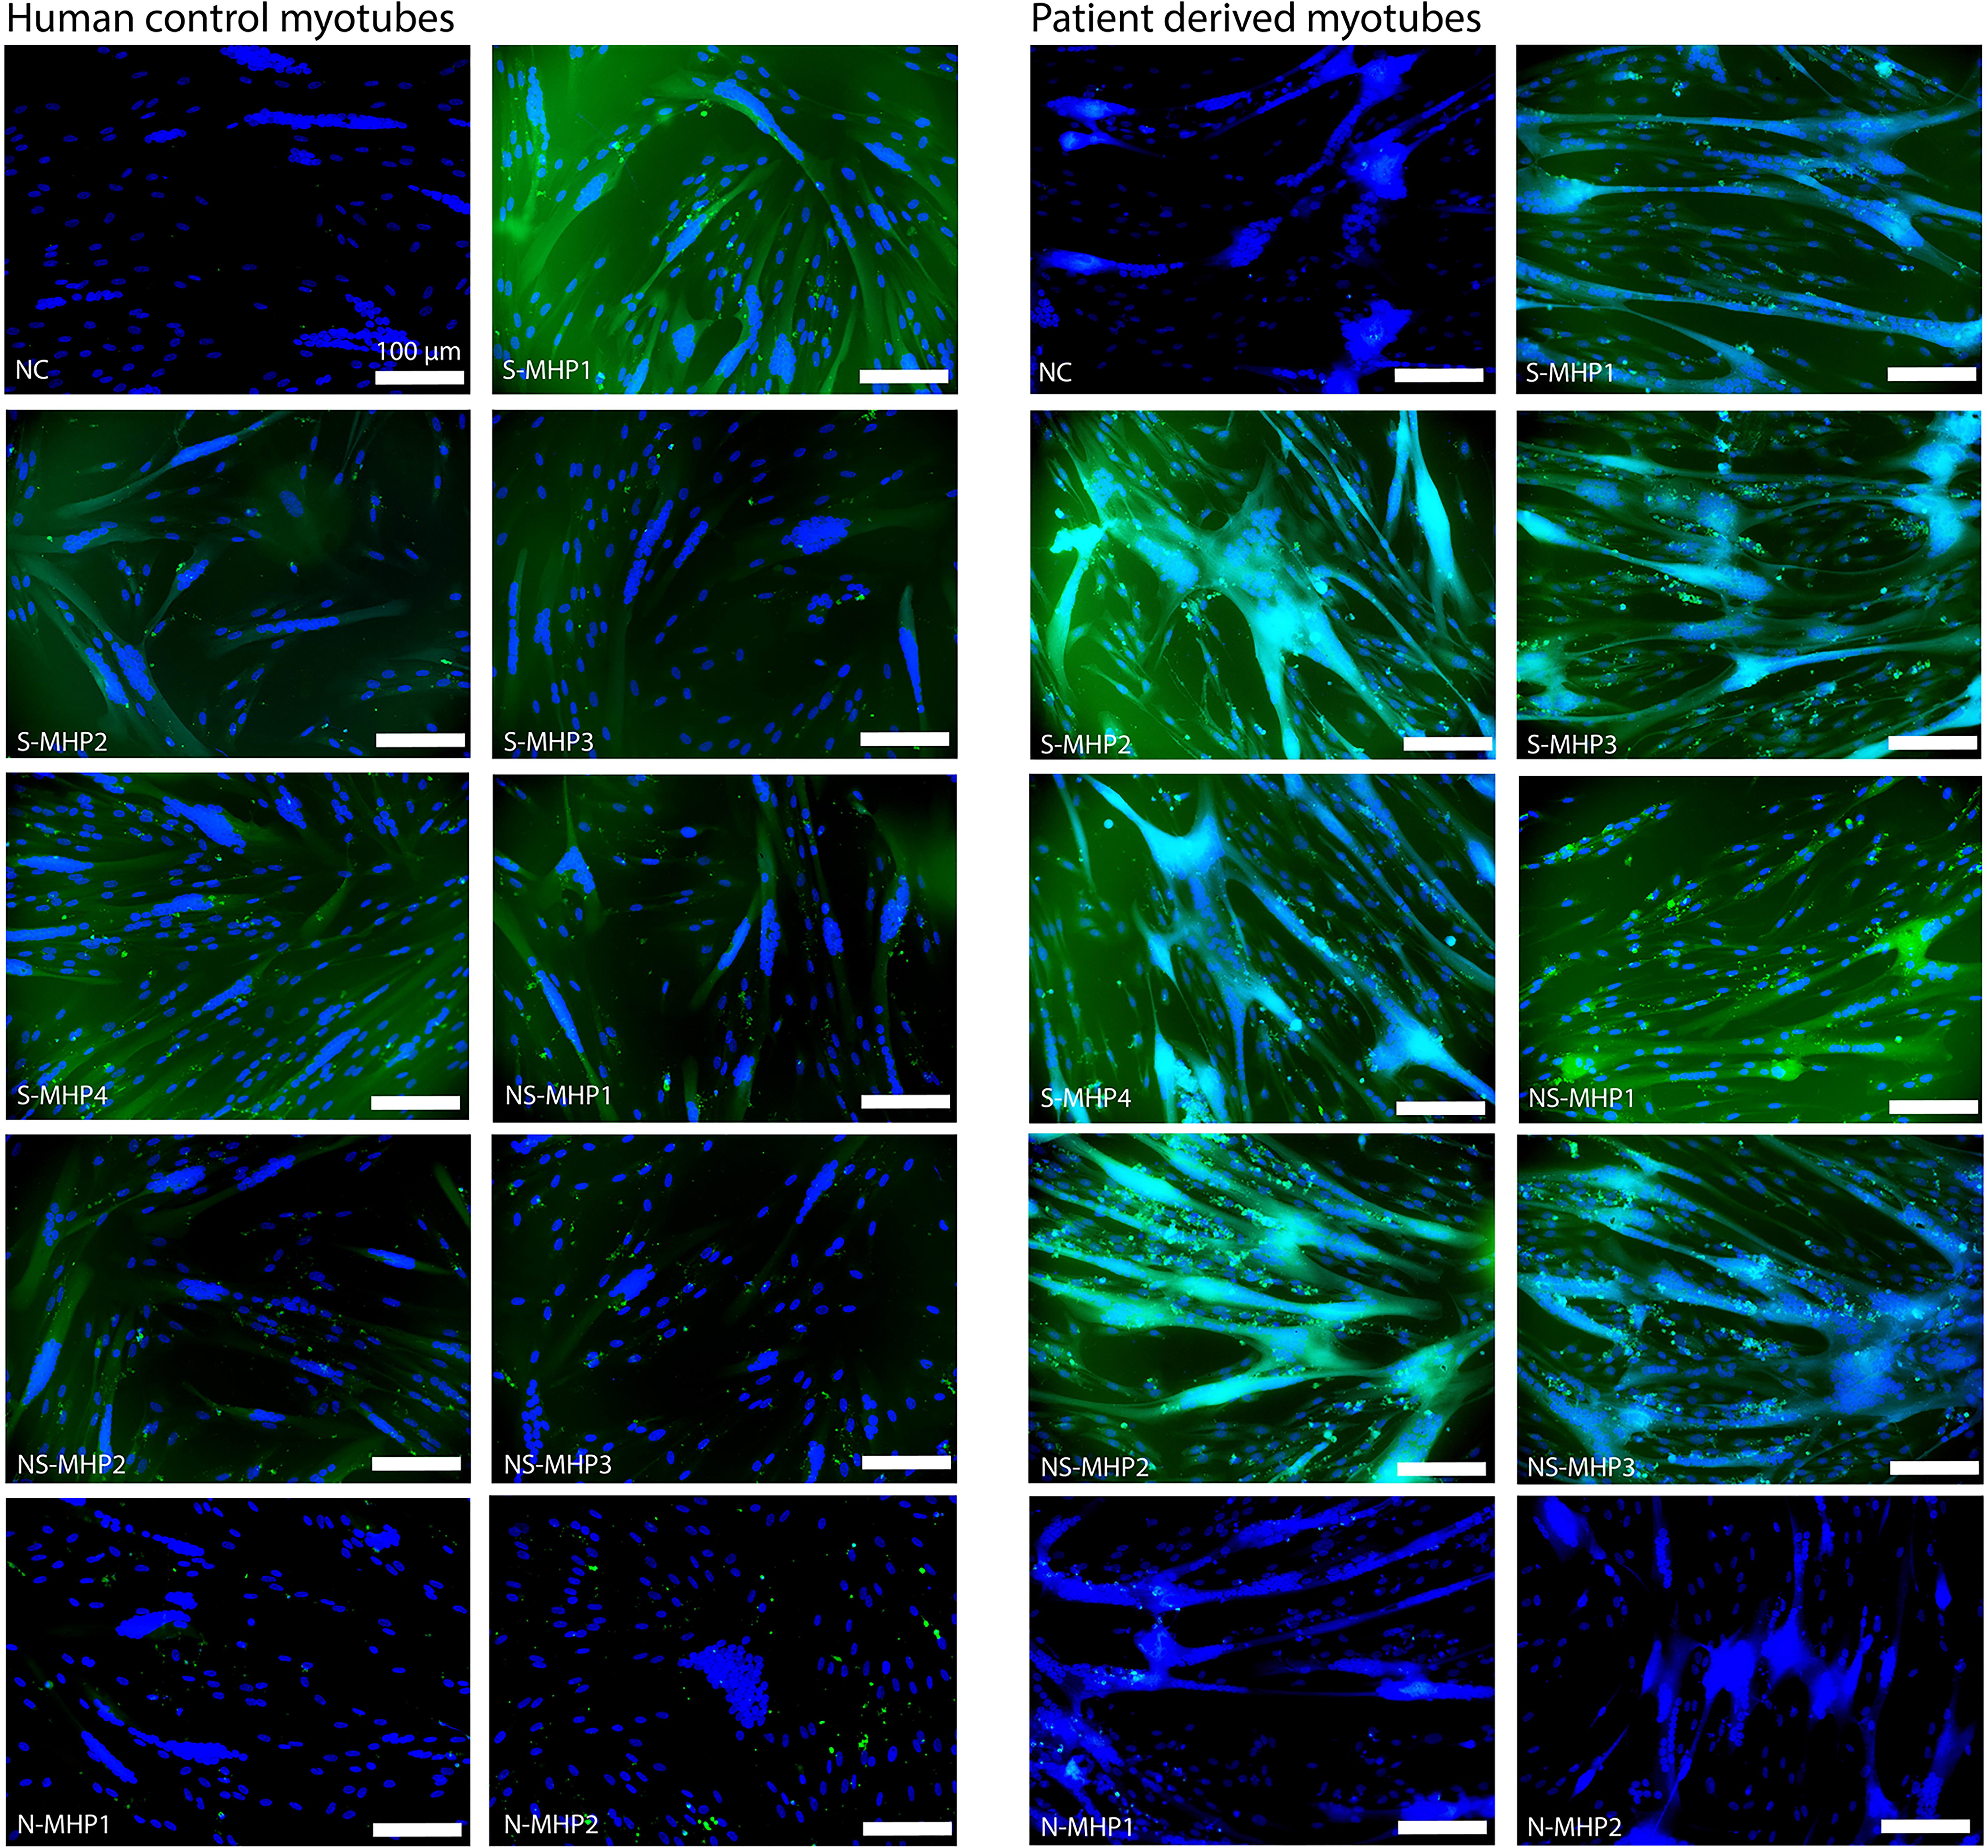
In vitro uptake of FAM-labeled 7-mer linear peptides. The left panel shows results for the uptake of the tested linear peptides in human control myotubes. The right panel shows results for the uptake of the tested linear peptides in patient-derived myotubes. Scalebar depicts 100 μM. Green = FAM-label, blue = DAPI. NC, negative control.
Linear muscle homing peptides do not consistently lead to increased exon skipping and dystrophin restoration in the mdx mouse
The specific muscle-homing peptides S-MHP1 and S-MHP2 were chosen to be conjugated to PMOs targeting mouse exon 23. This aimed to test whether these candidate muscle-homing peptides could improve the efficiency of PMO treatment in the mdx mouse model. The peptides NS-MHP1, NS-MHP2, and N-MHP1 were included as a negative control. We used naked PMO (without any conjugate) as a reference. Treatment lasted for 4 weeks with weekly injections of 30 mg/kg or the molar equivalent. In each treatment group, 8 male mdx mice were included. Body weights were recorded each week and one week after the last injection. The body weights of these mice were progressively increasing over time and did not show significant differences between treatment groups (Fig. 4).

Mean body weights in grams per week per treatment group. The mean bodyweight of each treatment group is shown in different colored lines with different symbols. N = 7–8 mice per treatment group.
At the end of the study, blood was collected to evaluate serum markers, and mice were sacrificed to collect muscle tissues for analysis. From our serum analysis, we found that none of the treatments led to any significant changes in any of the levels of the markers that we evaluated for general liver and kidney function or muscle damage compared to naked PMO treatment, except for S-MHP1-PMO, which led to significantly higher blood urea levels compared to naked PMO treatment (Fig. 5).

Levels of serum markers per treatment group. Markers for liver and kidney function and biomarkers for muscle damage were measured from serum after treatment. *P < 0.05.
We isolated RNA from diaphragm, gastrocnemius, triceps, and heart tissue and checked exon skipping levels using reverse transcription (RT)-PCR. In the diaphragm, S-MHP1-PMO and S-MHP2-PMO improved skipping levels significantly compared to naked PMO treatment, 16% versus 7% respectively (Fig. 6A). The other tested peptide-PMO conjugates resulted in increased levels of exon skipping compared to naked PMO as well, albeit not significantly. In the other skeletal muscles, we found that in gastrocnemius S-MHP1-PMO, resulted in the highest exon skipping levels (37% compared to 30% for naked PMO) while NS-MHP2-PMO resulted highest exon skipping in triceps (30% over 23% for naked PMO) (Fig. 6A). The increased levels of skipping in both these skeletal muscles were however not significantly different compared to the level of exon skipping of our reference naked PMO treatment. In heart tissues, overall levels of exon skipping were the lowest. Naked PMO treatment resulted in 0.2% of exon skipping. Even though all peptide-PMO conjugates increased levels of exon skipping, this difference was only significant for NS-MHP2-PMO treatment, and treatment with this peptide-PMO conjugate still led to a mean level of exon skipping below 1% (0.9%, Fig. 6A).

Exon skipping levels, dystrophin restoration, and pathological hallmark assessment after treatment.
Looking at dystrophin protein restoration, we found that, for the peptide conjugated PMOs, overall, S-MHP1-PMO resulted in the highest levels of restoration in all tissues (Fig. 6B). Treatment with this compound, however, only resulted in a significant increase in dystrophin restoration, in gastrocnemius and diaphragm, when compared to naked PMO treatment (11% vs. 2.6% and 3.3% vs. 0% respectively). Interestingly, any of the tested peptide conjugate PMOs, resulted in significantly higher levels of restoration compared to naked PMO treatment in the diaphragm, albeit to a lesser extent than S-MHP1-PMO (Fig. 6B). Further, in the gastrocnemius and diaphragm tissues, the trends in level of exon skipping versus dystrophin restoration are very similar (Fig. 6A vs. B). The peptide conjugates that resulted in the lowest exon skipping levels, also resulted in the lowest levels of dystrophin restoration and similarly peptide conjugate PMOs that resulted in higher levels of exon skipping resulted in more dystrophin restoration. This was, however, not the case for triceps and heart tissue. For example, NS-MHP2-PMO led to the highest level of skipping in these tissues but resulted in very low levels of dystrophin restoration in triceps and heart. This inconsistency was not always present. Treatment with NS-MHP1-PMO resulted in lower levels of exon skipping in triceps (albeit not significantly) and resulted in significantly lower levels of dystrophin restoration in this tissue compared to naked PMO treatment.
We proceeded to check if treatment resulted in any effects on the number of dystrophin-expressing muscle fibers or the level of pathology (inflammation, fibrosis, and regenerating fibers) observed in muscle tissue. For this, we analyzed three gastrocnemius muscles from each treatment group in which the highest levels of exon skipping were observed. We found that although treatment with S-MHP1-PMO resulted in a higher number of dystrophin-positive fibers compared to naked PMO, this result was not significant (Fig. 6D and C1). In agreement with this, no significant differences in pathology levels for this treatment were found (Fig. 6E, F,C1 and C2); with 9.5% versus 10.3% inflammation and fibrosis levels for naked PMO versus S-MHP1-PMO, respectively, and 4.7 MYH3 positive fibers/mm2 for naked PMO treatment versus 3.1 MYH3 positive fibers/mm2 when treated with S-MHP1-PMO. Overall, we found that none of the peptide-PMO conjugate treatments resulted in any significant differences compared to naked PMO treatment for the number of dystrophin-positive fibers, level of inflammation and fibrosis, or number of regenerating fibers (Fig. 6D–F).
Conjugation of S-MHP1 significantly increases the concentration of PMO in muscle tissue
We checked if conjugation of our muscle-homing peptides resulted in increased concentration of the PMO in muscle tissue by making use of ELOHA. We found that S-MHP1-PMO increased levels of PMO significantly compared to naked PMO treatment in the quadriceps. Next to that, we saw that conjugation of the peptide identified in brain tissue only (N-MHP1-PMO) resulted in significantly lower levels of PMO in this skeletal muscle (Fig. 7).
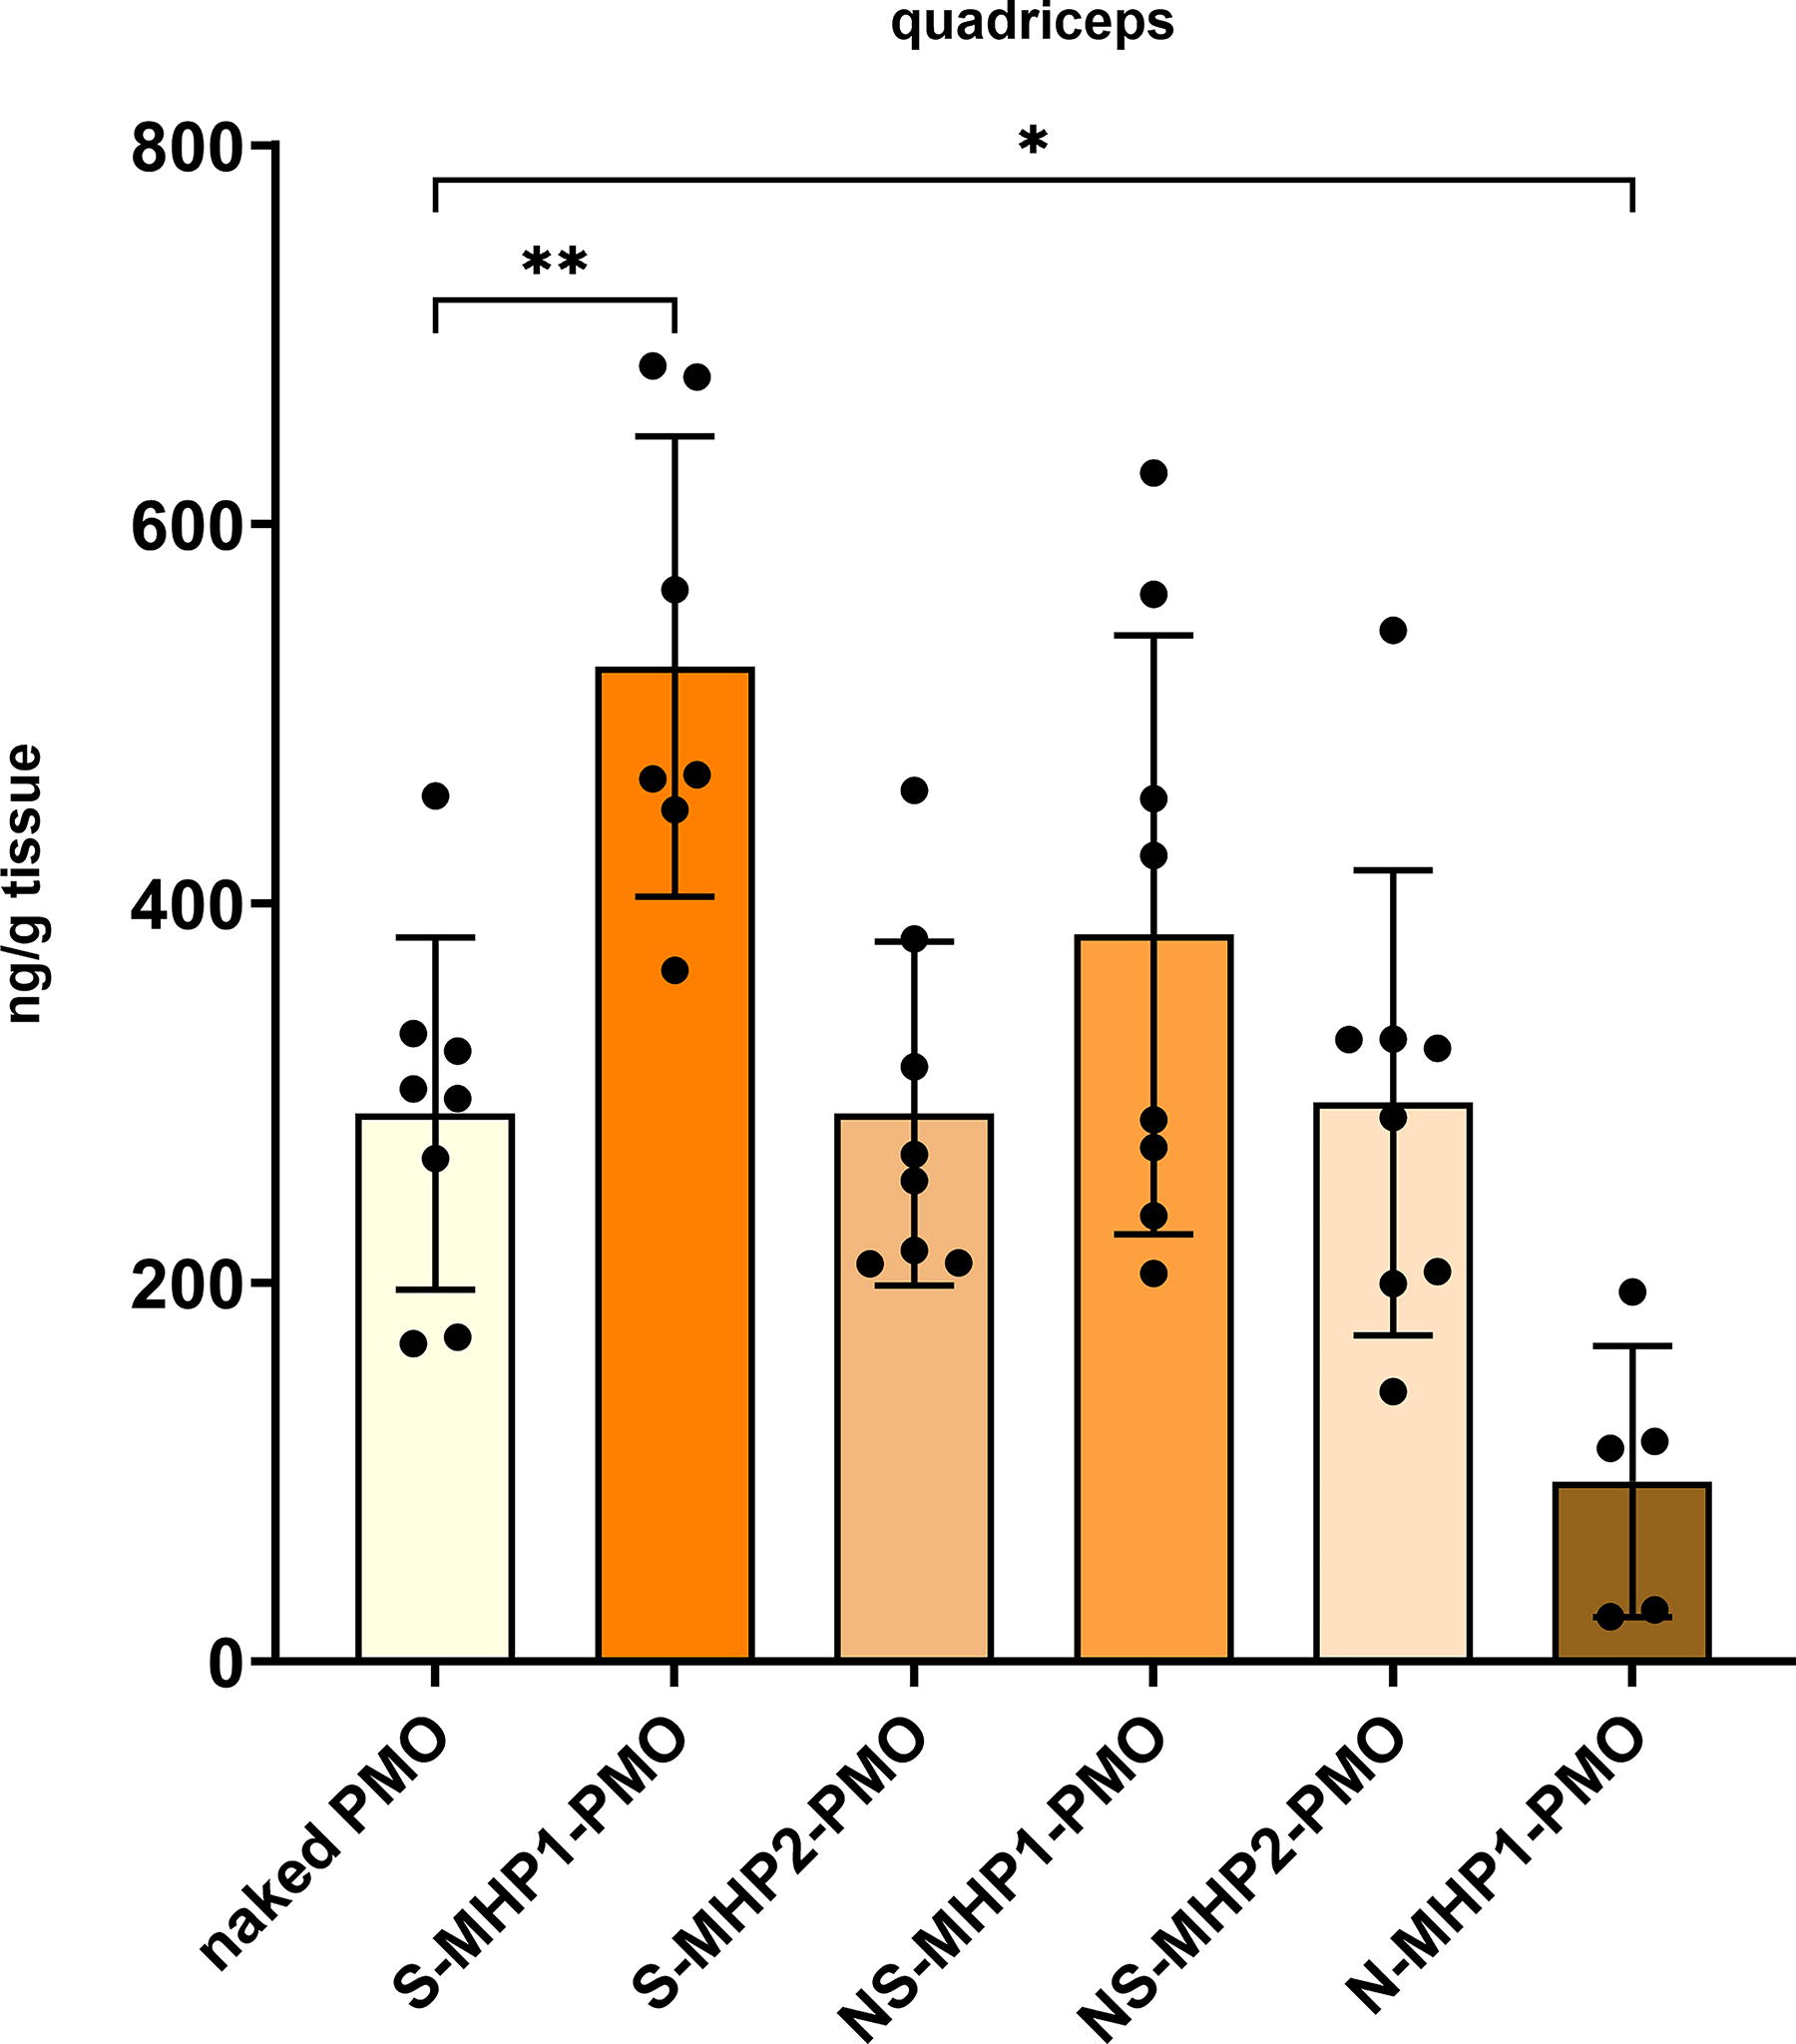
Concentration of PMO in quadriceps. The concentration of PMO in lysates of the quadriceps was determined (n = 7–8 per treatment group). *P < 0.05, **P < 0.005. PMO, phosphorodiamidate morpholino oligomer.
Discussion
With this research, we aimed to identify 7-mer linear muscle homing peptides to use as conjugates on PMOs to improve muscle delivery and efficiency of ASO treatment for DMD. Our NGS and in vitro results indicate that by applying our in vivo biopanning, it is clear that distinct peptides that are muscle-specific can be identified and validated. However, the effects of conjugation of these peptides to PMOs are currently not sufficient to improve PMO treatment efficiency robustly. Notably, we found that peptides identified with high abundancy in muscle but also liver and kidney tissues (NS-MHPs) did not perform better than peptides that were identified with a somewhat lower abundancy in muscle tissues, but extensively less in off-target organs (S-MHPs) when conjugated onto PMO and tested in vivo. Overall, S-MHP1-PMO seemed to perform best compared to naked PMO treatment, as it improved exon skipping levels to a significant extent in the diaphragm and also improved dystrophin levels in this tissue and gastrocnemius. However, the number of dystrophin-expressing fibers did not improve, and outcome measures representing levels of muscle damage did not either (serum markers or histological analysis). Widespread dystrophin expression throughout the tissue would likely be needed to result in less muscle damage. Our results describing the number of regenerating fibers, inflammation, and fibrosis levels are in agreement with this, since no improvement was observed compared to naked PMO treatment. Our findings confirm that using the ratio rule to differentiate between target tissues and off-target organs is more effective than selecting the highest abundant peptide in the target tissue. This approach did not negatively affect the peptide candidate’s homing potential and appeared to enhance specificity for the tissue of interest. This is also displayed by the results on the level of PMO concentration in muscle tissue. Conjugation of S-MHP1 increased the concentration of PMO significantly in quadriceps, whereas N-MHP1-PMO resulted in significantly lower PMO levels in this muscle tissue. The peptide PMO conjugates we generated did not show adverse effects on liver and kidney markers compared to naked PMO treatment. For S-MHP-1, we did observe significantly increased levels for the BUN marker, however, not to a pathological extent, indicating an overall generally safe profile for these peptides when conjugated to the PMO in the mouse.
Interestingly, N-MHP1-PMO did not always result in the lowest levels of dystrophin restoration in the muscle tissues that we analyzed. We found that in the diaphragm, any of the tested treatments resulted in significantly improved levels of dystrophin restoration. This might indicate that conjugating 7-mer linear peptides could potentially lead to overall improved delivery in general for this tissue, albeit not to an extent that has a consistent beneficial effect. Currently, the effect of the conjugated peptide seems to be insufficient, which can be explained by several reasons outlined in the following paragraph.
There are several ways a conjugate can improve delivery, one of which is by receptor-mediated uptake. If uptake is receptor-mediated, the interaction of the peptide with its target could be too weak to elicit beneficial effects, however, current results do not necessarily point towards weak interaction as the main bottleneck for limited improved efficiency. We would expect that the identified NS-MHPs would have outperformed S-MHPs consistently if a difference in strength of interaction was present, which was not the case.
Therefore, we looked in other directions for explanations of our results.
It is possible that conjugation of PMO and peptide leads to impaired binding potential of the peptides, which would mean that the potential of each identified peptide was reduced. Conjugation is performed using a linker sequence between the peptide and the PMO; however, different strategies of linking are possible. When the peptide is expressed by the phage, a short linker sequence (extra amino acids to generate a space between the phage and the peptide expressed) of only GLy-GLy-Gly-Ser is used between the peptide and phage coat to ensure improved accessibility to its target. We instead used a chemical linker, creating space between the peptide and the PMO, which could have a different effect on the peptide. For example, it could be that the linker we used for conjugating the peptide to the PMO leads to the formation of unknown secondary structures, resulting in binding constraints. Testing different linking strategies would give more clarity on the influence of a linker on the homing potential of the conjugated peptide and the delivery of the PMO.
Alternatively, it could be that the linear muscle-homing peptides are not stable enough in vivo and therefore broken down too fast to have an extended beneficial effect. Even though linear homing peptides are easier to conjugate with compared to their cyclic counterparts, due to the spatial structure of these peptides being more flexible compared to relatively rigid cyclic peptides, this linear structure makes them more vulnerable to proteolytic degradation than cyclic peptides. 24 The addition of a non-natural amino acid to the exposed end of the peptide could help protect against protease activity. 25 Future studies are needed to test if the peptides would still be able to interact with their target normally, since the addition of this amino acid could alter this.
Lastly, it is known that the PMO chemistry is cleared relatively quickly from the bloodstream since, in contrast to other ASO chemistries, it does not bind serum proteins.26–27 Even though it seems that conjugating 7-mer peptides, especially S-MHP1, improves circulation time to some extent, since slightly improved skipping is observed and significantly increased tissue concentration of the PMO could be measured in skeletal muscle, it is likely that this effect of the peptides is diminished due to the size of the PMO compared to a 7-mer peptide. For example, we can see that S-MHP1-PMO resulted in increased skipping in all of our tested tissues. However, this improvement was only present to a significant extent in the diaphragm. Improving the circulation time for the PMO itself, next to using muscle-homing peptides to achieve selective and targeted improved delivery, could be a solution for this. This has been achieved before by making use of lipid conjugation, which improves the pharmacokinetics of the ASO, thereby improving exon skipping levels.28–29
All in all, this study has shown evidence of successful identification of muscle-homing peptides using in vivo phage display and next-generation sequencing, including guidelines for selecting tissue-specific peptides. With these peptide candidates, we aimed to improve targeted muscle delivery of PMO when conjugated and tested in the mdx mouse model, thereby hoping to improve exon skipping and dystrophin restoration. Results of these in vivo tests show that the use of peptide conjugates with muscle-homing abilities can be beneficial. Clearly, some steps will need to be undertaken to improve the efficiency of PMO treatment with muscle-homing conjugates to achieve consistent and general improved results. We propose to investigate the mechanism of binding behind these peptides to explore if artificial adjustments to these peptides can increase interaction with its target, to study if different types of linkers would lead to different effects, and to improve bioavailability of the PMO to ensure that the benefit of muscle homing peptide conjugation can be used to its full potential.
Footnotes
Acknowledgments
The authors thank Dr. Vincent Mouly (Institute of Myology, Paris, France) for providing the human myogenic cell lines used in the study. The authors also thank Davy van de Vijver for his occasional help with tissue collection in our in vivo study.
Author Disclosure Statement
X.T., E.G.T., K.H., A.M., S.G., R.O., and V.G. were employees of Sarepta Therapeutics, Inc., at the time of this research. A.A.-R. is a member of the advisory committee of Sarepta.
For full transparency, the full disclosure statement from A.A.-R.: A.A.-R. discloses being employed by LUMC, which has patents on exon skipping technology, some of which have been licensed to BioMarin and subsequently sublicensed to Sarepta. As co-inventor of some of these patents, A.A.-R. was entitled to a share of royalties. A.A.-R. further discloses being an ad hoc consultant for PTC Therapeutics, Sarepta Therapeutics, Regenxbio, Dyne Therapeutics, Lilly, BioMarin Pharmaceuticals Inc., Eisai, Entrada, Takeda, Splicesense, Galapagos, Sapreme, Italfarmaco, and AstraZeneca. In the past 5 years, ad hoc consulting has occurred for Alpha Anomeric. A.A.-R. also reports being a member of the scientific advisory boards of Eisai, Hybridize Therapeutics, Silence Therapeutics, Sarepta Therapeutics, Sapreme, and Mitorx. SAB memberships in the past 5 years: ProQR. Remuneration for consulting and advising activities is paid to LUMC. In the past 5 years, LUMC also received speaker honoraria from PTC Therapeutics, Alnylam Netherlands, Italfarmaco, and Pfizer, and funding for contract research from Sapreme, Eisai, Galapagos, Synaffix, and Alpha Anomeric. Project funding is received from Sarepta Therapeutics and Entrada via unrestricted grants.
Funding Information
This work was funded by an unrestricted research grant from Sarepta Therapeutics, Inc. (Grant no. SRP-LUMC-001).

References
Supplementary Material
Please find the following supplemental material available below.
For Open Access articles published under a Creative Commons License, all supplemental material carries the same license as the article it is associated with.
For non-Open Access articles published, all supplemental material carries a non-exclusive license, and permission requests for re-use of supplemental material or any part of supplemental material shall be sent directly to the copyright owner as specified in the copyright notice associated with the article.
