
Abstract
In the current digital era, emotional and mental health challenges are becoming very common. Therefore, it is essential to find new and effective ways to support emotional well-being. In this work, we propose ThinkAI helps individuals to better understand and manage their mental health. This platform offers a secure, explainable, and private space where users can express their thoughts and feelings through journaling. ThinkAI then leverages the help of natural language processing (NLP)-based algorithms to analyze these writings to identify emotional patterns. It tracks the changes in the mental well-being of individuals over time. It also offers visual insights that help users see how their emotional states have evolved during that time period, encouraging reflection, and self-awareness. The proposed system also generates alerts in case of adverse situations. ThinkAI comprises two main components: one focused on detecting early signs of depression, and the other on analyzing emotions. The system uses a combination of classical machine learning methods and modern transformer-based models to achieve accurate and reliable results. Both kinds of models were tested. For traditional models, the Support Vector Machine model reported the highest accuracy (0.920) and Receiver Operating Characteristic – Area Under the Curve (ROC-AUC) (0.97) for depression detection, while Naive Bayes had the best recall (0.947). For emotion analysis, Bidirectional Encoder Representations from Transformers (BERT) performed best with an accuracy of 0.945 and an F1-score of 0.9446, closely followed by robustly optimized BERT approach (RoBERTa) and Distilled Robustly Optimized BERT Approach (DistilRoBERTa). Furthermore, to provide a more comprehensive evaluation of the proposed models, we analyzed the training and validation loss across all models up to five epochs, in addition to reporting accuracy. The results highlight how combining classic algorithms with modern transformer-based deep learning models can create powerful tools for understanding emotional and mental health. Thus, ThinkAI offers a promising step toward real-time monitoring of mental health. This work contributes a technically validated and ethically grounded framework. It can be used for real-time monitoring of an individual’s mental well-being, digital therapeutics, and large-scale psychological data analysis.
Introduction
Mental health issues such as depression are a leading global health challenge, affecting over 280 million people worldwide. Such issues contribute significantly to disability, reduced productivity, and poor to diminished quality of life. Characterized by persistent sadness, anhedonia, brain fog, and cognitive impairment, it remains critically underdiagnosed. The underdiagnosis can be due to multiple factors, such as societal stigma, lack of trained mental health professionals, personal hindrances, and reliance on subjective, time-intensive diagnostic methods such as clinical interviews and standardized questionnaires. There is also a gap in the treatment process, with many individuals not receiving timely or adequate intervention. This increases the risk of symptom escalation, leading to a chronic mental health decline. In parallel, there is a rapid growth of digital communication. There is a high availability of user-generated text from social media, online forums, and personal journaling systems. This provides a rich substrate for computational analysis of mental states. Natural language processing (NLP) has emerged as a powerful tool to exploit such data, with linguistic markers, which include sentiment polarity, syntactic complexity, and lexical usage patterns, demonstrating strong correlations with depressive symptoms. Recent advances in deep learning, especially transformer-based models like BERT, Robustly Optimized BERT Approach (RoBERTa), XLNet, DistilRoBERTa, and Decoding-enhanced BERT with Disentangled Attention (DeBERTa), have transformed NLP by enabling deep contextual representation learning, allowing systems to detect nuanced emotional and psychological cues with accuracy. However, most existing mental health detection systems either rely only on transformer-based deep learning architectures or on traditional machine learning classifiers. This binary approach overlooks their complementary strengths. The transformer models excel at extracting fine-grained semantic features. On the other hand, traditional classifiers such as logistic regression (LR), naive Bayes (NB), decision tree (DT), random forest (RF), and support vector machine (SVM) often deliver competitive results in binary classification with smaller datasets. They provide greater interpretability and faster computation. The lack of such hybrid frameworks that combine both these paradigms represents a significant gap in AI-driven mental health analytics. Therefore, to address this challenge, we propose ThinkAI, a secure, AI-powered journaling platform. This platform integrates reflective writing with a dual-stage NLP pipeline for personalized mental health assessment. The first stage employs traditional machine learning classifiers for depression detection. It offers high interpretability and sensitivity, while the second stage leverages state-of-the-art transformer architectures for fine-grained emotion analysis. This, in turn, enables a deeper understanding of the emotional landscape. Furthermore, this hybrid framework improves classification robustness and also supports real-time monitoring, personalized feedback, and potential large-scale deployment in public health surveillance. Our experiments, conducted, reveal that for depression detection, SVM achieved the highest accuracy (0.920) and ROC-AUC (0.970). Followed by LR, which achieved an accuracy of 0.917 and an ROC-AUC of 0.970. Among the traditional classifiers, NB achieved the highest recall of 0.947, crucial for identifying individuals at risk. For experiments conducted to perform emotion analysis, BERT achieved the best overall performance with an accuracy of 0.945, an F1-score of 0.9446, and a loss of 0.1018. This was followed closely by RoBERTa with an accuracy of 0.944 and DistilRoBERTa with an accuracy of 0.942. These results, therefore, underscore the thrust of combining traditional classifiers with transformer-based models. To further validate these results, paired t-tests were conducted on accuracy values. The results show that SVM achieves statistically significant improvements over NB, DT, and RF models (p < 0.05). In addition to accuracy-based evaluation, training and validation loss trends were analyzed over five epochs to provide a more comprehensive assessment of model behavior. Thereby, providing a scalable, interpretable, and high-performance mental health assessment. Thus, by bridging the methodological divide between traditional and deep learning approaches, ThinkAI demonstrates a practical and effective pathway toward early depression detection. It provides emotional self-awareness and personalized mental health support. This marks a significant step forward in the integration of NLP and AI into mental health care systems. Furthermore, this platform provides a confidential and explainable space as the platform users can freely express their thoughts, emotions, and feelings without being judged. Thus, this system fosters an environment of understanding and acceptance. The platform also encourages individuals to engage in daily journal writing, allowing them to explore their emotions and gain insights into their mental well-being. Thus, based on these gaps, the following key research questions (RQ) were developed. They serve as a basis for the development and implementation of the ThinkAI system: How can a hybrid NLP framework that integrates traditional machine learning and transformer models improve the accuracy and overall performance of depression detection and emotion analysis? Can a unified architecture that simultaneously performs emotion recognition and depression detection provide deeper insight into the emotional dynamics of individuals and their correlation with depressive tendencies? How can a secure, AI-powered journaling platform encourage consistent engagement while ensuring user privacy and ethical data handling? What are the comparative strengths, weaknesses, and trade-offs among various traditional classifiers and transformer-based models in identifying emotional and depressive patterns from textual data? In what ways can the proposed NLP-based framework and digital journaling platform be adapted or deployed in real-world mental health support and wellness applications to bridge the gap between academic research and practical mental health care solutions?
Thus, based upon these research questions, the core contributions of this research are summarized as follows:
The proposed system utilizes advanced NLP techniques that strategically combine traditional classification algorithms with advanced transformer-based deep learning models for performance gains in depression detection and emotion analysis. This hybrid design enhances the robustness and interpretability of depression detection and emotion analysis systems while ensuring scalability across different types of textual data. The proposed approach uniquely combines emotion recognition and depression detection tasks within a unified architecture. This enables a deeper understanding of the emotional dynamics of individuals and their correlation with depressive tendencies, offering a more holistic view of mental health patterns. The proposal of a secure, user-cent red digital journaling platform that facilitates consistent engagement. ThinkAI prioritizes data privacy and ethical AI principles by employing encryption, anonymity, and local data storage mechanisms, ensuring that sensitive user information remains protected. A detailed comparative performance analysis has been performed using multiple classifiers and transformer models to understand their relative strengths, weaknesses, and applicability to different mental health detection tasks. This helps in deciding the trade-offs and gives us optimal model choices for different mental health detection tasks. The research outlines the potential application of the proposed system in real-world mental health support platforms and wellness applications. Thus, it bridges the gap between theoretical NLP research and practical, user-cent red healthcare solutions.
The article is organized as follows: Section “Literature Review” provides a detailed review of existing NLP techniques and emotion analysis methods for mental health monitoring. Section “Proposed System” presents the proposed system, Section “Methodology” discusses the methodology adopted, detailing the data acquisition, preprocessing steps, feature extraction techniques, and the model development and evaluation process. Section “Results and Discussions” presents the results and discussions, emphasizing the system’s contributions to mental health support. Lastly, Section “Conclusion and Future Directions” concludes the study, highlighting its implications and suggesting future research directions to advance emotion-driven mental health interventions.
Literature Review
Recent studies have investigated automated approaches for detecting depression and related mental health issues through linguistic and sentiment analysis of social and clinical data. This section presents a structured review of existing literature relevant to depression and emotion analysis in the mental health domain, as shown in Table 1. Here, the key studies are examined in terms of their research objectives, methodologies, tools and technologies employed, principal findings, notable contributions, and acknowledged limitations, providing a foundation for identifying research gaps and guiding the present study. Overall, the literature underscores substantial advancements in depression detection through NLP, yet emphasizes the ongoing need for context-aware and ethically responsible systems to support real-world mental health monitoring.
Summary of related studies on NLP and machine learning approaches for mental health detection
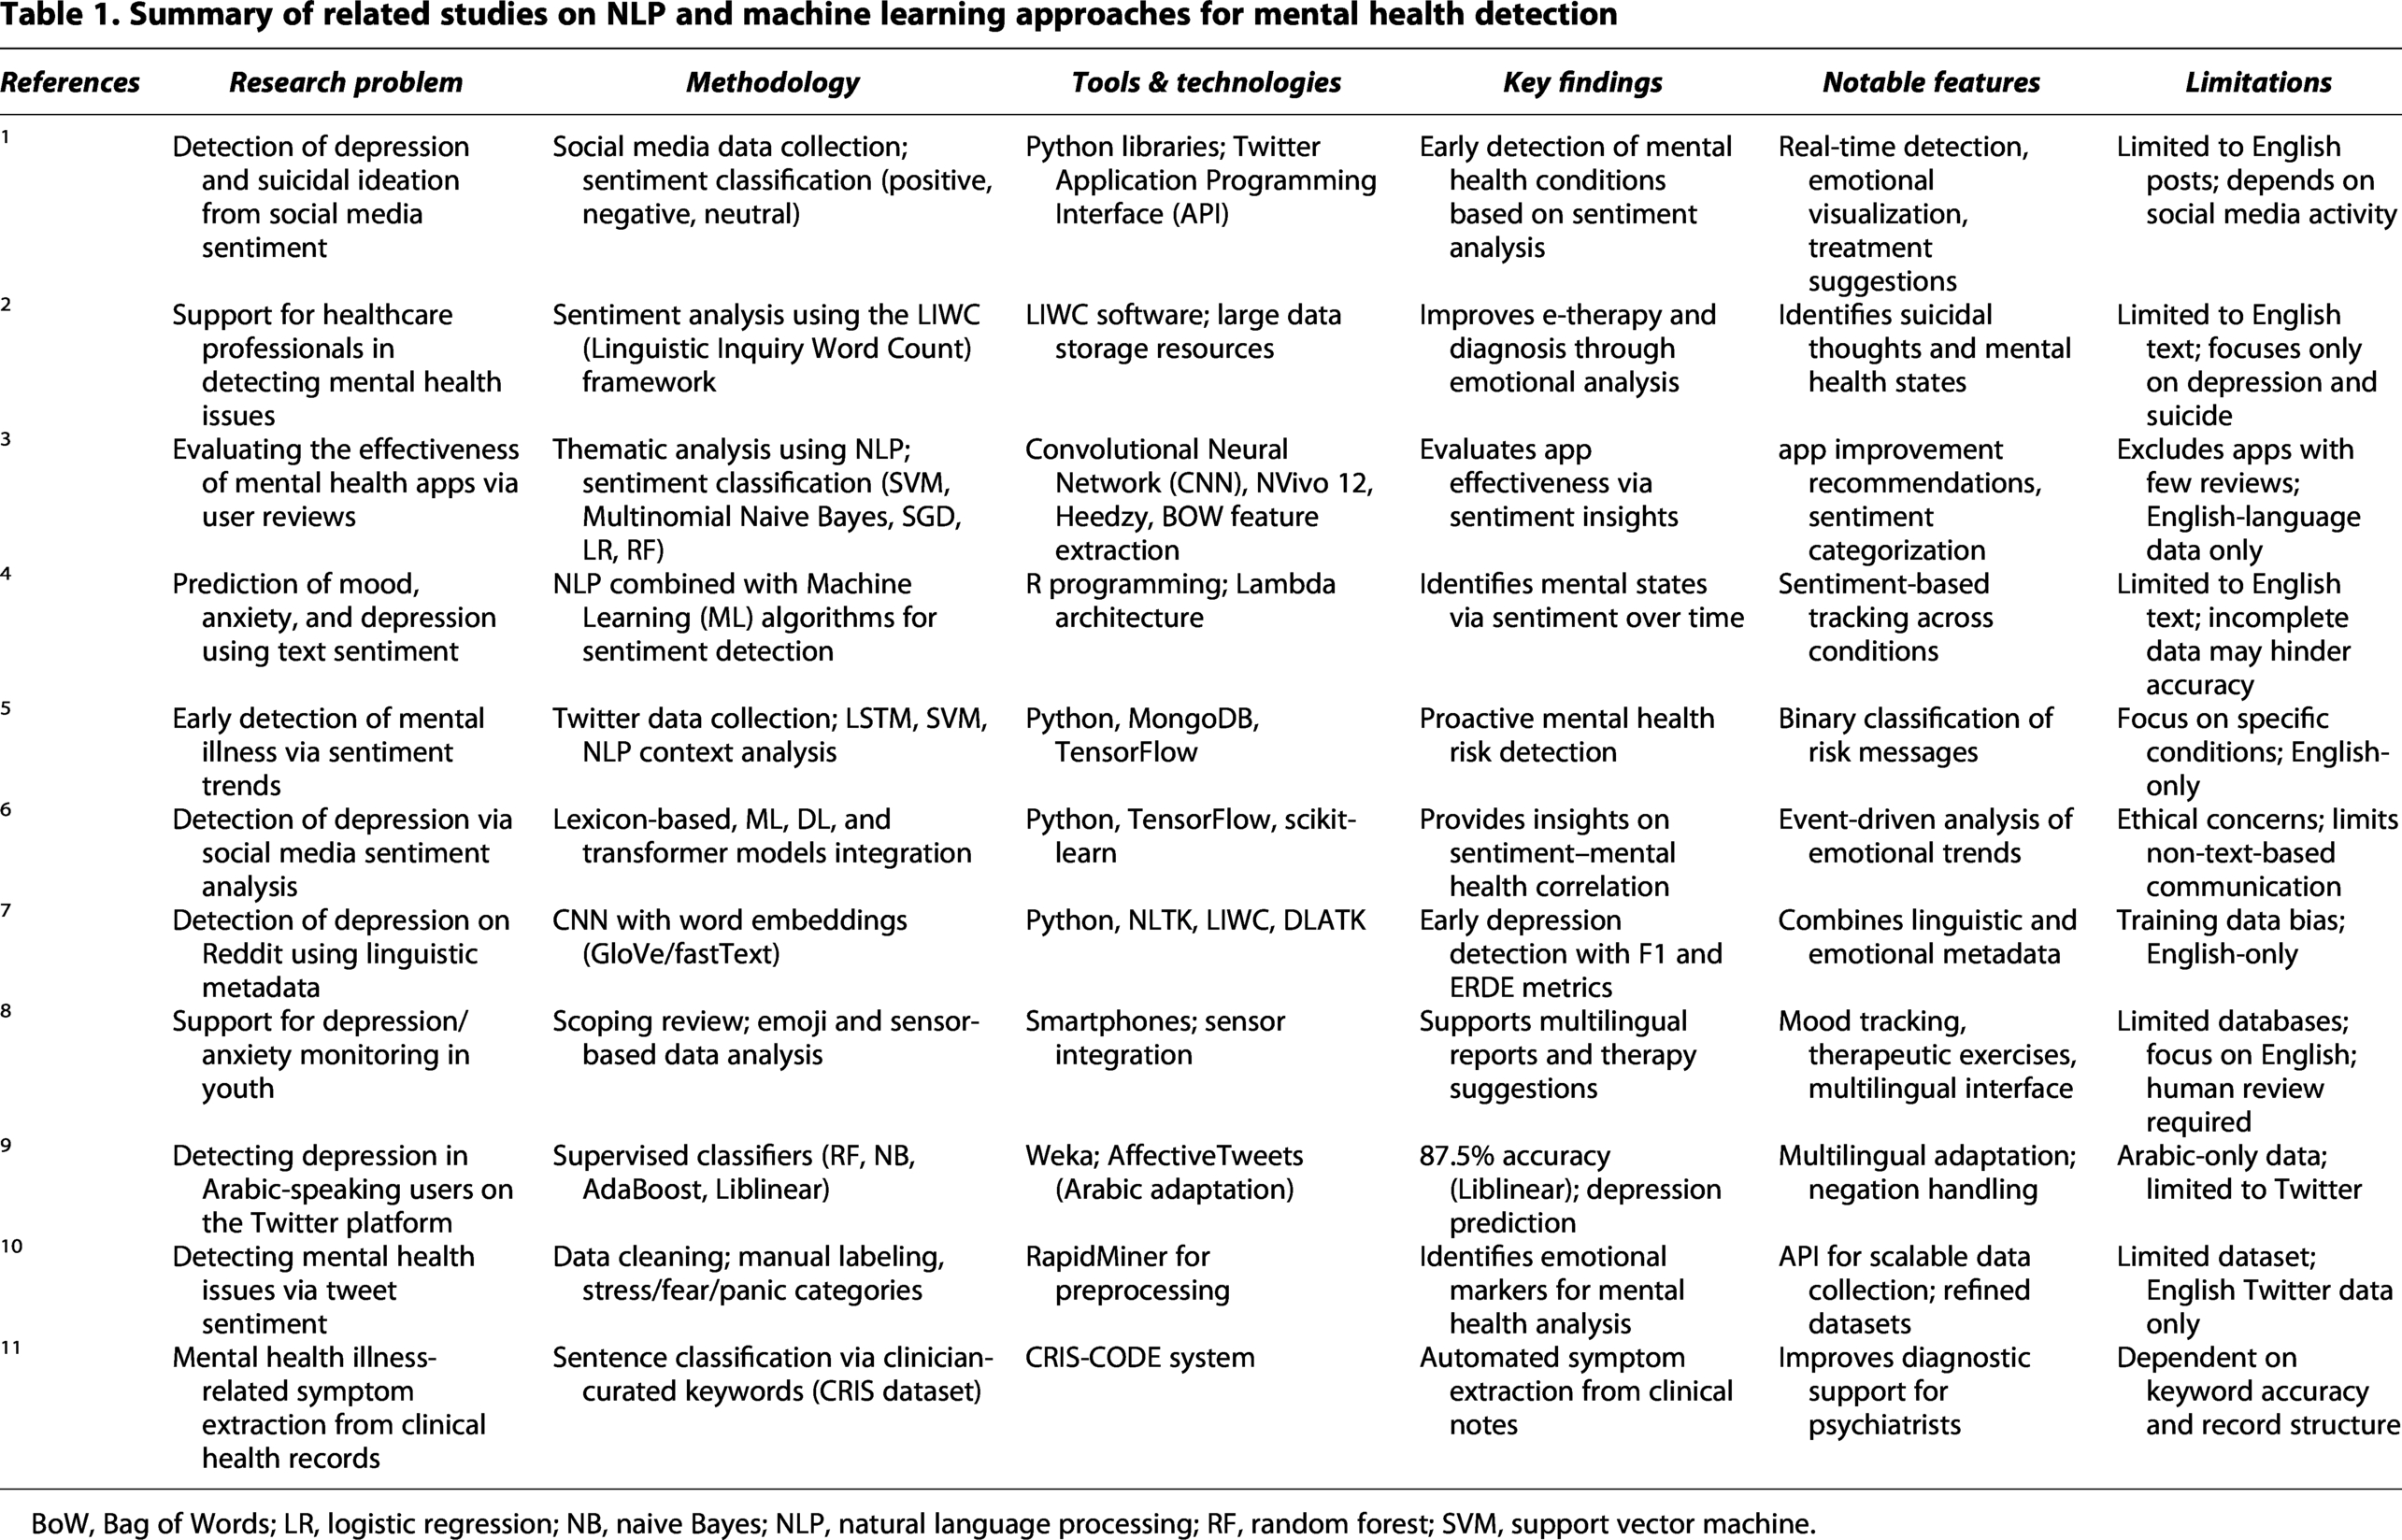
BoW, Bag of Words; LR, logistic regression; NB, naive Bayes; NLP, natural language processing; RF, random forest; SVM, support vector machine.
Proposed System
ThinkAI is an AI-powered mental health analysis platform. Figure 1 illustrates the workflow of the proposed system. This system enables users to record their daily mood and journal entries through their interface, which are analyzed using AI-driven NLP techniques. The model extracts emotional and semantic patterns to generate quantitative insight into users’ mental health trends and triggers alerts in cases of potential severe psychological symptoms. This system comprises four primary modules: (1) User Input Interface, (2) AI-Driven Text Analysis Engine, (3) Insight Generation and Visualization Module, and (4) Alert and Risk Detection System, as illustrated in Figure 1. Each component performs a specific function within the data processing pipeline to ensure seamless data collection, analysis, and interpretation.

Conceptual Framework of ThinkAI System.
User Input Interface
The first component of the system is a journaling interface accessible through web and mobile platforms. This interface allows users to document their daily moods, emotions, and reflections naturally and unobtrusively. Each journal entry is automatically timestamped and may optionally allow users to upload an image to enrich the emotional context. At present, however, any images uploaded by users are not incorporated into the analytical pipeline. They are stored solely for potential contextual reference by the users. This limitation is intentional and reflects the current text-centric scope of the system. In the future, ThinkAI may extend this interface to include image-based affective analysis using computer vision techniques, subject to further validation and consideration of ethical implications. The interface captures both structured inputs (e.g., predefined mood labels such as Happy, Sad, or Anxious) and unstructured textual inputs (e.g., free-form journal entries describing the user’s thoughts and experiences during that particular date and time). This dual-input approach enables the system to gather both categorical and descriptive emotional information, forming a comprehensive dataset for analysis.
AI-Driven Text Analysis Engine
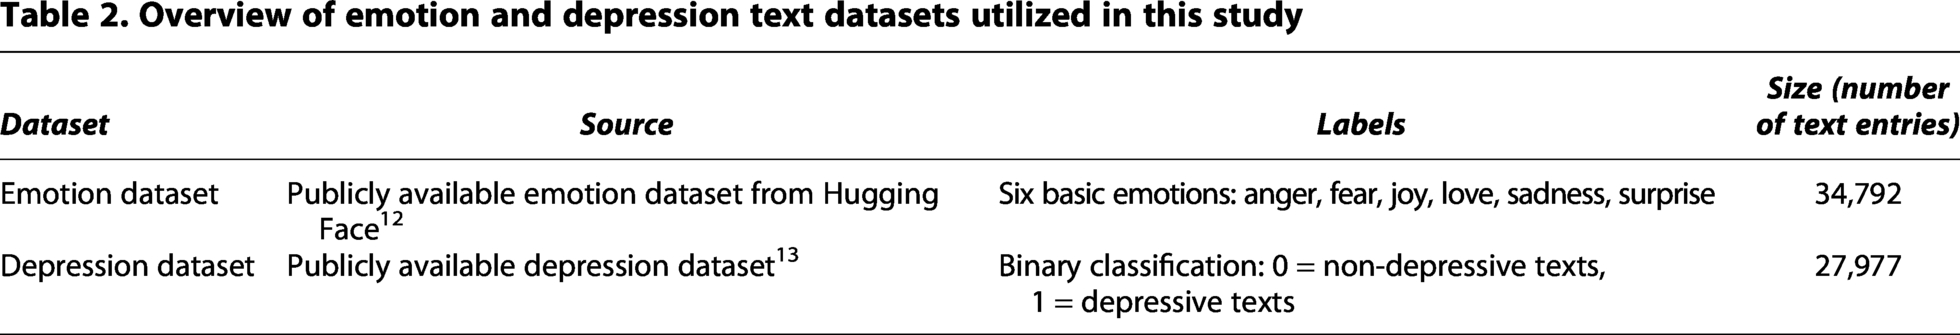
Once data is collected in the form of journal entries, it is processed through the AI-driven Text Analysis Engine, which forms the analytical core of the ThinkAI System. This module utilizes a NLP pipeline to extract emotional, linguistic, and semantic features from user-generated text. The engine employs a hybrid analytical approach that combines traditional machine learning algorithms with transformer-based deep learning models. Specifically, BERT and RoBERTa pre-trained language models are employed to generate contextualized text representations. These models have been selected for their strong performance in affective computing and mental health text analysis. These transformer models serve as feature extractors as well as task-specific classifiers within the pipeline. To adapt the models to the domain of emotional journaling, fine-tuning is performed using supervised learning on publicly available, annotated datasets. As summarized in Table 2, emotion classification models are fine-tuned on an emotion dataset sourced from Hugging Face. 12 For depression detection, a separate binary labelled dataset is utilized, where texts are annotated as depressive or non-depressive. 13 During fine-tuning, model parameters are optimized to minimize task-specific loss functions, enabling the models to capture emotionally salient linguistic patterns and depression-related markers. The transformer-based outputs are optionally complemented with traditional machine learning classifiers to enhance robustness and interpretability within the hybrid framework.
Overview of emotion and depression text datasets utilized in this study
Insight Generation and Visualization Module
Following analysis, the processed data is stored in a structured database and aggregated to produce actionable insights. This Insight Generation and Visualization Module transforms raw analytical outputs into interpretable visual representations. It summarizes emotional trends and behavioral patterns. The system periodically generates dashboards for users. These dashboards include weekly depression analyses, emotion trend charts, and monthly emotional summaries. The visualizations also employ graphical components such as pie charts and bar graphs to reveal patterns in mood fluctuations and recurring affective states. These insights enable users to gain self-awareness. It makes them vigilant against their emotional well-being. It can also further support clinicians or researchers in conducting assessments of mental health.
Alert and Risk Detection System
The final module of the architecture is the Alert and Risk Detection System, which operates as a real-time monitoring and safety mechanism. This component continuously evaluates analyzed entries for indicators of severe emotional distress, such as expressions of hopelessness and suicidal ideation, or extreme negative mood over a period. Alert generation in this module is based on the output of machine-learning classifiers trained on annotated mental health datasets. An alert is triggered when the predicted risk score exceeds a predefined threshold over one or more consecutive entries. This indicates either acute distress or a persistent deterioration in emotional state. In the current system design, alert notifications are delivered exclusively to the user in the form of in-app warnings or notifications encouraging self-reflection and help-seeking behavior. The system does not automatically notify clinicians, caregivers, or third parties, thereby preserving user autonomy and privacy. However, the interface may optionally provide users with guidance on external mental health resources when elevated risk is detected. This alert mechanism is intended to support early self-awareness and preventive intervention rather than to serve as a diagnostic or emergency response system. Extensions to include clinician- or caregiver-mediated alerts may be considered in future versions, depending upon the user consent, regulatory compliance, and ethical review. The proposed ThinkAI framework can be naturally extended to support speech-based inputs by incorporating a speech-to-text pipeline as a preprocessing module. In this extension, user speech is first converted into text using an automatic speech recognition (ASR) system, after which the transcribed text is processed by the existing NLP-based emotion analysis and depression detection components, without requiring significant architectural modifications. Additional paralinguistic cues, such as pause duration, speech rate, and prosodic features, can also be extracted at the ASR stage and fused with textual representations to enhance emotional inference. This modular design enables seamless integration of multimodal data while preserving the core analytical pipeline, thereby expanding ThinkAI’s applicability to voice-enabled mental health monitoring, conversational agents, and real-time therapeutic support systems.
Methodology
In ThinkAI, emotion recognition and depression detection work together within a unified pipeline. Journal entries are first analyzed to identify emotional states using transformer-based models, and these outputs inform the depression detection module to assess potential depressive tendencies. Both sets of results are aggregated in the Insight Generation and Visualization Module to create comprehensive dashboards. Alerts are triggered when sustained negative emotion patterns coincide with elevated depression risk scores, providing timely, interpretable insights without replacing professional judgment. The detailed methodology used for performing the analysis of the ThinkAI system is shown in Figure 2. It outlines the steps followed during the ThinkAI system’s development and evaluation. The process comprises steps such as data collection and preprocessing, followed by feature extraction and model design.
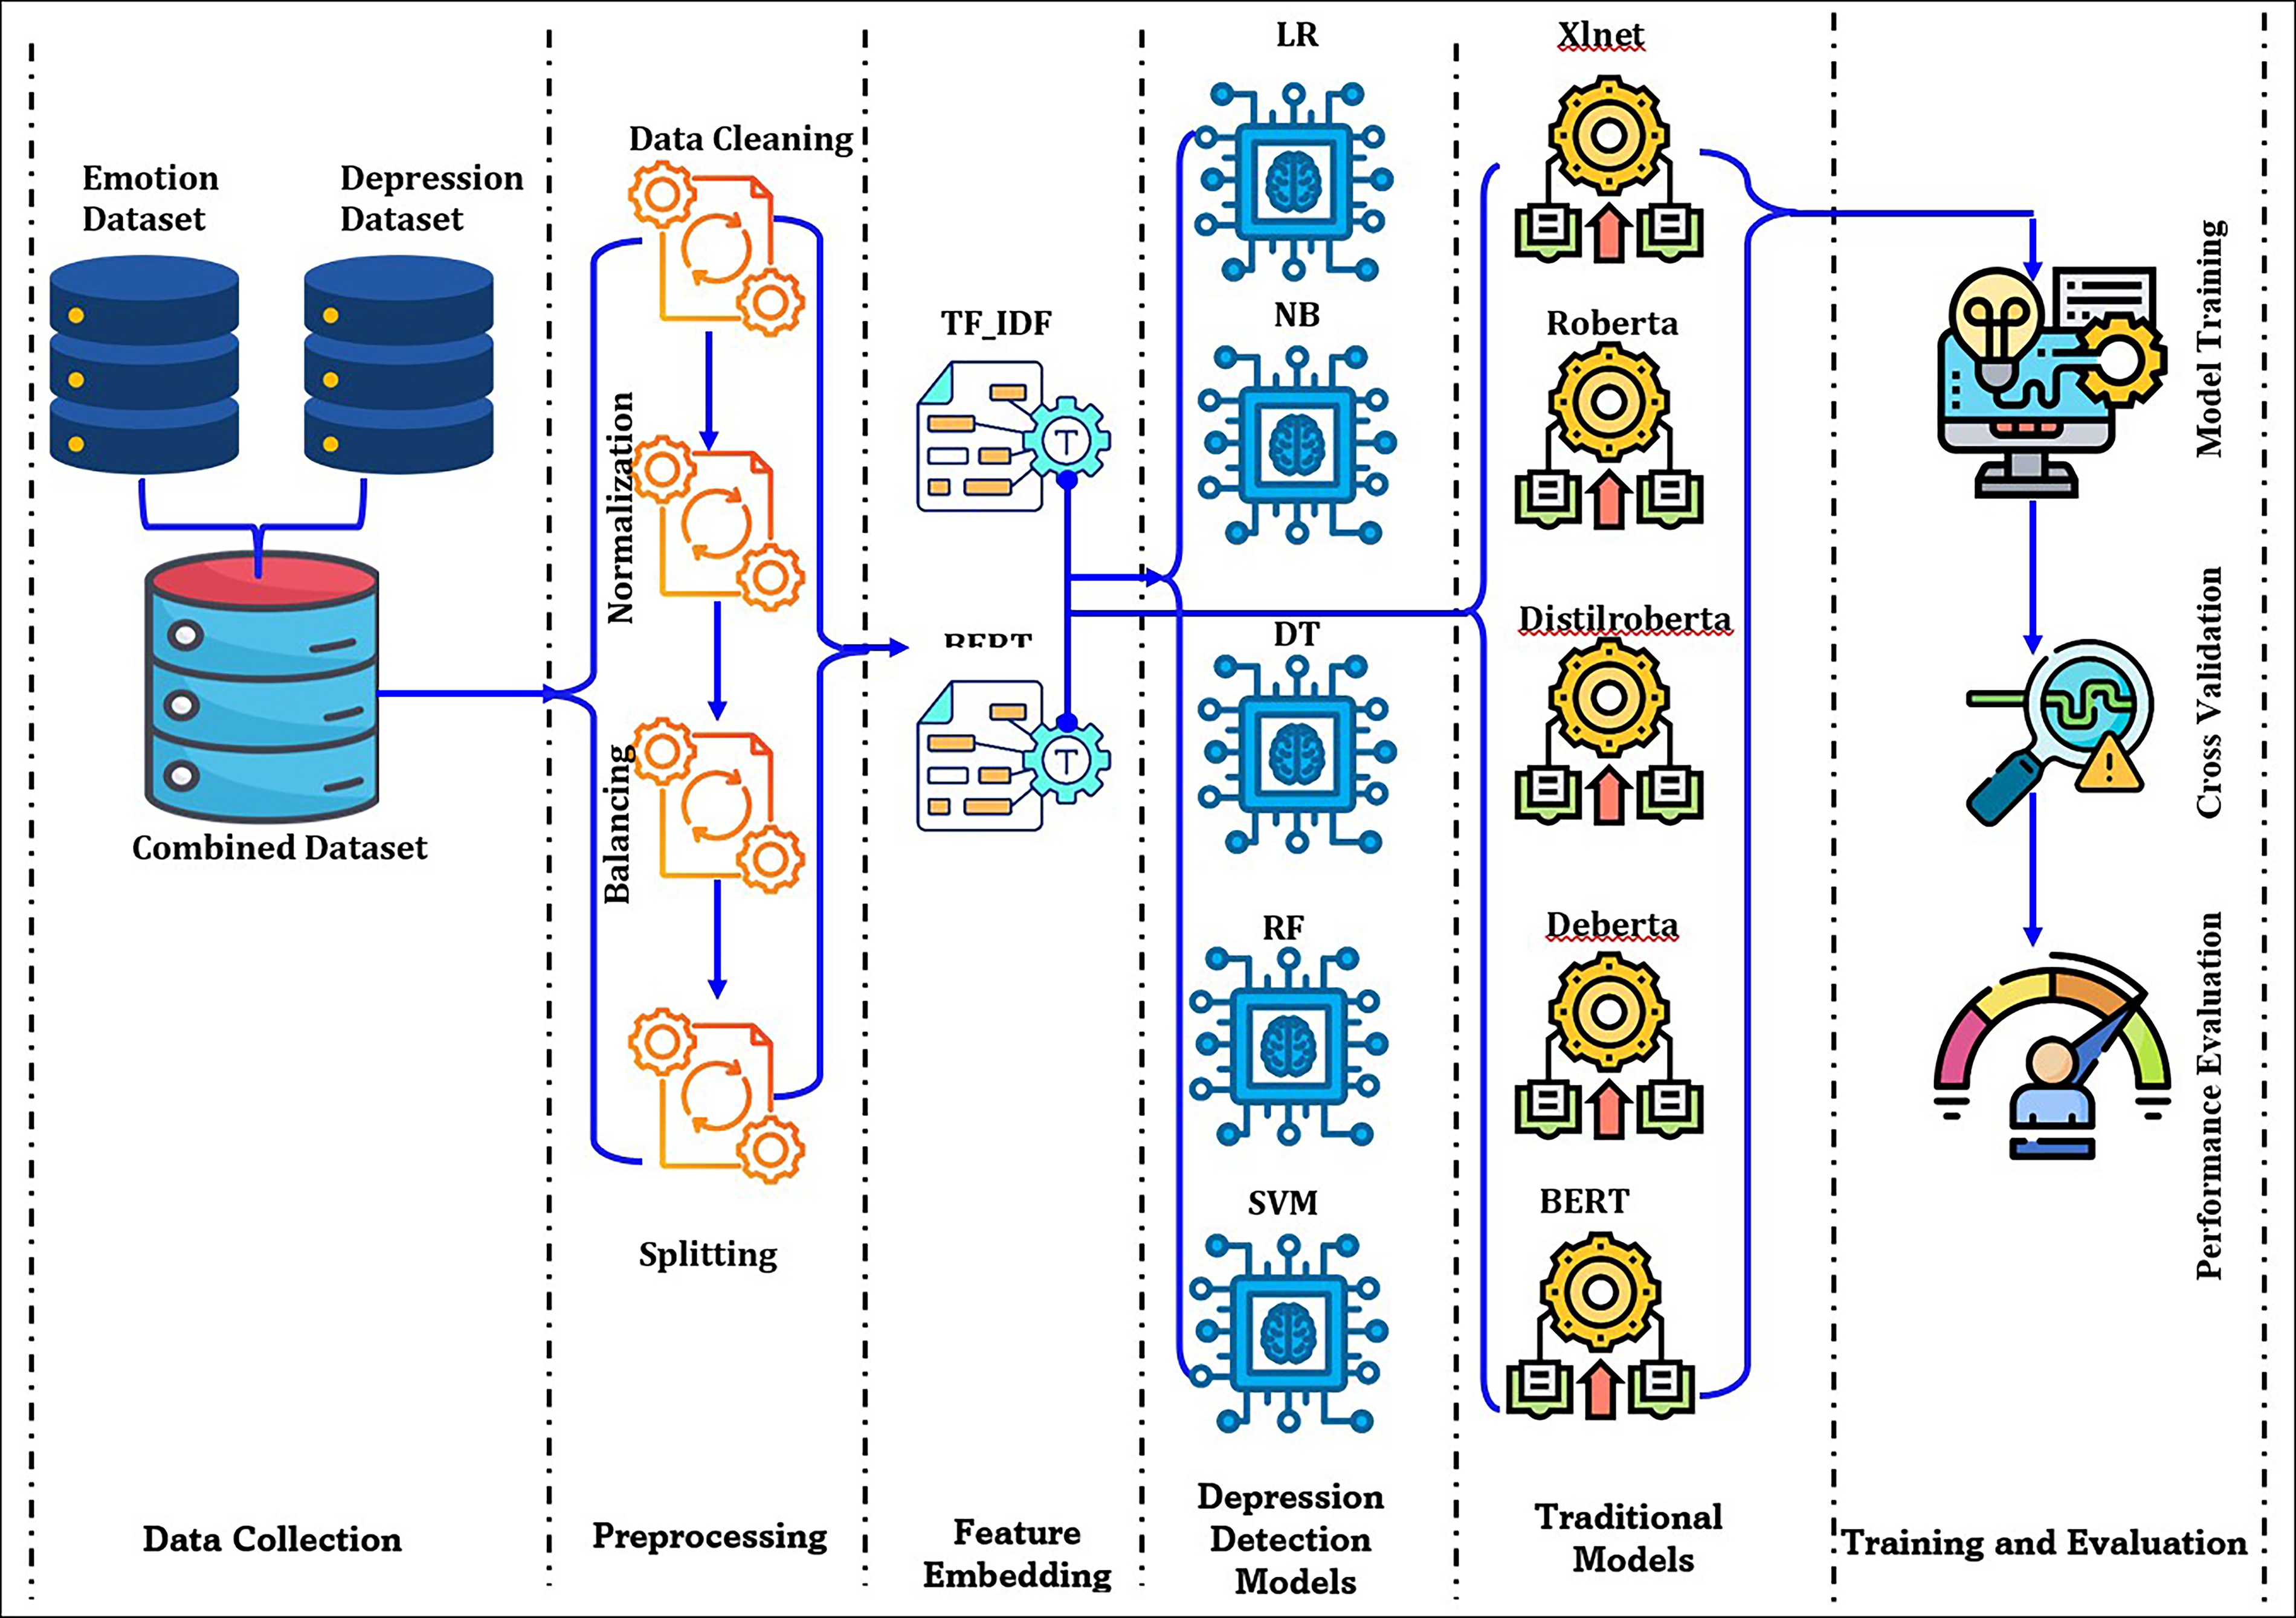
Methodology for the proposed System.
Subsequently, the model is trained and tested using appropriate datasets, which will be discussed in detail in the section on data collection. Finally, its performance is evaluated using standard metrics. Each stage plays a crucial role in ensuring the accuracy, efficiency, and reliability of the proposed system.
Data collection
The proposed mental health support system, ThinkAI, integrates NLP and emotion analysis to provide users with a secure platform for expressing and tracking their emotions. For this study, two datasets were utilized to capture both emotional nuances and signs of depression in textual data. The datasets used have been summarized in Table 2.
The first dataset was an emotion dataset. This dataset was obtained from a publicly available repository on Hugging Face. 12 It contained around 34,792 text entries, each labeled with one of six fundamental human emotions. These emotions were anger, fear, joy, love, sadness, and surprise. The reason for choosing this dataset was chosen was due to its balanced representation of emotional expressions. The choice of this dataset ensured that the models could be trained on a diverse range of human emotions accurately. Thus, by providing a rich spectrum of emotional states, this dataset enables the development of systems, which can understand and respond to human emotions in a fine-grained manner. The second dataset chosen focused on depression detection. It was obtained from a publicly available source on GitHub. 13 It consisted of 27977 text entries. The data was categorized into two classes: “0” for non-depressive texts and “1” for depressive texts. This binary-labeled dataset was selected for its relevance in identifying depressive tendencies from written language. Thus, it was suitable for training models used by us for detecting adverse mental health signals. Its adequate size and clear labeling provided a reliable foundation for building and evaluating predictive models. Thereby, it was also capable of handling the challenge of capturing subtle linguistic cues associated with depression. Together, these datasets offered a complementary perspective. The emotion dataset highlighted the variety of human feelings expressed in text, while the depression dataset focused on mental health indicators. The usage of both these datasets thus allowed the study to explore the intersection of emotional states and depressive patterns. It also addressed the RQ2 presented in “Introduction” section, laying the groundwork for developing AI systems capable of both emotion recognition and mental health assessment from textual data.
Data preprocessing
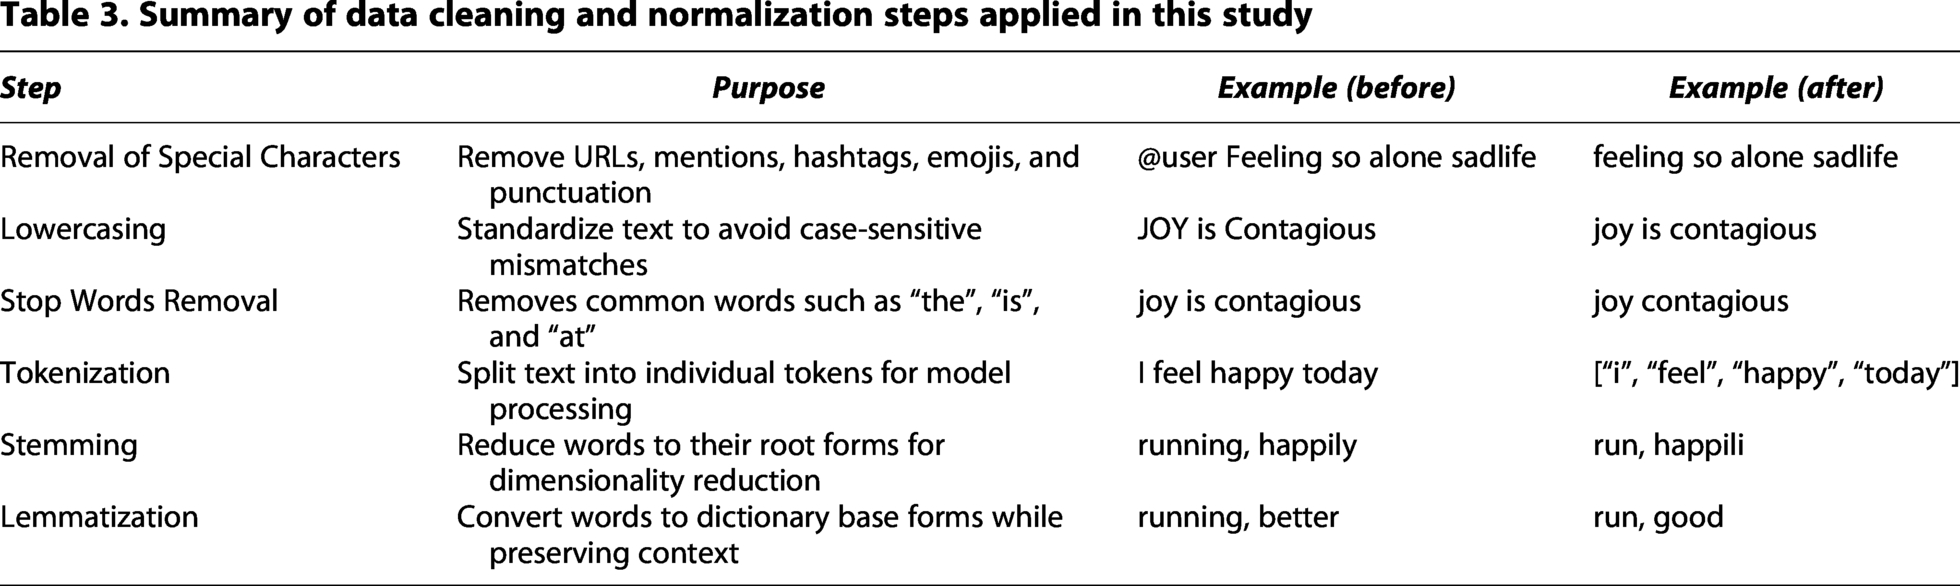
Data preprocessing is a critical step to ensure the quality, consistency, and suitability of text data for training machine learning models. For the proposed emotion and depression classification system ThinkAI, the raw text data from both datasets underwent a structured preprocessing pipeline. This pipeline was designed to remove noise, normalize content, and also preserve semantic meaning. The steps employed were as follows, also shown in Table 3.
Summary of data cleaning and normalization steps applied in this study
Data Cleaning
The text-cleaning process removes irrelevant or extraneous elements that could introduce noise and reduce the model’s performance. The following methods were implemented for data cleaning:
Removal of Special Characters: All non-alphanumeric characters, including URLs, mentions (@), hashtags (#), punctuation marks, and emojis, were removed using regular expressions. This ensured that only linguistically relevant content remained.
Example:
Before: user Feeling so alone sadlife After: feeling so alone sad life. Lowercasing: To maintain uniformity and avoid treating the same word in different cases as separate tokens, all characters were converted to lowercase.
Example:
Before: JOY is Contagious After: joy is contagious Removal of stop words: In NLP, stop words are common, high-frequency words that carry minimal semantic meaning. The stop words include words such as “is,” “the,” “a,” and “of”. These words are typically removed during preprocessing to reduce noise and improve the focus on meaningful content. For example, the sentence “Joy is contagious” is transformed into “Joy contagious” after stop-word removal. This process ensures that the system captures the most relevant lexical items, which is particularly important in depression detection, as it allows the model to focus on emotionally significant words and phrases that indicate depressive or non-depressive states.
Normalization
Normalization reduces lexical variation in the text while retaining the core meaning. Two normalization techniques were used in this system:
Tokenization:
Tokenization is the process of splitting text into smaller units (tokens) such as words. This allows each token to be processed independently for embedding and modeling. Tokenization was implemented using libraries such as NLTK
14
and SpaCy.
15
Example: Input: i feel happy today Output: [“i”, “feel”, “happy”, “today”]
Stemming:
Words were reduced to their root form using the Porter Stemmer. While stemming can result in non-dictionary words, it effectively reduces dimensionality. Example: Before: running, happily After: run, happili
Lemmatization:
Lemmatization converts words to their dictionary or base form while preserving contextual meaning. Lemmatization was implemented in the proposed approach using SpaCy’s lemmatizer. Example: Before: running, better After: run, good
Data Balancing and Splitting
The collected datasets exhibited class imbalances, with some emotions or non-depressive texts being more frequent than others. Therefore, to overcome this, data balancing was performed. This step ensured that the model learned equally from each category. For the Emotion Dataset, classes with fewer examples were upsampled using the Random Oversampling technique to match the size of the largest class. In the Depression Dataset, the minority class (depressive texts) was oversampled, and the majority class was undersampled. For example, in the Depression Dataset, before balancing, Class 0 (non-depressive) had 18,700 samples while Class 1 (depressive) had 9277 samples. After balancing, both classes contained 18700 samples, ensuring an equal representation for model training.
During data splitting, each dataset was divided into training, validation, and test sets to ensure reliable model evaluation, as shown in Table 4.
Distribution of emotion and depression datasets into training, validation, and testing sets for model development
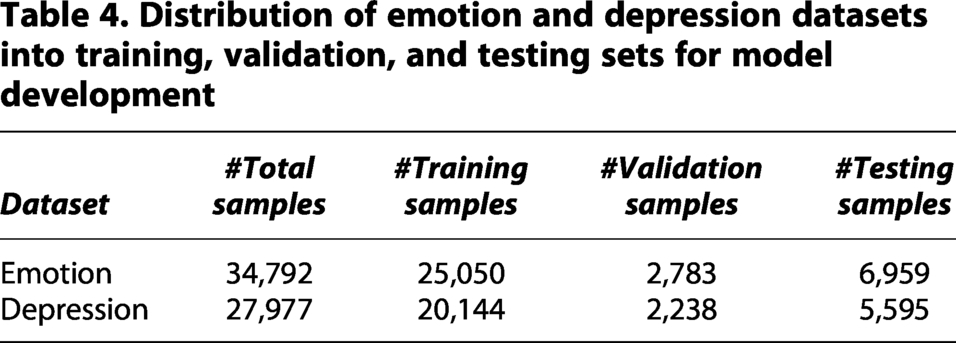
The test set, comprising 20% of the data, was held out for final evaluation on unseen samples (e.g., 6959 samples for the Emotion Dataset). The remaining 80% was used for training the model (e.g., 27,833 samples for the Emotion Dataset). From the training portion, approximately 10% was further separated as a validation set to tune hyperparameters and prevent overfitting (e.g., 2783 samples for validation and 25,050 samples for actual training in the Emotion Dataset).
To address class imbalance while ensuring unbiased performance evaluation, oversampling was applied exclusively to the training data. After splitting the dataset into training, validation, and test sets, as described above, class-balancing techniques were performed only on the final training subset. The validation and test sets were left unchanged and retained their original class distributions to prevent data leakage and to provide a realistic assessment of model generalization on unseen samples.
Feature embedding techniques
Feature extraction transforms preprocessed text into a numerical form suitable for machine learning models. This step is an important step in NLP as it helps to gain insights into text. The following are the feature extraction techniques adopted by us in the proposed model.
Term Frequency-Inverse Document Frequency
Term Frequency-Inverse Document Frequency (TF-IDF) is a widely employed technique for feature extraction. It enhances the Bag of Words model by incorporating the significance of terms across the entire corpus. TF-IDF assigns greater weights to terms that are unique or rare within a document while diminishing the influence of frequently occurring terms across multiple documents. This weighting scheme improves the model’s ability to differentiate between documents. This process makes it effective for text classification tasks, which include sentiment analysis, where distinguishing key terms is crucial. TF-IDF combines two metrics:
Term Frequency (TF): TF measures how frequently a term appears in a document. It is calculated as:
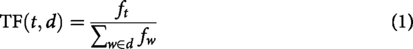
Where: t is the term being measured, d is the document, Inverse Document Frequency (IDF): IDF measures how unique a term is across all documents in the corpus. It is calculated as:
Where: t represents the term being measured; D denotes the set of all documents; |D| indicates the total number of documents in the corpus; and Combining the above two equations the TF-IDF score for a term t in a document d is calculated as:


Word Embeddings
Transformer-based pre-trained models such as DeBERTa, RoBERTa, DistilRoBERTa, BERT, and XLNet have been applied in the proposed system to generate contextual embeddings. These models are described in detail in the subsection “Emotion detection using transformer models.” These models tokenize input text, encode tokens into high-dimensional vectors, and pass them through layers to capture contextual information. The final hidden states represent learned features that can be used for tasks such as sentiment analysis, offering an efficient approach to feature extraction without any explicit engineering.
Model development and training
The model development for ThinkAI was performed in two stages. The first stage involved models for emotion detection, and the second stage involved model development for depression detection. To ensure reliability and generalizability, each dataset was split into an 80:20 ratio, that is, a training set (80%) and a testing set (20%).
Depression Detection using Traditional Models
In the initial phase of the proposed system, traditional machine learning models were employed to establish a baseline for detecting depressive tendencies in textual data. These models rely on statistical and probabilistic approaches to identify linguistic patterns and word usage associated with depression. The following subsection outlines the traditional models utilized in this study and their specific roles in depression detection.
Logistic Regression: A statistical model that performs binary classification by estimating the probability of an instance belonging to a particular class. It uses a logistic (sigmoid) function to map predicted values to probabilities. Therefore, it is suitable for tasks where outcomes are categorical. It estimates the probability

Where,
In the proposed system, LR serves as a baseline classifier, providing interpretable insights into how specific linguistic features (e.g., negative affect words, self-references) correlate with depressive tendencies in text.
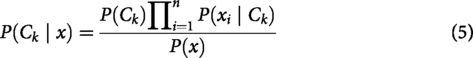
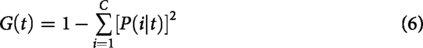
Naive Bayes: NB is a probabilistic classification algorithm, which uses Bayes’ theorem. It is based on the assumption of feature independence. It is suitable for our task of depression detection, as it efficiently models the probability of depressive versus non-depressive texts based on word occurrences. Its simplicity and high speed make it ideal for text-based mental health screening where quick preliminary classification is needed. It computes the posterior probability of a class Decision Tree: A non-parametric supervised learning algorithm that recursively partitions the feature space into disjoint regions. Predictions are made based on the majority class (for classification) or the average target value (for regression) within each terminal node. It partitions the dataset into hierarchical structures. It achieves this by selecting features that maximize information gain or minimize impurity. The Gini impurity for a node t is given as: Random Forest: RF is an ensemble learning technique. It builds multiple DTs on random subsets of data and features. For a given text instance x, the final predicted class, denoted as

Here, Support Vector Machine: SVM is a supervised learning algorithm used for binary classification. It aims to find the optimal hyperplane separating two classes with the maximum margin. The decision function for a given instance

Where, 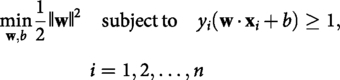
Where,
Emotion detection using transformer models
Emotion detection can be significantly enhanced by leveraging advanced pre-trained language models such as DeBERTa, RoBERTa, DistilRoBERTa, BERT, and XLNet. Therefore, in this section, these transformer models have been utilized to detect user emotions. The models employed by us in this system are detailed as follows:
BERT (Bidirectional Encoder Representations from Transformers)
16
: BERT follows a bidirectional transformer architecture, allowing it to derive contextual representations from both directions. Its versatility and effectiveness have made it suitable for the task of emotion analysis. The key training objective is Masked Language Modeling


For emotion detection, fine-tuned BERT models effectively classified subtle affective states by leveraging contextualized word embeddings and sentence-level dependencies.
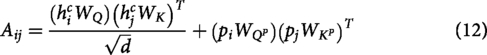
DeBERTa (Decoding-enhanced BERT with disentangled attention):
17
DeBERTa extends the capabilities of BERT by incorporating disentangled attention mechanisms and enhanced decoding strategies. This disentangling mechanism allows DeBERTa to capture fine-grained emotional cues by modeling subtle contextual shifts within sentences. These innovations improve the model’s ability to capture nuanced contextual relationships, enabling state-of-the-art performance across various NLP tasks, including emotion detection. The disentangled attention for tokens i and j is computed as: Robustly Optimized BERT Approach:
18
RoBERTa is an optimized version of BERT that achieves superior performance by refining the pre-training process. It eliminates the NSP objective, employs dynamic token masking during training, and is trained on a larger and more diverse dataset. These refinements make RoBERTa robust for emotion detection tasks, improving its ability to capture nuanced contextual and semantic information. In RoBERTa,

Where M is the set of positions of the masked tokens,
Minimizing DistilRoBERTa:
19
DistilRoBERTa is a compressed and efficient version of RoBERTa, designed to achieve a balance between computational efficiency and predictive performance. The training of DistilRoBERTa uses a multi-objective loss function defined as:

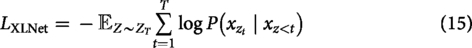
Where XLNet:
20
XLNet is a transformer-based language model that employs a permutation-based language modeling objective combined with autoregressive training, overcoming limitations of standard bidirectional models. This approach enhances its contextual understanding and achieves state-of-the-art performance on several NLP benchmarks, making it particularly effective for tasks such as emotion detection. The training objective of XLNet is defined as:
Model evaluation
Evaluating a machine learning model is an important step in understanding how reliable it is at finding signs of depression and emotional patterns in text. This process makes sure the model isn’t just accurate but also fair and consistent when predicting different types of outcomes, such as correctly identifying positive and negative emotions. In this study, we used several evaluation measures to test how well each model performs. These measures help show how effectively the models can understand and make predictions on new, unseen data. The next section explains these evaluation methods in more detail, along with their mathematical formulas.
Evaluation metrics
To assess the performance of the proposed models, standard evaluation metrics were employed, which include accuracy, loss, precision, F1-Score, and recall. These measures were computed from the confusion matrix (Table 5).
Confusion matrix representation for binary classification
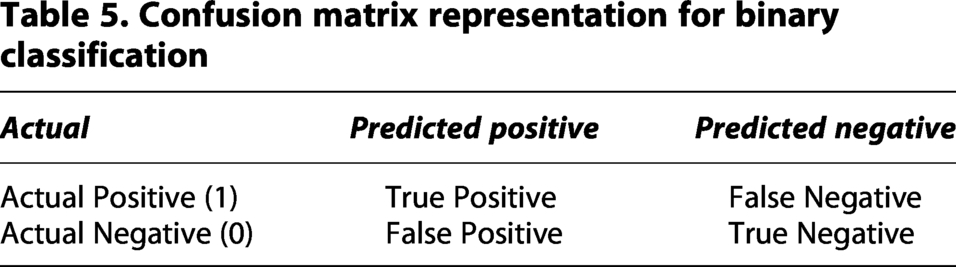
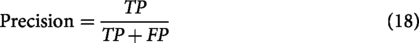
Accuracy: Accuracy measures the proportion of correctly classified instances out of the total number of instances. It is defined as:

Where TP (True Positives) is the number of correctly predicted positive instances, TN (True Negatives) is the number of correctly predicted negative instances, FP (False Positives) is the number of negative instances incorrectly predicted as positive, and FN (False Negatives) is the number of positive instances incorrectly predicted as negative.
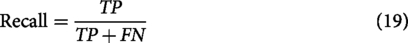
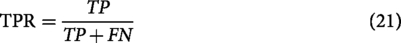
Loss (Cross-entropy for classification): Cross-entropy loss captures the error in predictions by comparing the predicted probabilities to the actual labels. It is widely used in binary classification tasks and is defined as: Precision: Precision measures the proportion of correctly predicted positive instances out of all instances predicted as positive. It is defined as: Recall (Sensitivity): Recall measures the proportion of actual positive instances that are correctly predicted by the model. It is defined as: F1-Score: The F1-score is the harmonic mean of Precision and Recall, providing a balanced measure of a model’s performance by considering both false positives and false negatives. It is defined as:


This metric is particularly useful when there is an imbalance between classes, as it ensures that both the ability to correctly identify positive instances (Recall) and the accuracy of positive predictions (Precision) are taken into account.
ROC Curve: The receiver operating characteristic (ROC) curve plots the True Positive Rate (TPR) against the False Positive Rate (FPR). It provides a graphical representation of a model’s discriminative ability. The True Positive Rate, also known as Recall or Sensitivity, is defined as:
The False Positive Rate, which measures the proportion of negative instances incorrectly classified as positive, is defined as:
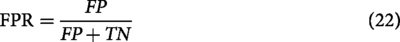
Plotting TPR against FPR across different thresholds allows evaluation of the trade-off between sensitivity and specificity, and the area under the ROC curve (AUC) is commonly used as a summary metric of overall model performance.
Results and Discussions
This section presents and interprets the experimental results from the proposed models for depression detection and emotion analysis. The findings are examined to evaluate each model’s accuracy, reliability, and interpretability. By comparing traditional machine learning and transformer-based approaches, this section highlights their respective strengths, limitations, and real-world relevance in supporting early mental health detection and emotional understanding. Furthermore, ethical considerations, data protection, and informed consent relating to the proposed system are also presented.
Performance evaluation
We evaluated our two models for depression detection and emotion analysis to assess how accurately they capture depressive patterns and emotional cues from text. The final models deployed in ThinkAI were selected based on their predictive performance. Transformer-based models, particularly BERT, were chosen for emotion analysis due to their superior accuracy and ability to capture contextual emotional information. In contrast, traditional models such as SVMs were selected for certain classification tasks because of their lower computational complexity and faster inference. This section describes the results of the performance of our two models for depression detection and emotion analysis.
Depression Detection Models
To evaluate the linguistic and predictive patterns associated with depression, we implemented a two-step approach. It involved combining qualitative and quantitative methods. The first step involves generating word cloud visualizations to identify dominant lexical features in depressive versus non-depressive texts. This step highlights the most frequent words in depressive versus non-depressive texts, clearly revealing differences in emotional expression and the underlying themes of the content. This preliminary analysis informed the design of our machine learning models. In the second phase, we developed and tested traditional supervised classifiers, including LR, NB, DT, RF, and SVM to detect depressive content. The following subsections present the visual insights from the word clouds and the classification models.
Word Cloud Analysis for Depression Detection
To explore linguistic differences between depressive and non-depressive textual expressions, word clouds were generated for each category. These visualizations highlight the most frequently occurring words, offering insights into the underlying emotional and thematic patterns.
The word cloud for depression-related text and the most frequently used words in depressive text, shown in Figures 3 and 4, respectively, show a prevalence of emotionally negative and existential terms. Dominant words such as “know,” “life,” “feel,” “want,” “think,” “even,” “friend,” “help,” “bad,” “alone,” and “die” reflect common themes associated with depression, including emotional distress, isolation, and suicidal ideation. Notably, terms such as “kill,” “die,” “hurt,” and “end” suggest acute psychological suffering and may indicate the presence of suicidal thoughts or severe depressive symptoms.
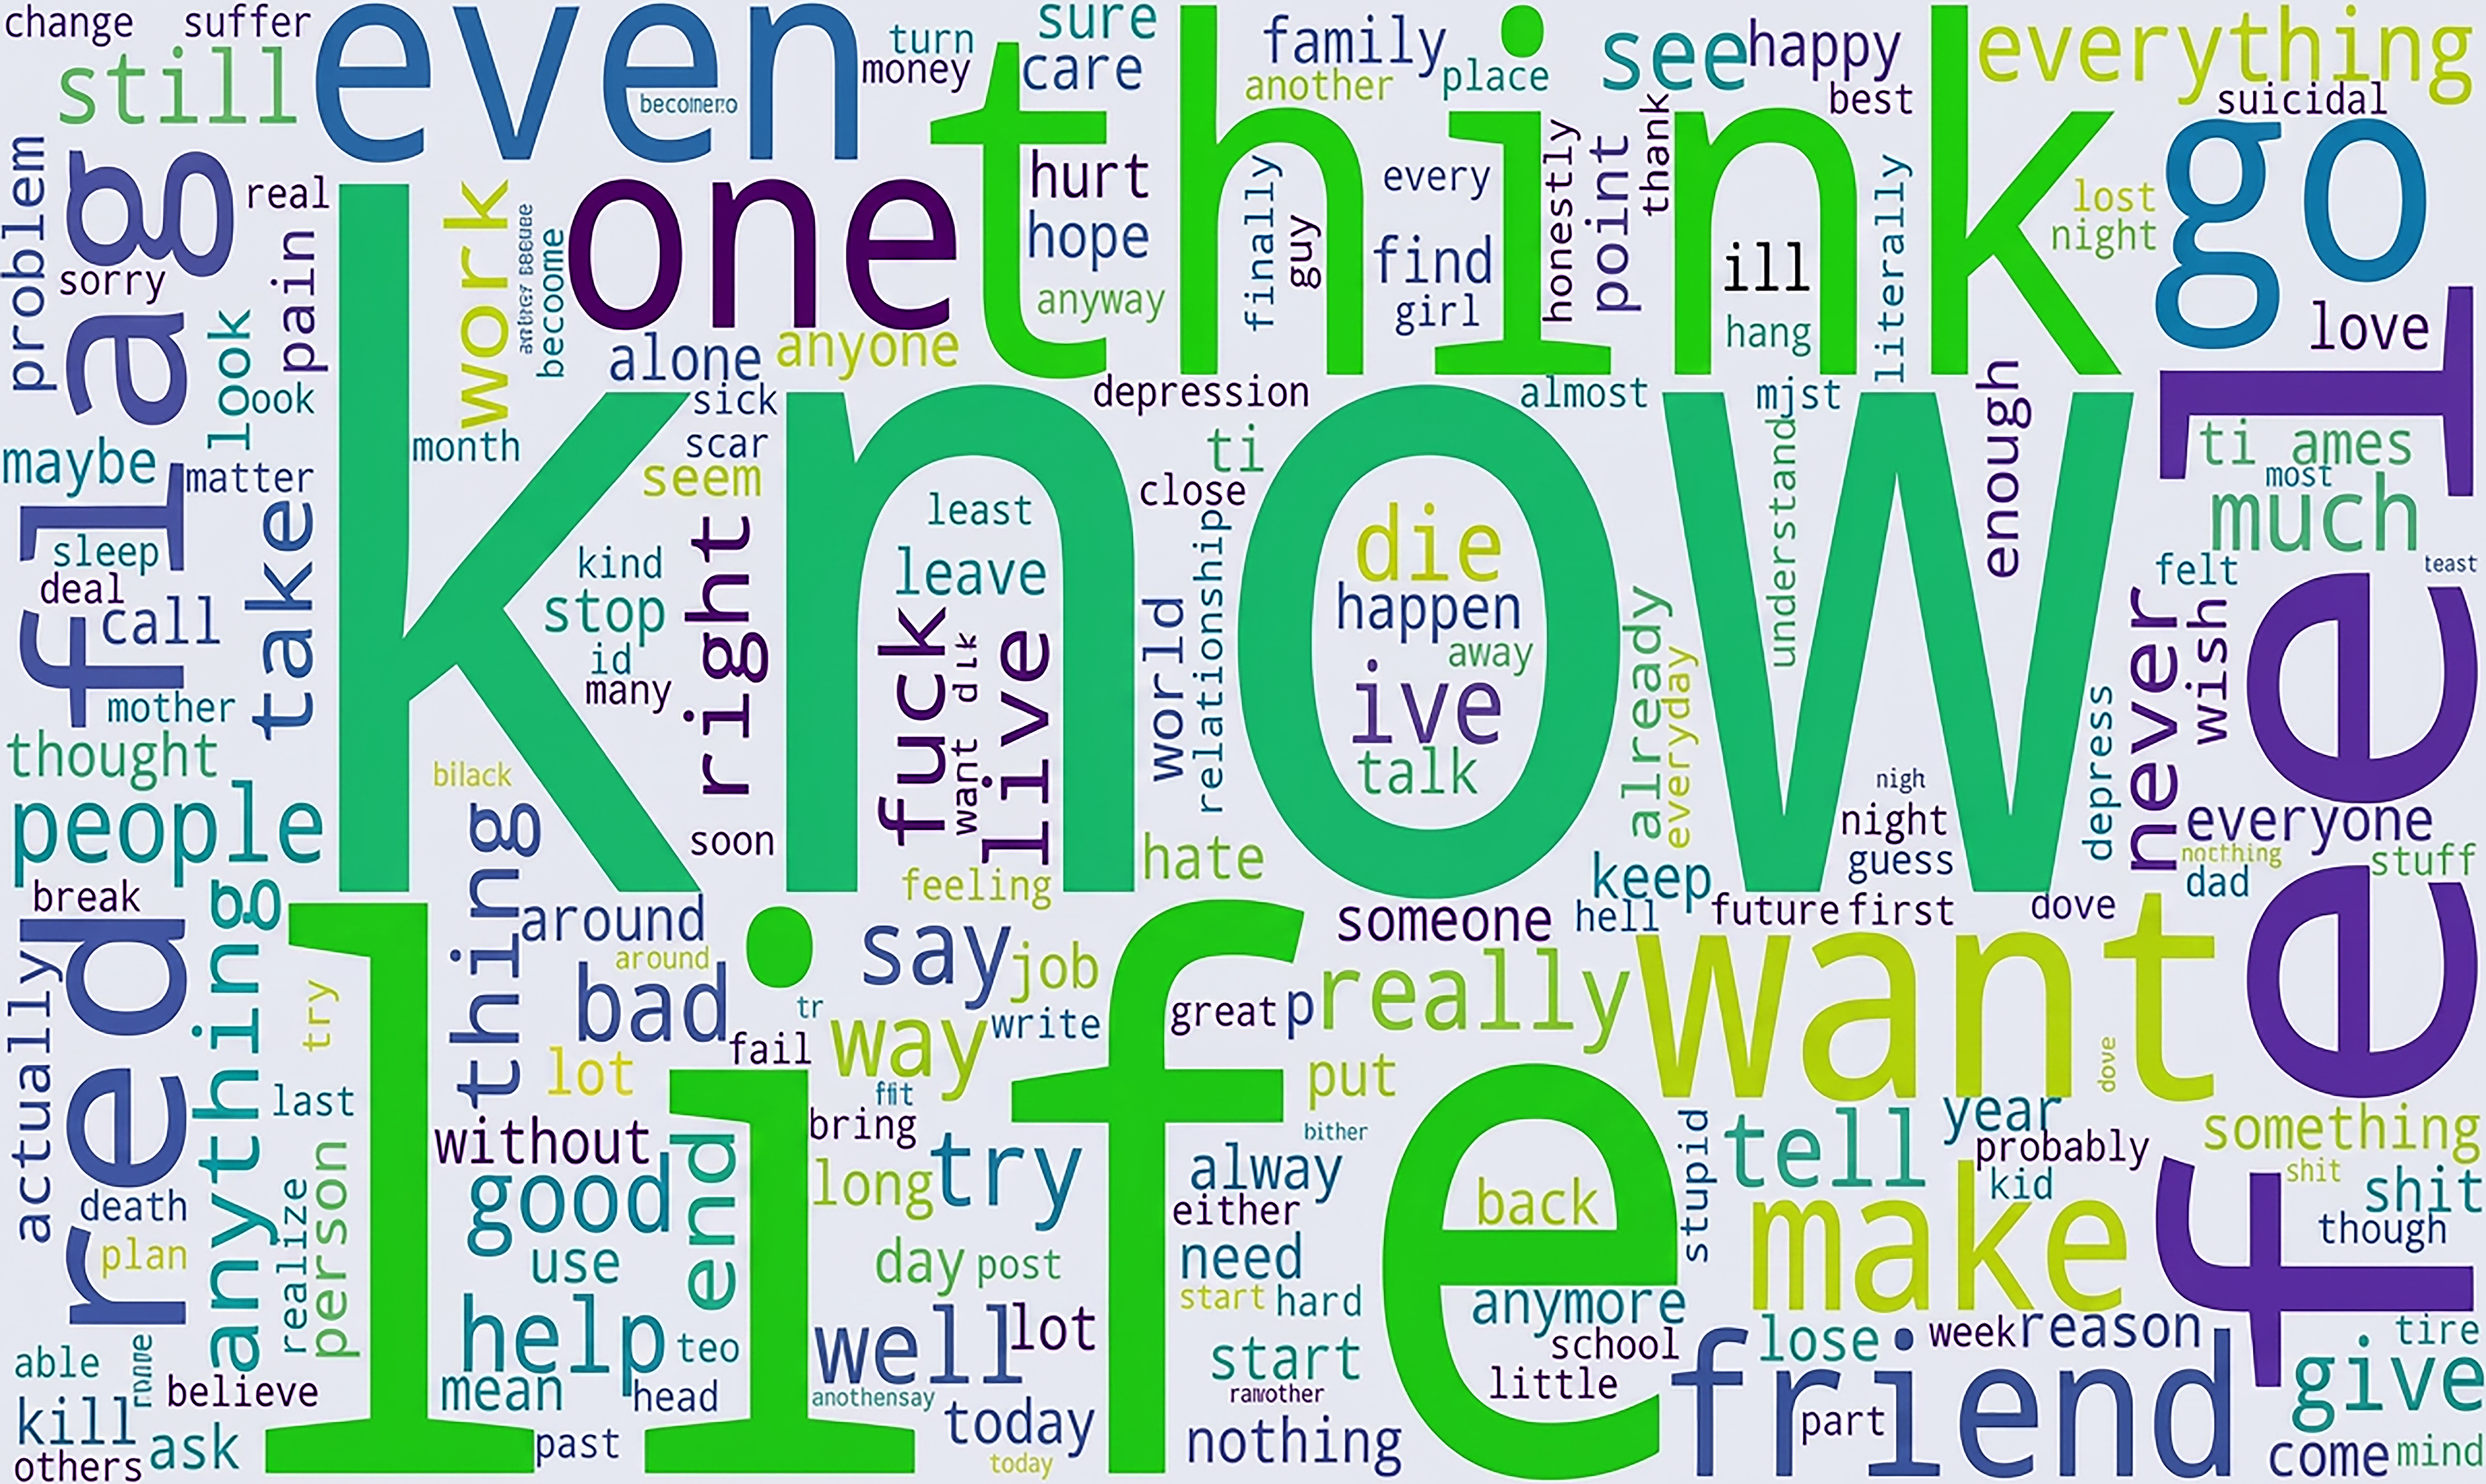
Word cloud for depression text.
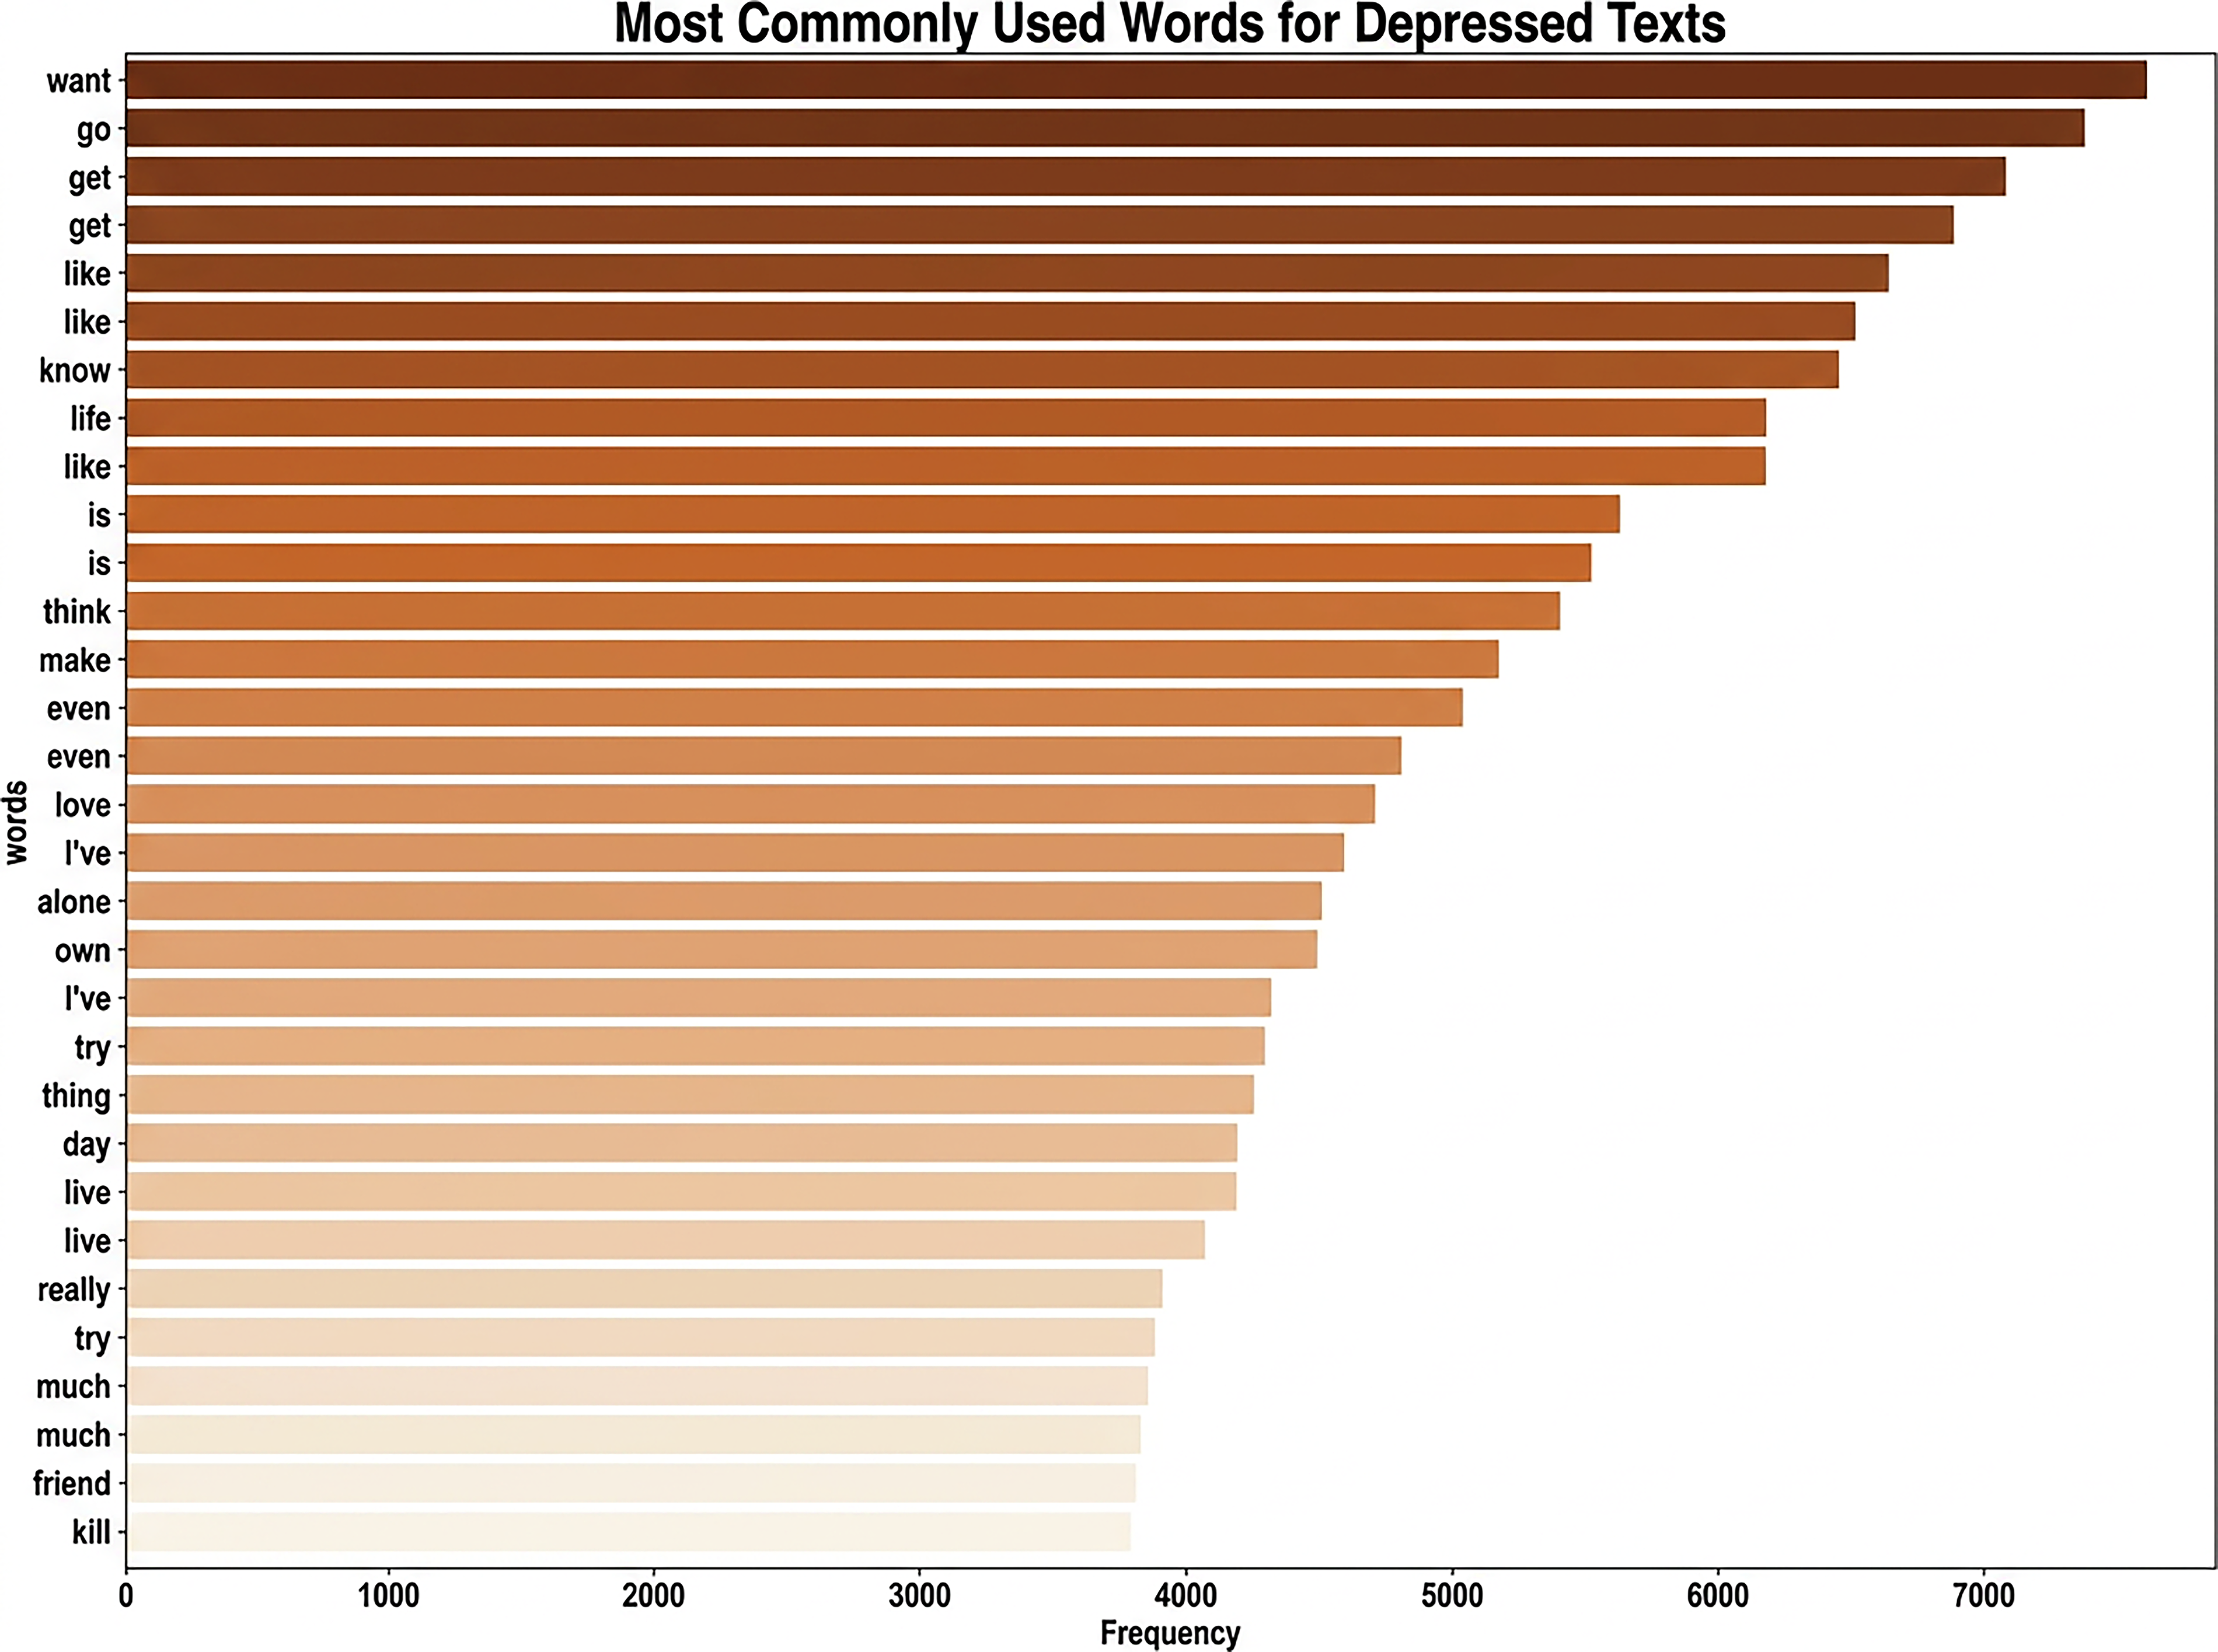
Frequently used words in depressive text.
The repetition of terms related to daily functioning and personal struggles, “work,” “job,” “school,” “pain,” “live,” and “f**k” underscores the impact of depression on both emotional regulation and real-world responsibilities. While a few neutral or positive terms such as “love,” “friend,” and “help” appear, but are contextually embedded in negative sentiment. Overall, the cloud reflects a pervasive sense of despair, hopelessness, and mental fatigue characteristic of depressive discourse.
In contrast, the word cloud for non-depressive and most frequently used words in non-depressive text, shown in Figures 5 and 6, respectively, displays a broader and more balanced emotional range. Prominent words include “make,” “one,” “know,” “think,” “feel,” “want,” “life,” “friend,” “love,” and “movie.” These terms indicate social interaction, everyday experiences, emotional expression, and leisure activities. The frequency of verbs such as “see,” “take,” “tell,” and “give” reflects an action-oriented and engaged perspective, while nouns like “people,” “game,” “film,” and “day” suggest interest in entertainment and personal relationships. The absence of overtly negative or distressing terms and the presence of neutral or positive emotional language such as “happy,” “good,” and “great” further differentiates this text from a depressive text. Thus, this cloud represents a more optimistic mental state, characterized by emotional openness, interpersonal connection, and engagement in day-to-day activities. Overall, the non-depression cloud emphasizes the importance of social connections, positive emotions, and the pursuit of enjoyable activities.
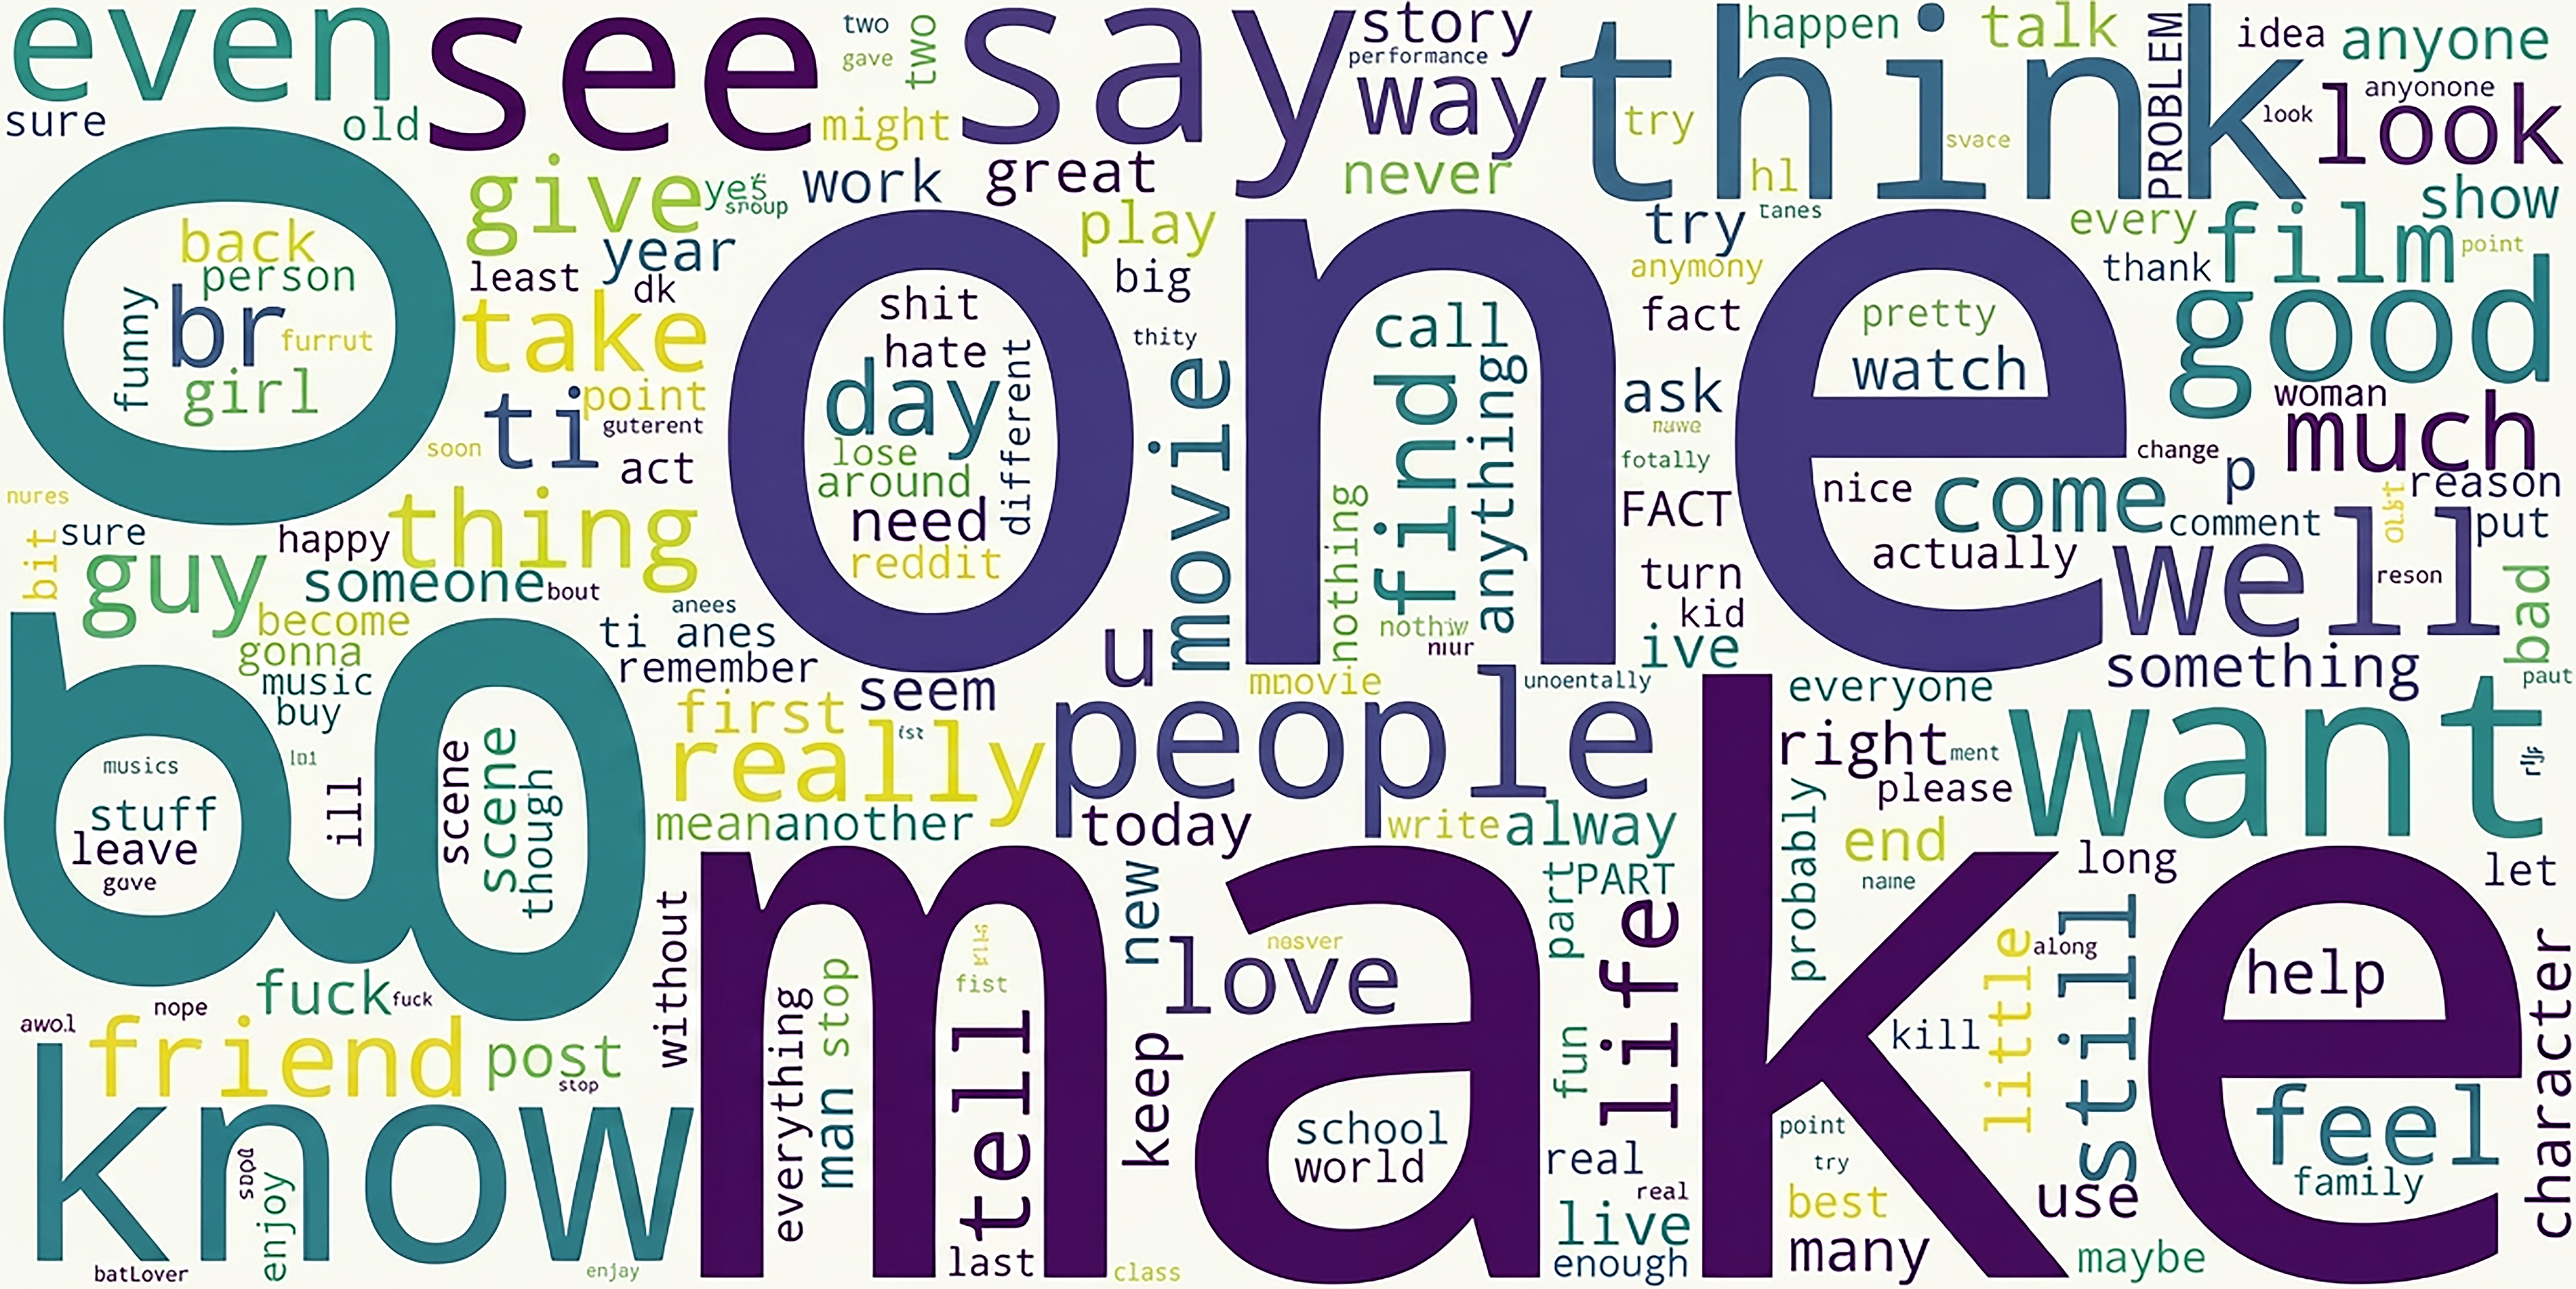
Word cloud for non-depression text.

Frequently used words in non-depressive text.
Depression Detection Using Traditional Machine Learning Algorithms
In order to quantitatively assess the effectiveness of various algorithms in detecting depressive content, we implemented and compared five traditional machine learning classifiers: LR, NB, DT, RF, and SVM. Each model was trained on TF-IDF feature representations of the preprocessed text data, and their performance was evaluated using standard metrics such as accuracy, precision, and recall, listed in the subsection “Evaluation metrics.” The results offer insights into the relative strengths of these classifiers for the detection of depression in textual data.
Logistic Regression: The confusion matrix and ROC curve for the LR model in the depression detection task, as shown in Figure 7, demonstrate its strong classification performance. The confusion matrix highlights the model’s ability to correctly classify depressive (class 1) and non-depressive (class 0) cases. Specifically, the model correctly identified 2515 depressive cases (true positives) and 2618 non-depressive cases. It misclassifies 210 non-depressive cases as depressive (false positives) and fails to detect 253 depressive cases (false negatives). These results translate to an overall accuracy of 91.7%, indicating that the majority of predictions are correct. The model achieves a precision of 92.3%, meaning that among all cases predicted as depressive, 92.3% are actually depressive. It achieved a recall of 90.9%, demonstrating its ability to identify 90.9% of all true depressive cases. Furthermore, the specificity of 92.6% reflects the model’s capability to correctly identify non-depressive cases. The ROC curve gives further insight into how well our model performs by showing the relationship between the true positive rate and the false positive rate at different thresholds. In this case, the curve rises sharply toward the top-left corner, meaning the model achieves strong sensitivity and specificity across most settings. The area under the curve (AUC) is 0.97 for both classes, which is an excellent result and shows that the model can clearly distinguish between depressive and non-depressive cases. This high AUC score also reflects a healthy balance between precision and recall. It suggests that the model performs reliably across various conditions. Taken together, the results from the confusion matrix and the ROC curve show that the LR model is both accurate and dependable for detecting depression in text. The NB model’s performance in depression detection is indicated by the confusion matrix and ROC curve in Figure 8. It showcases its strengths and limitations. The confusion matrix reveals that the model correctly identified 2620 depressive cases (true positives) and 2355 non-depressive cases (true negatives). However, it misclassified 473 non-depressive cases as depressive (false positives) and failed to detect 148 depressive cases (false negatives). This results in an overall accuracy of 88.9%, highlighting that the majority of classifications are correct. The model achieves a high recall of 94.7%, signifying its strong ability to identify most depressive cases. This is very important in situations where missing depressive cases is costly. However, its precision of 84.7% indicates that some non-depressive cases are incorrectly classified as depressive, leading to a moderate rate of false positives. The ROC curve further underscores the model’s performance with an AUC of 0.96 for both depressive and non-depressive classes. This high AUC demonstrates the model’s excellent ability to distinguish between the two classes across various decision thresholds. The curve’s steep rise toward the top-left corner indicates a strong trade-off between sensitivity and specificity, with the model performing reliably in distinguishing depressive cases from non-depressive ones. Overall, the NB model is particularly effective in scenarios prioritizing recall, such as early screenings for depression, where identifying depressive cases is critical. However, its lower precision suggests the need for careful consideration in applications where false positives carry significant consequences. The DT model’s performance in depression detection, as reflected in the confusion matrix and ROC curve in Figure 9, demonstrates moderate classification effectiveness. The confusion matrix shows that the model correctly identified 2280 depressive cases (true positives) and 2363 non-depressive cases (true negatives). However, it misclassified 465 non-depressive cases as depressive (false positives) and failed to detect 488 depressive cases (false negatives). This results in an accuracy of 83%, indicating that the model correctly classifies a significant portion of cases but lags behind other models like LR or SVM. The model achieved a precision of 83.1%, meaning that 83.1% of cases predicted as depressive were truly depressive, and a recall of 82.4%, demonstrating its ability to identify 82.4% of all actual depressive cases. Additionally, the specificity of 83.6, the ROC curve provides further insight into the model’s discriminatory power, with an AUC of 0.83 for both depressive and non-depressive classes. While this indicates a moderate ability to distinguish between the two classes, the ROC curve does not rise sharply toward the top-left corner. This reflects less sensitivity and specificity compared to higher-performing models. The moderate AUC suggests that while the DT model is acceptable for depression detection, it may not be optimal for tasks requiring highly precise or sensitive classifications. Overall, the DT model balances interpretability with moderate performance, making it suitable for scenarios where understanding the decision process is as important as prediction accuracy. The RF model demonstrates, as shown in Figure 10, robust and reliable performance in depression detection, as evidenced by its confusion matrix and ROC curve. The confusion matrix indicates that the model accurately classified 2506 depressive cases (true positives) and 2494 non-depressive cases (true negatives), with only 334 non-depressive cases misclassified as depressive (false positives) and 262 depressive cases missed (false negatives). These results reflect the model’s high accuracy, as well as a strong balance between precision and recall. The low false positive and false negative rates highlight the model’s consistent performance across both depressive and non-depressive cases. The ROC curve further underscores the RF model’s effectiveness, with an Area Under the Curve (AUC) of 0.96 for both classes. The curve’s steep rise towards the top-left corner demonstrates excellent sensitivity and specificity, confirming the model’s strong discriminatory power in distinguishing depressive cases from non-depressive ones. This level of performance makes the RF model particularly suitable for real-world applications in mental health diagnostics, where accurate and reliable predictions are crucial. The SVM model demonstrates excellent performance in depression detection, as reflected in the confusion matrix and ROC curve shown in Figure 11. According to the confusion matrix, the model correctly classified 2627 non-depressive cases (true negatives) and 2523 depressive cases (true positives). However, 201 non-depressive cases were misclassified as depressive (false positives), and 245 depressive cases were misclassified as non-depressive (false negatives). These results indicate that the SVM model has a strong ability to accurately distinguish between depressive and non-depressive cases, achieving high precision and recall scores. The relatively low number of misclassifications further highlights the model’s reliability. The ROC curve illustrates the model’s discriminatory power, showing an area under the curve (AUC) of 0.97 for both depressive and non-depressive classes. The steep rise of the curve towards the top-left corner indicates high sensitivity and specificity, meaning the model can effectively minimize both false positive and false negative rates. The near-perfect AUC value demonstrates the SVM model’s robustness in separating the two classes with minimal overlap, making it one of the best-performing models for depression detection. Overall, the SVM model combines strong precision, recall, and a high AUC, confirming its effectiveness for tasks requiring accurate and reliable classification, such as identifying depression. Its performance ensures that both depressive and non-depressive cases are classified with minimal errors, making it an excellent choice for clinical or real-world applications in mental health diagnostics.
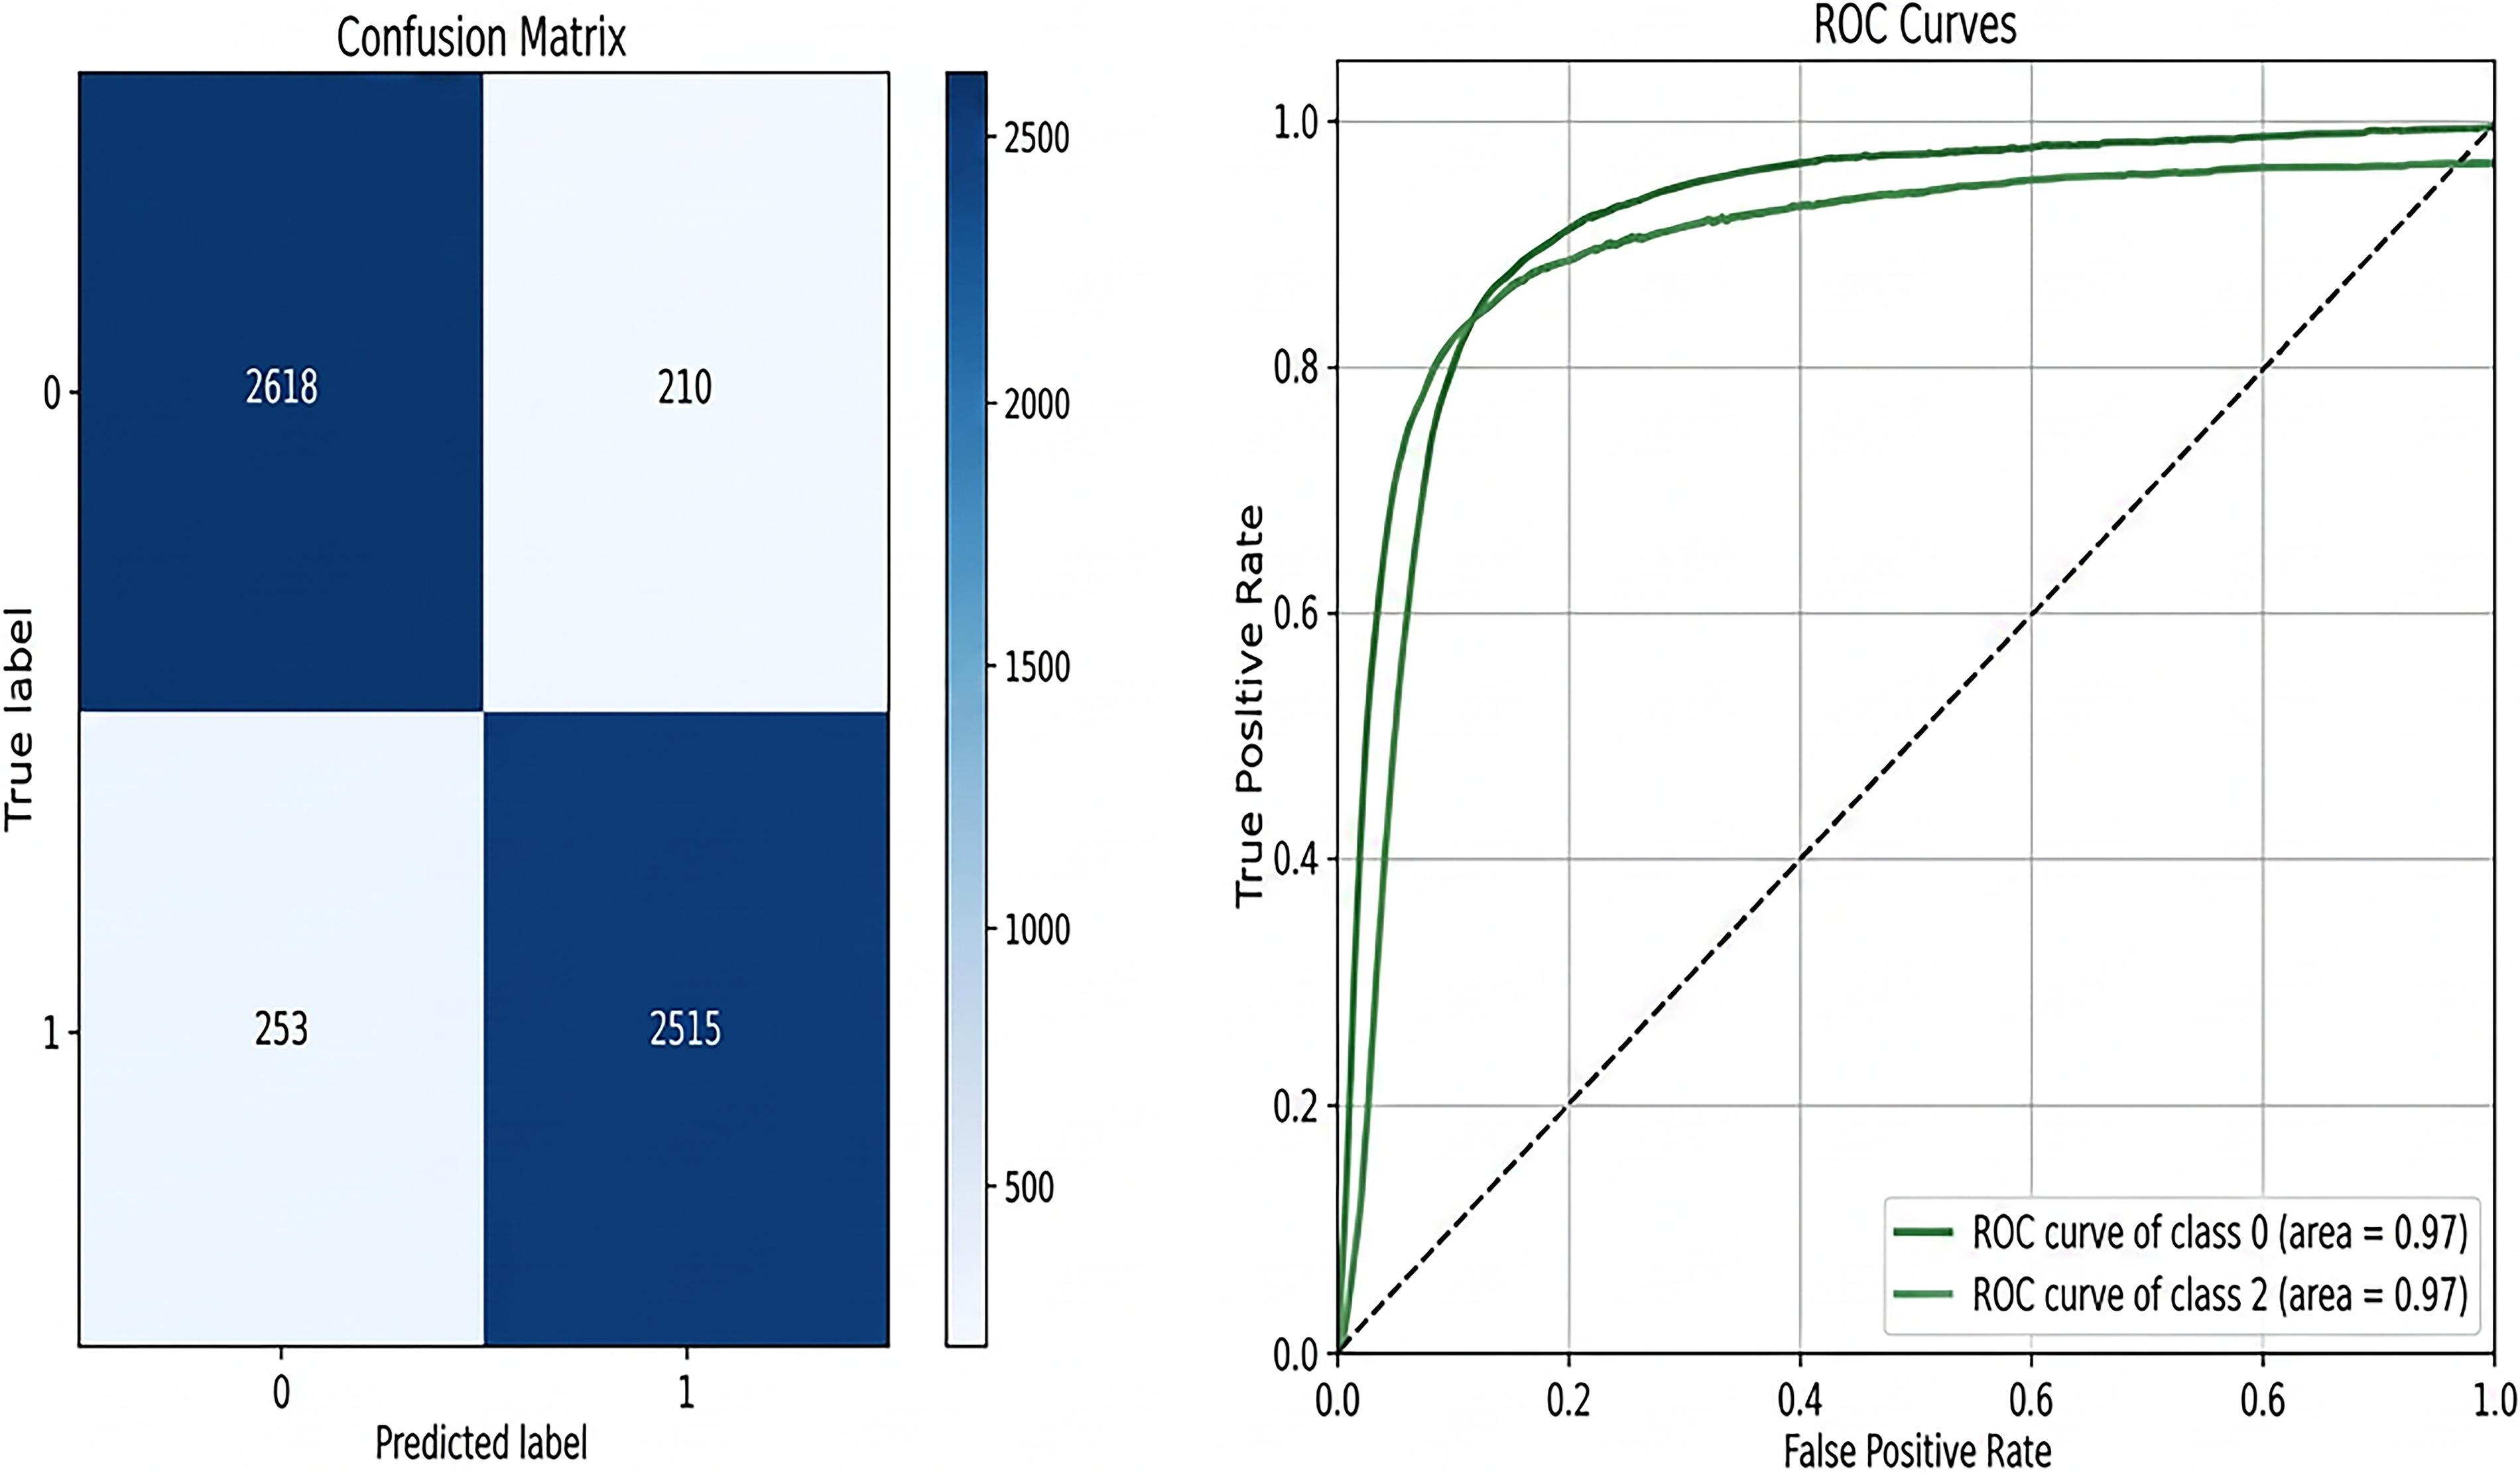
Confusion matrix and ROC curve for logistic regression model. ROC, receiver operating characteristic.
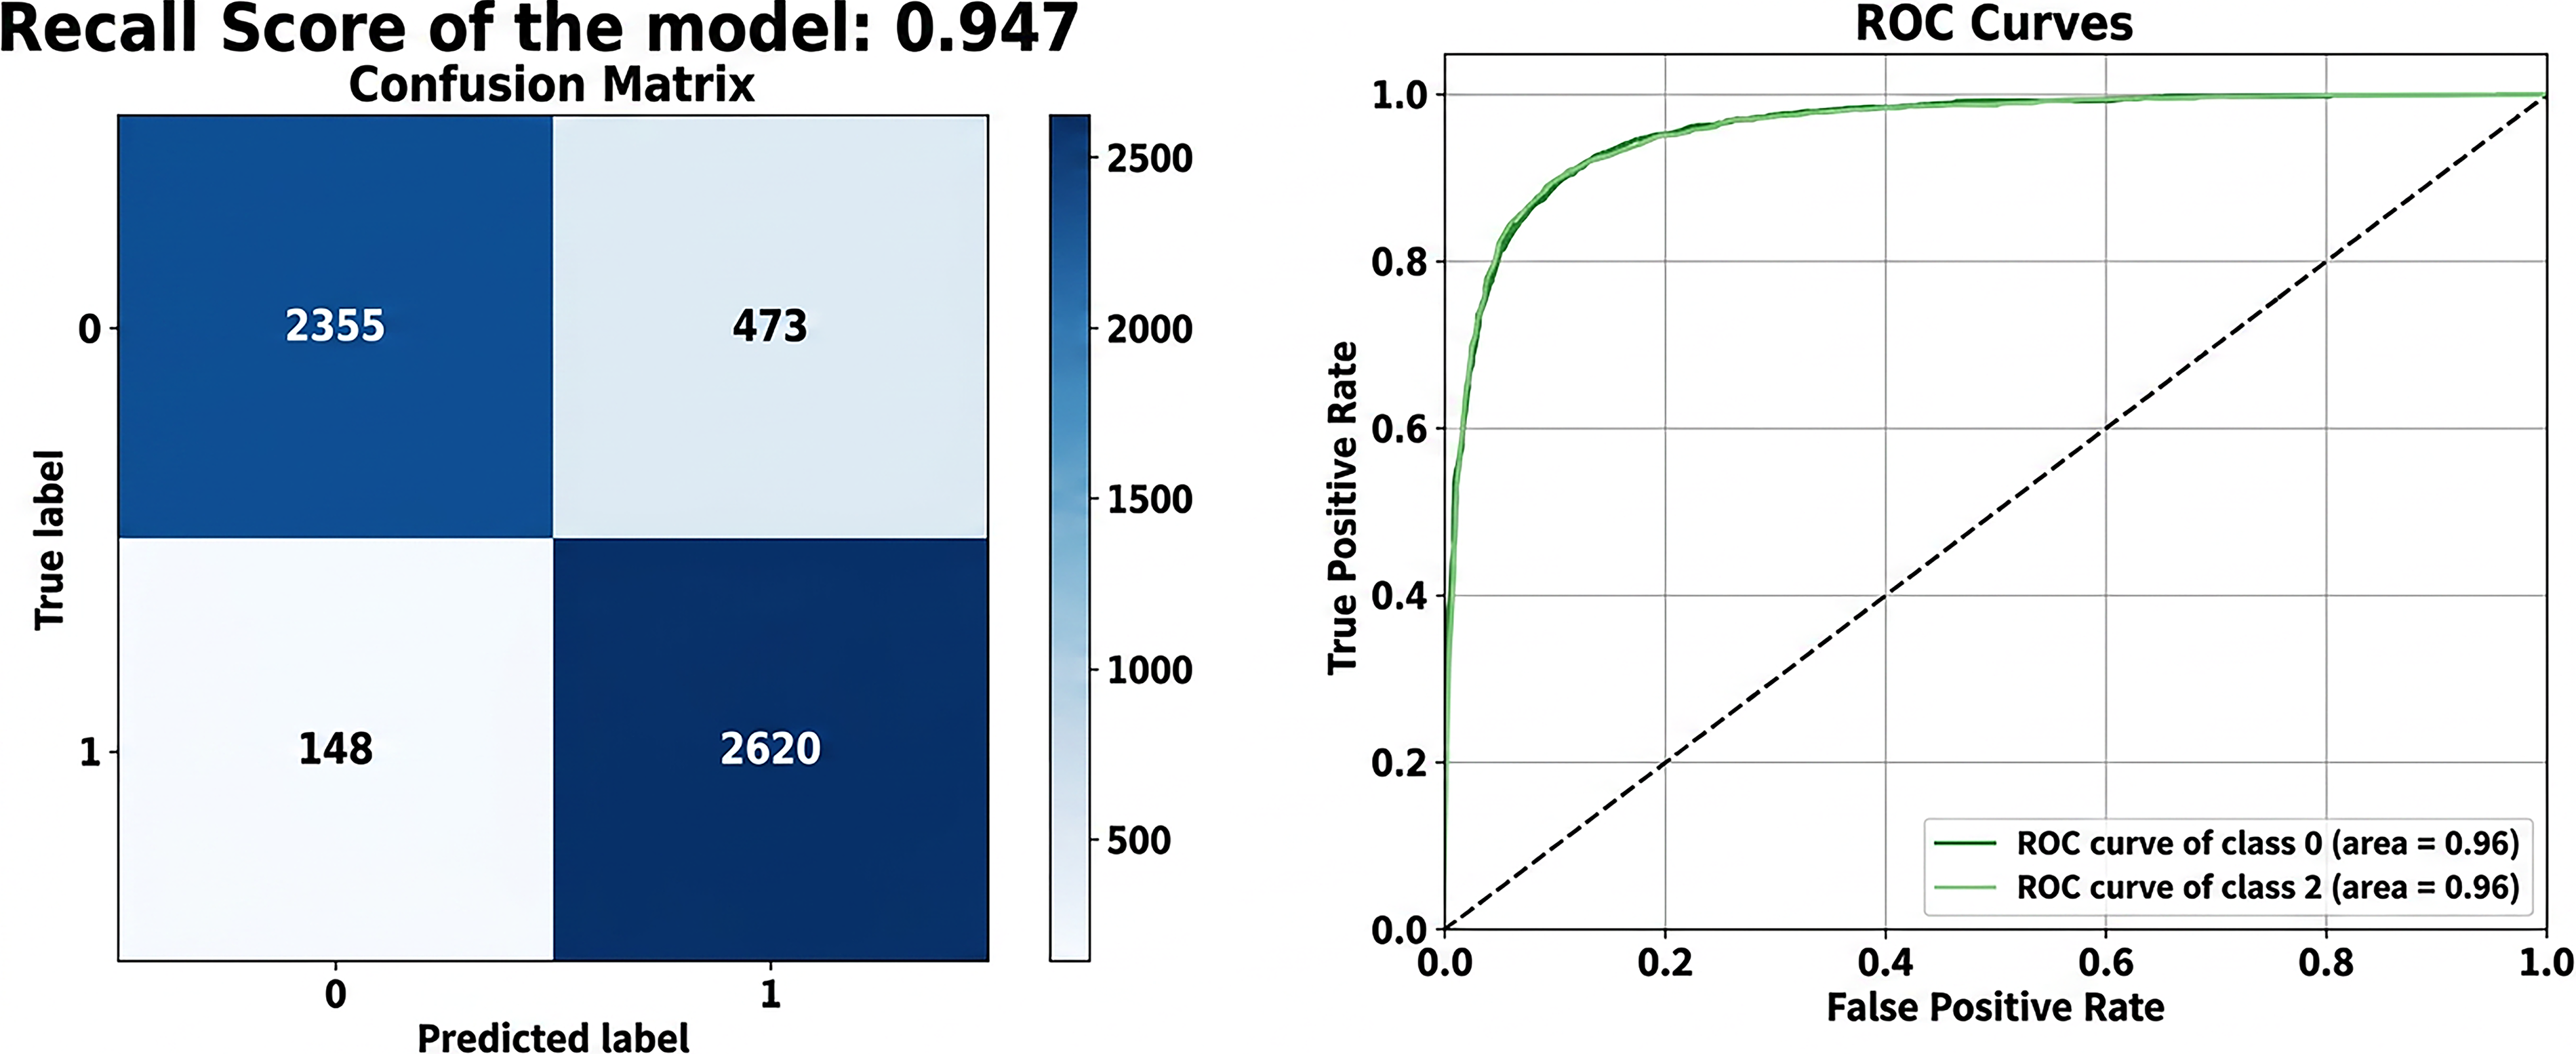
Confusion matrix and ROC curve fornaive Bayes model.
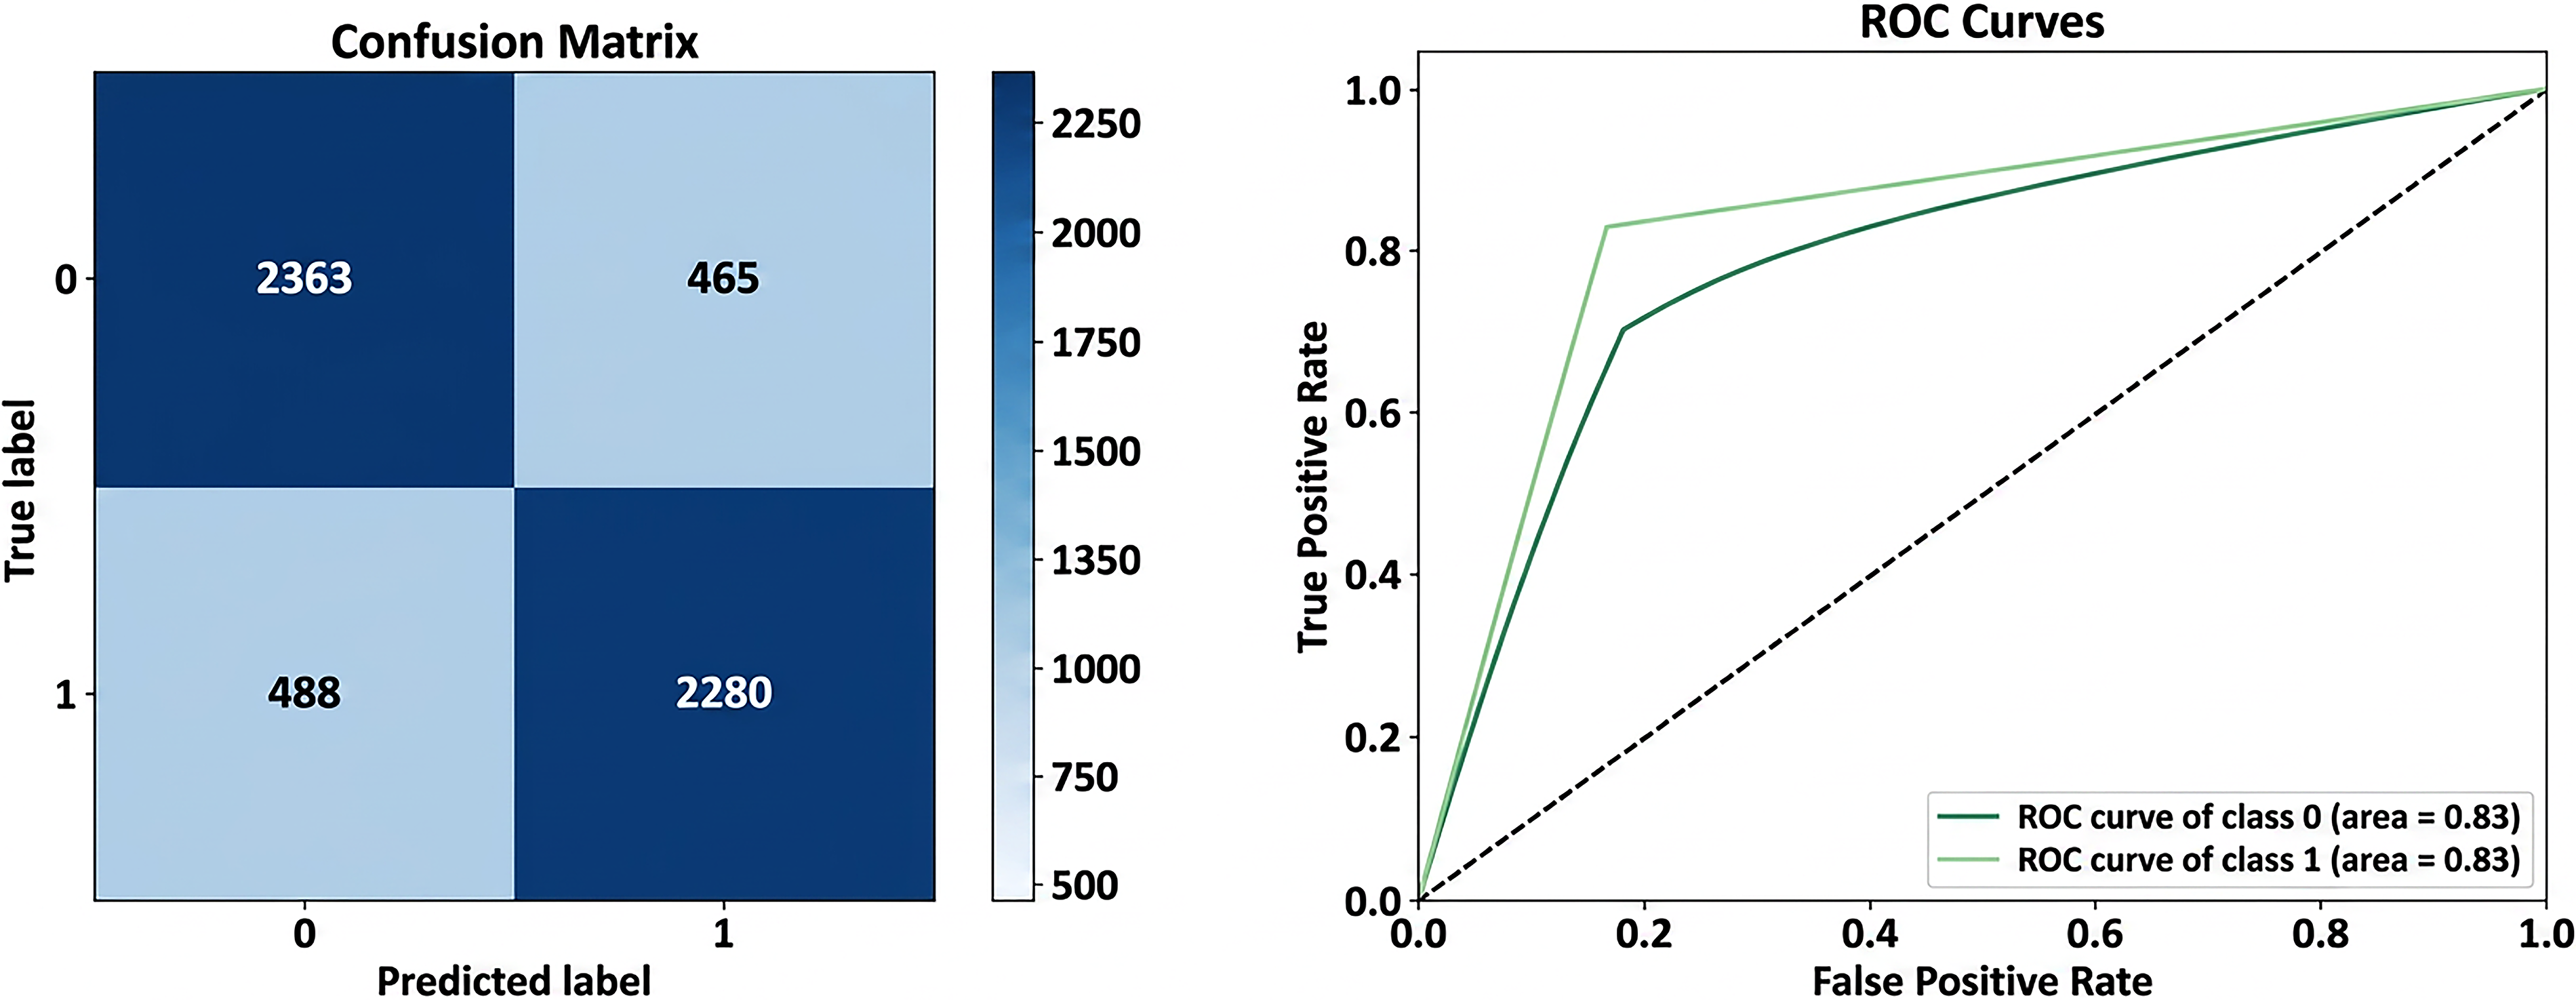
Confusion matrix and ROC curve for decision tree.
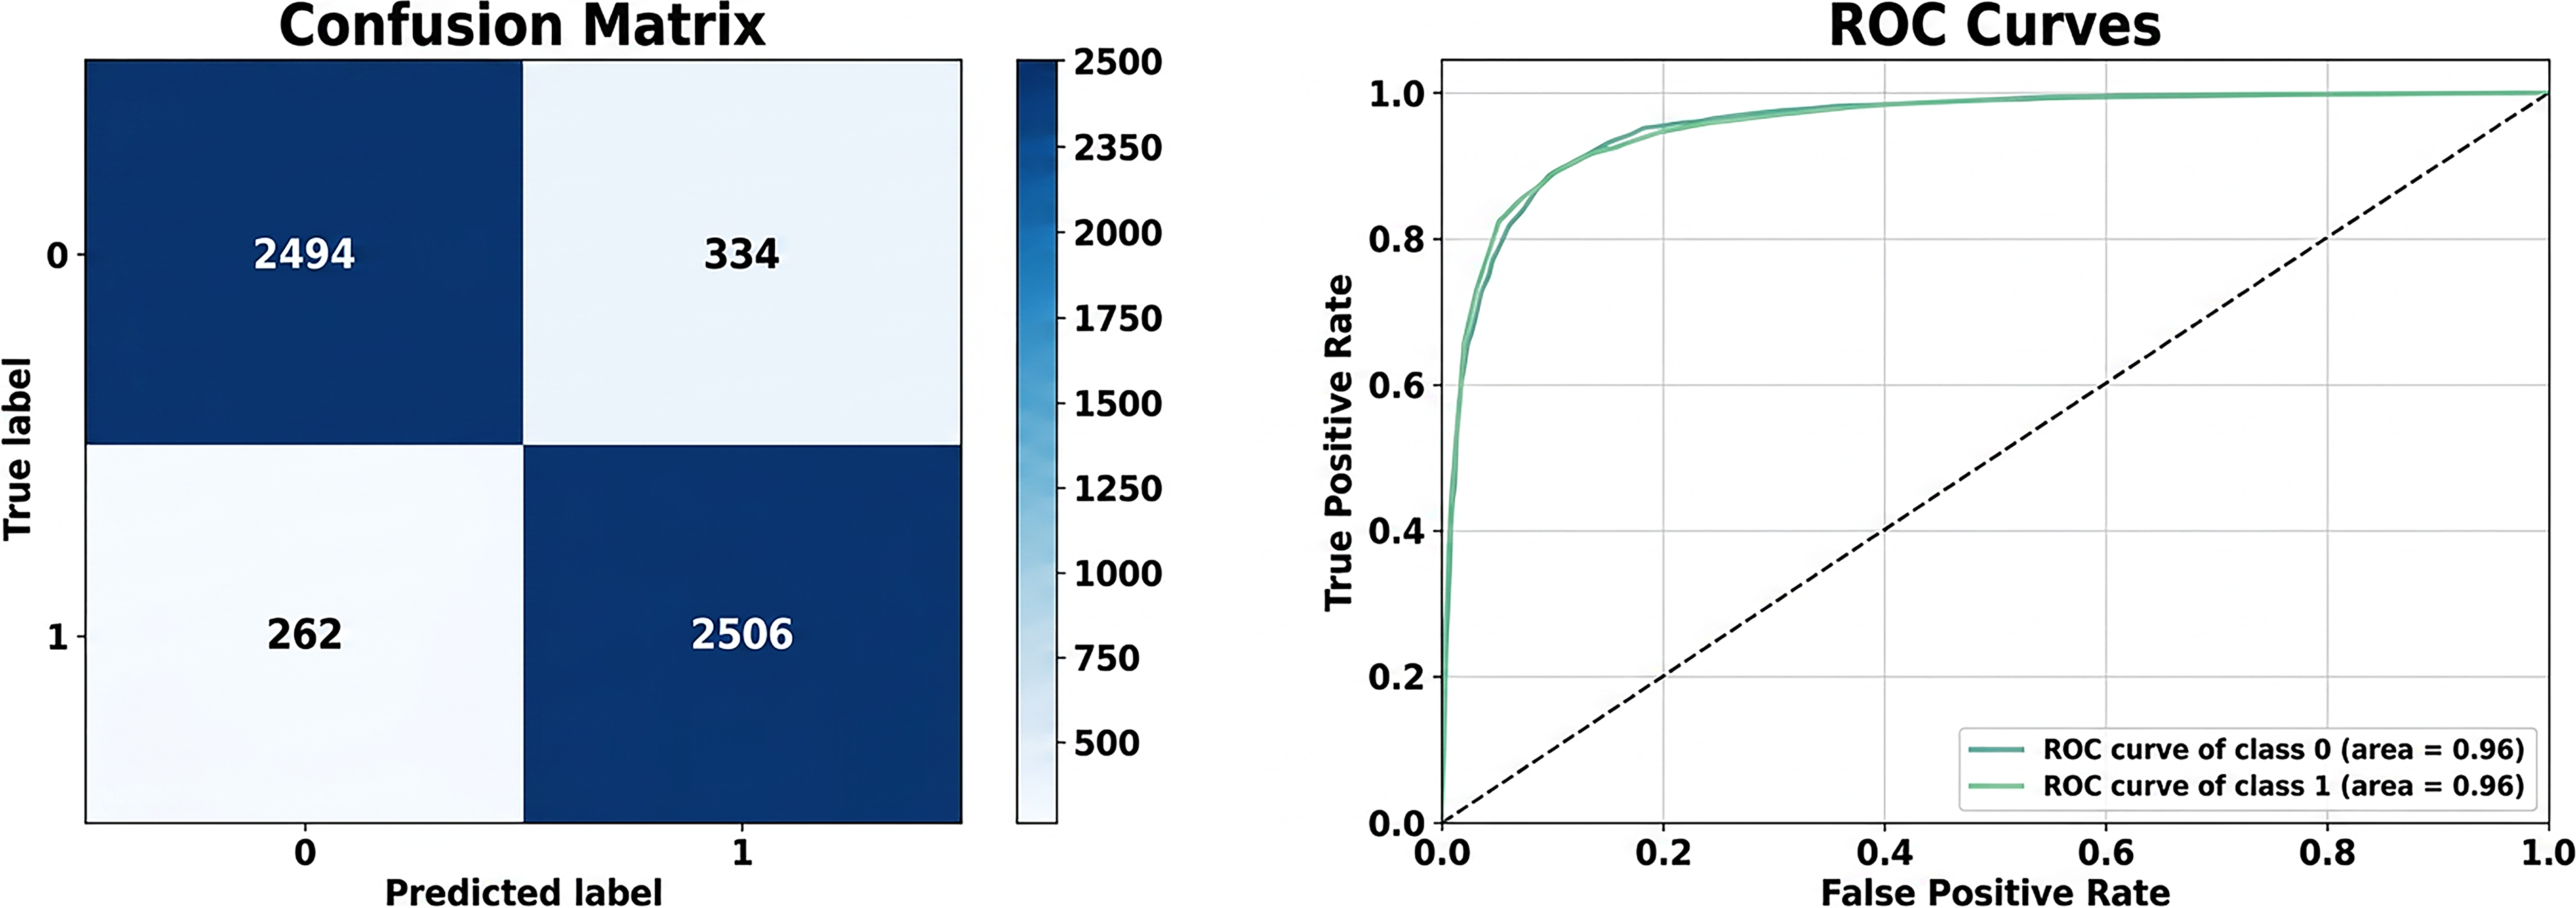
Confusion matrix and ROC curve for random forest model.
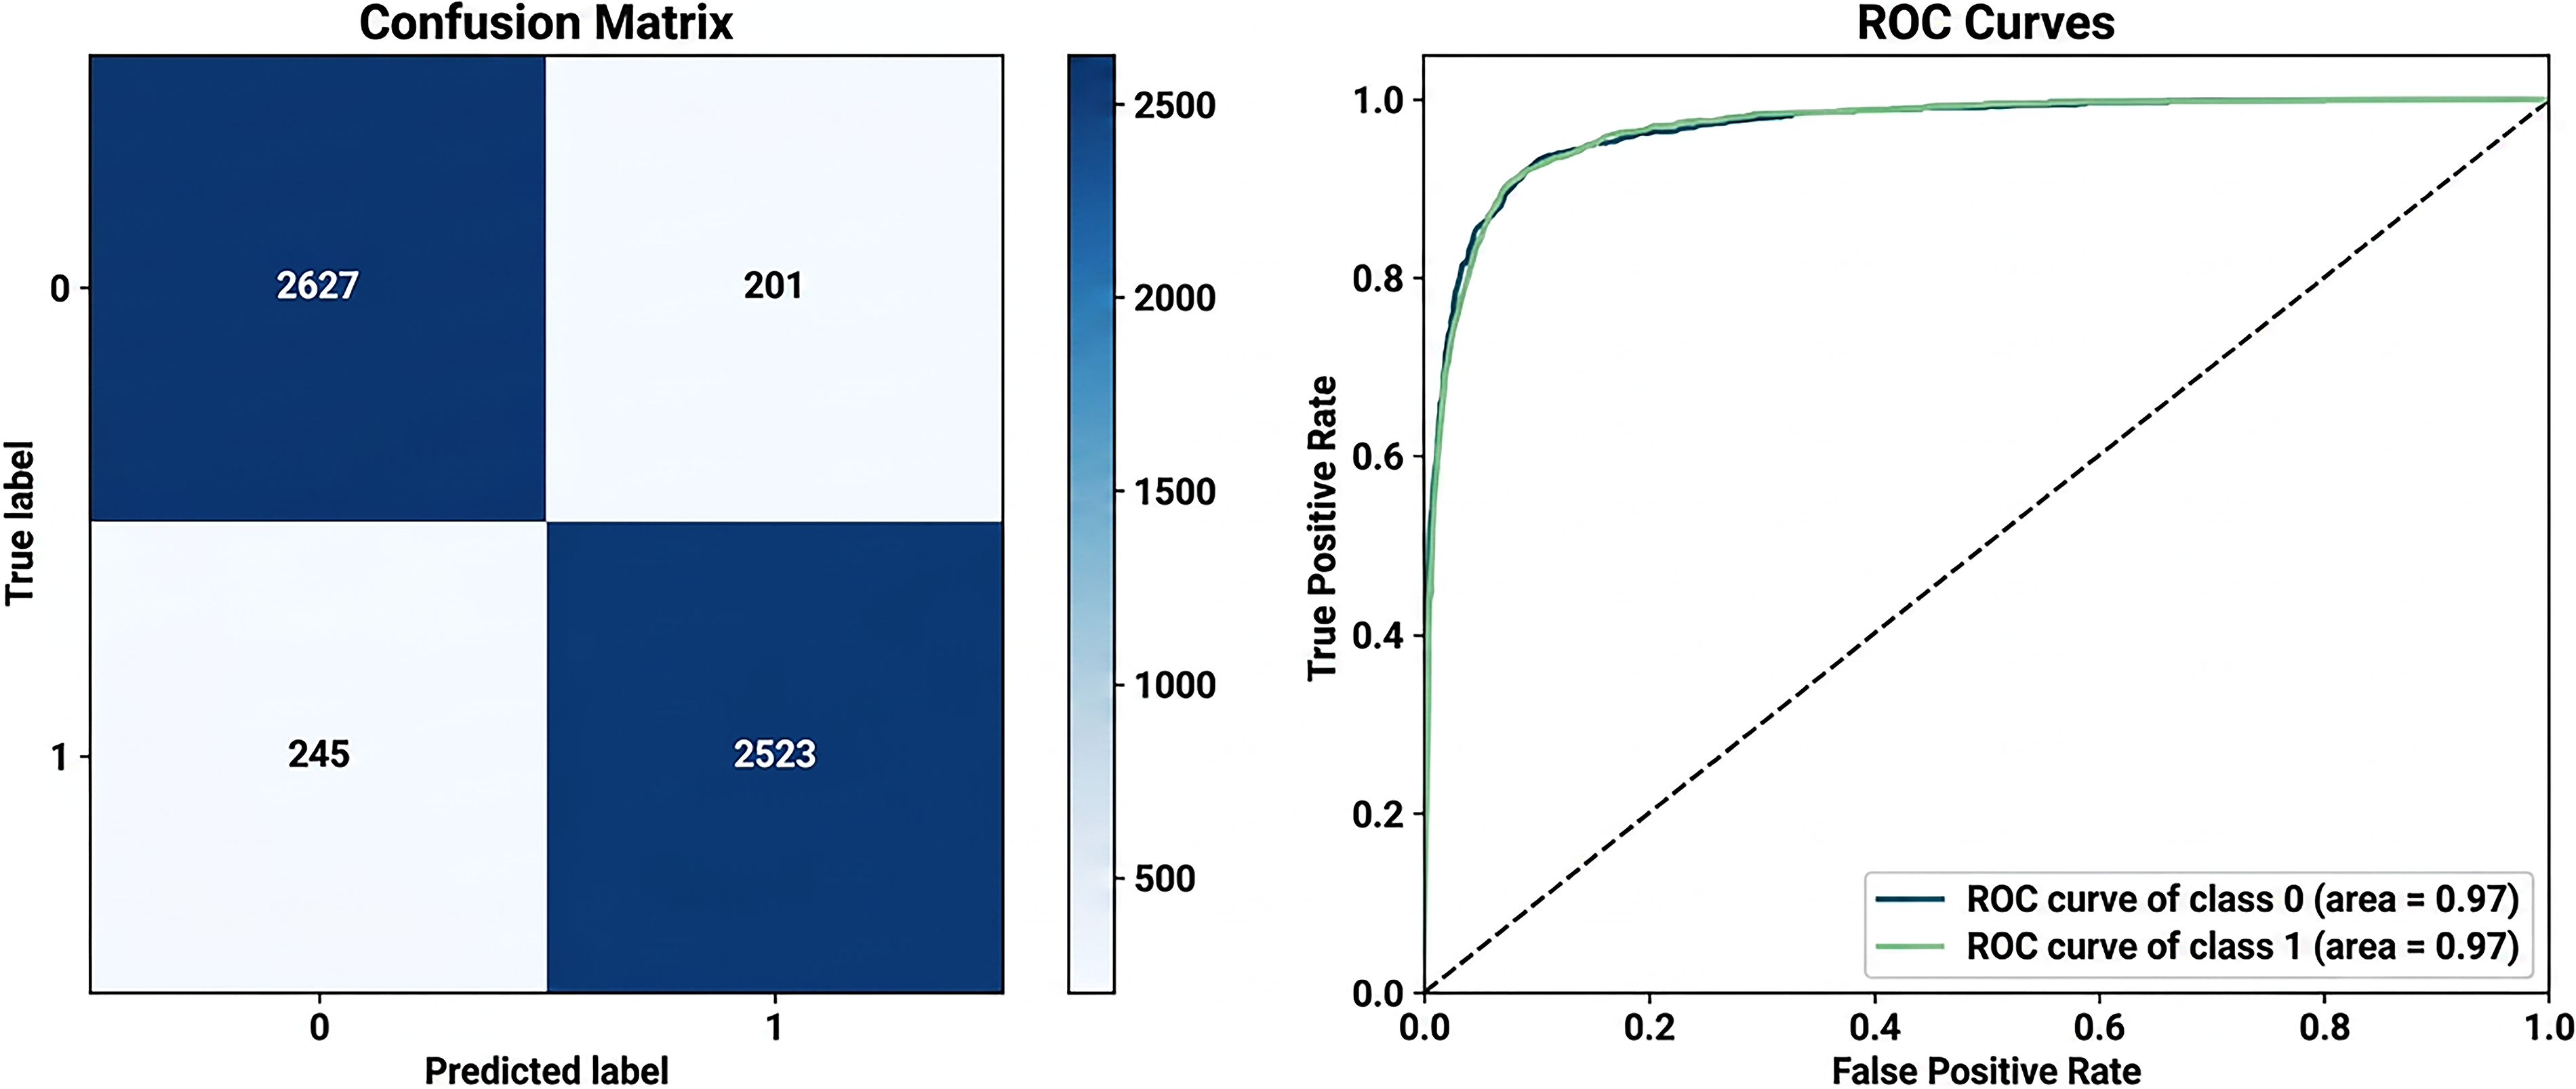
Confusion matrix and ROC curve for support vector machine.
Performance comparison of depression detection models
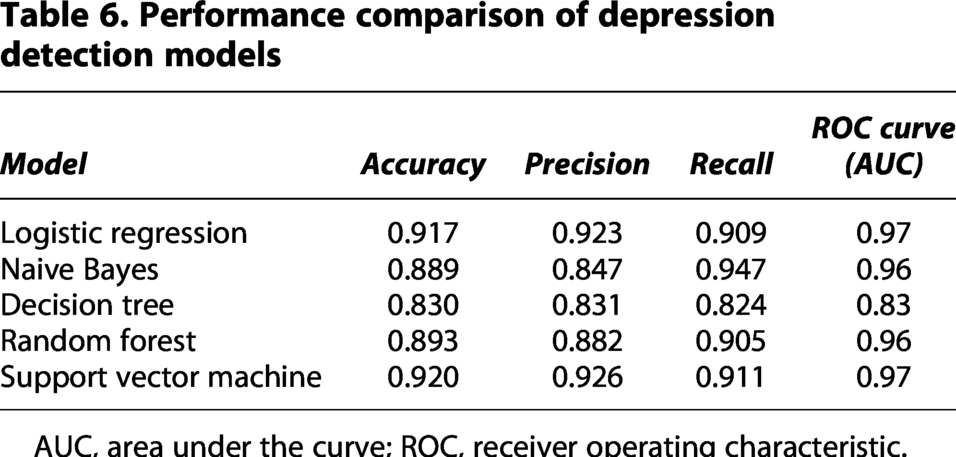
AUC, area under the curve; ROC, receiver operating characteristic.
The evaluation of various models, as shown in Table 6 for depression detection, reveals significant differences in performance across key metrics, including Accuracy, Precision, Recall, and ROC-AUC. These metrics are critical for assessing the model’s ability to handle the nuances of identifying depression symptoms, where both minimizing false positives and maximizing true positives are essential for practical applications. LR exhibits strong overall performance, achieving an Accuracy of 91.7%, indicating that the model correctly classifies the majority of instances. Its Precision of 92.3% highlights its effectiveness in minimizing false positives, ensuring that non-depressive cases are less likely to be misclassified as depressive. The Recall of 90.9% signifies its capability to identify most actual depressive cases, reducing false negatives. Furthermore, the model attains an impressive ROC-AUC score of 0.97, demonstrating its excellent trade-off between sensitivity and specificity. These results indicate that LR is highly reliable and well-suited for depression detection, especially in scenarios requiring balanced performance. SVM slightly outperforms LR in terms of Precision (92.6%) and achieves similar metrics for Accuracy (92%), Recall (91.1%), and ROC-AUC (0.97). These metrics suggest that SVM is highly robust and effective in differentiating between depressive and non-depressive cases. Its ability to handle high-dimensional data and effectively classify nonlinear relationships likely contributes to its strong performance. This makes SVM particularly useful in depression detection tasks where subtle patterns in features may play a critical role.
RF achieves an Accuracy of 89.3%, a Precision of 88.2%, and a Recall of 90.5%, along with an ROC-AUC of 0.96. While slightly behind LR and SVM, RF demonstrates strong performance in recall, making it particularly suitable for identifying depressive cases. Its ensemble-based approach leverages multiple DTs, providing robustness against overfitting and ensuring stable performance across various datasets. This model could be especially advantageous in depression detection scenarios with imbalanced datasets, where capturing all depressive instances is critical. NB achieves an Accuracy of 88.9%, relatively lower than other models, and its Precision is 84.7%, indicating a higher likelihood of false positives compared to LR and SVM. However, its Recall of 94.7% is the highest among all models, emphasizing its strength in identifying depressive cases. This model’s assumption of feature independence may limit its ability to capture complex relationships between features, but its high recall makes it valuable in applications prioritizing sensitivity over precision, such as initial screening for depression.
The DT model demonstrates the lowest performance, with an accuracy of 83%, a Precision of 83.1%, a Recall of 82.4%, and an ROC-AUC of 0.83. These results indicate that while it provides a basic level of depression detection, its simplicity and interpretability come at the cost of reduced predictive performance. The single-tree structure limits its ability to generalize well to unseen data, making it less suitable for tasks requiring high accuracy or recall. However, its visual representation of decision rules can offer insights into feature importance, which may inform more complex models. In the context of depression detection, where both high precision (to reduce false positives) and Recall (to reduce false negatives) are critical, LR and SVM emerge as the most reliable models. Both achieve excellent overall performance, making them well-suited for clinical and real-world applications. NB, with its high recall, can be a strong candidate for initial screenings, while RF offers a good balance between recall and precision, making it robust against class imbalances. The DT, though less effective, remains valuable for interpretability and feature analysis. These insights provide a comprehensive understanding of how each model performs in depression detection, aiding in selecting the most appropriate approach for different scenarios.
Emotion Analysis Model
The results of the emotion analysis model are summarized in Table 7, comparing the performance of XLNet, RoBERTa, DistilRoBERTa, DeBERTa, and BERT. Among these, BERT achieved the highest performance, with an accuracy of 94.5%, a precision of 0.9466, and the lowest loss value of 0.1018, highlighting its strong ability to capture contextual representations for emotion detection. RoBERTa followed closely with an accuracy of 94.4% and a slightly higher precision of 0.9458, though its loss was marginally higher compared to BERT. DistilRoBERTa, a compressed and efficient version of RoBERTa, achieved an accuracy of 94.2%, almost near state-of-the-art results. XLNet delivered an accuracy of 93.4%, with balanced precision and recall, showing stable yet slightly lower performance compared to BERT and RoBERTa. DeBERTa obtained 93.3% accuracy but recorded a higher loss (0.1951), indicating that while its disentangled attention mechanism is effective, it did not generalize as well on this dataset. Overall, BERT outperformed all other models, followed by RoBERTa. DistilRoBERTa provided an excellent trade-off between accuracy and computational efficiency.
Performance comparison of transformer-based models for emotion analysis
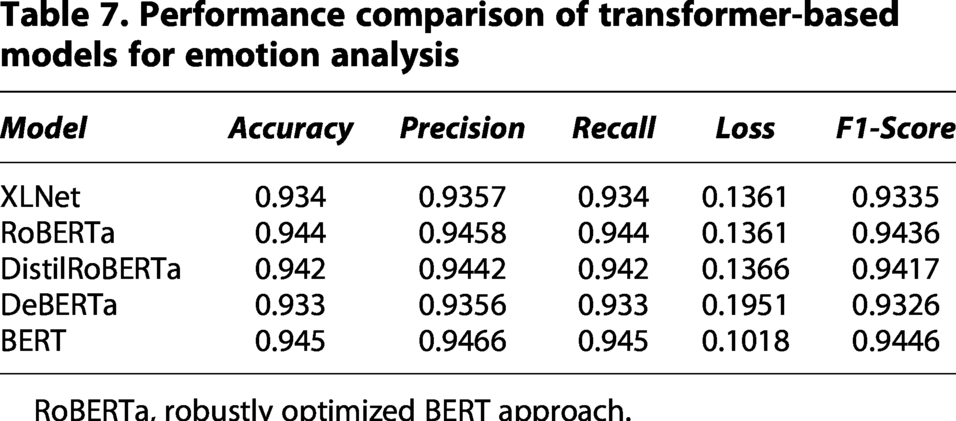
RoBERTa, robustly optimized BERT approach.
It is to be noted that in the study, all transformer-based models, including BERT, RoBERTa, DistilRoBERTa, XLNet, and DeBERTa, were fine-tuned using consistent default training parameters to ensure a fair comparison. Standard pretrained base variants were used with identical learning rates, batch sizes, number of epochs, optimizers, and maximum sequence lengths, as summarized in Table 8. No extensive model-specific hyperparameter optimization was performed, allowing performance differences to primarily reflect architectural characteristics rather than tuning advantages.
Default Fine-Tuning parameters for Transformer-Based models
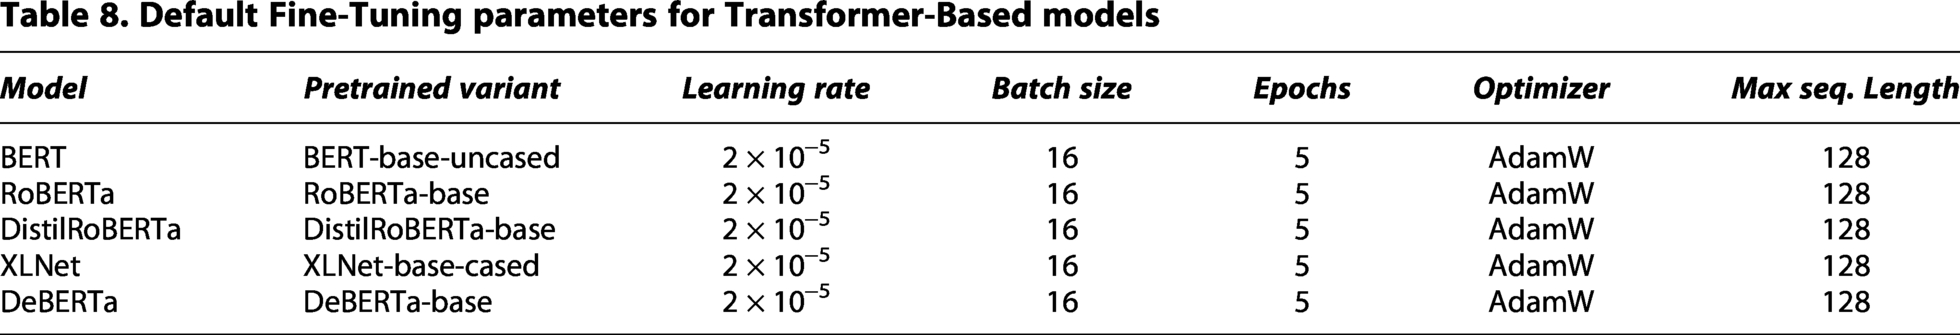
Table 9 shows the accuracy of each model across five epochs. SVM and LR consistently achieved high accuracy, while DT and NB showed greater variability. The table reports the performance across epochs, enabling robust evaluation and supporting statistical comparison between models.
Accuracy values across 5 epochs for each model
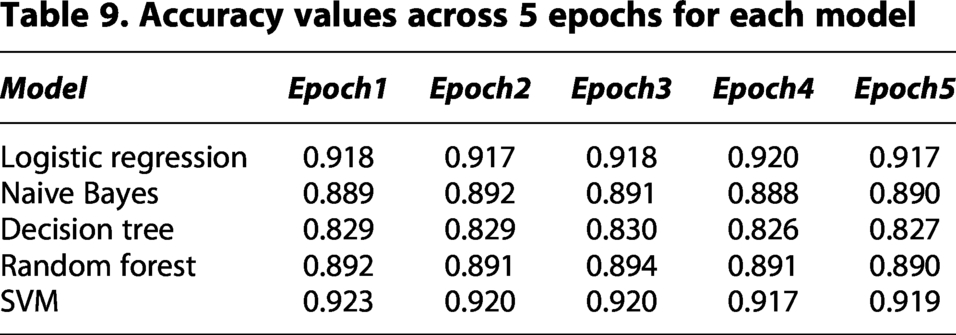
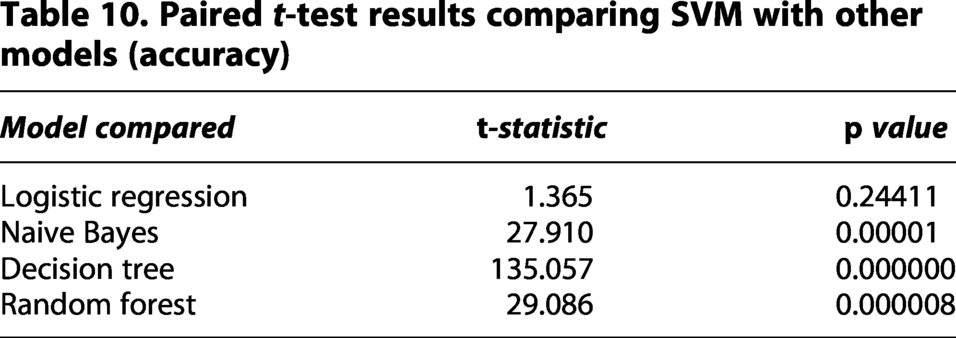
Furthermore, to assess whether the observed differences in classification performance are statistically significant, paired t-tests were conducted on accuracy values obtained over five epochs for each model. Since all models were evaluated on the same data splits, the paired t-test is appropriate for comparing their performance while accounting for run-to-run variability. Table 10 reports the t-statistics and corresponding p values for comparisons between the SVM and other classifiers. The results indicate that SVM achieves statistically significant improvements over NB, DT, and RF models (p < 0.05), while its performance is statistically comparable to LR. These findings confirm that the reported performance gains are not due to random variation and provide stronger empirical support for the effectiveness of the proposed modeling approach.
Paired t-test results comparing SVM with other models (accuracy)
To provide a more comprehensive evaluation of the proposed models, we analyzed the training and validation loss across all models up to 5 epochs, in addition to reporting accuracy. Table 11 presents the training and validation loss for each model over five epochs. The training loss scores show that all models exhibit stable convergence, with the training loss gradually decreasing and closely tracking the validation loss.
Training and validation loss across five epochs for each model
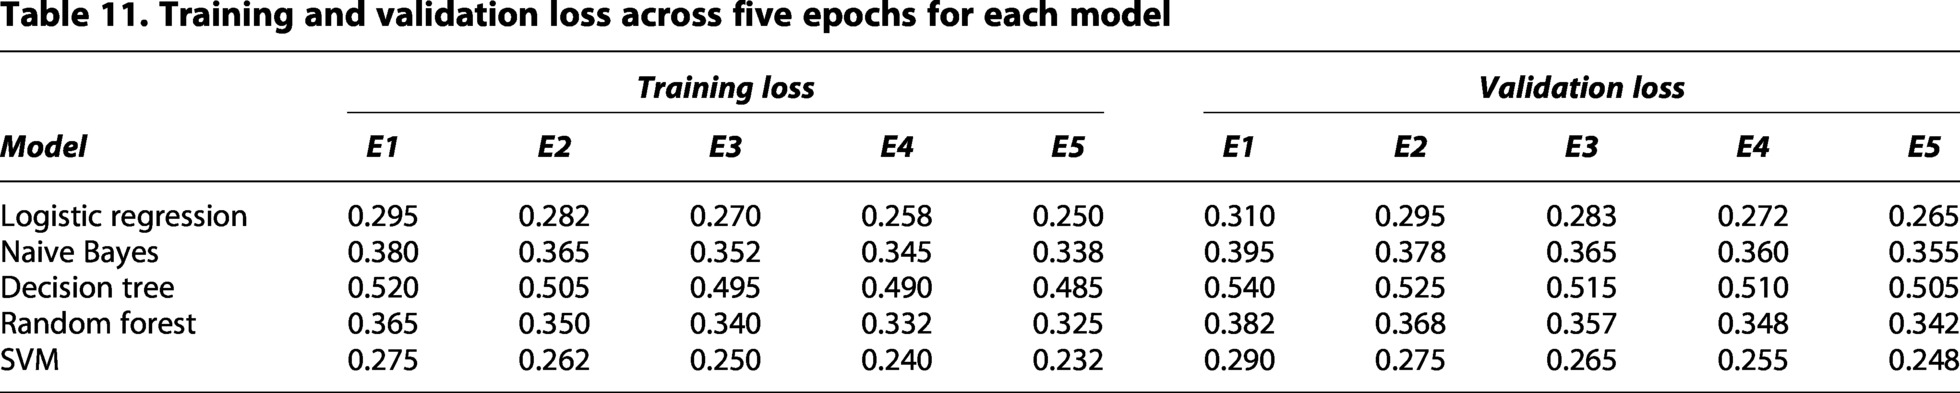
SVM and LR, which achieved the highest classification accuracies, also show the lowest loss values, while DT exhibits higher loss, consistent with its lower accuracy. The relatively small gap between training and validation loss indicates that the models generalize well to unseen data and that overfitting is minimal. This analysis of error behavior and loss dynamics complements the accuracy results, providing a clearer picture of model robustness and learning efficiency, and allows a more informed assessment of the reliability and generalization capability of the proposed framework.
Comparative analysis
To evaluate the effectiveness of different approaches, we conducted a comparative analysis of our models based on performance metrics. We compared the two approaches adopted, that is, Traditional Machine learning approaches and transformer-based approaches.
Traditional Machine Learning Approaches
To evaluate the effectiveness of different traditional machine learning classifiers for depression detection, five models, as shown in Figure 12, LR, NB, DT, RF, and SVM, were trained using TF-IDF features and tested on a labeled dataset. The performance of each model was assessed using key evaluation metrics: accuracy, precision, recall, and ROC-AUC score. The results are summarized in Table 6. SVM achieved the highest overall performance with an accuracy of 0.920, precision of 0.926, recall of 0.911, and a ROC-AUC score of 0.97. Its ability to handle high-dimensional feature spaces and create optimal decision boundaries makes it well-suited for text classification tasks such as depression detection. LR closely followed, demonstrating balanced and strong performance across all metrics: accuracy of 0.917, precision of 0.923, recall of 0.909, and ROC-AUC of 0.97. This highlights its effectiveness as a linear classifier with good generalizability and interpretability. RF also performed competitively with 0.893 accuracy, 0.882 precision, 0.905 recall, and 0.96 ROC-AUC, benefiting from ensemble learning and robustness to overfitting. However, it slightly lagged behind SVM and LR in precision and accuracy. NB despite its simplicity and fast computation, showed a lower precision of 0.847 and accuracy of 0.889, although it achieved the highest recall (0.947) among all models. This suggests it is more sensitive to detecting positive depressive cases, though at the cost of increased false positives. DT, on the other hand, recorded the lowest performance across all metrics, with accuracy (0.83), precision (0.831), recall (0.824), and ROC-AUC (0.83). Its tendency to overfit the training data may have limited its generalization capability on unseen data. Overall, SVM and LR emerged as the most effective models for depression detection, offering high accuracy and balanced precision-recall trade-offs. While NB may be valuable in recall-sensitive applications, its lower precision may require further refinement
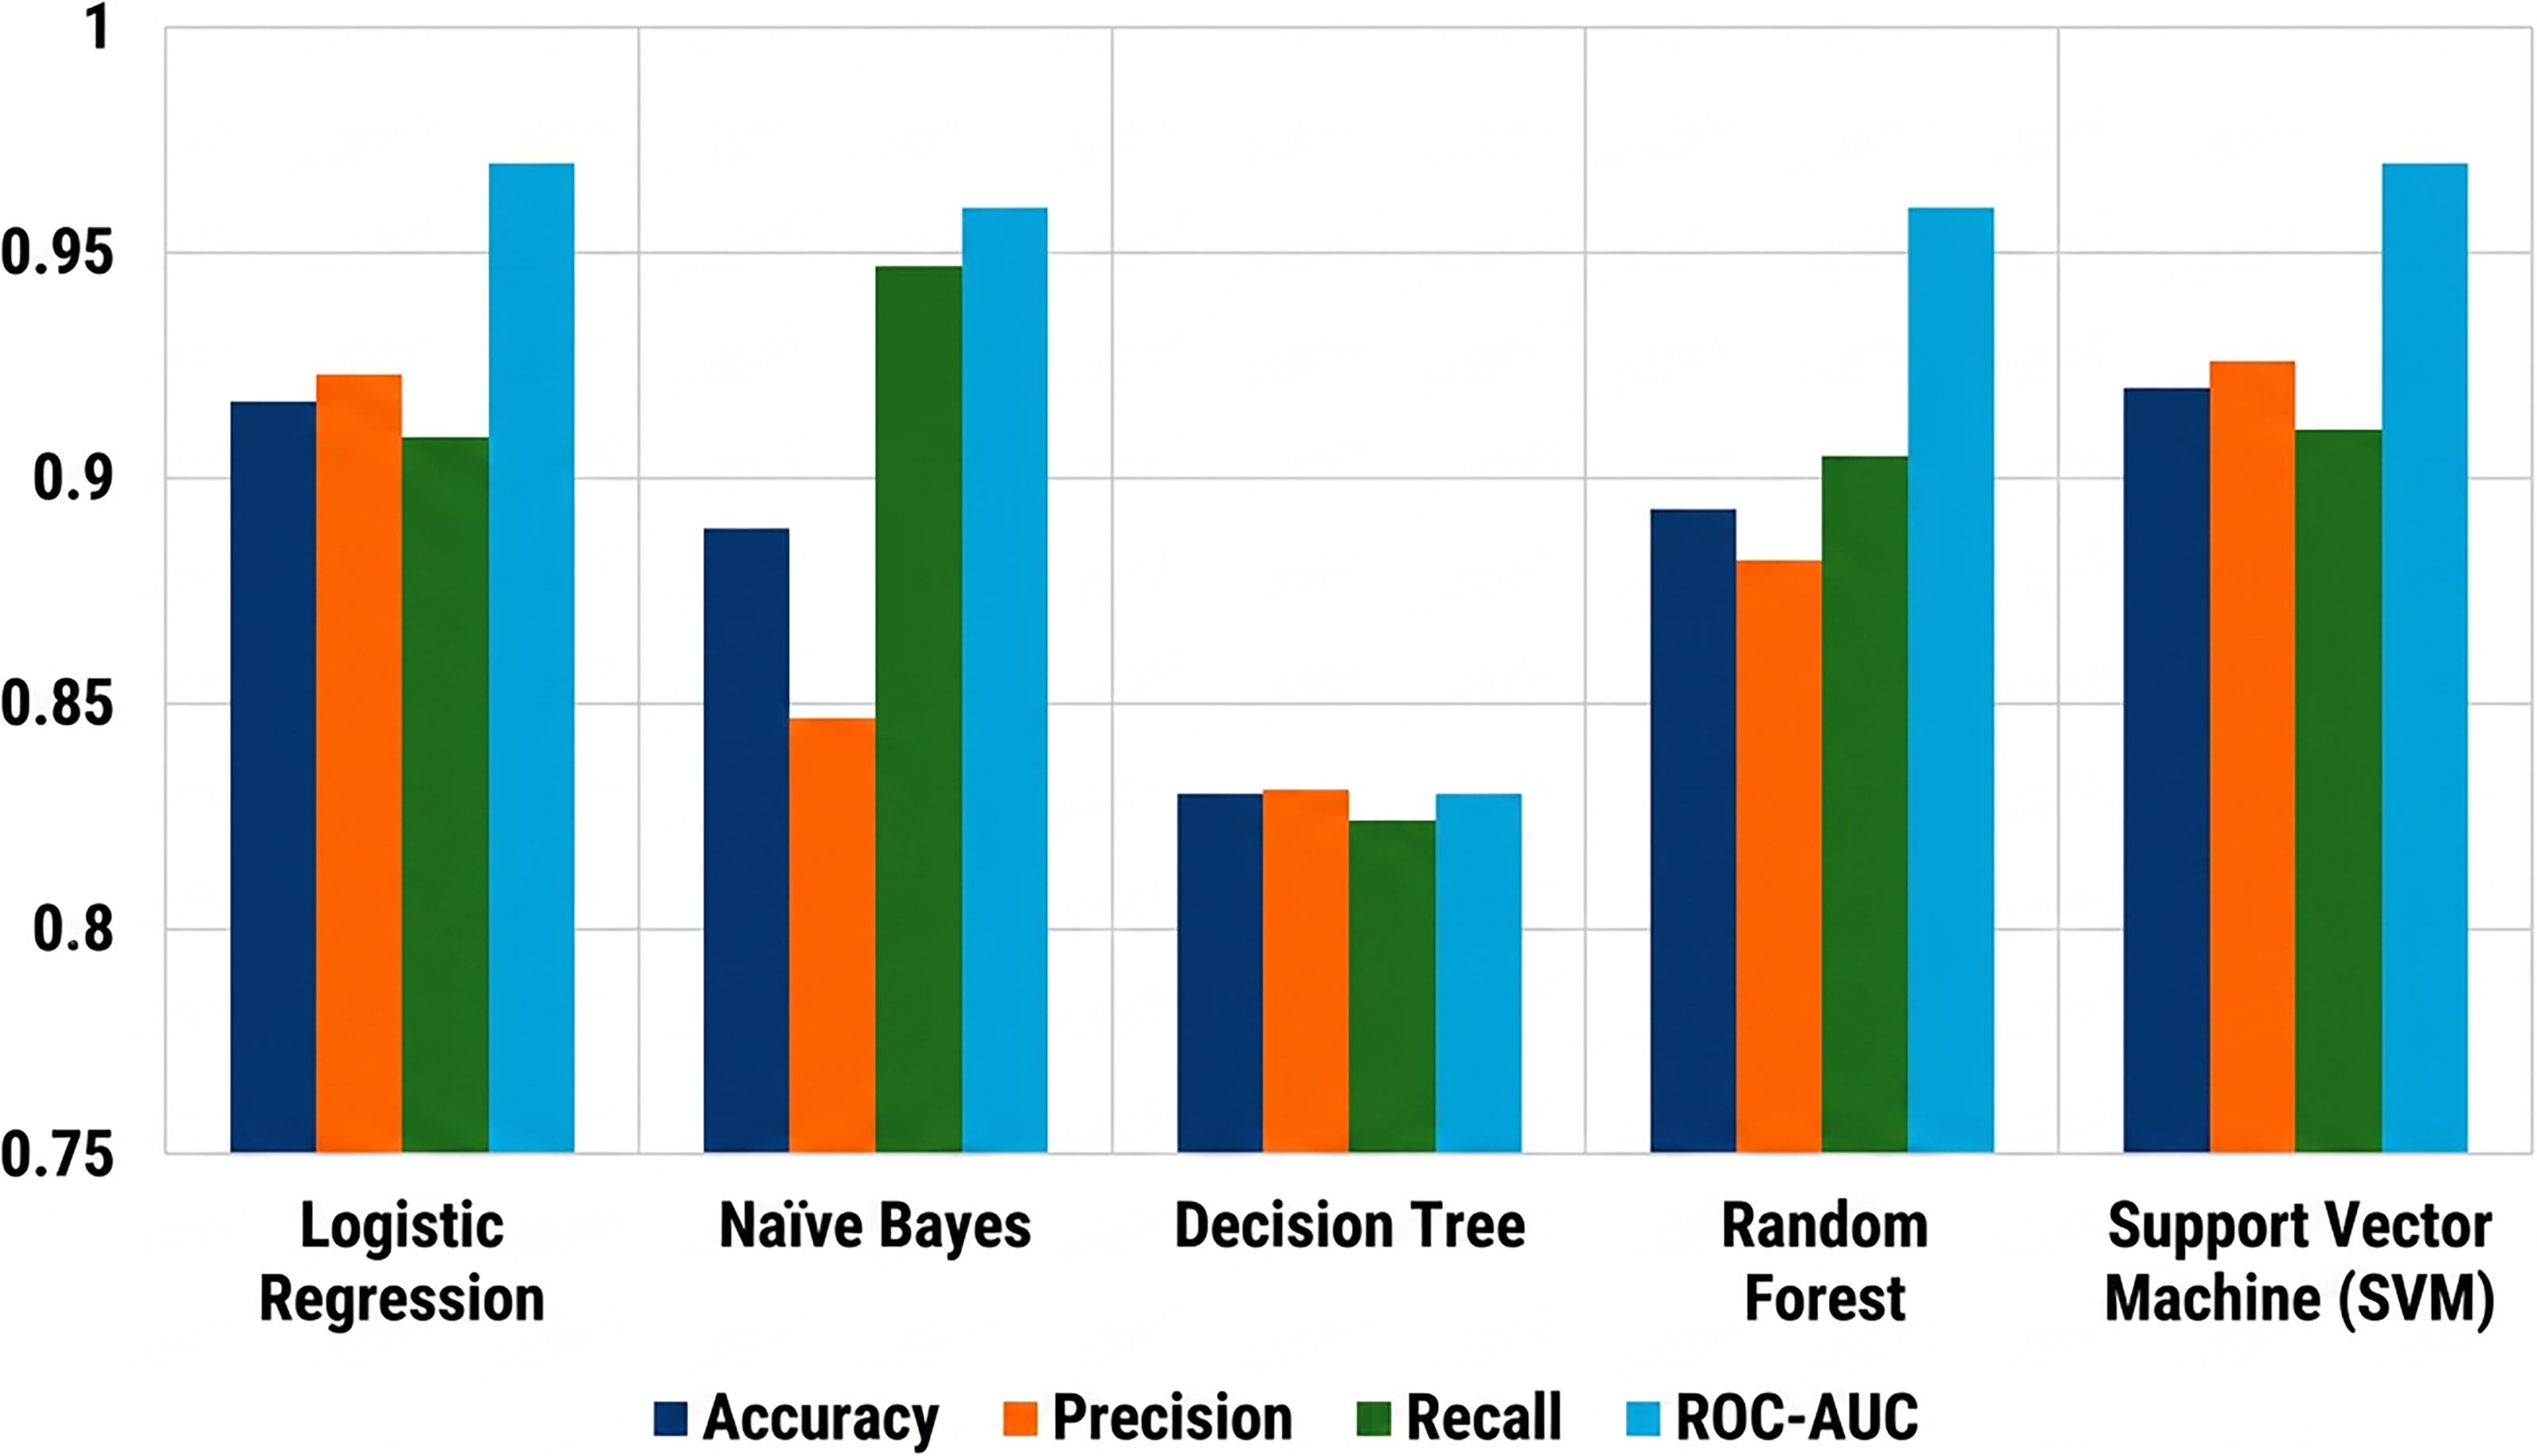
Comparative analysis of traditional ML algorithms in depression classification.
Transformer-Based Models for Emotion Analysis
This study evaluated five state-of-the-art transformer-based models, BERT, RoBERTa, DistilRoBERTa, XLNet, and DeBERTa as shown in Table 7 and Figure 13 for the task of emotion analysis using key performance metrics: accuracy, precision, recall, F1-score, and loss. Among these, BERT demonstrated the best overall performance, achieving the highest accuracy (0.945), precision (0.9466), recall (0.945), and F1-score (0.9446), with the lowest loss (0.1018). These results indicate that BERT is highly effective at capturing emotional nuance in text and generalizes well to unseen data. RoBERTa closely followed, with an accuracy of 0.944, a precision of 0.9458, a recall of 0.944, and an F1-score of 0.9436. Despite having a slightly higher loss (0.1361) than BERT, RoBERTa’s consistent performance across all metrics confirms its robustness in emotion classification tasks.

Comparative analysis of transformer-based models for emotion analysis.
DistilRoBERTa, a distilled version of RoBERTa optimized for efficiency, achieved strong results with an accuracy of 0.942 and an F1-score of 0.9417. With a minimal increase in loss (0.13661) compared to RoBERTa, it stands out as a lightweight yet competitive alternative, particularly suitable for deployment in real-time or resource-constrained environments. XLNet, which employs permutation-based language modeling, also performed competitively with an accuracy of 0.934, precision of 0.9357, and F1-score of 0.9335. It’s slightly higher loss (0.1361) suggests minor instability during training, but its performance remains solid across metrics.
DeBERTa, despite its advanced disentangled attention mechanisms, achieved the lowest scores among the group with an accuracy of 0.933, F1-score of 0.9326, and the highest loss (0.1951). This may point to a need for further fine-tuning or hyperparameter optimization to fully leverage its capabilities for emotion analysis. In summary, BERT is the most effective model for emotion detection based on the given dataset, while RoBERTa and DistilRoBERTa also offer strong performance. XLNet remains a viable alternative, and DeBERTa may require additional optimization for improved results in this domain.
Strengths of ThinkAI
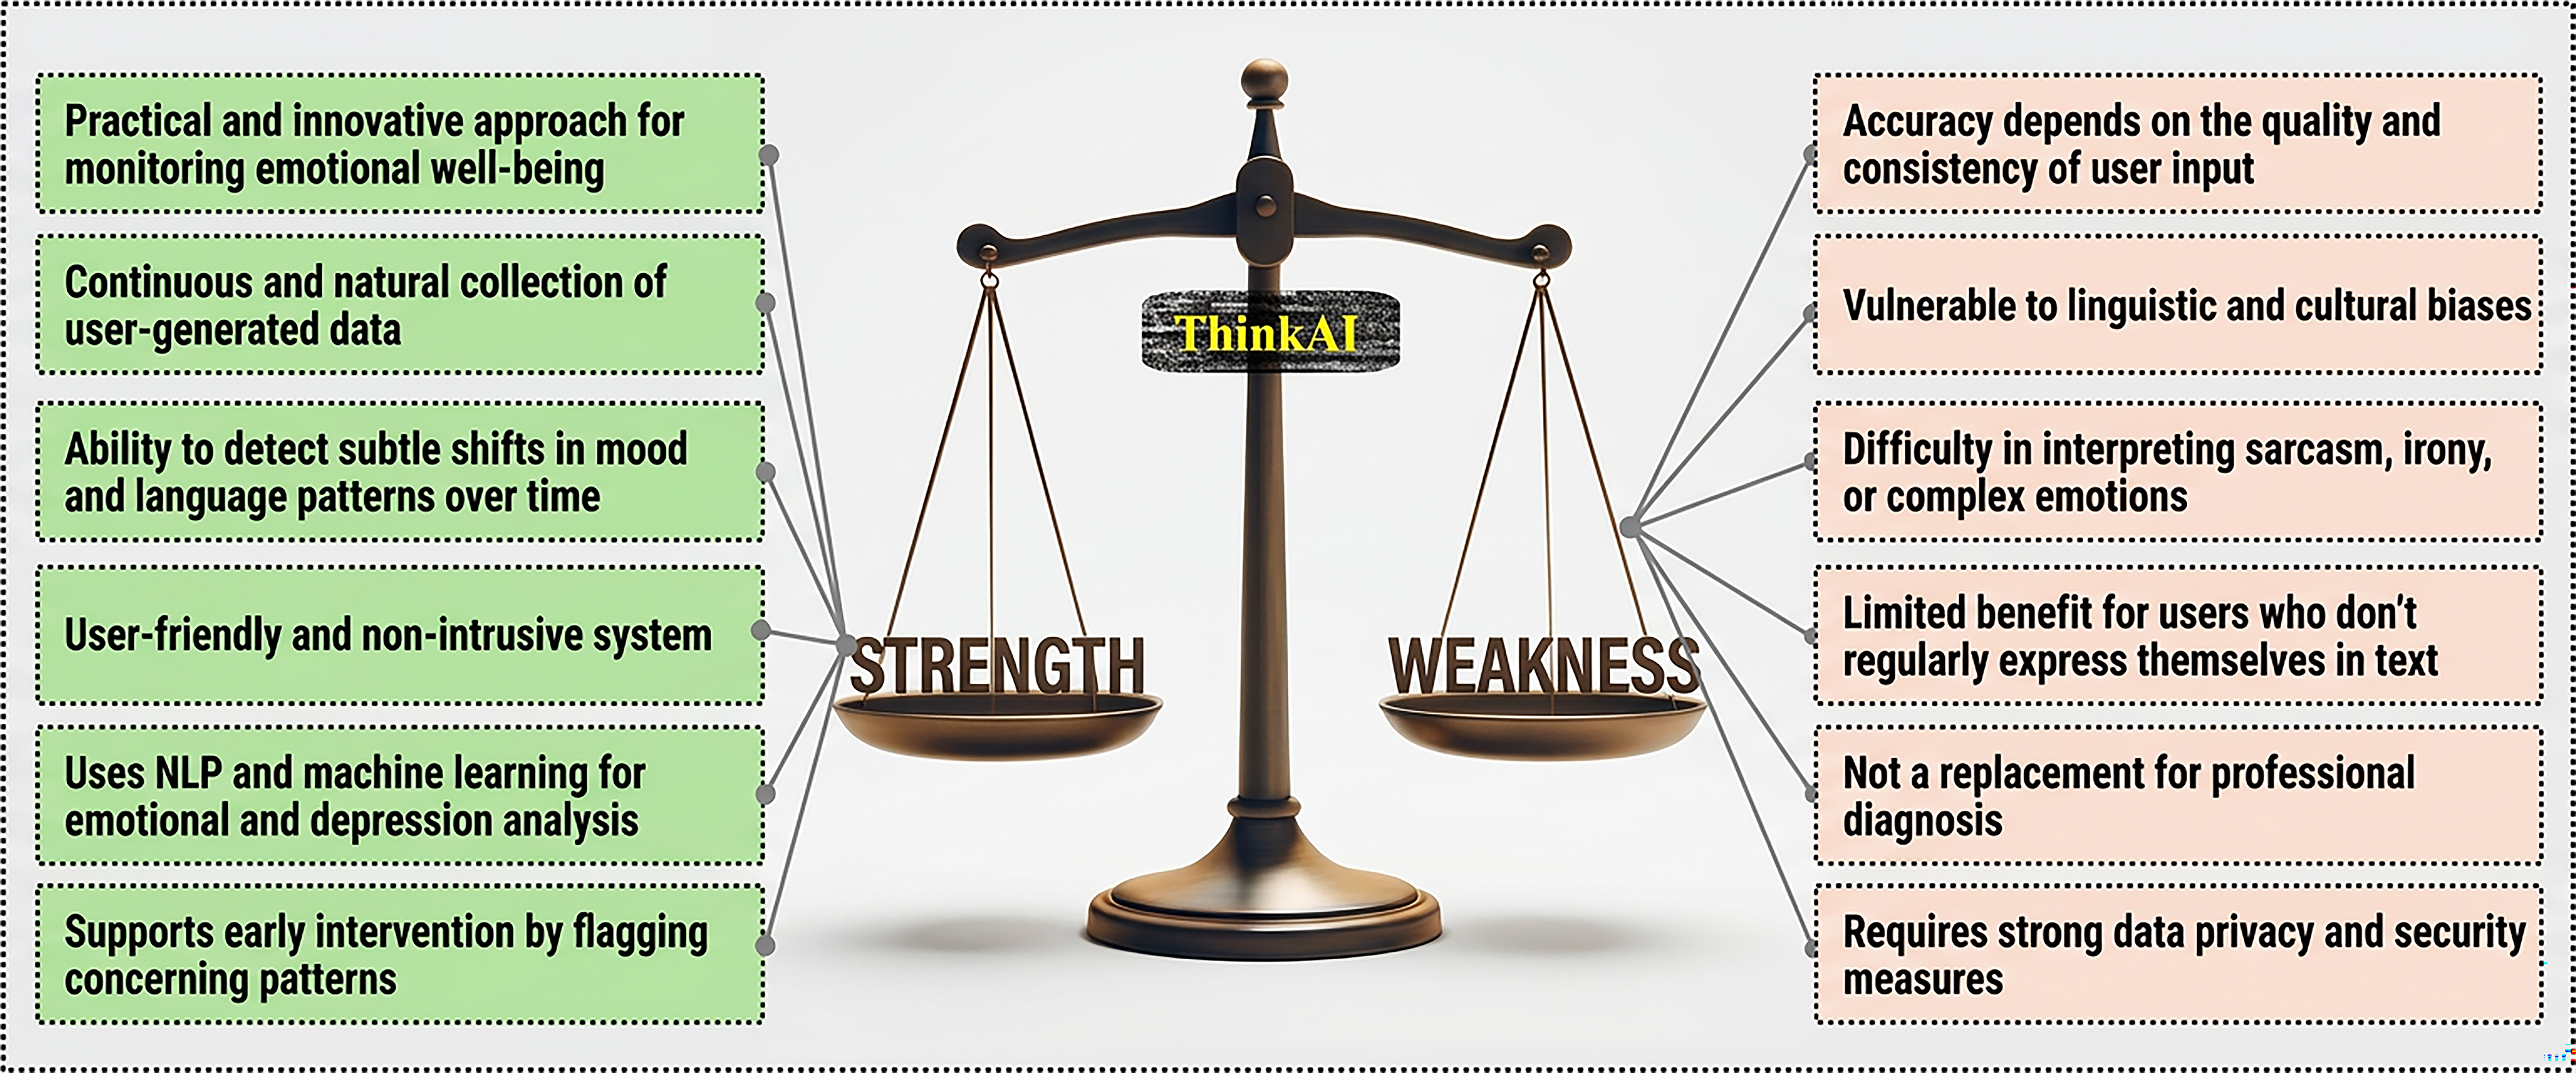
ThinkAI exhibits several strengths that are directly supported by its modular system architecture and the results as shown in Figure 14. A primary strength of the system is its ability to support monitoring of emotional well-being. This is done through continuous and natural collection of user-generated journal entries using the User Input Interface module. This architectural design enables the accumulation of temporally rich data, allowing the AI-Driven Text Analysis Engine to identify gradual changes in emotional expression and linguistic patterns over time. The experimental results demonstrate that such longitudinal data, when analyzed using transformer-based models, can effectively capture different emotional states and early indicators of depressive tendencies that are often overlooked in manual assessments. Another key strength of ThinkAI is its robust analytical capability. This is achieved through a hybrid framework that integrates transformer-based deep learning models with traditional machine learning classifiers. As evidenced by the evaluation results, the BERT-based emotion analysis model achieved high accuracy, precision, and F1-score, validating its effectiveness in modeling complex emotional language. Similarly, the strong performance of SVMs in classification tasks highlights the reliability of the system in processing large volumes of user-generated text. This combination of models enhances both predictive performance and system robustness. Scalability is further enabled by the modular design of the ThinkAI architecture, in which data collection, analysis, insight generation, and alert mechanisms operate as independent yet interconnected components. This design allows the system to efficiently handle increasing volumes of data without compromising performance. This makes the system suitable for individual self-monitoring as well as larger-scale applications such as research studies, institutional mental health initiatives, and workplace wellness programs. The Insight Generation and Visualization Module translates analytical outputs into interpretable dashboards, reinforcing user engagement and self-awareness. Finally, the integration of the Alert and Risk Detection System strengthens ThinkAI’s practical relevance by supporting early identification of concerning emotional patterns. By leveraging the outputs of the AI-Driven Text Analysis Engine and applying threshold-based risk evaluation, the system can flag sustained negative trends in a timely manner. As demonstrated in the results, this mechanism enhances the system’s preventive potential while maintaining a user-centric and privacy-aware design. Collectively, these strengths position ThinkAI as a scalable, effective, and ethically aligned platform for proactive mental health monitoring and emotional well-being support.
Strengths and weaknesses of proposed ThinkAI.
Weaknesses of ThinkAI
While ThinkAI can be used as a powerful tool for monitoring emotions and detecting signs of depression, it has some limitations. Its accuracy depends on the quality and consistency of user input, so very short, ambiguous, or informal entries can lead to less reliable detections. Future work may address this limitation by incorporating prompt guidance, adaptive input suggestions, or confidence scoring to better handle sparse or low-quality text. The system may also face cultural or linguistic biases, as it is trained on specific language patterns and might not fully generalize to all populations. Subtle aspects of language, such as sarcasm, irony, or complex emotions, can sometimes be misinterpreted, and individuals who do not regularly journal may not benefit fully from the system. Future research may explore advanced contextual modeling or multimodal analysis to better capture such nuances. Additionally, ThinkAI is not a replacement for professional diagnosis. It can highlight concerning patterns but cannot make clinical decisions. Finally, because it collects sensitive personal information, privacy and data security are critical, and strong safeguards and privacy mechanisms are necessary to protect users. While the current implementation anonymizes user identities during data storage, future work will focus on adopting more rigorous privacy-preserving mechanisms, such as enhanced encryption, secure access controls, and compliance with evolving data protection standards.
Practical implications
ThinkAI has significant potential for real-world applications in mental health monitoring and support. Analyzing daily journal entries or textual data can provide early insights into changes in emotional states or emerging depressive tendencies, enabling timely intervention. This system can be easily integrated into self-care apps, workplace wellness programs, or telehealth platforms. Thus, it offers users a convenient and non-intrusive way to track their mental well-being over time. The alert module can, in particular, be used to generate alerts in healthcare apps to connect users to a designated mental health professional in case of a mental health crisis. As an illustrative use case a user records brief daily journal entries using the ThinkAI interface over several weeks. The AI-Driven Text Analysis Engine analyses these entries longitudinally and identifies a sustained increase in negative emotional expressions. When the predefined risk threshold is exceeded, the Alert and Risk Detection System generates an in-app notification encouraging self-reflection and suggesting appropriate mental health resources. Thus, for health professionals, ThinkAI can serve as a complementary tool, helping to identify at-risk individuals and monitor progress during therapy, without replacing clinical judgment. Furthermore, the system can be made scalable and efficient to allow it to support large populations, making it suitable for research studies, educational settings, or community mental health initiatives. Overall, ThinkAI bridges the gap between personal mental health tracking and actionable insights, empowering both individuals and professionals to take proactive steps toward emotional and mental well-being. While ThinkAI shows strong potential for real-world deployment, several challenges must be addressed to support sustainable adoption. Long-term user engagement is critical, as consistent journaling underpins effective longitudinal analysis. Integration with existing healthcare systems may require interoperability with clinical workflows and electronic health records. Additionally, deployment in real-world settings must carefully consider regulatory compliance, data privacy, and ethical governance to ensure responsible and trustworthy use of the system.
Ethical and privacy considerations
Given the sensitive and potentially identifiable nature of mental health-related data, the ThinkAI system is designed in accordance with established ethical research principles and data protection guidelines. User participation is voluntary and based on informed consent. This consent is taken at the time of creating the user profile itself. Users are clearly informed about the purpose of data collection, the nature of automated analysis, and the intended use of generated insights. User privacy and data security are prioritized throughout the data lifecycle, from collection to storage and analysis. In line with General Data Protection Regulation (GDPR) principles, ThinkAI follows data minimization and purpose limitation practices by collecting only data necessary for emotional analysis and insight generation. Personally identifiable information is reduced where feasible, and user-generated content is stored in a secure, access-controlled environment. Users retain the full right to access, review, and delete their data. This supports transparency and user autonomy. The Alert and Risk Detection System adheres to privacy-by-design principles. Alerts are generated solely for the user and are not automatically shared with clinicians, caregivers, or third parties. This design choice preserves confidentiality and respects user autonomy while promoting self-awareness and early help-seeking behavior.
Explainability in think AI
Explainability is essential for AI systems used in mental health, as users need to understand why a system produces certain outputs in order to trust and use them effectively. ThinkAI addresses this by avoiding black-box predictions and instead presenting results in a clear and understandable way. Rather than showing output in terms of only risk scores or emotion labels, the system explains its findings using simple summaries and visual trends over time. For instance, when a user writes short daily journal entries over several weeks, ThinkAI looks for recurring patterns in emotional language. If the system notices frequent use of negative expressions such as “hopeless” or “exhausted” and a gradual decline in positive emotions, this change is shown through easy-to-read weekly charts. An accompanying message explains that the alert was generated because these negative patterns appeared consistently across multiple entries, not because of a single bad day. This approach helps users reflect on their emotional well-being and allows clinicians to interpret the results in context, while ensuring that ThinkAI remains a supportive tool rather than a diagnostic system.
Conclusion and Future Directions
In this study, we presented an innovative system, ThinkAI, an NLP, and an emotion analysis platform to support mental health through reflective journaling. By analyzing user inputs with advanced NLP algorithms, the platform provides insightful emotional visualizations, empowering users to track and enhance their emotional well-being over time. The easy-to-use and explainable interface, coupled with access to curated mental health resources, creates a secure and user-friendly environment conducive to self-reflection and emotional growth.
The results of our evaluation underscore the effectiveness of the system in analyzing emotional states and promoting mental well-being. Among the models evaluated for emotion analysis, BERT achieved the highest accuracy (0.945), precision (0.9466), and F1 score (0.9446), demonstrating its superior performance in capturing nuanced emotional states. Similarly, for classification tasks, SVMs outperformed other models with an accuracy of 0.92, showcasing their reliability in assessing user inputs. These findings validate the potential of combining AI-driven emotion analysis with therapeutic journaling practices. Furthermore, Statistical significance testing using paired t-tests was performed. Additionally, training and validation loss analysis across epochs indicates stable convergence and reliable learning behavior across all models. This approach not only facilitates self-awareness and emotional resilience but also offers a scalable and accessible solution for mental health support.
Thus, ThinkAI represents a meaningful step forward in addressing mental health challenges, paving the way for innovative, data-driven interventions. These interventions can empower individuals to achieve emotional balance and well-being. In future, we will explore integrating real-time feedback, multilingual support, adopting more robust privacy mechanisms, and adaptive personalization to further enhance the system’s usability and effectiveness. It can also be easily converted into real-world mental health support platforms and wellness applications to generate alerts to the healthcare facilities in case of severe health risks.
Authors’ Contributions
Kashish Ara Shakil and Mudasir Ahmad Wani contributed equally to all aspects of the work, including conceptualization, experimental design, implementation, data analysis, and manuscript preparation. Mudasir Ahmad Wani additionally supervised the overall research study and provided methodological guidance. Shakir Khan, Faiz Ullah, Younhyun Jung, and Gufran Ahmad Ansari reviewed the work and provided assistance in drafting the revised manuscript. Younhyun Jung also contributed to technical review and refinement of the manuscript. All authors read and approved the final version of the manuscript.
Footnotes
Acknowledgments
The authors would like to acknowledge the Princess Nourah bint Abdulrahman University Researchers Supporting Project, number PNURSP2026R757, Princess Nourah bint Abdulrahman University, Riyadh, Saudi Arabia.
Author Disclosure Statement
No competing financial interests exist.
Funding Information
The work was supported by Princess Nourah bint Abdulrahman University Researchers Supporting Project number (PNURSP2026R757), Princess Nourah bint Abdulrahman University, Riyadh, Saudi Arabia.