
Abstract
Data collection from online platforms, such as Amazon’s Mechanical Turk (MTurk), has become popular in clinical research. However, there are also concerns about the representativeness and the quality of these data for clinical studies. The present work explores these issues in the specific case of major depression. Analyses of two large data sets gathered from MTurk (Sample 1: N = 2,692; Sample 2: N = 2,354) revealed two major findings: First, failing to screen for inattentive and fake respondents inflates the rates of major depression artificially and significantly (by 18.5%–27.5%). Second, after cleaning the data sets, depression in MTurk is still 1.6 to 3.6 times higher than general population estimates. Approximately half of this difference can be attributed to differences in the composition of MTurk samples and the general population (i.e., sociodemographics, health, and physical activity lifestyle). Several explanations for the other half are proposed, and practical data-quality tools are provided.
Keywords
Research practices in clinical psychology are changing. An increasing number of researchers have discovered the advantages of online data collection platforms, which provide researchers with unprecedented accessibility to thousands of registered research participants from diverse demographical backgrounds (Buhrmester, Kwang, & Gosling, 2011), including “hard-to-reach” clinical populations, such as individuals who suffer from major depression. To date, the most commonly used online data collection platform is Amazon’s Mechanical Turk (MTurk). A Google Scholar search (January 2019) for publications using the phrases Mechanical Turk/MTurk and depression resulted in over 7,500 hits. Moreover, recent reports suggest that depression rates are substantively higher in MTurk compared with the general population (Arditte, Çek, Shaw, & Timpano, 2016; Bunge et al., 2018; McCredie & Morey, 2019; Walters, Christakis, & Wright, 2018).
To the extent that this finding reflects a genuine difference, increased prevalence makes MTurk an even more convenient and attractive recruitment platform for clinical researchers. However, concerns have been raised regarding the representativeness and the quality of data collected from MTurk and similar platforms for clinical studies (Chandler & Shapiro, 2016; McCredie & Morey, 2019). If higher rates of depression in MTurk prove to be false or inflated, then serious questions would be raised about the reliability of clinical research outcomes that are based on such data sets. If, on the other hand, it proves to be genuine, then knowledge about the reasons behind increased prevalence rates is not only interesting on its own but also necessary for accurate interpretations of research results, in particular concerning the external validity of findings that are derived from MTurk samples.
In the present work, we examine whether depression is indeed more common in MTurk and explore several reasons that could account for such differences. In particular, we argue that failure to control for random, poor quality, and fake responses from MTurk respondents artificially inflates depression estimates and aim to quantify this confounding effect. Finally, we also explore the extent to which differences between MTurk and the general population on variables that are known to be associated with depression can account for remaining differences in the prevalence rates of depression.
Existing Research on Depression Rates in MTurk
According to the fifth edition of the Diagnostic and Statistical Manual of Mental Disorders (DSM–5; American Psychiatric Association, 2013), the 12-month prevalence of major depressive disorder in the United States is approximately 7% (Kessler, Petukhova, Sampson, Zaslavsky, & Wittchen, 2012). In the first study to focus on MTurk depression rates, Shapiro, Chandler, and Mueller (2013) used the Beck Depression Inventory (Beck, Steer, & Brown, 1996) to assess clinical levels of depression. Results showed that prevalence of clinical depression in MTurk was equivalent to the epidemiology of major depressive disorder in the general population. More recent studies, however, consistently reported that depression in MTurk is more common than in the general population: McCredie and Morey (2019) used the 344-item Personality Assessment Inventory (PAI; Morey, 1991, 2007) and found that MTurk scores on the PAI subscale of depression were moderately higher than in a representative sample of 1,000 U.S. citizens (d = 0.57).
Walters et al. (2018) administered a two-item screening tool for depression (Patient Health Questionnaire–2, or PHQ-2; Arroll et al., 2010) to a sample of 591 young MTurk workers (age < 50). They found that they were two to three times more likely to screen for depression than participants from a National Health and Nutrition Examination Survey (NHANES). Finally, Arditte et al. (2016) found that MTurk workers scored significantly higher on the depression subscale of the Depression, Anxiety, and Stress Scales (DASS-21; Lovibond & Lovibond, 1995) than subjects from a nonclinical sample (Osman et al., 2012; d = 0.94). Thus, even though most of the aforementioned studies did not include screening tools with formal cutoffs for major depression (and therefore do not offer a definite estimate for the prevalence of the disorder in MTurk), taken together, they reveal a range of outcomes, from lack of differences to moderate and even large differences between depression in MTurk and the general population.
A possible explanation for this pattern of mixed findings may be the different types of data-quality-assurance methods that were applied in each study. Poor quality responses can be the result of workers’ inattentiveness, boredom, fatigue, or carelessness. Moreover, MTurk researchers have recently evidenced illicit automated activity that is operated by fake MTurk workers (also known as bots or cyborgs; “Researchers Investigate,” 2018; Bai, 2018; Dennis, Goodson, & Pearson, 2019; Kennedy et al., 2019). Fake or inattentive workers pose a serious threat to the quality of the collected data, especially in highly skewed clinical distributions such as depression: Whereas most of the responses in such distributions should be concentrated around the zero point (i.e., no depression; Tomitaka et al., 2018), random false responses bias the clinical distribution toward the center because fake or inattentive workers assume uniform distributions or distributions that are centered around the middle of the scale. These false responses may even improve artificially the overall scale reliability (Fong, Ho, & Lam, 2010). Essentially, this bias would create an inflated misrepresentation of the data according to which artificially increased and allegedly reliable levels of depression would be observed.
Although MTurk operates an internal rating system of their workers, researchers are strongly advised to embed various attention and validity checks in their data collection tools to verify and ensure the quality of the collected data (Chandler, Shapiro, & Sisso, 2019; Dunn, Heggestad, Shanock, & Theilgard, 2018). Our own review of the methodological studies on MTurk revealed various types of data quality measures, including infrequency items (which have only one correct or highly probable answer), time measurements (with a minimum reading speed threshold), person-total correlations (capturing the subject’s internal consistency relative to the expected patterns derived from all other participants), long string analyses (which flags participants with a long string of identical answers), and exclusion of non-U.S. Internet protocol (IP) addresses and ones that are suspected to be indicative of automated activity.
A close inspection of the data-quality-assurance methods used in the studies addressing depression rates in MTurk reveals considerable differences: Arditte et al. (2016) used one criterion of time measurement and excluded 17.3% of their sample. Shapiro et al. (2013) used two criteria of infrequency items and filtered non-U.S. IP addresses, resulting in an exclusion of 15.6% of their sample. Walters et al. (2018) applied one criterion of infrequency items and removed duplicate IP addresses, excluding 7% of their sample. McCredie and Morey (2019) did not exclude any participants from their sample. It is therefore reasonable to assume that the different data-quality-assurance methods and the different exclusion rates would produce different estimates of depression. Moreover, it is well established that different methods spot different types of inattentive participants (Dunn et al., 2018; Jones, House, & Gao, 2015), which implies that any use of one type of method might fail to catch all or most of the inattentive or fake participants.
The Present Work
The current research has two specific goals: (a) to estimate the prevalence of depression among MTurk workers compared with the general population and (b) to explore possible reasons behind increased depression estimates among MTurk workers, such as poor-quality responses and sociodemographic differences between the MTurk sample and the general population. Two consecutive studies are presented, each conducted on a large sample of MTurk workers (Sample 1: N = 2,692; Sample 2: N = 2,354) with a time interval of 4 months between studies. Together, these two samples cover a significant portion of the available MTurk participant pool. 1 In both studies, we used the PHQ-9 (Kroenke, Spitzer, & Williams, 2001), the most common and most often validated screening tool for depressive disorders (El-Den, Chen, Gan, Wong, & O’Reilly, 2018). The PHQ-9 consists of nine items, each targeting one of the DSM–V-defined symptoms (American Psychiatric Association, 2013). The sensitivity and the specificity of the PHQ-9 cutoff point for major depression have been documented using the “gold standard” criterion structured clinical interview, and the tool is recommended over other self-report screening tools (Löwe et al., 2004). Both studies also included a multilayered data-quality-assurance methods. In practice, we have applied a procedure that monitored fake workers (bots or cyborgs) and created a solid inattentiveness index that ensures the validity of unsupervised data collection in MTurk. Because we used four complementary data-quality-assurance methods specifically calibrated to MTurk populations and clinical assessment tools, the inattentiveness index produced different hierarchical levels of workers’ attentiveness estimation (see Method, Study 1).
Using these data-quality measures and other convergent validity tests, Study 1 aims to offer a first yet reliable estimate of the prevalence of depression in MTurk samples relative to the acknowledged prevalence of depression in the general population. In Study 1, we also present a comparison between the different groups of the inattentiveness index to estimate the effects of poor responses on depression rate estimates in MTurk workers. In Study 2, we aim to replicate the Study 1 findings in a new sample while controlling for several additional explanations for any differences in depression rates between MTurk workers and the general population. In Study 2, we compare the depression rates in MTurk workers with an existing database from a recent national representative survey by the U.S. Centers for Disease Control and Prevention (2018) that used the same assessment tool for depression (the PHQ-9) but in a face-to-face format. We test also whether the differences in the prevalence of depression between the two samples could be explained by differences in sociodemographic variables (e.g., gender, age, and occupational status), general health factors, and physical activity (e.g., sleep and amount of time sitting down). Finally, we also explored whether similar patterns would be attained when using a different indication of depression (i.e., the use of depression-related psychiatric medications).
Study 1
A large sample of MTurk workers completed a survey battery, including the PHQ-9 for depressive disorders. Convergent validity of the depression scale was established with three additional questionnaires that each target a well-established, close predictor of depression: generalized anxiety disorder (Sartorius, Üstün, Lecrubier, & Wittchen, 1996), depressive rumination (Nolen-Hoeksema, Parker & Larson, 1994; Nolen-Hoeksema, Wisco, & Lyubomirsky, 2008), and loneliness (Cacioppo, Hughes, Waite, Hawkley, & Thisted, 2006). Data quality was ensured by screening for suspicious IP addresses that were suspected to be operated by illicit semiautomated MTurk workers (cyborgs) and a comprehensive inattentiveness index that included multiple attention checks integrated into the survey battery.
Method
Participants and procedure
The procedure of the study was approved by the Ethics for Research on Human Subjects Committees at the Hebrew University and the Technion–Israel Institute of Technology. Subjects eligible to participate were U.S.-based MTurk workers who had completed at least 100 human intelligence tasks with a minimum 95% success rate and who owned a Facebook account at the time of recruitment (a requirement resulting from a different study). A total of 2,719 MTurk adult workers (64% female) participated in the study, which ran in several batches between May and July 2018. Twenty-two workers (0.8%) dropped out before completing the full survey, thus reducing the final sample to 2,692 MTurk workers. The median completion time was 8.3 min (mean = 11.8 min), and participants were paid $2 for completion of the survey. The average age of the participants was 34.80 years (SD = 11.05). The average income per household was $58,400 per year (SD = $38,900, median = $55,000). Only 10.8% of the sample did not receive higher education. The majority of MTurk workers (74.3%) had studied or completed a bachelor’s college degree, 12.4% had completed a master’s degree, 1% had completed a doctoral degree, and 1.5% had a professional degree (e.g., JD, MD). Altogether, the online survey included six self-report research questionnaires and eight attention checks/indicators. These measures are described below.
Depression
Depression was measured using the PHQ-9 (Kroenke et al., 2001), which consists of nine items that assess the presence and severity of the nine DSM-based symptoms of depression in the previous 2 weeks on a scale from 0 to 3 (not at all, several days, more than half the days, and nearly every day, respectively). In the current work, we use the term major depression to describe participants who met the threshold criteria for major depression according to the scoring system described by the developers of the tool (Spitzer, Kroenke, & Williams, 1999). According to the developers, the cutoff point for major depression follows the DSM diagnostic criteria. Major depression can therefore be calculated when five or more symptoms receive a score of 2 (more than half the days) or 3 (nearly every day). Other depressive disorders (e.g., dysthymia) can be diagnosed if two to four symptoms are reported with at least a 2 score (more than half the days). Corresponding with the DSM criteria, both diagnoses are valid only when one of the key symptoms of depression, low interest, and depressed mood are reported for at least more than half the days (Spitzer et al., 1999). In this scale, the term any depression is used to describe individuals who have either one of the depressive disorders.
Total PHQ-9 scores (range = 0–27) can also be analyzed as a continuous variable that measures the severity of the depressive disorder (Kroenke et al., 2001). The cutoff points of 10 and 15 indicate moderate and severe depression, respectively (Kroenke et al., 2001). A further psychometric analysis of the PHQ-9 revealed that the cutoff point for moderate depression (i.e., a total score of ≥ 10 points) may actually detect more cases of major depressive disorder than the original method of scoring (Arroll et al., 2010). The reliability and validity of the PHQ-9 have been extensively documented in the literature (El-Den et al., 2018). In the current sample, the internal consistency of the scale was high (α = .88).
Three self-report measures were administered to check the convergent validity of the depression scale: the Generalized Anxiety Disorder scale (GAD-7; Spitzer, Kroenke, Williams, & Löwe, 2006 α = .91), the Brooding subscale (Schoofs, Hermans, & Raes, 2010) from the Ruminative Responses Scale (RRS; Nolen-Hoeksema & Morrow, 1991), and a short version of the UCLA-Loneliness Scale (Russell, 1996; Russell, Peplau, & Ferguson, 1978; α = .92). Detailed descriptions of these measures are provided in the Supplemental Material available online.
Suspicious IP addresses
As described in the introduction, the past few months have been characterized by the growing presence of suspicious automated or semiautomated activities on MTurk originating from bogus workers (bots or cyborgs, respectively; “Researchers Investigate,” 2018; Bai, 2018; Kennedy et al., 2019). Dennis et al. (2019) found that this new surge of low-quality workers is characterized by worker IP addresses that can be traced to a certain type of Internet service provider (ISP) known as virtual private servers. Furthermore, there are serious suspicions that these accounts are operated by people from outside the United States, mainly from India (Moss & Litman, 2018) and Venezuela (Kennedy et al., 2019). Therefore, participation in this study was limited to U.S. workers only and applied a newly designed tool to flag MTurk workers whose IP address was suspicious of malicious activity and/or traced to a non-U.S. location (Prims et al., 2018).
Inattentiveness index
To ensure the quality of the unsupervised self-reported data, we created a designated scale. This scale consisted of eight checks based on four different methods. Two checks were based on infrequency items (Huang, Bowling, Liu, & Li, 2015), which have only one correct or highly probable answer. Two checks were based on time measurements, with a reading-speed threshold of 10 words per second (Sisso, 2019). One attention check was based on the person-total correlation that captures the person internal consistency relative to the expected patterns generated by all other participants (Curran, 2016). Finally, three attention checks relied on long-string analysis, which flags participants with a long string of identical answers. The number of failed attention checks for each participant was counted, and a unified 3-point scale of attentiveness was created: Attentive workers (who did not fail any attention checks) received an attentiveness score of zero; questionable workers (who failed only one attention check) received 1 point; and inattentive workers (who failed only two or more attention checks) received 2 points.
Results
The final sample included 2,692 MTurk workers. To ensure the quality of the unsupervised self-reported data, we screened the data set for suspicious and non-U.S. IP addresses, and we calculated attentiveness scores for each participant. A total of 236 workers (8.8% of the sample) was identified as suspicious and non-U.S. workers. Not surprisingly, 35.6% of these suspicious IPs also failed our attentiveness test (scored 2 on the inattentiveness scale), compared with 7.4% of nonsuspicious IPs, χ2(1) = 193.3, p < .001. From the remaining 2,456 nonsuspicious MTurk workers, 181 inattentive workers (7.4%) failed two or more attention checks, 427 questionable workers (17.4%) failed only one attention check, and a total of 1,848 attentive workers (75.2%) did not fail any of the eight attention checks.
The full, filtered data set, which included attentive workers only and excluded suspicious workers, demonstrated good psychometric qualities. All measures used in the current study achieved good internal consistency. Descriptive statistics and zero-order correlations of the variables are presented in Table S1 in the Supplemental Material. Consistent with the literature, psychopathology (depression and anxiety) and distress (depressive rumination and loneliness) measures demonstrated high convergent validity (see Table S1).
Prevalence of Major Depression in MTurk, Study 1
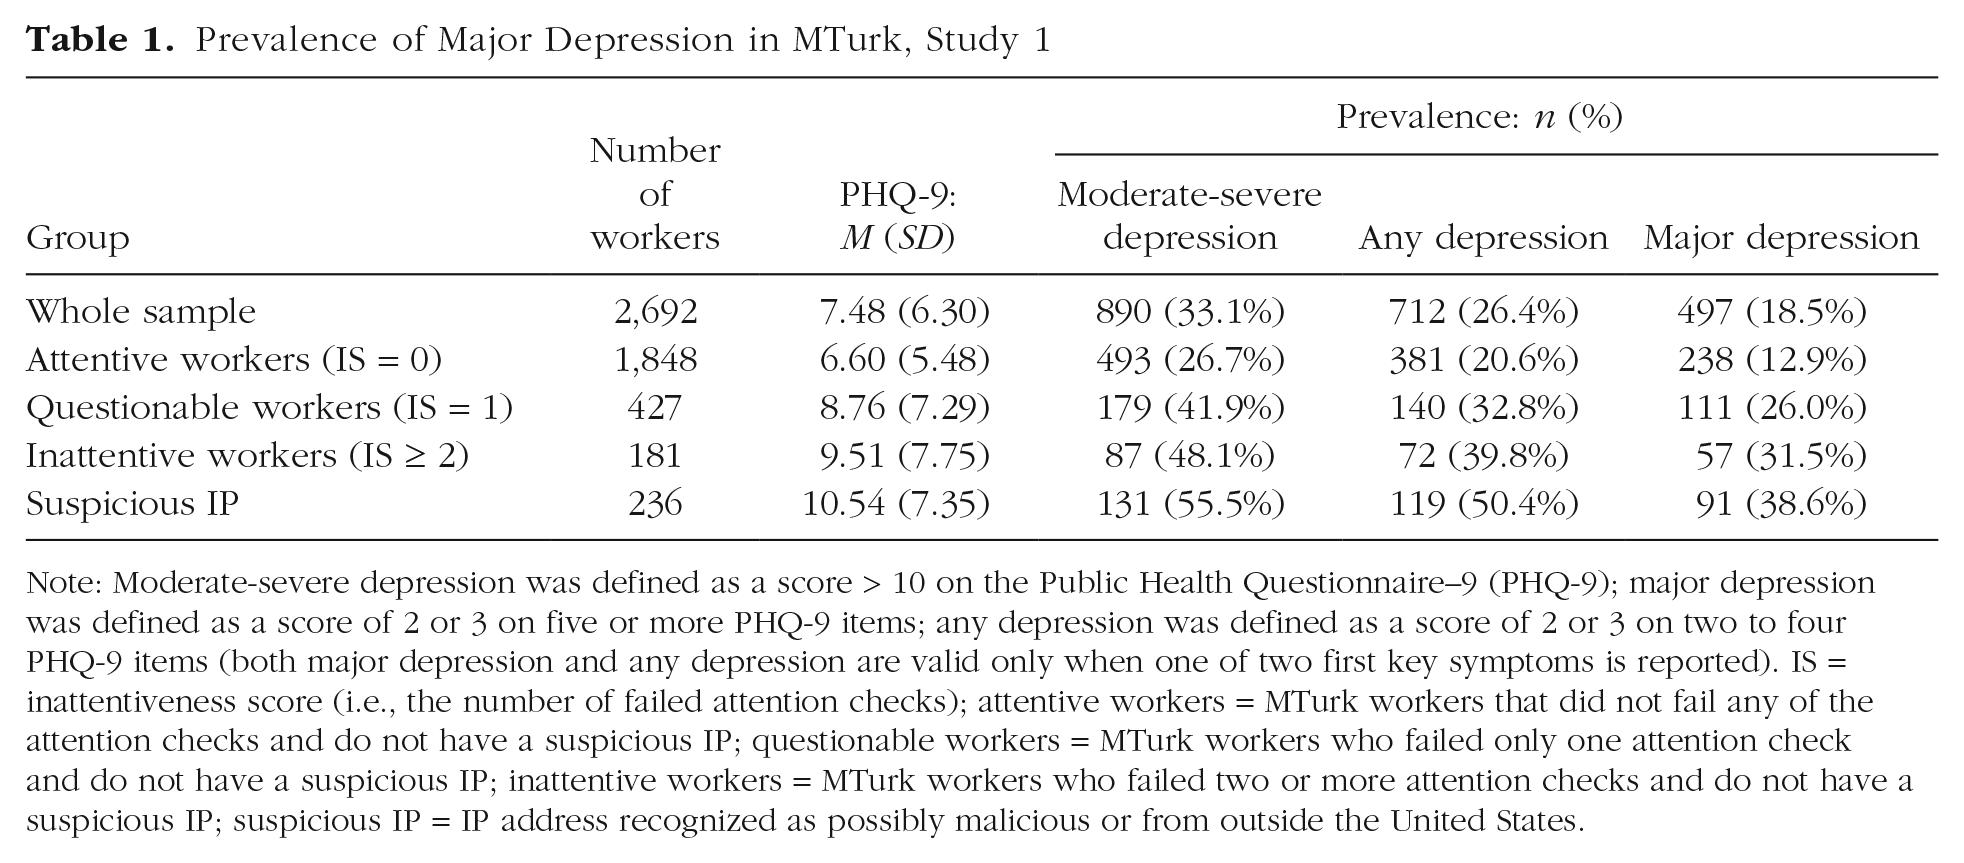
Note: Moderate-severe depression was defined as a score > 10 on the Public Health Questionnaire–9 (PHQ-9); major depression was defined as a score of 2 or 3 on five or more PHQ-9 items; any depression was defined as a score of 2 or 3 on two to four PHQ-9 items (both major depression and any depression are valid only when one of two first key symptoms is reported). IS = inattentiveness score (i.e., the number of failed attention checks); attentive workers = MTurk workers that did not fail any of the attention checks and do not have a suspicious IP; questionable workers = MTurk workers who failed only one attention check and do not have a suspicious IP; inattentive workers = MTurk workers who failed two or more attention checks and do not have a suspicious IP; suspicious IP = IP address recognized as possibly malicious or from outside the United States.
To establish the prevalence of depression among MTurk workers and examine the effects of poor responses, we calculated the depression rates for each one of the subgroups of the study (inattentive, questionable, and attentive MTurk workers) separately. Table 1 presents the mean scores of the PHQ-9 along with the prevalence of PHQ major depression and of any depression (which includes both major depression and other depressive disorders), according to the validated cutoff points of the PHQ-9.
The initial prevalence of PHQ major depression in the entire sample, including inattentive MTurk workers, was 18.5%, that is, almost one in five MTurk workers. Less than a third of the sample (27.2%) scored 0 to 2 total points (skewness = .77), and only 13.8% were free of depressive symptoms (PHQ-9 = 0). Significant differences were documented between the various groups of the inattentiveness index, F(3, 2688) = 40.80, p < .001. A clear pattern was observed: The more attentive the user, the less frequent the depression estimates in the sample.
The prevalence of major depression among valid, attentive MTurk workers was 12.9%. This prevalence increased dramatically among questionable workers (26.0%), inattentive workers (31.5%), and workers with a suspicious IP address (38.6%), χ2(3) = 138.1, p < .001. The prevalence of major depression in the current sample of attentive, valid MTurk workers (12.9%) was significantly higher than the prevalence of major depressive disorder in the general population (7%) according to the DSM–V (American Psychiatric Association, 2013), χ2 = 99.01, p < .001.
Discussion
The findings from Study 1 demonstrate the importance of including stringent data-quality-assurance methods in MTurk-based clinical research on psychopathologies. Given their response patterns to the screening tool, between 26% and 39% of inattentive and suspicious MTurk workers would be screened for major depression in this sample. These exceptionally inflated scores corroborate with our concern that random false responses might bias clinical skewed distribution and create a misrepresentation of extremely high prevalence of major depression. Second, even after the exclusion of inattentive and suspicious MTurk workers, the prevalence of major depression in this large MTurk sample seems substantively higher (13%) compared with general population estimates (7%). Although this comparison should be carefully interpreted, it corroborates with previous research reporting higher depression scores among samples of MTurk workers (Arditte et al., 2016; McCredie & Morey, 2019; Walters et al., 2018) as well as higher rates of other psychopathologies (Goodman, Cryder, & Cheema, 2013; Kosara & Ziemkiewicz, 2010).
Study 1 has several limitations. The recruitment procedure excluded MTurk workers without active Facebook accounts, and the depression estimates in MTurk were based on a self-report screening tool (PHQ-9), whereas the DSM estimates are based on face-to-face, structured clinical interviews (Kessler et al., 2012). Difference in prevalence rates could thus be the result of using different screening tools. Indeed, previous large studies that evidenced significantly lower rates of PHQ major depression (~5%) in the general population (Eisenberg, Gollust, Golberstein, & Hefner, 2007; Tomitaka et al., 2018) support the current findings in which MTurkers were characterized by unusually high rates of depression. Yet a direct comparison using the same screening tool is preferable. Study 2 then seeks to replicate the findings from Study 1 in a new MTurk sample while addressing these two alternative explanations. In addition, Study 2 was designed to explore the extent to which observed differences in prevalence rates could be attributed to differences in the composition of the MTurk population on a number of individual variables that are known to be associated with depression, such as age, income, and education level (American Psychiatric Association, 2013).
Study 2
To address the issues raised regarding Study 1, a new data set was collected from MTurk. We compared its characteristics with a recently collected data set from the NHANES (U.S. Centers for Disease Control and Prevention, 2018). The NHANES is administered biennially to a large, representative sample of the U.S. population and includes (among other measures) the PHQ-9 as well as many additional sociodemographic, health-related, and physical activity characteristics.
In addition, the following changes were made to the MTurk data set collection procedure. First, the inclusion criterion of owning a Facebook account was removed in Study 2. Second, measures of sociodemographic, health-related, and physical-activity lifestyle characteristics that were found to be associated with depression in the NHANES study were added to the MTurk survey battery. Third, we added a second indicator of depression to cross-validate the outcomes of the self-reported behavioral measures of depression (i.e., self-reported use of depression-related psychiatric medications).
To test whether measured differences between the prevalence of depression in MTurk and the general population could be attributed to differences in sociodemographic and/or health- and physical-activity-related variables between the two, we conducted a statistical comparison of the depression rates in each after controlling for the former.
Method
Participants and procedure
The data collection in Study 2 was conducted 4 months after the completion of Study 1 (October 2018). The procedures were similar to those in Study 1; some minor modifications increased the generalizability of results. These modifications included opening the data collection to 24 hr/day for a wide range of workers’ classifications (reputation and experience). A total of 2,444 U.S.-based MTurk workers participated in Study 2 (46.5% female, mean age = 35.4 years, SD = 11.3). The median completion time was 7.9 min (M = 9.5 min). Participants were paid $1 after completion. Ninety workers (3.7%) dropped out before completing the full survey. The final sample of Study 2 comprised 2,354 MTurk workers, including 187 workers (7.9%) who also participated in Study 1. The average household income per was $58,300 a year (SD = $42,500, median = $50,000). The majority of the workers (74.3%) had studied or completed a bachelor’s degree, 12.4% completed a master’s degree, 1% completed a doctoral degree, and 1.5% had a professional degree (e.g., JD, MD).
In addition to measuring self-reported depression, as in the NHANES, participants were asked to indicate whether they had used any prescribed psychiatric medications (i.e., medications that are used to treat mental conditions such as depression or anxiety) in the past 30 days. Participants who responded positively then indicated the type of the medication while choosing one or more options from the following: antidepressants (e.g., fluoxetine, sertraline, venlafaxine, duloxetine), mood stabilizers (e.g., lithium carbonate, carbamazepine, lamotrigine), benzodiazepine/anxiolytics (e.g., alprazolam, diazepam, zolpidem), stimulants (e.g., methylphenidate, dexmethylphenidate, amphetamine/dextroamphetamine), and antipsychotics (e.g., risperidone, olanzapine, quetiapine, chlorpromazine). A positive response to at least one of the first two categories was classified as an indication of the participant using depression-related medications (a dichotomous variable).
CDC National Health Survey
To conduct a comparison with representative data from a national survey, we analyzed published data from 5,134 individuals who participated in a recent NHANES, which was collected in 2015–2016 (U.S. Centers for Disease Control and Prevention, 2018). It was selected as an anchored reference to the current study because it concerns a representative sample from the U.S. population and is based on the exact same screening tool for depression (i.e., the PHQ-9). The NHANES is conducted every 2 years. Data are collected by face-to-face interview in the survey participants’ homes. The data collected targets information about the physical and mental health of adults and children in the United States as well as their nutritional habits and physical activity.
We extracted significant predictors of depression from the NHANES report (U.S. Centers for Disease Control and Prevention, 2018) and included these variables in our own MTurk-based data-collection procedure using identical prompts: (a) sociodemographic variables (gender, age, income, education, and work status) and (b) health- and lifestyle-related variables (poor health, weight status, physical activity, time sitting down during the day, and hours of sleep during the night).
Results
The final sample included 2,354 MTurk workers. As described in Study 1, to ensure the quality of the unsupervised, self-reported data, we monitored the data for suspicious IP addresses and calculated the remaining participants’ attentiveness scores using six 2 attention checks. We used the same detection method from Study 1, and a total of 614 (26.1%) IPs were flagged as suspicious and non-U.S. addresses. Compared with the first sample, which was collected between May and July 2018, this increase in the percentage of suspicious and non-U.S. addresses in October 2018 is dramatic. This increase is not particular to the current study and has been documented in the literature (Kennedy et al., 2019). From the remaining 1,731 MTurk workers, 118 inattentive workers (6.8%) failed two or more attention checks, 161 questionable workers (9.3%) failed only one attention check, and a total of 1,461 attentive workers (84.4%) did not fail any of the six attention checks (only 18.7% of the suspicious participants did not fail any of the attention checks). All further analyses and comparisons are conducted on the valid attentive workers only, unless specified otherwise.
Replication of Study 1
First, the test–retest reliability of the PHQ-9 scale was tested by calculating the correlation between PHQ-9 scores of the participants that particpated in both samples. The observed reliability of the PHQ-9 over a period of 4 months among 108 attentive returning workers (who were also attentive in Study 1) was good (r = 0.79, p < .001). In this sample, 11% of attentive MTurk workers met the PHQ-9 criterion of major depression. Despite the modifications in the procedures of the two studies, there was no significant difference in the prevalence of major depression between Study 1 (12.9%) and Study 2 (11%), χ2(1) = 2.78, p = .095. Thus, the findings of Study 2 replicate the Study 1 finding showing increased rates of major depression among MTurk workers when using the PHQ-9 criterion for major depression. Moreover, similar patterns were found for the effects of including inattentive and invalid MTurk workers. The prevalence of PHQ major depression in this sample was considerably higher among questionable (26.1%) and inattentive workers (55.1%), χ2(2) = 179.5, p < .001. The prevalence of major depression among suspicious IP participants was even slightly (though not significantly) higher than that of nonsuspicious, inattentive participants (61.9%), χ2(1) = 1.92, p = .166.
Comparison with the NHANES
To compare the obtained depression scores with the representative national survey that used the same screening tool, we conducted an independent-sample t test (equality of variances not assumed 3 ) comparing mean PHQ-9 scores in the MTurk (N = 1,461) and the NHANES (N = 5,134) databases. On average, attentive MTurk workers scored higher on depression (M = 6.05, SD = 5.60) than participants in the NHANES (M = 3.24, SD = 4.22), t(1954.2) = 17.76, p < .001, with a medium to large effect size, Cohen’s d = 0.615 (95% CI = [0.556, 0.647]). The prevalence of PHQ major depression among attentive-nonsuspicious MTurk workers was 11%, which is three times higher than the 3.6% prevalence in the 2015–2016 NHANES sample, χ2(1) = 125.9, p < .001.
Controlling for sociodemographic and health- and lifestyle-related differences
A comparison of the two data sets on depression-related sociodemographic characteristics and health- and lifestyle-related characteristics revealed significant differences between them on all variables except gender (see Tables 2 and 3). These variables (including gender) were then controlled for in a hierarchical regression analysis. Because the distribution of the continuous PHQ-9 scores was heavily (positively) skewed, a logistic regression model was chosen to predict major depression as a dichotomous dependent variable. Two additional regression models with a continuous depression variable (an ordinary least squares, or OLS, model and a left-censored Tobit model 4 ) are provided in Table S2 in the Supplemental Material as well as an additional logistic regression on a lower cutoff of the PHQ9, which represents any depression. The first model included the sample group (MTurk or NHANES) only. In the second model, the sociodemographic variables associated with depression (i.e., gender, age, income, education, and work) were added. Finally, in the third model, the health- and lifestyle-related variables (poor health, weight, physical activity, sleep, and time sitting down during the day) were added.
Descriptive Statistics for All Independent Variables and Tests of the Difference Between the Samples
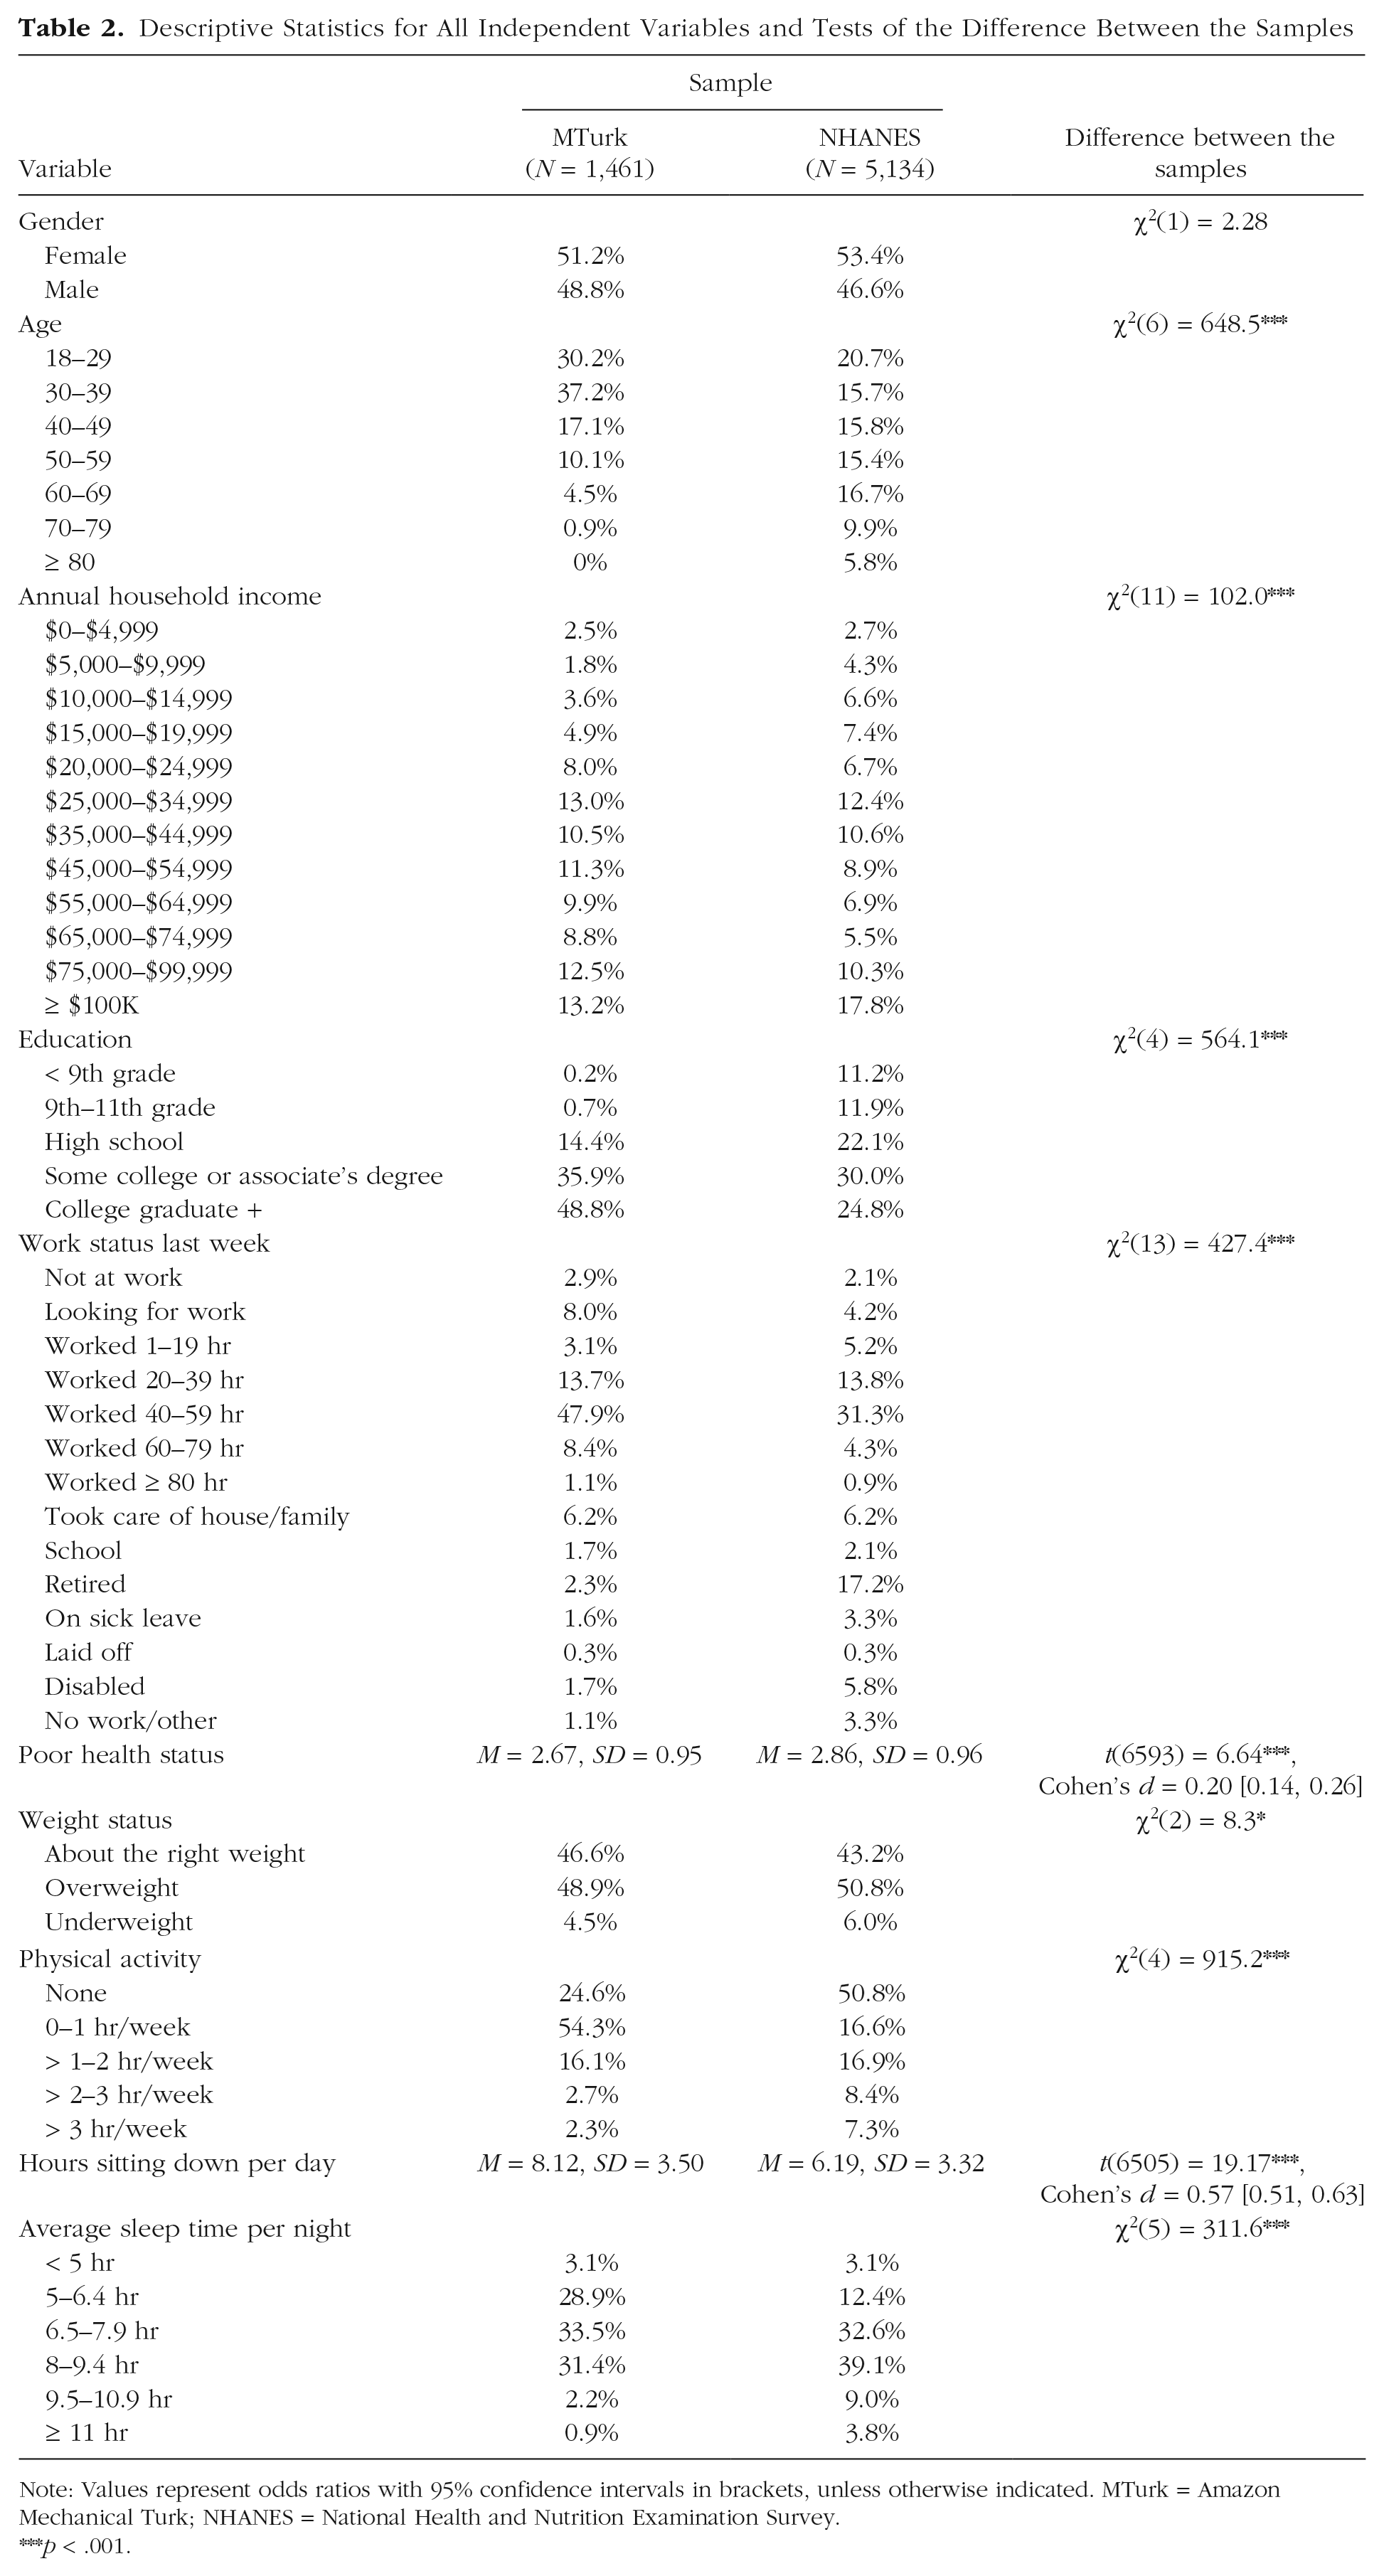
Note: Values represent odds ratios with 95% confidence intervals in brackets, unless otherwise indicated. MTurk = Amazon Mechanical Turk; NHANES = National Health and Nutrition Examination Survey.
p < .001.
Results of the Logistic Regression Models Predicting Major Depression
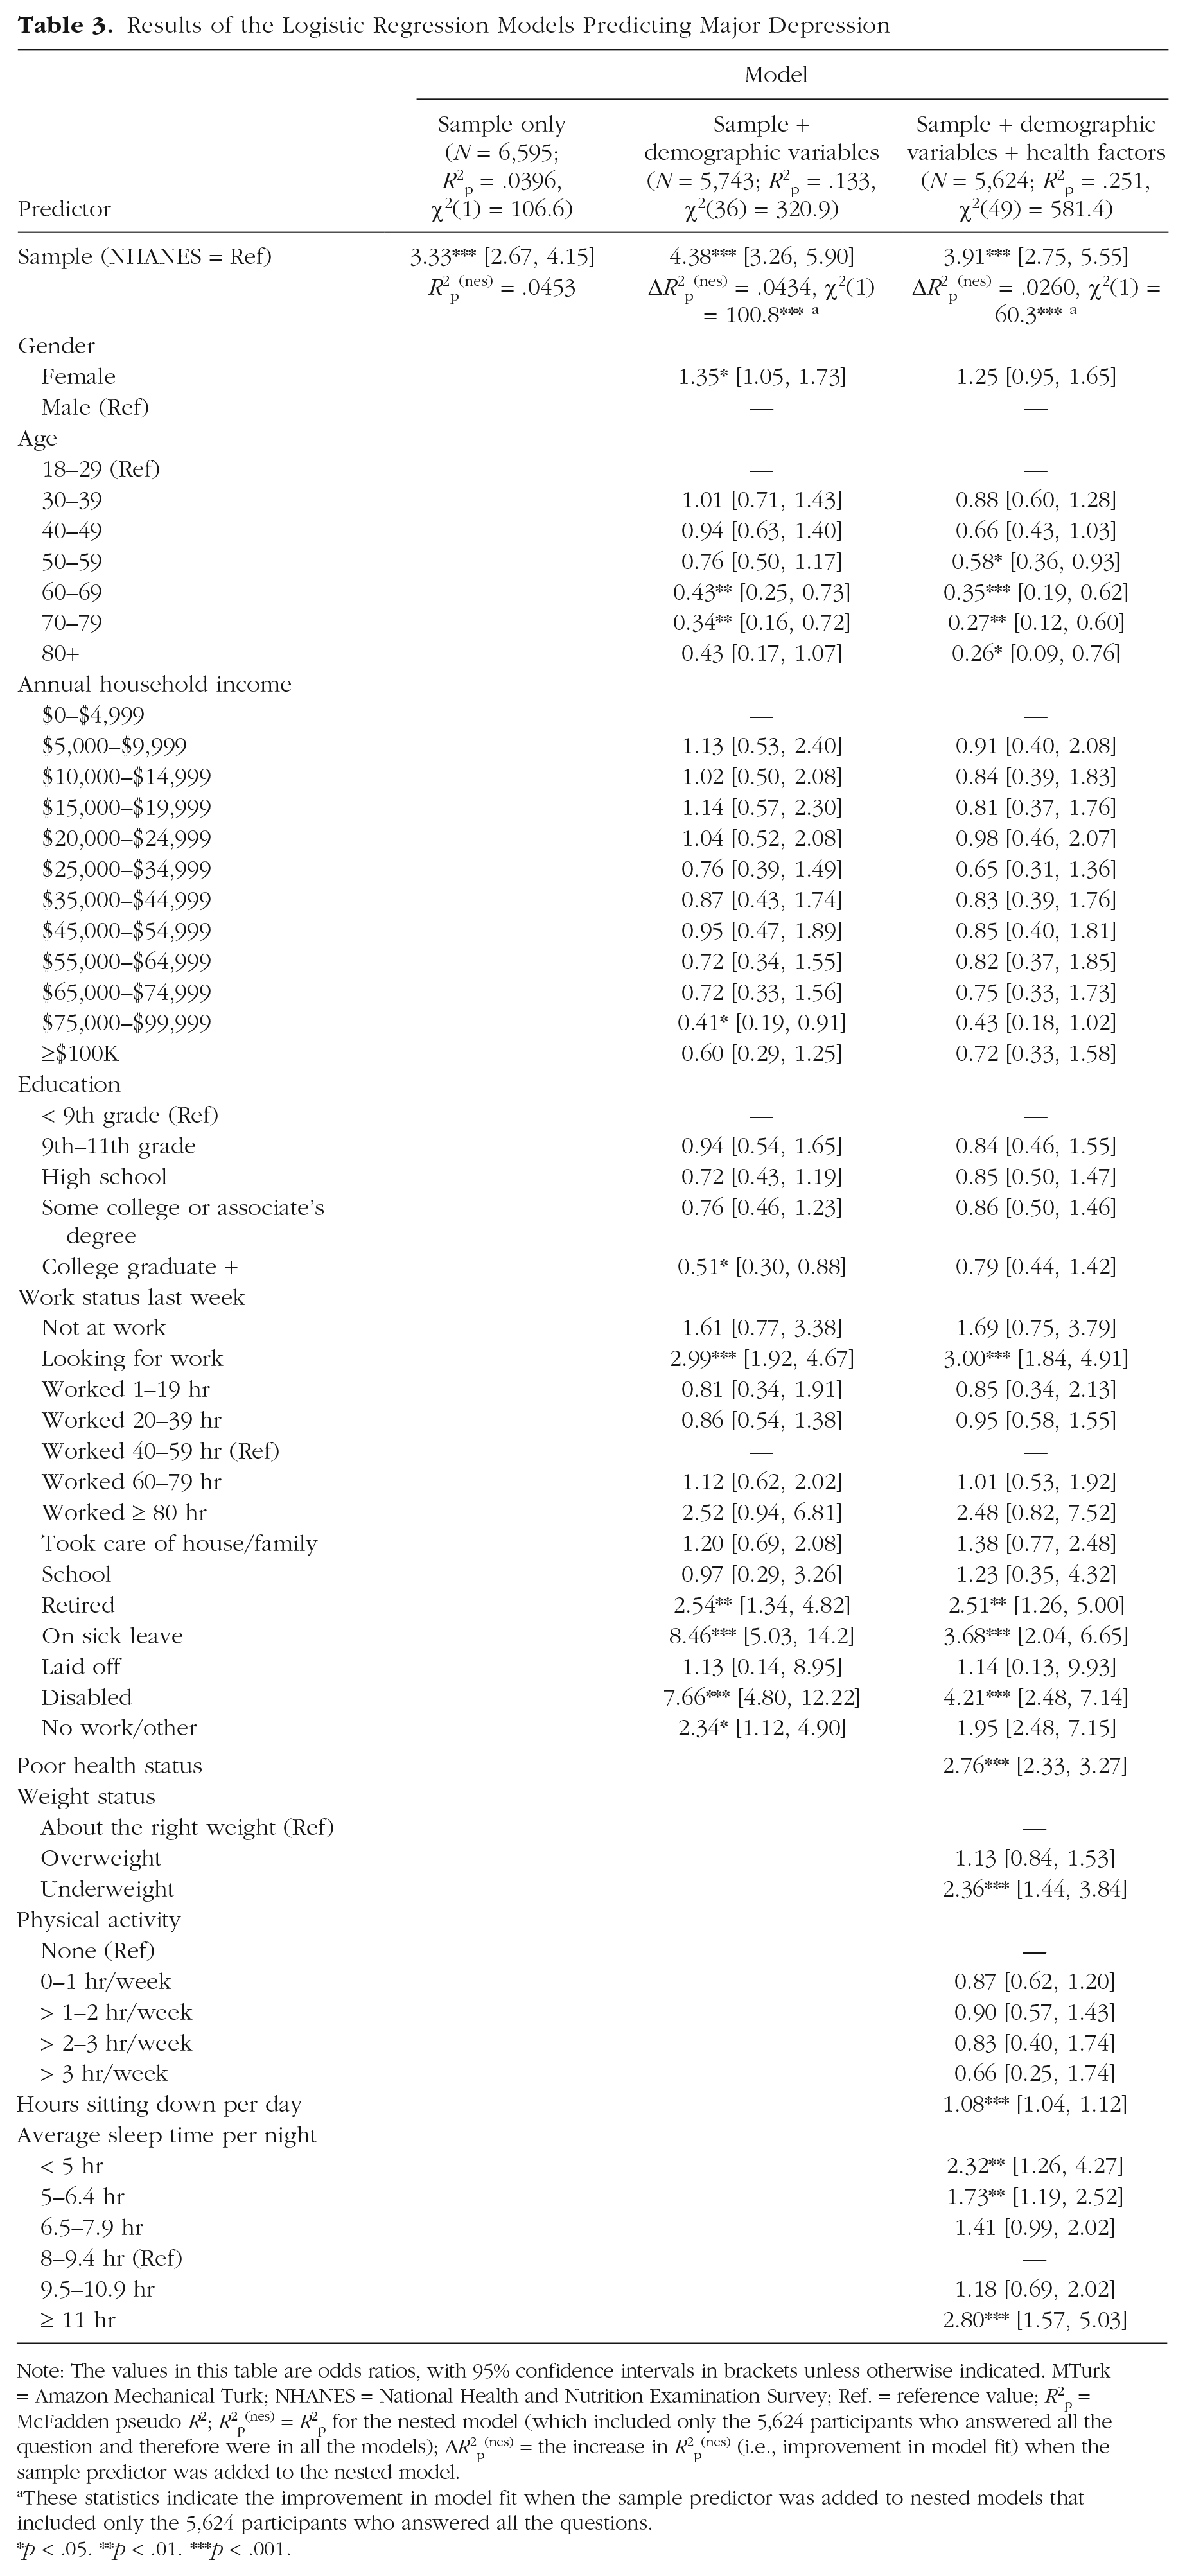
Note: The values in this table are odds ratios, with 95% confidence intervals in brackets unless otherwise indicated. MTurk = Amazon Mechanical Turk; NHANES = National Health and Nutrition Examination Survey; Ref. = reference value; R2p = McFadden pseudo R2; R2p(nes) = R2p for the nested model (which included only the 5,624 participants who answered all the question and therefore were in all the models); ΔR2p(nes) = the increase in R2p(nes) (i.e., improvement in model fit) when the sample predictor was added to the nested model.
These statistics indicate the improvement in model fit when the sample predictor was added to nested models that included only the 5,624 participants who answered all the questions.
p < .05. **p < .01. ***p < .001.
Table 2 presents the frequencies of the independent variables in each sample along with their associations with major depression. The first model, including only the sample group, explained approximately 4% of the variance in PHQ major depression (R2p = .0396).5 Not surprisingly, the stepwise addition of the sociodemographic variables, χ2(36) = 320.9, p < .001, and the health- and lifestyle-related variables, χ2(49) = 581.4, p < .001, improved the prediction of major depression beyond the group effect of the first model. Even so, the group effect (MTurk/NHANES) remained significant in each model. Similar results were obtained using the continuous analyses as well as the different cutoff analysis (any depression), in all of which the group effect remained highly significant.
To compare the level of variance between the samples that is left unexplained after controlling for the sociodemographic and health- and lifestyle-related variables, we calculated the R2p and ΔR2p on nested models (R2p(nes) and ΔR2p(nes), respectively), which includes only the 5,624 participants that are in all three models (i.e., those who answered all the questions). The remaining unexplained variance in the last model (ΔR2p(nes) = .026) suggests that sociodemographic and health- and lifestyle-related differences cannot fully explain the increased prevalence of major depression in MTurk. In Figure 1, we present the extent to which each of the variables explained depression prevalence differences between the two samples as well as the combined contribution per cluster (sociodemographic, physical health, and physical activity). For each variable and cluster, we calculated this contribution by dividing the ΔR2p(nes) of each by the R2p(nes) of the first model (including only the sample variable). For example, because age is negatively correlated with depression (see Table 2) and MTurk participants are on average much younger than those in the NHANES data set, this age difference explains to some extent (16.6%) why MTurk participants score higher on depression. Level of education is also negatively correlated with depression. However, MTurk workers are on average more educated than the NHANES participants, which works against the increased rates of depression on MTurk, hence the negative contribution.
Figure 1 shows that the sociodemographic variables combined explain only about 4% of the difference between samples, and the two physical health indicators combined explain an additional 4%. Indicators of physical activity (physical activity, sleep, and time sitting down during the day), on the other hand, explain more than an additional third of the difference in depression prevalence between samples (i.e., after controlling for the demographic and health variables). Even though the composition of the two samples differed on a range of individual variables that are known to be associated with depression, these variables together explained only 42.7% of the difference in depression prevalence between the MTurk and the NHANES sample. Similar patterns of results were obtained in statistical analyses that aimed to predict alternative different dependent variables instead of major depression: a less severe dichotomous variable (any depression) and a continuous total PHQ-9 scores variable (using OLS and a Tobit model) that measures the severity of the depression (see Table S2).
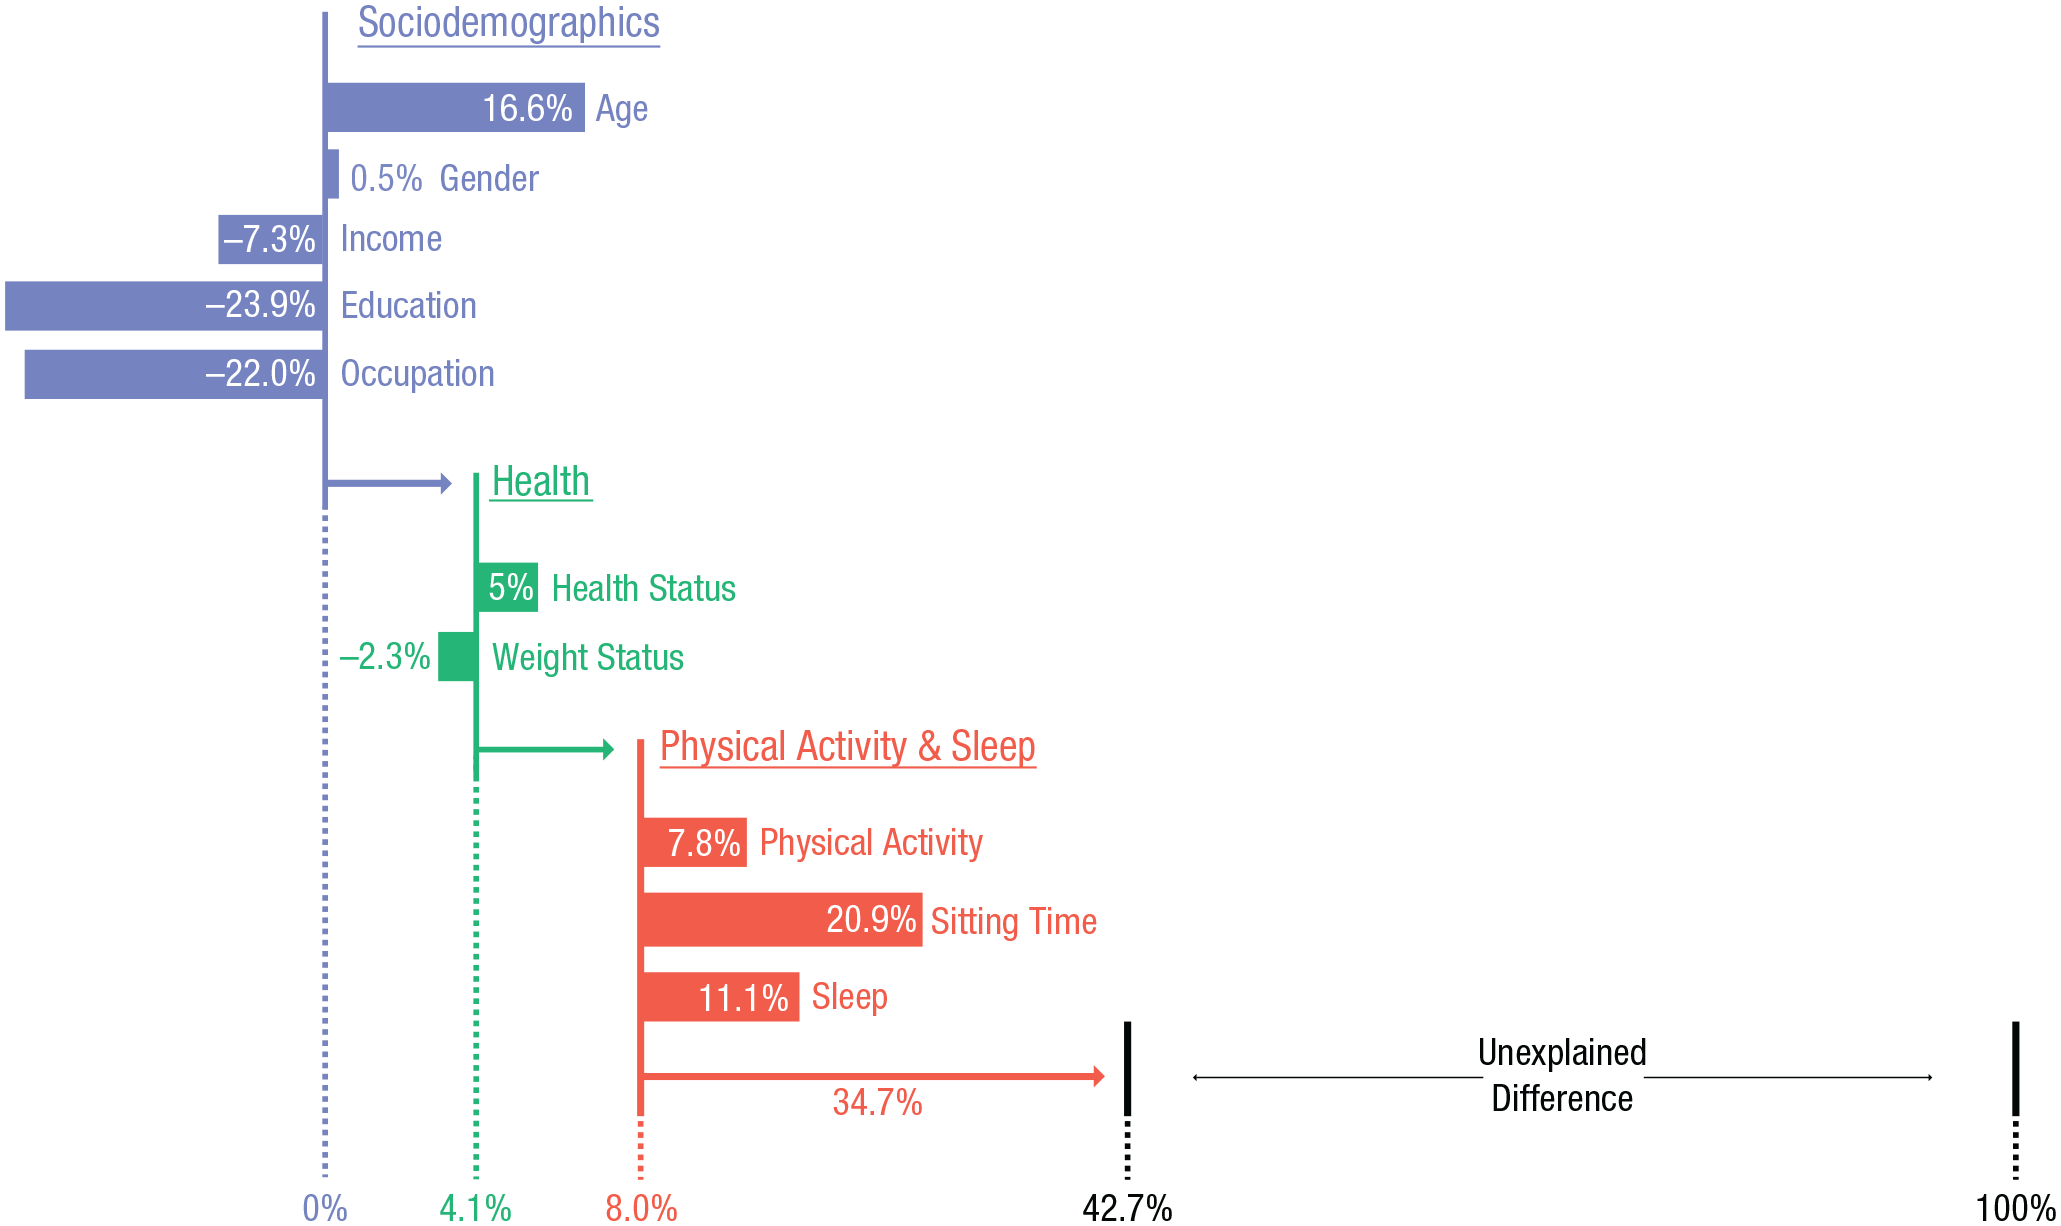
Contribution of each variable to the explained difference in the prevalence of PHQ-9 major depression between the NHANES and MTurk samples. Each horizontal bar represents a specific variable’s ability to explain the observed difference in the prevalence of major depression between the MTurk and NHANES samples. The values are calculated by the change in R2p(nes) that resulted from the inclusion of each variable. A nonzero starting point for the bar implies that all the previous (above) variables are controlled for. PHQ-9 = Patient Health Questionnaire; NHANES = National Health and Nutrition Examination Survey; MTurk = Mechanical Turk.
Psychiatric medications
Altogether, 277 (19%) attentive workers reported that they used prescribed psychiatric medications in the past 30 days. The prevalence of medication use among MTurk workers was as follows: 15.4% used antidepressants, 5.4% used benzodiazepine/anxiolytics, 2.3% used mood stabilizers, 3.0% used stimulants, and 1.3% used antipsychotics; some workers reported more than one type of medication. Not surprisingly, the prevalence of psychiatric medications among MTurk workers was associated with the PHQ-9 depression categories: Use of depression-related medications was 34.4%, 23.9%, and 15.8% for MTurk workers who had major depression, for MTurk workers who had other depressive disorders, and for nondepressed MTurk workers, respectively.
These results were then compared with the NHANES data set that included data on prescribed medication. Whereas only 7.1% of the NHANES participants reported using depression-related medications (i.e., antidepressants and/or mood stabilizers), a total of 15.5% of attentive workers in our sample reported using such medications, χ2(1) = 96.2, p < .001. Furthermore, a logistic regression model showed that the differences in depression-related medication between the two samples remained significant after controlling for sociodemographic and health- and lifestyle-related variables (see Table S2).
Finally, whereas the PHQ-9 scores were affected by the inattentiveness level classification of MTurk workers, reports of depression-related psychiatric medications remained relatively stable throughout the different inattentiveness groups: The prevalence of medication use among attentive, questionable, and inattentive workers was 18.5%, 14.9%, and 24.6%, respectively. A χ2 test revealed that these differences were not significant, χ2(2) = 4.25, p = .119. Thus, self-reported use of depression-related medications seems to be much less vulnerable to bad data threats.
Discussion
As in Study 1, extremely high (bogus) rates of depression were observed among inattentive and suspicious MTurk workers in Study 2, further emphasizing the importance of implementing strict and multiple data-quality-assurance tests. The obtained estimate of major depression among attentive and valid MTurk respondents in this second sample (11%) was statistically identical to that in Study 1, which is still substantially higher than its reported prevalence in the general population (American Psychiatric Association, 2013).
More importantly, a comparison with data from a comprehensive national survey (NHANES; CDC & National Center for Health Statistics, 2018) that used the same screening tool for depression (PHQ-9) showed that compared with the general population (3.6%), major depression is estimated to be three times higher in MTurk. Thus, the difference in depression rates between MTurk and the general population becomes apparent also when the identical screening tool is used. This difference was further validated by a second, alternative indicator of depressive mood disorders that was measured in Study 2: the self-reported use of depression-related medications (7% in the national survey vs. 16% in the MTurk sample). Although medication use is not comparable with measures of depression, it provides another perspective on the workers’ mental state, which may be less susceptible to self-report biases.
Even though the composition of the two samples (MTurk and NHANES) differed on a number of sociodemographic and health- and lifestyle-related characteristics that are known to predict depression (e.g., age, education, poor health, physical activity, hours sitting, and hours sleeping), the analyses reported here showed that these differences explain less than half of the increased prevalence of depression in MTurk. In the next section, we suggest several explanations that could account for the remaining difference in (higher) depression rates in MTurk samples.
General Discussion
There is a growing trend in clinical research to collect data from online crowdsourcing platforms, such as Amazon’s Mechanical Turk. The use of these platforms offers several advantages for the study of clinical populations. However, this trend also raises questions about the reliability of the data collected in these unsupervised conditions and, consequently, about the conclusions that may be drawn from research based on such data sets. In the present work, we addressed these challenges by examining depression rates in MTurk, comparing them with conventional depression rates in the general population, and exploring possible reasons for increased levels of depression in MTurk.
The main contributions of this research are twofold. First, the present work contributes to the literature on clinical research using unsupervised, crowdsourcing data collection platforms, such as MTurk. We developed a procedure to detect suspicious (bots or cyborgs) and inattentive respondents. The multilayered inattentiveness index comprised four different data-quality-assurance methods that are specifically calibrated to Internet-based surveys and skewed clinical assessments. The results of both studies reported here showed a consistent pattern of reverse associations between data quality and depression rates: Increases in data quality (i.e., more attentive and less suspicious users) yielded lower depression rates. The inclusion of inattentive and suspicious MTurk workers artificially increased the prevalence estimates of major depression in both studies to extremely high rates because 26% (Study 1) and 55% (Study 2) of them were found to be meet the PHQ criterion for major depression.
These results confirmed our concern that highly skewed clinical distributions, such as in the case of major depression, are particularly vulnerable to random false responses. According to the findings presented here, fake and inattentive respondents bias the clinical distribution toward the center. Moreover, these workers are not necessarily detected in traditional reliability and convergent validity checks because these also tend to inflate under such conditions (Fong et al., 2010). Even though in this study we specifically focused on depression, our findings on the effects of failing to screen for inattentive and suspicious respondents are relevant for any crowdsourcing-based clinical research on psychopathologies whose distributions are highly skewed by definition. We recommend a critical reappraisal of research reporting on extremely high rates of other mental-health conditions in MTurk (or other crowdsourcing platforms) to examine whether reported estimates on pathologies such as social anxiety (Arditte et al., 2016) may prove to have been artificially inflated as well.
Second, the findings presented here contribute to the current debate concerning differences between depression rates in MTurk and the general population. As described in the introduction, the findings from previous studies have been equivocal (Arditte et al., 2016; McCredie & Morey, 2019; Shapiro et al., 2013; Walters et al., 2018). On the basis of the findings presented here, it is likely that a portion of the higher depression rates reported in previous MTurk studies should be attributed to insufficient data-quality-assurance procedures. In the current work, we implemented a number of methodological improvements to arrive at a more reliable estimate of depression in MTurk. Two large samples were included (reaching about 5,000 MTurk workers altogether), and we used a common and validated screening tool for depression (El-Den et al., 2018) to compare findings with those of a national survey (NHANES) that used the exact same screening tool (PHQ-9). Finally, a rigorous, multilayered data-quality-assurance procedure was implemented. The results of this research, including the replication of the findings, the comparison with the national representative database, and the comparison of depression-related, psychiatric medications, suggest that actual depression rates in MTurk are still higher compared with estimates based on representative, comprehensive surveys of the general population.
In addition to these methodological improvements, we empirically explored several plausible reasons behind the actual, increased MTurk depression rates. A comparison with data from the NHANES showed that the composition of the MTurk-based sample differed on a number of individual variables that are known to be associated with depression, such as education, age, income, occupation, physical health, and physical activity. Together, these differences in individual background variables explained almost half of the difference in depression rates. In particular, the physical activity lifestyle variables (hours of sleep, amount of physical activity, and hours sitting in a day) accounted for a substantive amount of this difference (37%). Yet more than half of the difference in depression rates between the MTurk and the representative NHANES could not be attributed to such individual differences in group composition. In addition, the comparison with the NHANES data set also shows that higher depression rates cannot be attributed only to the particular screening tool that was used in the current work (the PHQ-9). Importantly, the significance of the difference between the samples (after controlling for all other variables) is robust to the two cutoff points for depression (major depression and any depression), the continuous variable (using OLS and Tobit models to predict total PHQ-9 scores), and the less explicit proxy for depression (depression-related medications). Taken together, these findings then suggest that further research is needed to explore additional reasons that could explain the remaining difference in higher depression rates in MTurk.
We speculate here on three possible explanations for the increased prevalence of depression in MTurk. The first explanation continues the aforementioned rationale and suggests that working in MTurk attracts particular groups of individuals that are already more vulnerable and more prone to suffer from depression. It is possible that paid participation in online research panels from one’s own home draws a particular subgroup of individuals that already suffer from depression. They may also differ on depression-relevant characteristics in addition to the aforementioned demographic and health- and physical activity-related variables. One such subgroup may be individuals who suffer from social anxiety, which is a dominant risk factor for major depression (odds ratio = 2.9; Kessler, Stang, Wittchen, Stein, & Walters, 1999) and often precedes the onset of the depressive episode (Beesdo et al., 2007). Previous studies reported that approximately 50% of MTurk users suffer from clinical levels of social anxiety (Arditte et al., 2016; Shapiro et al., 2013). In contrast, the 12-month prevalence estimates in the general population are around 7% to 8% (American Psychiatric Association, 2013; Connor, Kobak, Churchill, Katzelnick, & Davidson, 2001). Social anxiety has been found to be associated with preferences of computer-mediated over face-to-face interactions (Lee & Stapinski, 2012; Prizant-Passal, Shechner, and Aderka, 2016). Likewise, there is evidence that introverted individuals who struggle with social relationships are using cyberspace as a ”social substitute” (Amichai-Hamburger & Barak, 2009; Ophir, 2017). MTurk allows workers from all sociodemographic strata to work from their homes without having to confront and navigate the external social world, and this type of work may therefore attract individuals who suffer from social anxiety.
A second, more provocative possibility is that excessive use of MTurk triggers depressive feelings. Although direct associations between depression and screen time are questionable (Ophir, Lipshits-Braziler, & Rosenberg, 2019), some researchers warn that new-media screen time might increase depressive symptoms (Twenge, Joiner, Rogers, and Martin, 2018). Likewise, in a recent systematic review, Elhai, Dvorak, Levine, and Hall (2017) reported that problematic smartphone use is consistently associated with depressive symptoms (Elhai et al., 2017). In contrast to other screen activities that are more social in nature (e.g., Facebook), the work at MTurk typically does not include social interactions. It is possible that individuals who work for online data collection forums for extended periods during a day are at increased risk of developing feelings of loneliness, which is a well-documented risk factor for developing depressive symptoms (Cacioppo et al., 2006). Moreover, MTurk workers typically do not receive feedback regarding the impact or the consequences of their work, which can lead to a sense of purposelessness. Worryingly, this type of work might impair subjective experiences of leading a meaningful life and cause a reduction in a person’s overall well-being (Zika & Chamberlain, 1992).
Finally, an even more provocative explanation for the observed high depression rates in MTurk is that the existing DSM-based estimates of depression are in fact underestimates and that the actual depression rate in the general population is higher and closer to the MTurk-based figures. Anonymous, computer-mediated administration of depression screening tools may enable more honest response patterns. Despite growing awareness about mental illnesses such as depression, they are still strongly associated with a negative stigma (Menke & Flynn, 2009). The stigma could inhibit depressed individuals from sharing personal information in face-to-face interactions (de Leeuw, 1992; Tourangeau & Yan, 2007), which is the standard method of data collection in the NHANES. Sharing personal information about mental conditions or psychiatric medications may prove to be easier in anonymous, online surveys (the so-called disinhibition effect of computer-mediated communication), especially when there is no expectation of follow-up interactions. In addition, in a personal interview setup, the physical presence of the interviewer may (temporarily) alleviate negative feelings, which could temper responses on the depression assessment tools administered.
Even though the current work cannot provide any decisive answers on these issues, these potential explanations should nevertheless be considered. Future studies are recommended, preferably with similar procedures to the current research to determine which of these hypotheses explains better the obtained increased prevalence of depression.
Limitations of the current research
We highlight several limitations of the present research. First, because of the large scale of the present work and the strict data-collection-anonymity policy enforced by MTurk, we relied on a self-report scale to assess depression. Even though the use of self-report assessment tools is commonplace in large-scale mental-health surveys (e.g., U.S. Centers for Disease Control and Prevention, 2018), we acknowledge that they cannot replace formal diagnoses of major depressive disorder that are determined by trained mental-health professionals in face-to-face, clinical interviews. This difference in diagnoses is partially because different self-report questionnaires may result in different clusters of symptoms (Fried, 2017) and fail to encompass the heterogenic psychosocial nature of depression (Fried & Nesse, 2015).
To address these concerns to the best of our ability given the aforementioned constraints of large-scale, MTurk-based studies, we chose the PHQ-9 as the preferred self-report survey. In contrast to other self-report depression scales, the PHQ-9 items correspond directly with the DSM criteria for major depressive disorder. Major depression was determined using a cutoff point that has been validated psychometrically and deemed a good proxy of major depression. A large study that tested several self-report depression scales found that compared with the gold standard criterion of the Structured Clinical Interview for DSM, the sensitivity and specificity of the PHQ-9 cutoff point for major depressive disorder were 98% and 78%, respectively (Löwe et al., 2004). Löwe et al. (2004) demonstrated the superiority of the PHQ-9 over two other self-report scales and therefore recommended its use in clinical research. Another, more recent, systematic review of the available screening tools for depression showed that between 1995 and 2015, the PHQ-9 was the most common and most often validated screening tool for depressive disorders (El-Den et al., 2018). In sum, the PHQ-9 was the choice of self-reported screening tool for depression because of its well-established validity, sensitivity, and specificity compared with other screening tools for which less evaluative information is available.
Furthermore, in Study 2, we conducted a direct comparison between PHQ-9 scores in MTurk and PHQ-9 scores in the general population (U.S. Centers for Disease Control and Prevention, 2018). This comparison, which included multiple statistical controls of confounding variables, supports the claim that the higher rates of depression in MTurk are unlikely to have resulted from differences in the screening tools that were used.
A second limitation of the present work is the lack of information on the ethnical or racial background of the MTurk workers. Previous surveys on depression suggest that rates of depression differ by race-ethnicity (Riolo, Nguyen, Greden, & King, 2005). Although this study controlled for multiple variables that relate to depression, future studies should examine and control for race-ethnicity as well.
A third limitation derives from our focus on one particular crowdsourcing platform. It is uncertain whether the obtained results are confined to MTurk specifically or whether they are characteristic of crowdsourcing platforms in general. Yet the findings from the present research highlight the vulnerability of highly skewed clinical distributions (e.g., depression) to false or bad data. We therefore expect that similar trends will be found in research that collects from other crowdsourcing platforms and/or focuses on other psychopathologies.
Practical implications for research
In addition to the above discussion, we highlight three practically oriented implications that arise from the present work. Knowledge about increased depression prevalence in MTurk is not only relevant for clinical researchers but may also have implications for MTurk-based research in general. Depression affects many aspects of human experiences, including emotions, cognitions, and daily choices (Greenberg, Vazquez, & Alloy, 1988). Depression is characterized by cognitive distortions and irrational negative beliefs about the self as well as about life in general (Beck, 1967). Depressed individuals tend to perceive the outside world in depressive colors and engage in excessive rumination about negative experiences and past events (Nolen-Hoeksema, Wisco, & Lyubomirsky, 2008). This ruminative-thinking pattern might bias the way they interpret ambiguous information (Mor, Hertel, Ngo, Shachar, & Redak, 2014) and bias their treatment choices (Ophir & Mor, 2014). From a methodological point of view, these depression-specific characteristics may affect how research participants would act and respond to particular cues, surveys, and activities presented to them. In such cases, unusual high rates of depression could therefore pose a threat to the generalizability of empirical findings from MTurk-based data.
Second, the current research produced a concrete contribution for researchers who collect data using MTurk and similar crowdsourcing platforms. The methodological procedures that were described and applied in the two studies reported here provide specific and detailed data quality measures that can help researchers overcome the obstacles inherent to these platforms and ensure the quality of the unsupervised self-report data collection.
Finally, from a research participant recruitment viewpoint, increased depression rates among MTurk workers (major depression = 11%–13%, any depression = 21%) may also be considered an advantage for clinical researchers who are specifically interested in psychopathologies such as depression and anxiety. Recruitment of clinical subjects is a major challenge in psychopathology research. Even depression, which is considered a rather common mental condition, is still relatively rare in random samples recruited from the general population (Katon & Ciechanowski, 2002), and using MTurk can facilitate recruitment efforts and provide researchers with easy access to peripheral populations. However, and as mentioned in detail above, it is imperative that strict data-quality-assurance tests are implemented to ensure the reliability of research results and avoid artificially inflated depression rates.
Supplemental Material
Ophir_Open_Practices_Disclosure – Supplemental material for The Turker Blues: Hidden Factors Behind Increased Depression Rates Among Amazon’s Mechanical Turkers
Supplemental material, Ophir_Open_Practices_Disclosure for The Turker Blues: Hidden Factors Behind Increased Depression Rates Among Amazon’s Mechanical Turkers by Yaakov Ophir, Itay Sisso, Christa S. C. Asterhan, Refael Tikochinski and Roi Reichart in Clinical Psychological Science
Supplemental Material
Ophir_Supplemental_Material – Supplemental material for The Turker Blues: Hidden Factors Behind Increased Depression Rates Among Amazon’s Mechanical Turkers
Supplemental material, Ophir_Supplemental_Material for The Turker Blues: Hidden Factors Behind Increased Depression Rates Among Amazon’s Mechanical Turkers by Yaakov Ophir, Itay Sisso, Christa S. C. Asterhan, Refael Tikochinski and Roi Reichart in Clinical Psychological Science
Footnotes
Action Editor
Kelly L. Klump served as action editor for this article.
Author Contributions
Y. Ophir and I. Sisso developed the study concept. All of the authors contributed to the study design. Test battery development and data collection were performed by I. Sisso and Y. Ophir. I. Sisso performed the data analyses with help from Y. Ophir. Y. Ophir drafted the manuscript, and C. S. C. Asterhan, I. Sisso, and R. Reichart provided critical revisions. The research was conducted under the supervision of C. S. C. Asterhan and R. Reichart. Y. Ophir and It. Sisso contributed equally to this research. All of the authors approved the final manuscript for submission.
Declaration of Conflicting Interests
The author(s) declared that there were no conflicts of interest with respect to the authorship or the publication of this article.
Funding
The research presented here was conducted with the financial support of the Israeli Innovation Authority in the Ministry of Economy (“Kamin” Grants 60561 and 60560).
Open Practices
All data and materials have been made publicly available via Open Science Framework and can be accessed at https://osf.io/u8ctz. The complete Open Practices Disclosure for this article can be found at https://journals-sagepub-com.web.bisu.edu.cn/doi/suppl/10.1177/2167702619865973. This article has received badges for Open Data and Open Materials. More information about the Open Practices badges can be found at ![]() .
.
Notes
References
Supplementary Material
Please find the following supplemental material available below.
For Open Access articles published under a Creative Commons License, all supplemental material carries the same license as the article it is associated with.
For non-Open Access articles published, all supplemental material carries a non-exclusive license, and permission requests for re-use of supplemental material or any part of supplemental material shall be sent directly to the copyright owner as specified in the copyright notice associated with the article.