
Abstract
Historically, researchers have proposed higher-order factors to explicate the structure of psychopathology, including Externalizing, Internalizing, Fear, Distress, Thought Disorder, and a general factor. Despite extensive research in this domain, the underlying structure of psychopathology remains unresolved. Here, we examine several issues in adjudicating among structural models of psychopathology. Using simulations and analyses of the extant literature, we contrast the model-based reliability of alternative structural models of psychopathology and highlight shortcomings of conventional model-fit indices for such adjudication. We propose alternative criteria for evaluating and contrasting competing structural models, including various model characteristics (e.g., the magnitude and consistency of factor loadings and their precision), the consistency and sensitivity of factors to their constituent indicators, and the variance explained in and patterns of associations with relevant variables. Using these criteria as adjuncts to conventional fit indices should become standard practice and will greatly facilitate adjudication among alternative structural models of psychopathology.
Multiple attempts have been made to classify psychopathology and to grapple with the observation that individual disorders are overlapping, a phenomenon referred to as comorbidity (Feinstein, 1970). The prototypical way of studying comorbidity from the 1980s to the 2000s was to examine the overlap among discrete diagnoses, often two at a time. Examples of this include major depressive disorder and generalized anxiety disorder (Fava et al., 2000; Kessler et al., 2008) and attention-deficit/hyperactivity disorder (ADHD) with oppositional defiant disorder (ODD) and conduct disorder (Biederman et al., 1991).
Apropos of this special section and the place of this article therein, some of Scott Lilienfeld’s earliest publications reflected his burgeoning interests in the classification of psychopathology and comorbidity (Lilienfeld, 1992; Lilienfeld et al., 1986; Lilienfeld & Waldman, 1990). For his comprehensive exam paper at the University of Minnesota, Lilienfeld reviewed the evidence across multiple domains—studies of classification and diagnostic overlap, course and outcome, familiality and available behavior genetic studies, and psychophysiological correlates—for the validity of the “Saint Louis quartet,” a set of conditions that included psychopathy, antisocial behavior, somatization, and histrionic personality disorder. Later, while on his clinical internship at Western Psychiatric Institute and Clinic in Pittsburgh, Pennsylvania, Scott published the first article on which he was lead author, which examined the relation of histrionic personality disorder to antisocial personality and somatization disorders (Lilienfeld et al., 1986). This article proved to be a harbinger of Scott’s interests in comorbidity and classification of psychopathology, which were reflected in many subsequent publications. These included a review and integration of theoretical models of the association between antisocial personality and somatization disorders (Lilienfeld, 1992) and a comprehensive review of the overlap between ADHD in childhood and later aggression and antisocial behavior (Lilienfeld & Waldman, 1990), as well as a subsequent publication on the overlap and distinctions between ADHD and ODD (Waldman & Lilienfeld, 1991). Scott’s work in this domain also included critiques of the concept and use of the term comorbidity (Lilienfeld et al., 1994; Lilienfeld & Waldman, 2004) and proposed extensions of the study of comorbidity and classification using various types of latent-variable models (Waldman & Lilienfeld, 2001; Waldman et al., 1995). Indeed, a snippet of the abstract of one of these articles (Lilienfeld et al., 1994) seems rather prescient in hindsight, as it stated that most uses of the term comorbidity
blur the distinction between latent constructs and manifest indicators . . . The authors conclude that . . . application of the term comorbidity to psychopathological syndromes encourages the premature reification of diagnostic entities and arguably has led to more confusion than clarification. (p. 71)
Paralleling Scott’s work, the historical use of comorbidity was supplanted by transdiagnostic approaches to the classification of psychopathology beginning in the 1990s and continues today. In a transdiagnostic approach, the overlap among disorders or covariation among symptom dimensions is often captured by one or more latent dimensions. Transdiagnostic approaches recognize the fact that multiple disorders share common risk factors and correlates, show common course and outcomes, and may be ameliorated by the same treatments (Barlow, Farchione, Bullis, et al., 2017; Barlow, Farchione, Sauer-Zavala, et al., 2017). Canonical contributions to this approach include characterizing the overlap among children’s symptoms using Externalizing and Internalizing dimensions (Achenbach, 1966) and among common adult psychiatric diagnoses using Externalizing, Distress, and Fear dimensions (Krueger, 1999).
More recently, there has been a shift from a transdiagnostic approach to what might be termed a transdimensional approach in contemporary studies of psychopathology. The transdimensional approach differs from the transdiagnostic approach in that higher-order dimensions explain covariation among lower-order dimensions. This approach can be conceptualized as a hierarchical structure in which latent dimensions are further classified as sharing a higher-order dimension because of their substantial covariance. Examples of this approach include Distress and Fear dimensions loading on a higher-order Internalizing factor (Krueger, 1999); Antagonistic and Disinhibited Antisocial Behavior loading on a higher-order Externalizing factor (Burt, 2009, 2012; Kotov et al., 2017, 2021; Lahey et al., 2017a); and various diagnoses, symptom dimensions, or symptoms loading on a general psychopathology factor, often termed the “p” factor (Caspi et al., 2014; Caspi & Moffitt, 2018; Lahey et al., 2012, 2017a). In a transdimensional approach, the focus shifts from attempting to find common correlates of and risk factors for multiple diagnoses to finding such correlates and putative causes of multiple higher-order dimensions (e.g., Lee et al., 2021; Neumann et al., 2016; Riglin et al., 2020). Transdimensional approaches may also better avoid the content overlap between different disorders and the heterogeneity within diagnoses. The general factor of psychopathology has received particular attention as a transdimensional construct in the contemporary psychopathology literature over the past decade, as witnessed by the many studies that have used it to model the covariation among psychopathology dimensions (e.g., Caspi et al., 2014; Caspi & Moffitt, 2018; Lahey et al., 2012, 2017a, 2017b).
The transdimensional approach has been advocated and considerably facilitated by the Hierarchical Taxonomy of Psychopathology (HiTOP) Consortium and overarching comprehensive model (DeYoung et al., 2022; Kotov et al., 2017, 2021), which characterizes psychopathology dimensionally rather than categorically and is hierarchical in the sense that psychopathology is organized using a set of dimensions of increasing generality and comprehensiveness. The overarching HiTOP model is intended to reduce the heterogeneity within and comorbidity among diagnostic categories, and its components are intended to be construed as testable hypotheses that are subject to falsification and revision (DeYoung et al., 2022; Kotov et al., 2021; Krueger et al., 2018). Given its comprehensive overarching nature, the HiTOP model can best be viewed as a framework that subsumes most extant structural models of psychopathology that have been supported by a preponderance of evidence.
A number of structural representations of psychopathology have also been advanced in the literature. Examples include a two-factor model comprising correlated Externalizing and Internalizing dimensions; a three-factor model distinguishing Distress from Fear within Internalizing; models including Thought Disorder and Neurodevelopmental Disorders factors; and models that include a general psychopathology factor that influences diagnoses, symptom dimensions, or individual symptoms (hereafter referred to as indicators). Despite these different approaches and a multitude of studies, there is only partial consensus on the underlying structure of psychopathology. Researchers studying the structure of psychopathology tend to emphasize substantive differences among alternative models (e.g., distinguishing Distress from Fear within Internalizing, uneven coverage of psychopathology across studies) while failing to consider methodological issues (e.g., overfitting, bias in tests of certain models) that can spuriously favor one model over alternatives. As an example, the general factor of psychopathology and the bifactor model from which it typically emerges have shown a sharp rise in usage and popularity among psychopathology researchers (Bornovalova et al., 2020; Greene et al., 2019; Levin-Aspenson et al., 2021; Smith et al., 2020). Nonetheless, statisticians have pointed out difficulties in distinguishing between bifactor and both correlated-factors and higher-order models that include a general factor (Gignac, 2008; Markon, 2019; Mulaik & Quartetti, 1997; Yung et al., 1999), as well as the tendency for common statistical fit indices to be biased in favor of the bifactor model (Bonifay & Cai, 2017; Bonifay et al., 2017; Greene et al., 2019; Murray & Johnson, 2013). Also, although statisticians have emphasized the utility of simulation studies for elucidating various issues and biases in differentiating among alternative structural models of psychopathology, simulations remain underused (cf. Greene et al., 2019). Given concerns with the overreliance on fit indices, model-based reliability indices (e.g., H, ω H ) for adjudicating among structural models of psychopathology and evaluating their factors’ reliability have recently been proposed (Bornovalova et al., 2020; Forbes, Greene, et al., 2021; Martel et al., 2017; Rodriguez et al., 2016; Waldman, 2017; Watts et al., 2019).
The Current Study
Our goal in this article is to elucidate a set of concerns and issues with current methods for adjudicating among structural models of psychopathology and to propose solutions and alternative criteria for adjudicating among such models. These concerns and issues include the following: (a) Conventional fit indices are useful for comparing some models but not others, (b) model-based reliability indices have both advantages and disadvantages for adjudicating among competing alternative models, (c) the consistency of factor loadings varies across models and can be a useful index of model validity, (d) factors are quite sensitive to their constituent indicators in some models but not others, (e) differences in the pattern and magnitude of associations with relevant criterion variables can help in adjudicating among models, and (f) psychopathology researchers need a greater awareness of statistically distinguishable versus indistinguishable models. These concerns and issues are illustrated using simulations and analyses of the results from extant studies. We propose several alternative criteria for evaluating and contrasting competing structural models, including various model characteristics (e.g., the magnitude and consistency of factor loadings and their precision), the sensitivity of factors to their constituent indicators and the consistency of factor loadings across models, and the percentage of variance explained in and patterns of associations with relevant criterion variables.
Method
None of the analyses reported in this article were preregistered. Supplementary text, figures, and tables, as well as the Mplus, R, and SPSS code used in analyses, can be found in the Supplemental Material available online. We report all data inclusion and exclusion procedures, all manipulations, and all measures used. Given that this study involved analyses of existing data rather than new data collection, we did not determine sample sizes, as these were determined by the authors of the original studies reanalyzed here. In addition, we report details and results of all simulations we conducted as part of the work presented here. All of the studies that contributed data to the analyses reported here received approval from the institutional review boards at the authors’ home institutions.
Samples and procedures
To better characterize current practices in the literature and to illustrate our concerns with concrete examples, we conducted a set of simulations and real-data analyses to address the specific concerns and issues raised above. First, we conducted a set of simulations of confirmatory factor analyses (CFAs) using Mplus (Version 7.4; Muthén & Muthén, 2012) to examine issues of overfitting and bias in commonly used fit indices. These simulations extend previous work on overfitting and fitness propensity (Bonifay & Cai, 2017; Preacher, 2006) and simulations previously used to examine bias in models of psychopathology (Greene et al., 2019). We used the factor loadings and factor correlations from the three-correlated-factors model (the best-fitting model) and the modified bifactor model with three correlated factors from Watts et al. (2019) as the true parameter values in the two simulations conducted. To address issues of overfitting, we examined indices of model fit (root-mean-square error of approximation [RMSEA] and standardized root-mean-square residual [SRMR]; see Figs. S2a and S2b in the Supplemental Material for the Bayesian information criterion [BIC]), as well as the percentage of the replications that did not converge for each of the alternative models. We present results for a sample size of 10,000 using 10,000 replications and fitted the following alternative models: (a) three correlated factors, (b) two correlated factors, (c) one general factor, (d) bifactor model with three orthogonal factors, (e) bifactor model with two orthogonal factors, (f) modified bifactor model with three correlated factors, and (g) modified bifactor model with two correlated factors. Conventional statistical fit indices (i.e., RMSEA, SRMR, and BIC) and their variability were estimated across the replications. The Mplus scripts used to conduct these simulations are presented in the Supplemental Material.
Second, to address many of the issues listed above that we raise about the structure of psychopathology literature broadly, we conducted analyses of 100 studies that are representative of the extant literature in this domain (these studies are listed in a separate References section in the Supplemental Material). We conducted a systematic search for empirical studies and adhered to the Preferred Reporting Items for Systematic Reviews and Meta-Analyses (PRISMA) guidelines for reporting search procedures and study methods. A PRISMA flowchart for study inclusion/exclusion is shown in Figure S1 in the Supplemental Material. Studies were included in this review if they consisted of original empirical research that characterized psychopathology broadly and if they tested and presented at least one latent factor model of psychopathology. Studies were excluded if they did not test a structural model of psychopathology or if they modeled only a narrow facet of psychopathology (e.g., only various dimensions of anxiety disorders). To be included in our analyses of CFA models, studies had to have conducted one or more CFAs. We used the following keywords entered into Google Scholar via the Publish or Perish software (Harzing, 2016): “psychopathology factor structure dimension” or “bifactor” or “p factor” or “general factor” or “specific factor” or “correlated factors” or “hierarchical.” Literature reviews and reference sections of the identified articles were examined for relevant articles that were missed in the original search. In addition, the Google Scholar “cited by” function was used to search for relevant articles citing the studies already found. Two graduate students independently screened and read the identified studies, recording data on each study’s methodology and results in a spreadsheet. Titles and abstracts of the studies were reviewed, and studies were included or excluded on the basis of the eligibility criteria mentioned above. If there was ambiguity about a study meeting the inclusion criteria after this step, the students and the first author together reviewed the article. If they determined by consensus that an article did not model psychopathology broadly or use CFA, it was excluded from analyses. All data collected from these studies are described in the Supplemental Material. The following data were used in analyses: (a) year of publication, (b) number of models tested, (c) types of models tested (e.g., bifactor, correlated factors), (d) best-fitting model type, (e) ad hoc model features (e.g., correlation among the specific [i.e., group] factors in a bifactor model, correlated residuals), (f) concerning results (e.g., negative residual variances), (g) number of indicators used per factor, (h) factor loadings and correlations and their standard errors reported for best and alternative models, (i) correlations with external criteria reported for one or more models, and (j) types of specific factors tested in bifactor models.
Third, for some of the analyses, we relied heavily on two large, sociodemographically diverse, population-representative twin studies included in the 100 studies for which we had additional data. These were the Tennessee Twin Study (TTS; Lahey et al., 2011; Waldman et al., 2016), which includes 3,136 twins between the ages of 9 and 17 (49% male; 71% non-Hispanic European American ethnicity, 24% African American ethnicity, and 5% mixed or other ethnicity), and the Georgia Twin Study (GTS; Singh & Waldman, 2010; Watts et al., 2019), which includes 2,498 twins and their siblings between the ages of 5 and 18 (49% male; 82% non-Hispanic European American ethnicity, 11% African American ethnicity, and 7% mixed or other ethnicity). Family income for TTS and GTS participants at recruitment ranged from $0 to $150,000 (TTS: M = $58,633, SD = $43,086; GTS: M = $53,000, SD = $28,500). In the TTS, psychopathology was based on diagnostic interviews of both caretakers and youth using the Child and Adolescent Psychopathology Scale, whereas in the GTS, psychopathology was based on parent ratings on the Emory Combined Rating Scale (Waldman et al., 1998), a parent-report questionnaire assessing symptoms of the major Diagnostic and Statistical Manual of Mental Disorders (DSM) childhood psychiatric disorders (American Psychiatric Association, 2013). Further information on the participants and psychopathology measures included are presented in representative publications from these studies (Lahey et al., 2011; Singh & Waldman, 2010; Waldman et al., 2016; Watts et al., 2019).
Data analyses
For the simulations in our first set of analyses, we conducted a set of CFAs based on the results of a prior study (Watts et al., 2019), in which alternative structural models of psychopathology were contrasted using CFA. As stated above, for the true parameter values in the simulations, we used the factor loadings, factor correlations, and residual variances from the best-fitting model (the three-correlated-factors model) as well as from the alternative modified bifactor model with three correlated specific factors. We used maximum likelihood estimation and recorded the number of nonconvergences and fit indices (RMSEA, SRMR, and BIC) and their 95% confidence intervals (CIs) across the 10,000 replications.
For the analyses of real data in our second and third sets of analyses, we relied primarily on several types of general linear models, including t tests, Pearson correlations, simple and multiple regression analyses, and one-way and multifactor analyses of variance. Effect sizes and their 95% CIs for H and the median, standard deviation, and standard errors of standardized factor loadings were presented alongside all statistical tests. In addition, for the third set of analyses, we conducted a set of additional CFAs over and above those conducted in the original publication (Waldman et al., 2016), in which we repeated the CFAs conducted in the original publication but removed one indicator at a time from the general and specific factors and correlated factors in order to examine the sensitivity of the factors to inclusion or exclusion of each of their indicators. We also conducted a parallel set of exploratory structural equation models (ESEMs), each containing three factors, that estimated models that included three correlated factors, three orthogonal factors, or one general plus two correlated specific factors. We used a robust maximum likelihood estimator to account for nonnormality and clustering of samples and either geomin, bi-geomin, or geomin (orthogonal) rotations.
Results
As mentioned above, we first conducted a set of simulations of CFAs to examine issues of overfitting and nonconvergence and to extend previous literature on fitting propensity (Bonifay & Cai, 2017; Preacher, 2006) to several commonly used structural models of psychopathology. We next conducted analyses of 100 studies that are representative of the extant literature on the structure of psychopathology to examine advantages and disadvantages of model-based reliability indices for adjudicating among alternative models, as well as the consistency and precision of factor loadings across models. Finally, we used data from two large twin studies (included in the aforementioned 100 studies) to examine the sensitivity of factors to their constituent indicators in bifactor and correlated-factors models, differences in the pattern and magnitude of associations with relevant criterion variables in adjudicating among models, and statistically distinguishable versus indistinguishable models.
Conventional model-fit indices are useful for comparing some models but not others
Researchers have documented limitations of conventional statistical fit indices (e.g., overfitting, bias in tests of certain models) for adjudicating among alternative structural models of psychopathology and cognitive ability (Bonifay & Cai, 2017; Bonifay et al., 2017; Forbes, Greene et al., 2021; Greene et al., 2019; Morgan et al., 2015; Murray & Johnson, 2013; Waldman, 2017; Watts et al., 2019) and have suggested alternative criteria (Bonifay & Cai, 2017; Bonifay et al., 2017; Forbes, Greene, et al., 2021; Waldman, 2017; Watts et al., 2019). Unfortunately, this may lead to a sentiment that fit indices are never useful for adjudicating among alternative models, which is untrue (McNeish & Wolf, 2021). Rather, fit indices may be useful for contrasting some models but not others; thus, it is hard to know in which scenarios these are meaningful and unbiased and in which they are misleading and biased. Nonetheless, these two types of scenarios and how to tell them apart remain unclear. To illustrate this, we conducted the simulations described in the Method section, extending previous simulations (Bonifay & Cai, 2017; Greene et al., 2019) to cover a wider variety of correlated-factors and bifactor models commonly used in contemporary research on the structure of psychopathology.
As shown in Figure 1a, when the true parameter values were generated by the three-correlated-factors model, model fit represented by the RMSEA very successfully discriminated between the true three-correlated-factors model and the incorrect two-correlated-factors and one-general-factor models—as indicated by their nonoverlapping 95% CIs. In contrast, each of the mis-specified bifactor models fitted as well or better than the true three-correlated-factors model. Similar results were found for the SRMR (as shown in Fig. 1a) but not for the BIC (as shown in Fig. S2a), as the three-correlated-factors and two-correlated-factors models could not be reliably discriminated from each other using the BIC, given their overlapping 95% CIs. This means that, in practice, researchers relying solely on these fit indices would likely choose an incorrect model of the structure of psychopathology. In contrast, as shown in Figure 1b, when the true parameter values were generated by the model with one general plus three correlated factors, the superiority of this model over all competing alternative models was clear according to the RMSEA. Similar results were found for the SRMR (as shown by the nonoverlapping 95% CIs in Fig. 1b) but not for the BIC (as shown in Fig. S2b), as the model with one general plus three correlated factors could not be reliably discriminated from other models using the BIC, given their overlapping 95% CIs. The results shown in Figures 1a and 1b suggest an asymmetry in the ability of fit indices to adjudicate among some models but not others. Similar to previous studies, these results also demonstrate the potential for considerable overfitting in bifactor models (Bonifay & Cai, 2017; Bonifay et al., 2017; Forbes, Greene et al., 2021; Greene et al., 2019; Preacher, 2006; Watts et al., 2019).
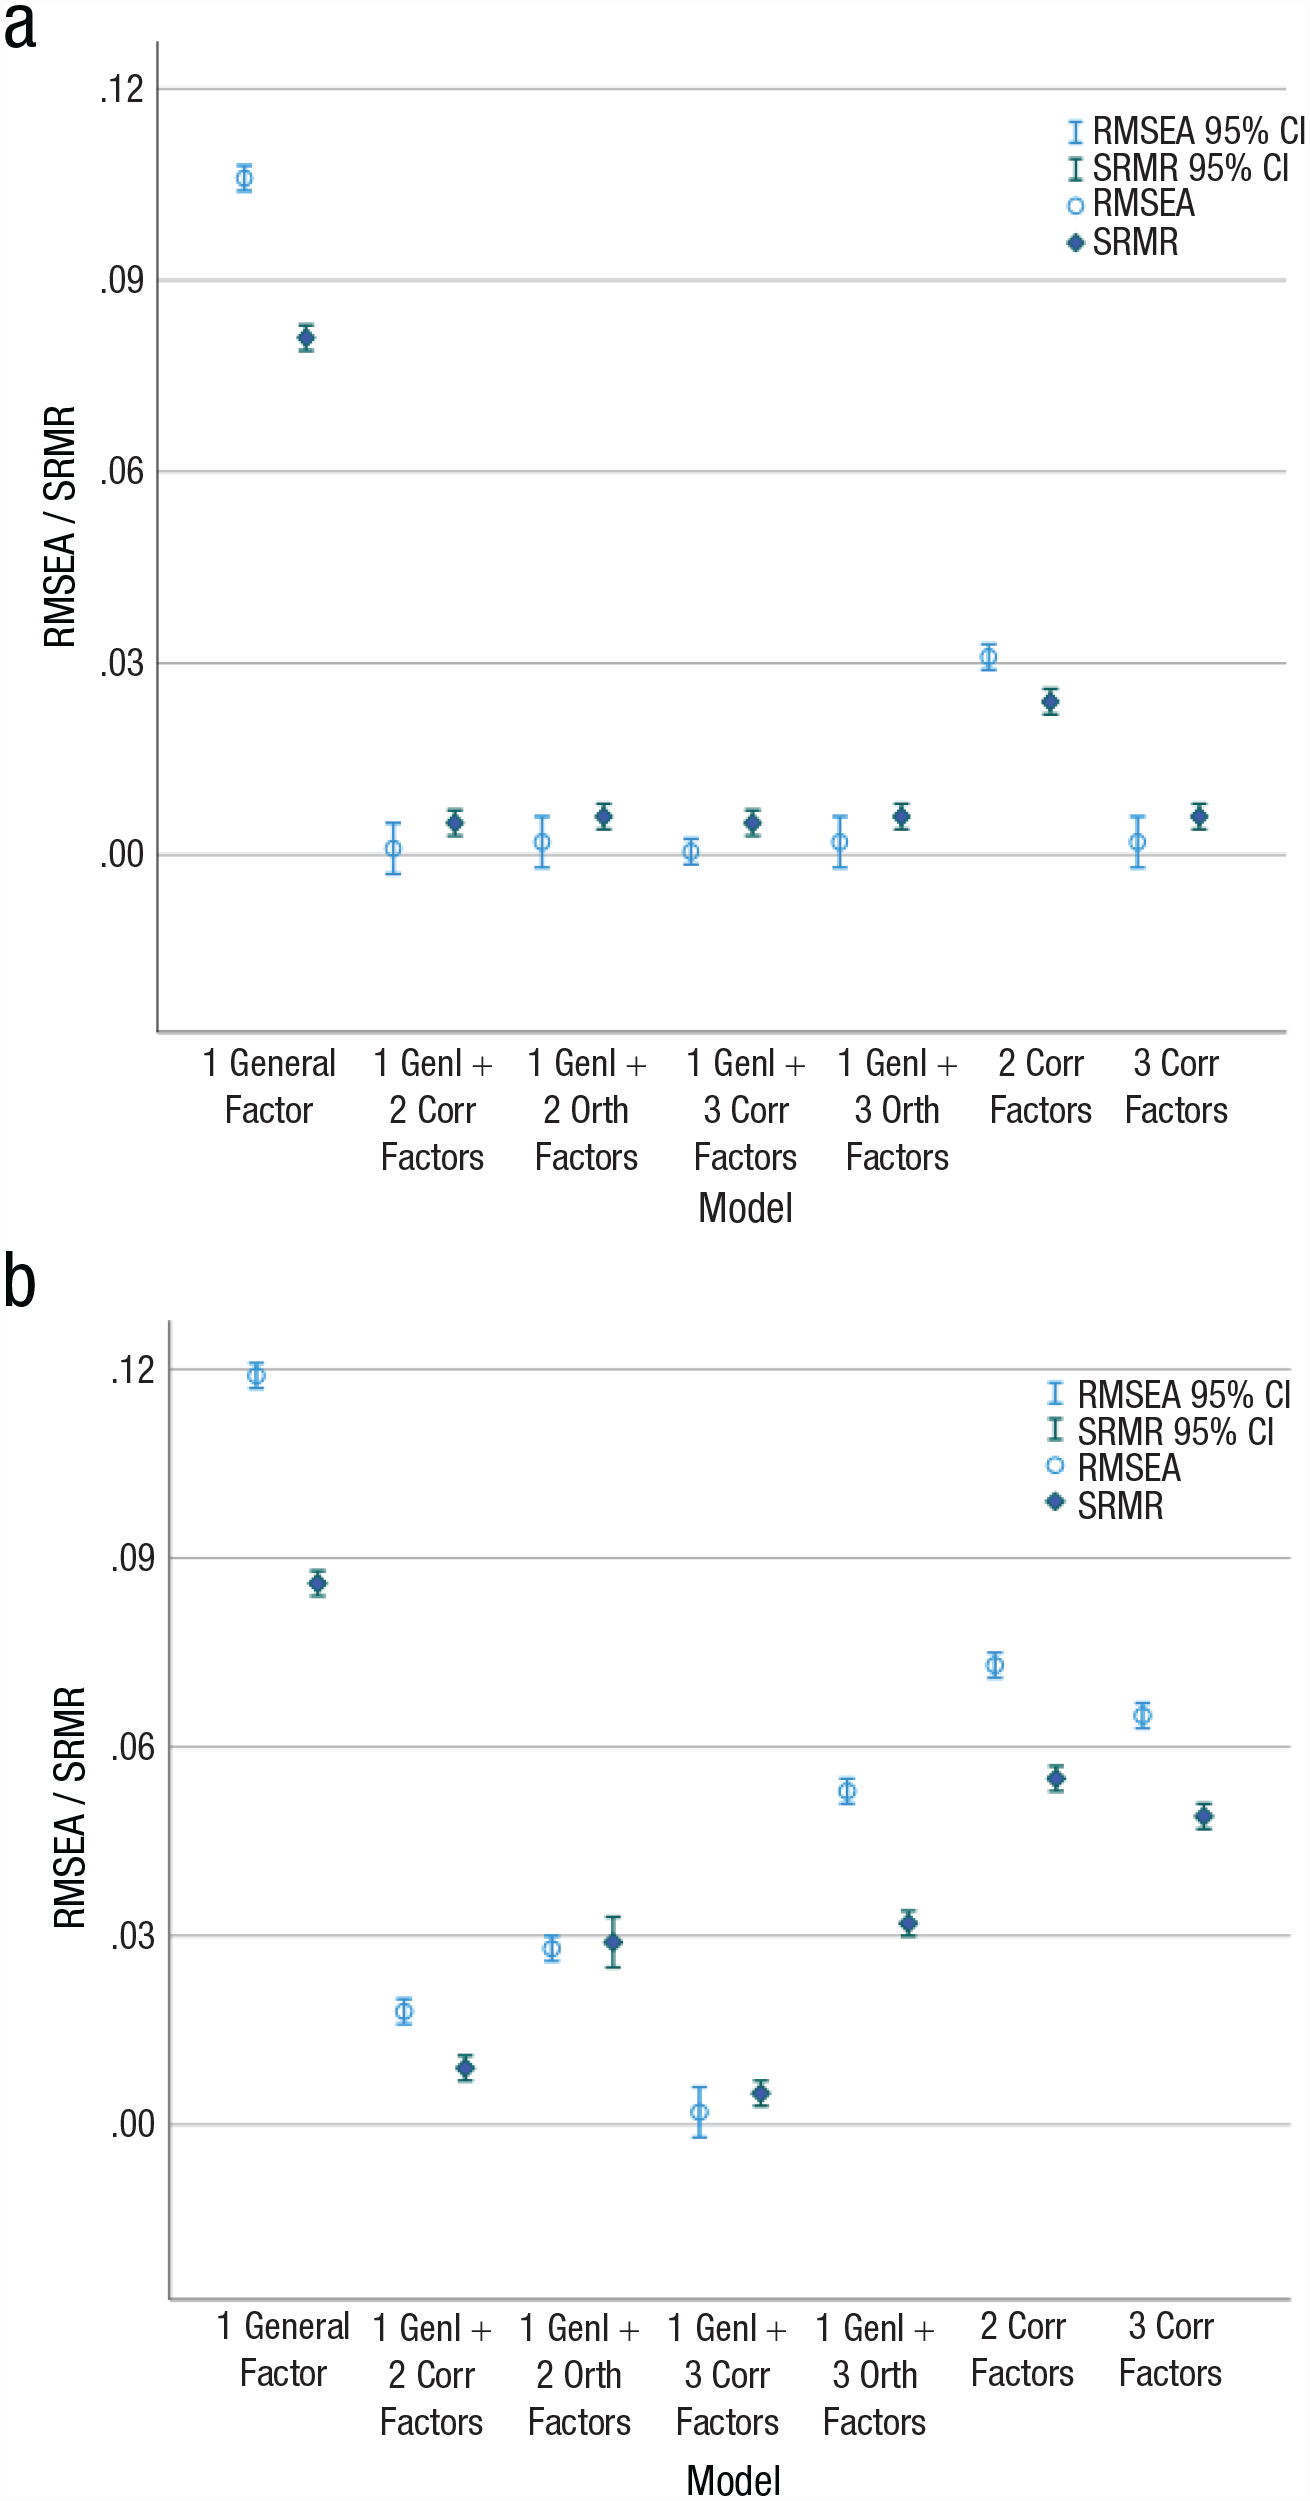
Root-mean-square error of approximation (RMSEA) and standardized root-mean-square residual (SRMR) for the seven models investigated in the present study, with (a) showing results for the three-correlated-factors model as the true generating model and (b) showing results for the modified bifactor model with one general and three correlated factors as the true generating model. Error bars indicate 95% confidence intervals (CIs).
We also examined the nonconvergence rate for each of the models in these simulations. Although most of the models converged in each of the 10,000 replications when the true parameter values were generated by the three-correlated-factors model, three of the four bifactor models showed appreciable nonconvergence rates (12% for the model with one general plus three correlated factors, 27% for the model with one general plus two correlated factors, and 63% for the model with one general plus three orthogonal factors). In contrast, when the true parameter values were generated by the model with one general plus three correlated factors, very few nonconvergences (33 of 10,000 replications) were observed only for the model with one general plus three orthogonal factors and for no other models.
The importance of these findings is highlighted by the entries in Figure 2, which shows the ad hoc model specifications and concerning results for the best-fitting bifactor and correlated-factors models that are very commonly used in this literature. Researchers will sometimes make ad hoc modifications to model specifications simply to improve model fit, even if the modifications make the model more difficult to interpret or do not align with theory. As Figure 2 shows, these model modifications and concerning results are more frequent in the best-fitting bifactor models than in the best-fitting correlated-factors models. Specifically, ad hoc model modifications were used in, and concerning results occurred in, 62% and 61% of the best-fitting bifactor models and only 18% and 5% of the best-fitting correlated-factors models (odds ratio = 7.27, 95% CI = [2.01, 26.29], Fisher’s exact test: p = .0014, and odds ratio = 29.23, 95% CI = [3.48, 245.64], Fisher’s exact test: p = .000037, respectively). Given the percentage of these ad hoc modifications in the best-fitting bifactor models, these model respecifications appear to be included either to improve model fit or to modify a model that did not converge so that it would run successfully. The substantial rate of nonconvergence for three of the four bifactor models in our first set of simulations in which the true parameter values were generated by the three-correlated-factors model suggests that researchers may often resort to such ad hoc model specifications, thus increasing the likelihood of obtaining chance findings that will not replicate. This highlights the critical importance of preregistration of one’s data analyses, in particular the details of a principled approach to model-fit improvement.
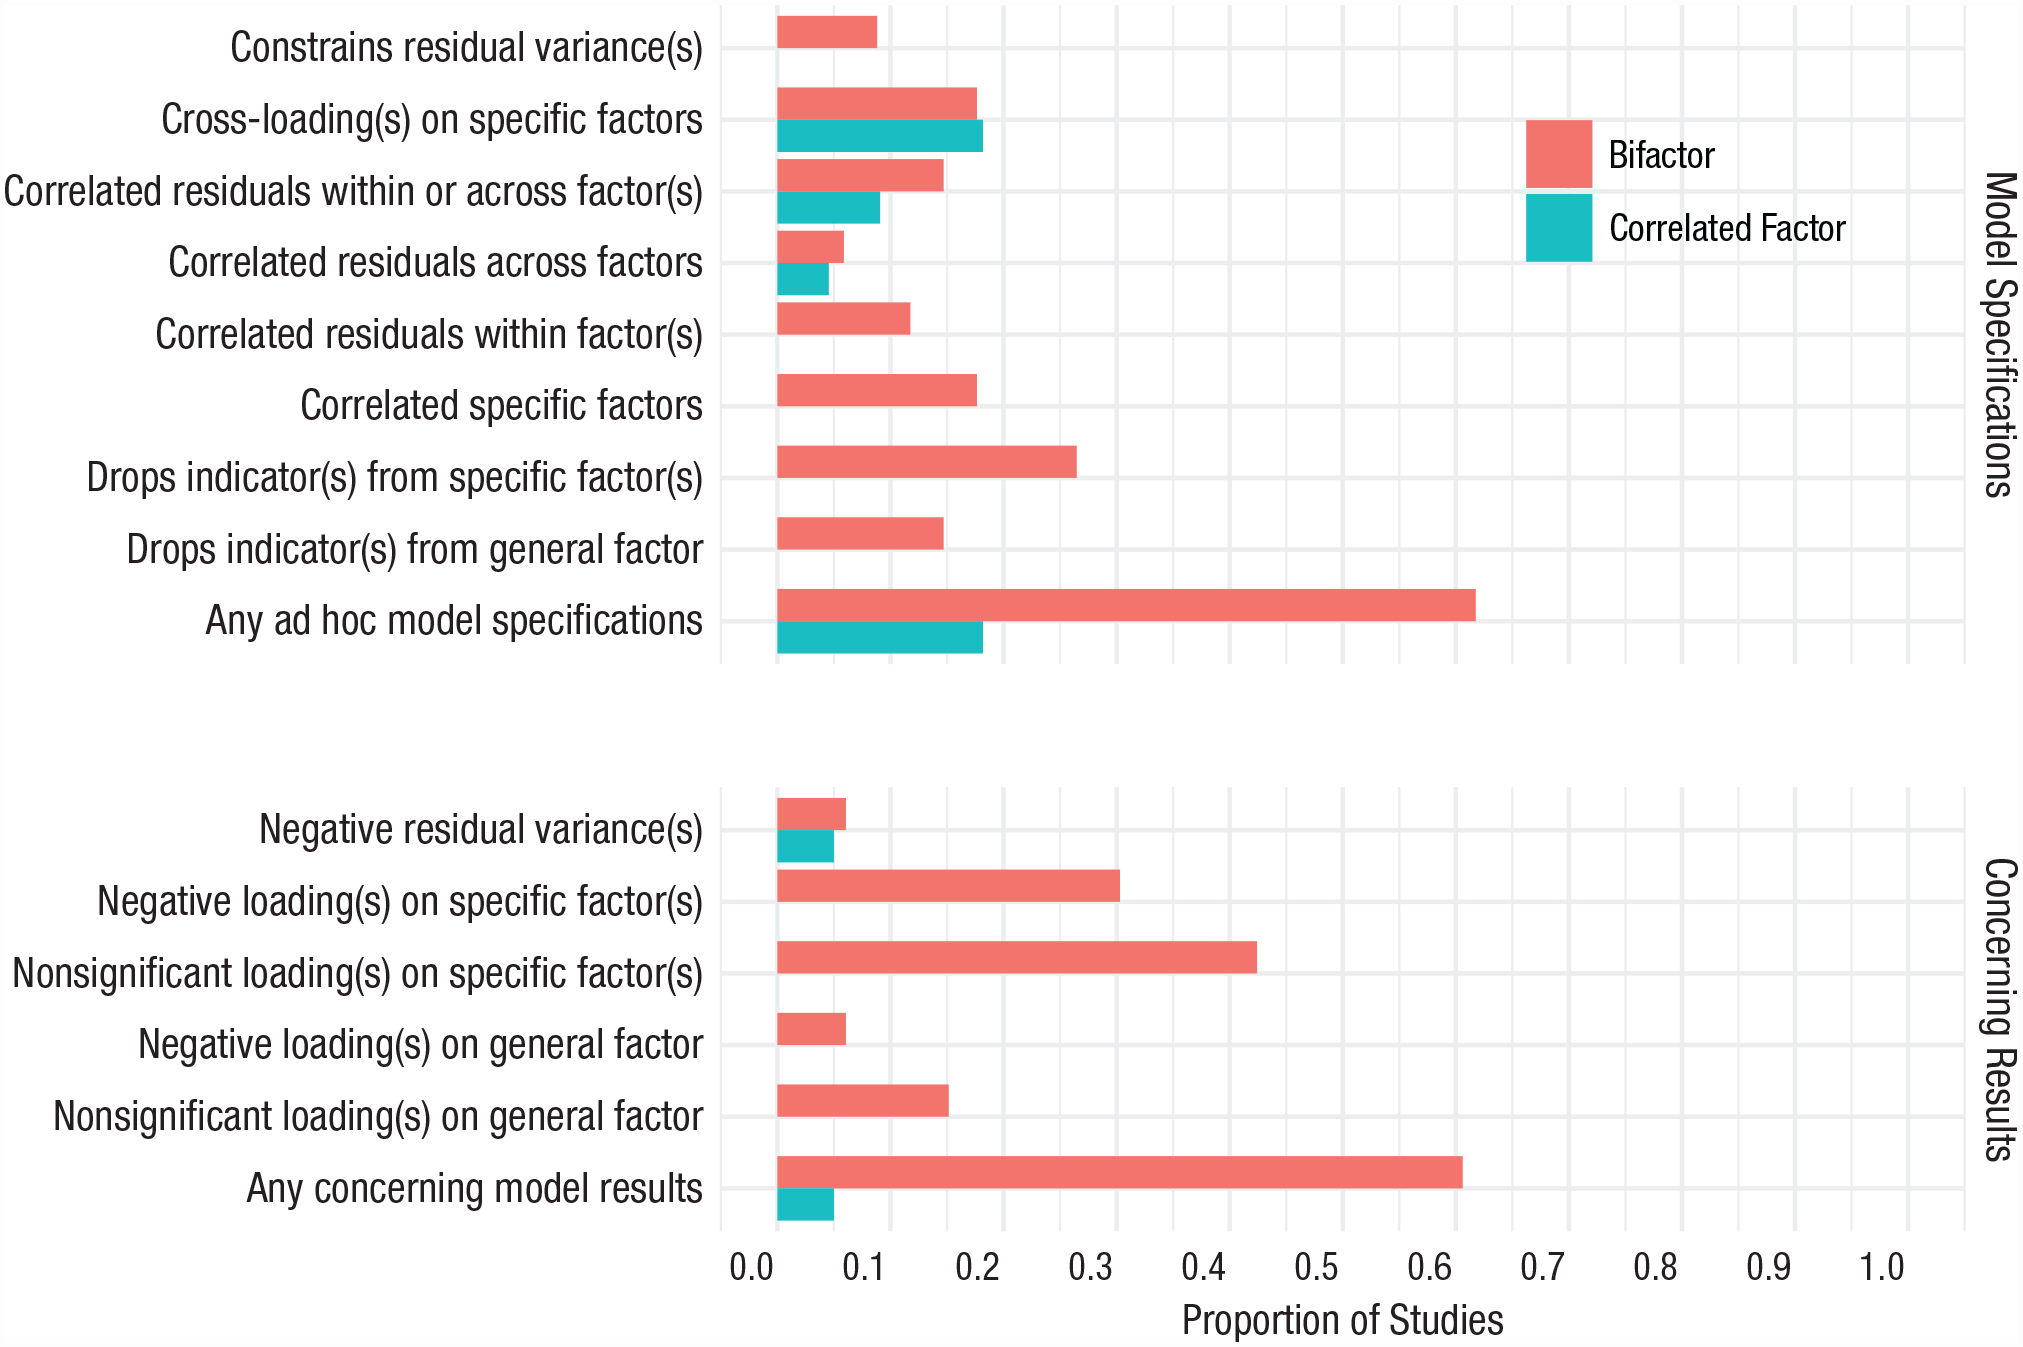
Ad hoc model specifications and concerning results in best-fitting bifactor and correlated-factors models. Out of all studies that used confirmatory factor analysis, 34 modeled both a bifactor and correlated-factors model. Thirty-four studies provided sufficient information to assess ad hoc model specifications in bifactor models, and 33 studies reported sufficient results to assess concerning results in bifactor models. Twenty-two studies provided sufficient information to assess ad hoc model specifications in correlated-factor models, and 20 studies reported sufficient results to assess concerning results in correlated-factor models. Twelve studies provided requisite information to assess concerning model specifications in bifactor models but not correlated-factors models. Fourteen studies provided the requisite information to assess concerning results in bifactor models but not correlated-factors models.
Advantages and shortcomings of model-based reliability and alternative indices for adjudicating among models
In growing awareness of problems with the overreliance on fit indices for adjudicating among structural models of psychopathology, such as overfitting (Bonifay & Cai, 2017; Bonifay et al., 2017; Preacher, 2006), researchers have begun to use (Bornovalova et al., 2020; Martel et al., 2017; Watts et al., 2019) and suggest (Forbes, Greene et al., 2021; Waldman, 2017) augmenting model fit with various model-based reliability indices (e.g., H, ω H ) first proposed in the psychometric literature (McDonald, 1985, 1999; Reise, 2012; Rodriguez et al., 2016; Zinbarg et al., 2005). As shown in their formulas (Rodriguez et al., 2016; Zinbarg et al., 2005), these indices are driven not only by the magnitude of their indicators’ factor loadings but also by the number of factor indicators. For example, as the factor-loading magnitudes and the number of indicators increase, H approaches 1. These indices have begun to play a useful role in evaluating alternative structural models of psychopathology, as reflected by their increasing use in the literature, and have seen particular application in interpreting the results of bifactor models, especially in assessments of the reliability of the general and specific (i.e., group) factors in such models both within and across studies (Forbes, Greene et al., 2021; Martel et al., 2017; Watts et al., 2019). Use of these indices is meant to put the reliability of different factors in a model—either within a study or across studies—on an equal footing and to assess their usefulness in applied research. For example, an arbitrary threshold value of H ≥ .7 has been recommended for interpreting a factor as having adequate construct replicability (Rodriguez et al., 2016). In Figure 3, we show notched-box-and-whiskers plots of H and the median, standard deviation, and standard error of standardized factor loadings for the six most commonly characterized psychopathology factors (i.e., general, Externalizing, Internalizing, Distress, Fear, and Thought Disorder) from both bifactor and correlated-factors models in the 100 studies we reviewed. For all but the general factor, the values of these indices from the bifactor model are calculated for the specific (i.e., group) factors that accompany the general factor, in contrast to their unresidualized values from the correlated-factors model.

Values of H (a) and the median (b), standard deviation (c), and standard errors (d) of standardized factor loadings from correlated-factors (darker hues) and bifactor (lighter hues) models, separately for each of the six most commonly characterized psychopathology factors. In each box-and-whisker plot, the horizontal line indicates the median, the upper and lower boundaries of the box indicate the interquartile range, and the whiskers mark values 1.5 times the interquartile range. Dots above or below the ends of the whiskers represent outliers. Lack of overlap in the notches in the boxes roughly corresponds to statistically significant differences among them (Tukey, 1977). N shows the number of studies that contributed to each plot. GEN = general, EXT = Externalizing, INT = Internalizing, TP = Thought Problems/Thought Disorders.
As Figure 3a shows, H was much higher for the factors in the correlated-factors model than for the specific factors in the bifactor model, F(1, 265) = 216.23, p = 3.38 × 10–36, partial η2 = .45, suggesting that specific factors in bifactor models consistently explained less variance in their indicators than the factors in correlated-factors models. This is true in large part because the specific factors in the bifactor model are residuals in the sense that they explain the common variance in the indicators that is left over after the variance explained by the general factor. In addition, in the bifactor model, H was much higher for the general factor than for the specific factors, F(5, 323) = 43.62, p = 2.62 × 10⁻³⁴, partial η2 = .40. Across both models, H was highest for the general factor, followed by Externalizing and Internalizing, then by Fear, Thought Disorder, and Distress. This is likely due to the greater number of indicators used to specify common factors at higher than lower levels of generality. In addition to the values of H being much higher for factors in the correlated-factors model than for the corresponding specific factors in the bifactor model, differences in H across the factors in the correlated-factors model were nonsignificant and much smaller, F(4, 125) = 1.40, p = .237, partial η2 = .04, than those in the bifactor model. These results suggest that the bifactor model provides substantial reliability in operationalizing a general factor but performs inferiorly at the level of specific factors.
Different pictures emerged for differences across factors for the median and standard deviation of standardized factor loadings, shown in Figures 3b and 3c, respectively. First, it is noteworthy that the magnitude of the median loadings was considerably lower than the magnitude of H. Similar to the findings for H, the median loadings were much higher for factors in the correlated-factors model than for the specific factors in the bifactor model, F(1, 1230) = 190.16, p = 2.49 × 10–40, partial η2 = .13. Although the median loadings differed substantially and significantly across the six factors in the bifactor model, F(5, 198) = 17.45, p = 2.67 × 10⁻¹⁴,partial η2 = .31, differences in the median loadings among the factors in the correlated-factors model were much smaller and nonsignificant, F(4, 125) = 2.34, p = .058, partial η2 = .07. In other words, correlated-factors models tended to result in consistently high loadings of their indicators across the dimensions that were modeled, whereas specific factors in the bifactor model tended to have weaker and less consistent loadings that were less interpretable. The pattern of these differences also was quite different from that for H, as the median loadings for factors in the bifactor model were highest for Externalizing, followed by the general factor, Fear, Internalizing, Distress, and Thought Disorder, and the pattern of these differences across factors in the correlated-factors model was quite different from that in the bifactor model. These findings likely reflect the different number of indicators per dimension and its influence on H but not on the median factor loadings.
The standard deviations of the factor loadings did not differ across the factors in either the bifactor model, F(5, 198) = 1.04, p = .398, partial η2 = .02, or the correlated-factors model, F(4, 125) = 2.29, p = .063, partial η2 = .07. Despite this, the loadings’ standard deviations were significantly and substantially higher for factors in the bifactor than the correlated-factors model (.17, 95% CI = [.16, .18], and .11, 95% CI = [.09, .12], respectively), F(1, 327) = 35.21, p = 7.53 × 10⁻⁹, partial η2 = .10. This indicates that loadings are more variable for factors in the bifactor than the correlated-factors model.
Another useful index for adjudicating among alternative factor models is the statistical property of efficiency, as instantiated using the standard errors of the factor loadings and factor correlations estimated within a given model. In addition to testing some hypotheses, a central goal of all statistical analyses is to estimate some quantities and to estimate them with greater than lesser precision. A model is useful to the extent that it facilitates this goal, and we can thus evaluate and adjudicate among alternative models of psychopathology partly on the basis of the extent to which their factor loadings and factor correlations are precisely estimated. In Figure 3d, the standard errors of the factor loadings are shown for the general and specific factors in the bifactor model and the factors in the correlated-factors models. There are several noteworthy features of this figure. First, factor loadings in the correlated-factors models are estimated quite precisely, as indicated by median standard errors that are quite low (.047) relative to their moderate to high factor loadings. Second, although loadings on the general factor are estimated almost as precisely (.056), they tended to show greater variability across studies. Third, loadings on the specific factors in the bifactor model are estimated much less precisely, as indicated by median standard errors for each specific factor that are almost twice as high as their counterparts in the correlated-factors models (.092, 95% CI = [.085, .100], and .047, 95% CI = [.040, .054], respectively), F(1, 360) = 113.0, p = 3.81 × 10⁻²³, partial η2 = .24. In addition, the precision with which factor loadings were estimated was more consistent across factors in the correlated-factors model, F(4, 191) = 1.90, p = .111, partial η2 = .04, than across the specific factors in the bifactor model, F(4, 169) = 18.9, p = 7.39 × 10⁻¹³, partial η2 = .31; similar to Bonifay & Cai, 2017; Bonifay et al., 2017).
Despite the potential utility of model-based reliability indices, there are some unforeseen shortcomings to their application for adjudicating among alternative structural models of psychopathology. For example, as mentioned above, H is dependent on both the magnitude of factor loadings within a factor and on the number of indicators used to represent a factor. Values of H ≥ .7 for a factor can be achieved with factor loadings that range from .8 to .33 simply by increasing the number of factor indicators from 2 to 19 (see Table 1). This should come as no surprise, given that it has long been known that a test or scale can be made more reliable by increasing the number of items it contains (Nunnally & Bernstein, 1994). We find it problematic that two factors with such different properties (i.e., average factor loadings of .8 and .33) can be judged as having similar levels of construct replicability when one factor explains 64% of its indicators’ variance on average and the other factor explains only 10% of its indicators’ variance. Another view on this is shown in Figure S3 in the Supplemental Material, in which we compared values of H with the median factor loadings in the 100 studies we reviewed, binning by the number of indicators on each factor (i.e., < 5, 5–10, > 10). As the number of indicators increased, values of H increasingly exceeded the median loadings, and the correlation between H and the median loadings decreased. This demonstrates a decreased reliance of H on the magnitude of factor loadings versus the number of indicators as the latter increases. Given these findings, it might be better to rely on indices that are unaffected by the number of indicators, such as the median or mean, standard deviation, and standard error of factor loadings within a factor, as suggested in Figures 3a to 3d, as the median loadings and their standard deviations show a clear superiority of factors with consistently high loadings regardless of their number of indicators.
H as a Function of Factor-Loading Magnitude (λ) and Number of Indicators
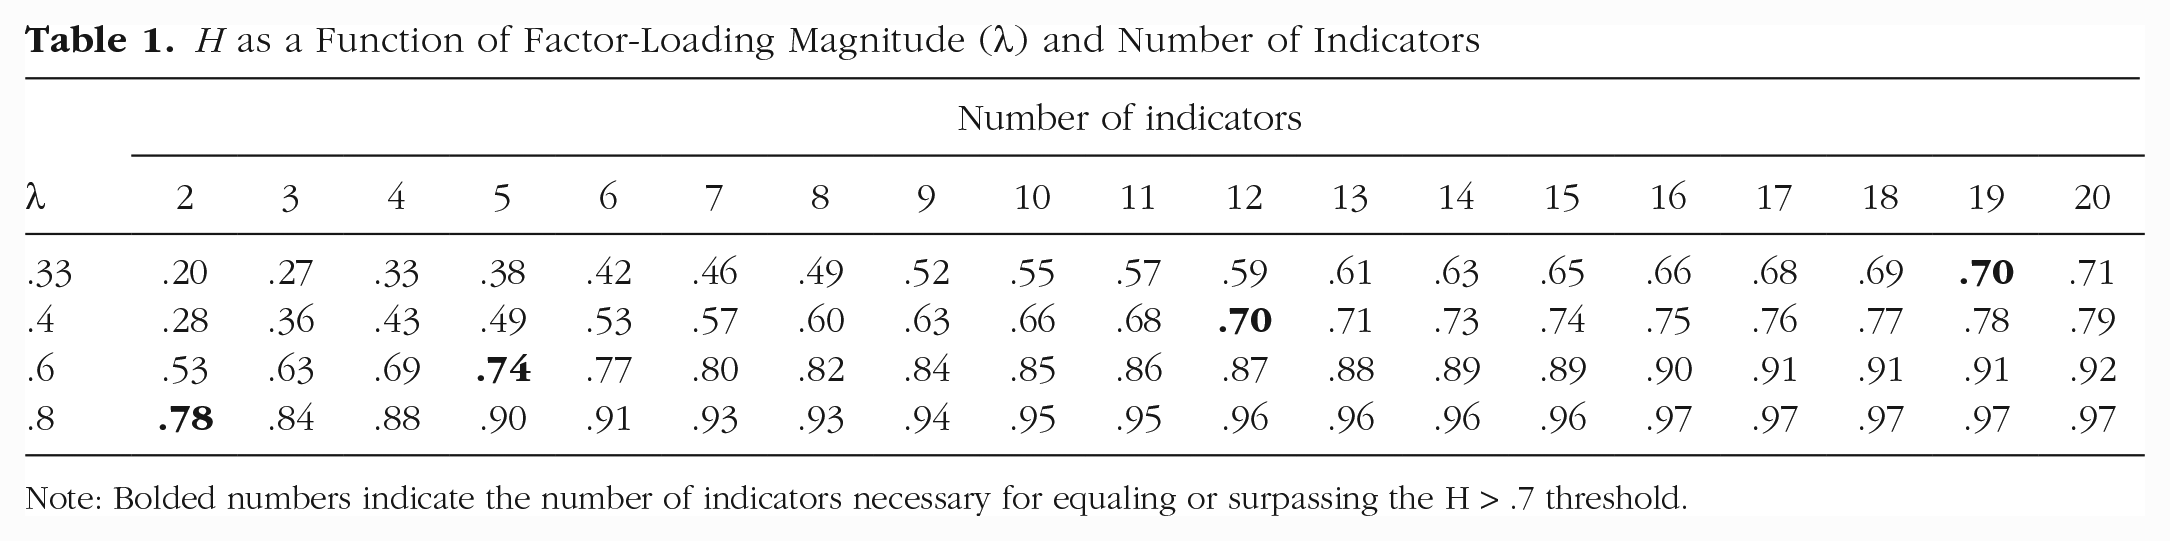
Note: Bolded numbers indicate the number of indicators necessary for equaling or surpassing the H > .7 threshold.
To summarize the results shown in Figures 3a to 3d and Table 1, average factor loadings of indicators on the factors in correlated-factors models were higher, measured more precisely, and more consistent than for the factors in bifactor models. Although H for the general factor was as high as H for the factors in correlated-factors models, this was driven by the general factor’s greater number of indicators, as the median factor loadings on the general factor was considerably lower than for the factors in the correlated-factors model. This suggests that researchers should use indices that are more sensitive to the percentage of variance that factors explain in their indicators, rather than the number of indicators on a factor. In addition, researchers should attend to the precision and consistency of factor loadings within the factors in a model in adjudicating among alternative structural models of psychopathology.
The consistency and sensitivity of factors to their constituent indicators
For a general factor of psychopathology to be considered truly general, the factor loadings of its indicators should be relatively consistent across the domains it covers. A general factor with large fluctuations in the magnitude of loadings across domains and studies is both quantitatively and practically meaningless in its interpretation. Although it is unrealistic to expect no variation in the average factor loadings across domains, such cross-domain variation in the factor loadings of indicators should be relatively small and ideally reflect only random fluctuations. In real-world applications, it is unrealistic to expect all indicators to be parallel (i.e., to have equal factor loadings and residual variances) or even tau equivalent (i.e., to have equal factor loadings) but rather for their factor loadings to be consistently moderate to high. In Figure 4a, using data from the 100 studies we reviewed, we show the distributions of standardized factor loadings of symptom dimensions reflecting five commonly studied broad domains of psychopathology on the general factor from the bifactor model (the light boxes and whiskers) and on factors from the correlated-factors model (the dark boxes and whiskers). There is substantial cross-domain variation in the general factor loadings, F(4, 716) = 25.7, p = 6.32 × 10⁻²⁰, partial η2 = .13, whereas this variation is much smaller for loadings in the correlated-factors model, F(4, 514) = 5.5, p = .00025, partial η2 = .04. Factor loadings were also higher on the correlated factors than on the general factor in the bifactor model (.68, 95% CI = [.66, .70], and .51, 95% CI = [.50, .52], respectively), F(1, 1238) = 267.1, p = 1.62 × 10–54, partial η2 = .18.
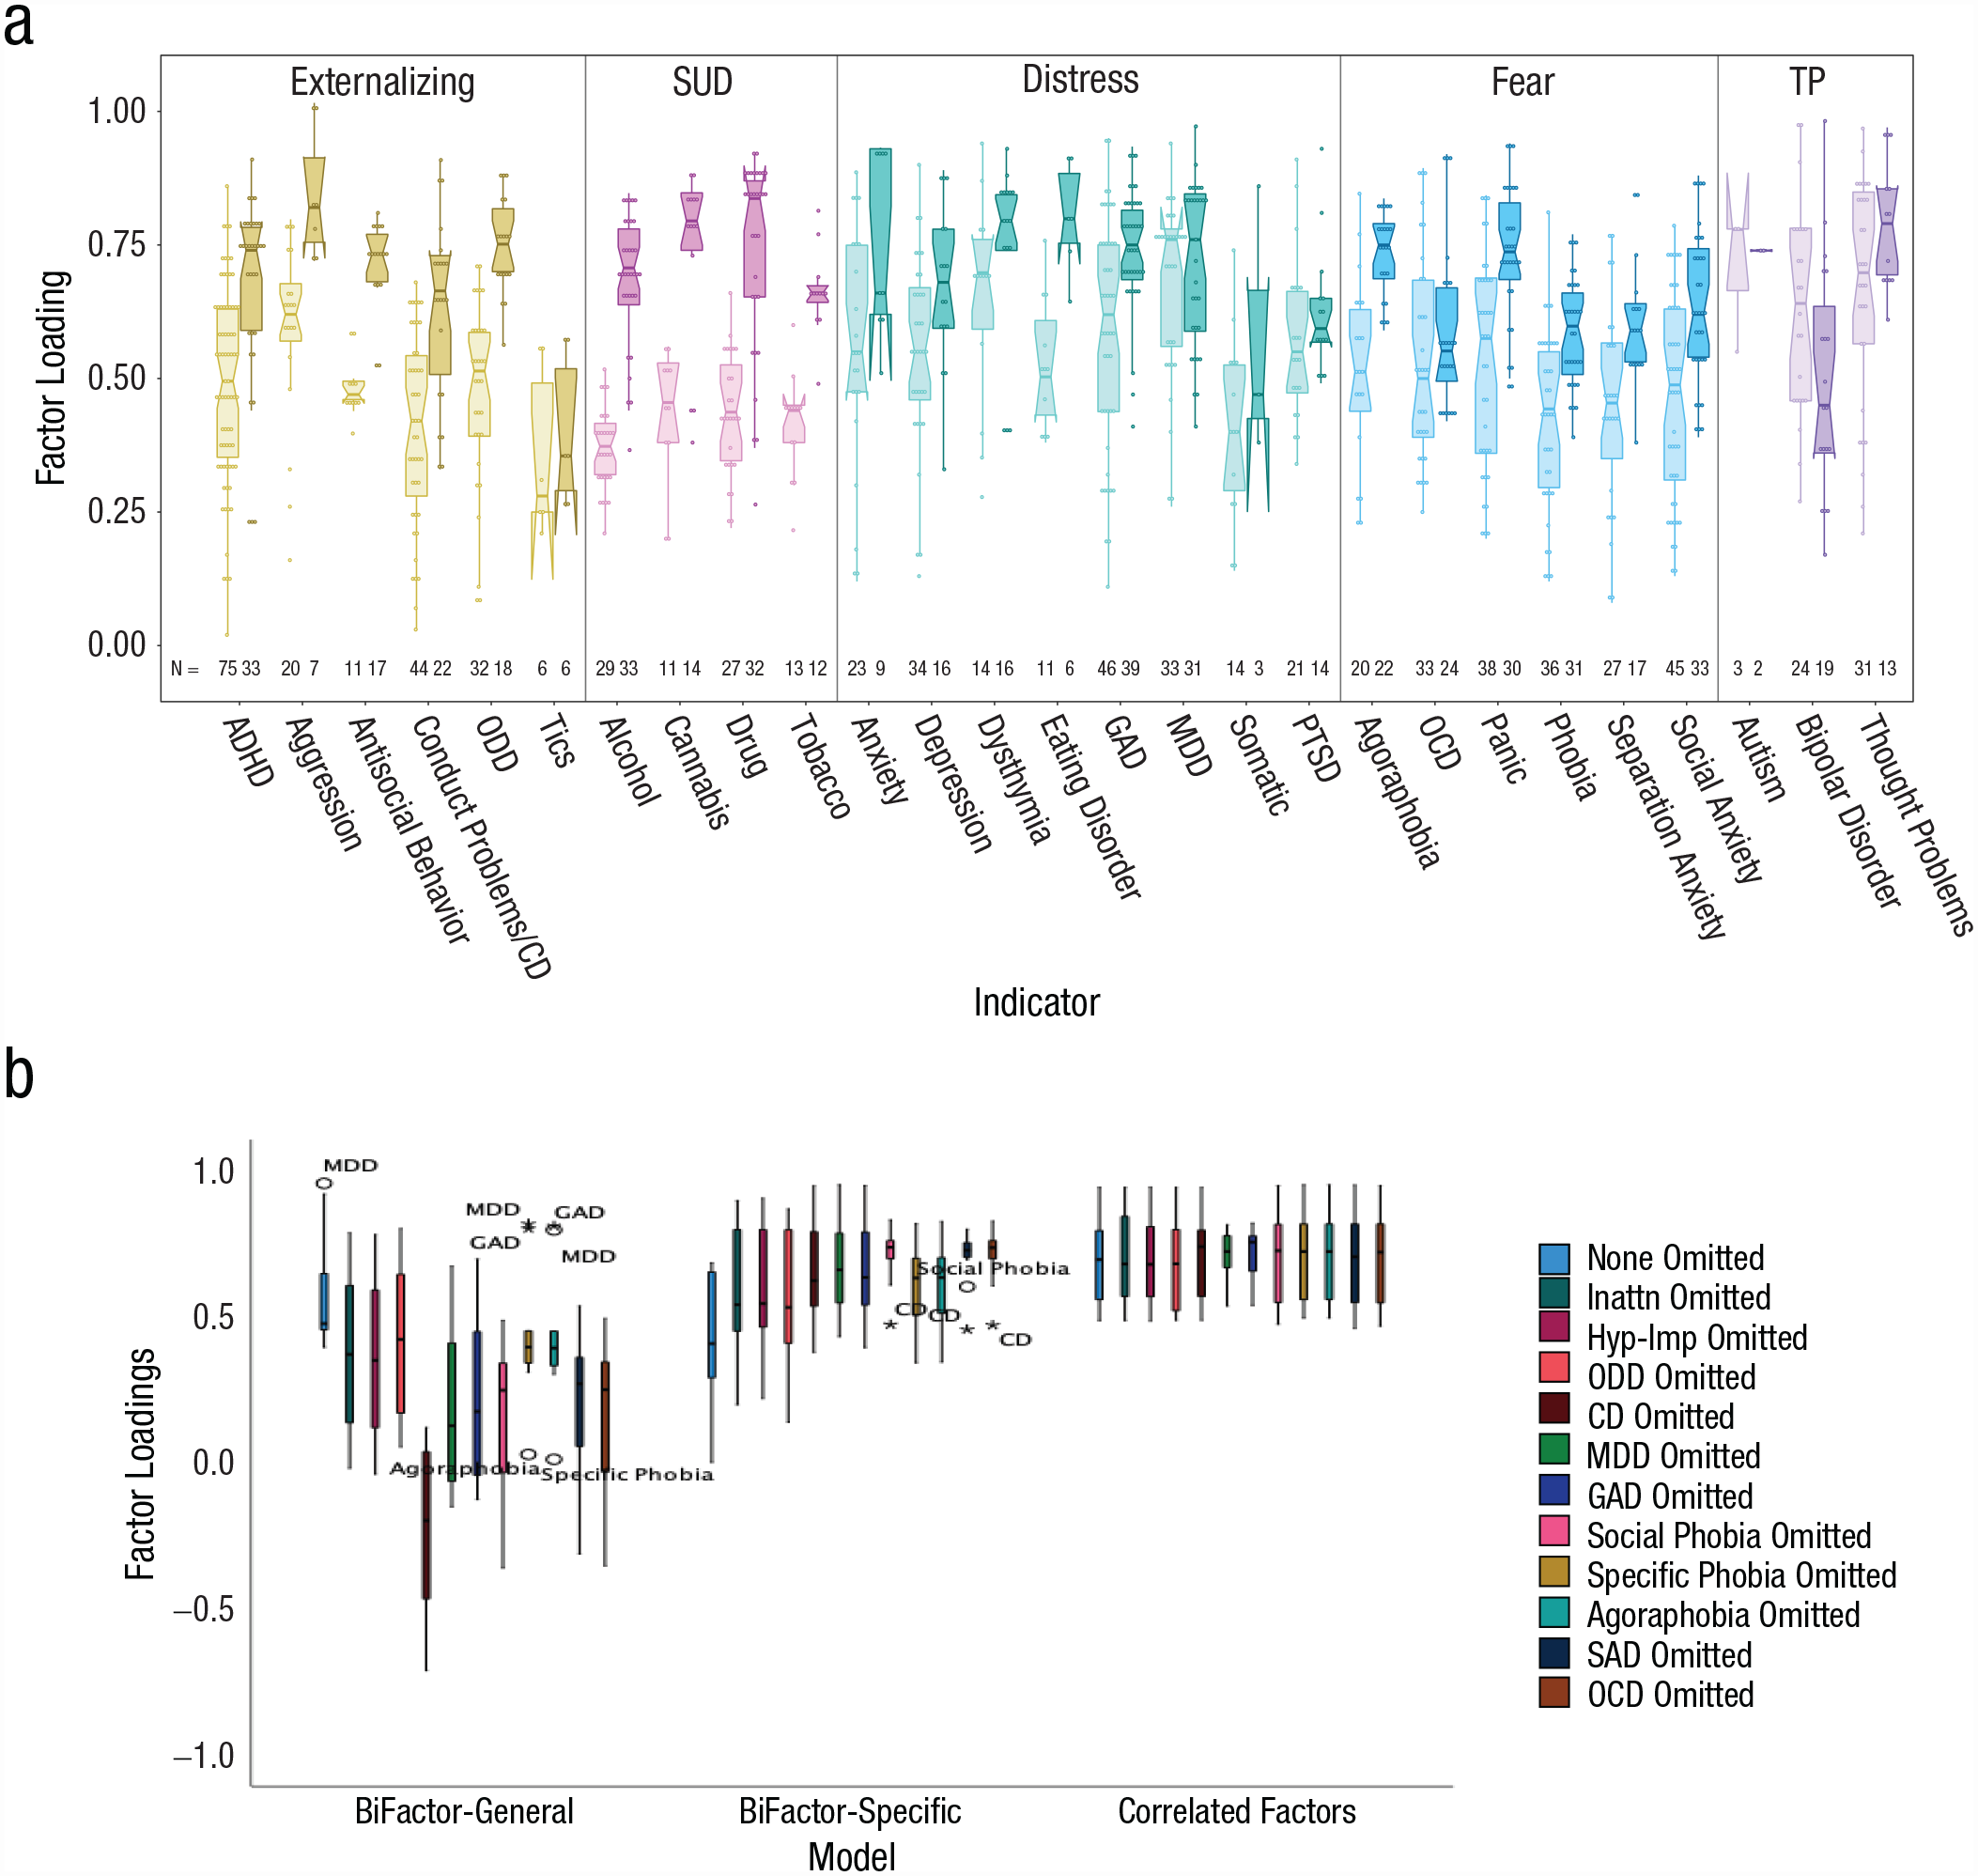
Consistency and sensitivity of factor loadings for bifactor and correlated-factors models. In (a), standardized factor loadings are shown for symptom dimensions reflecting five commonly studied broad domains of psychopathology on the general factor from the bifactor model (the light boxes and whiskers) and on factors from the correlated-factors model (the dark boxes and whiskers). In (b), standardized factor loadings are shown for symptom dimensions for the general factor from the bifactor model, the Externalizing and Internalizing specific factors from the bifactor model, and the factors from the correlated factors model. In each box-and-whisker plot, the horizontal line indicates the median, the upper and lower boundaries of the box indicate the interquartile range, and the whiskers mark values 1.5 times the interquartile range. Dots or asterisks above or below the ends of the whiskers represent outliers. Lack of overlap in the notches in the boxes roughly corresponds to statistically significant differences among them (Tukey, 1977). N shows the number of studies that contributed to each plot. SUD = substance use disorder, TP = thought problems/thought disorders, ADHD = attention-deficit/hyperactivity disorder, CD = conduct disorder, ODD = oppositional defiant disorder, GAD = generalized anxiety disorder, MDD = major depressive disorder, Somatic = somatic complaints, PTSD = posttraumatic stress disorder, OCD = obsessive-compulsive disorder, Inattn = inattention, HYP-IMP = hyperactivity-impulsivity, SAD = separation anxiety disorder.
Another criterion that may be useful for adjudicating among structural models of psychopathology is how sensitive or robust a factor is to the inclusion or exclusion of its indicators (Reise, 2012). The optimal case for the validity of a factor is that the loadings of its indicators should be relatively consistent and moderate to high in magnitude (K. Bollen, 2011; K. A. Bollen, 2020; Fabrigar et al., 1999; Reise, 2012; Savalei & Reise, 2019; Yang & Green, 2010). In our reading of the literature, however, this is often not the case. We have shown one view of this issue in Figures 3a to 3d, namely, calculating the median and standard deviation of factor loadings. Another perspective on this, given a sufficient number of indicators, is to reexamine the median and variability of factor loadings on a factor when one removes each of the indicators in turn. We illustrate this below using data from the TTS described in the Method section (Waldman et al., 2016). We present factor loadings for each symptom dimension on the general and Externalizing and Internalizing specific factors from a bifactor model and from the Externalizing and Internalizing factors from a correlated-factors model when each symptom dimension is omitted in turn from the CFA. As shown in Figure 4b, variability in the magnitude and spread of the loadings was greatest for the general factor from the bifactor model, intermediate for the Externalizing and Internalizing specific factors from the bifactor model, and minimal for the Externalizing and Internalizing factors from the correlated-factors model. These results echo those presented in Figure 3a, in which H was higher and more consistent for factors in correlated-factors models than for the specific factors in bifactor models.
Adjuncts to CFA for adjudicating among alternative models—advantages and limitations
Above, we emphasized an approach to adjudicating among alternative structural models of psychopathology that relies heavily on CFA. Researchers have recently suggested two other approaches for adjudicating among alternative structural models of psychopathology that can be used as adjuncts to—or replacements for—the exclusive use of CFA. These include the reliance on associations of latent psychopathology dimensions with external criteria (Bonifay et al., 2017) and the use of ESEMs or exploratory factor analysis (EFA) as a complement to CFA (Greene et al., 2022). In the following two sections, we will explore and discuss the advantages and limitations of these two approaches.
Patterns and magnitude of associations with relevant criterion variables across models
Some researchers have suggested that although model fit may not be particularly useful for adjudicating among alternative models of psychopathology, meaningful differences among alternative models will be evident in the variance explained in, and patterns of associations with, relevant criterion variables (Bonifay et al., 2017; Ferrando & Lorenzo-Seva, 2019; Forbes, Greene, et al., 2021; Watts et al., 2019). Such assertions are especially common in support of the general factor of psychopathology. We examined this assertion in the TTS data set described in the Method section (Waldman et al., 2016), contrasting the variance explained in and the patterns of association with relevant criterion variables (Figs. 5a and 5b; see also Figs. S4a and S4b in the Supplemental Material). As Figure 5a and Figure S4a show, the bifactor model containing general, Externalizing, and Internalizing factors explained a virtually identical amount of variance in outcomes as the correlated Externalizing and Internalizing factors alone. Also, as Figure 5b and Figure S4b show, the general factor had a nearly identical pattern of associations with the outcomes as the Externalizing and (to a lesser extent) Internalizing factors. A very similar pattern of findings emerged from another study (see Fig. 2 in Watts et al., 2019). These results fail to justify the incremental value of including a general factor over and above the correlated Externalizing and Internalizing factors alone. Given that these results are from just two studies, it is important for researchers to examine whether similar results will emerge in their studies and from the literature more generally. This will be difficult, however, because researchers reported external validity analyses from alternative models in only 29% of the studies we reviewed. It also is worth noting that associations with external criteria have often been misused in the bifactor literature to support the substantiveness of the p factor by contrasting the magnitude of relations with external correlates of the p factor versus the specific factors, which is not a fair comparison given the diminished model-based reliability of the specific factors, as shown in Figure 3a.
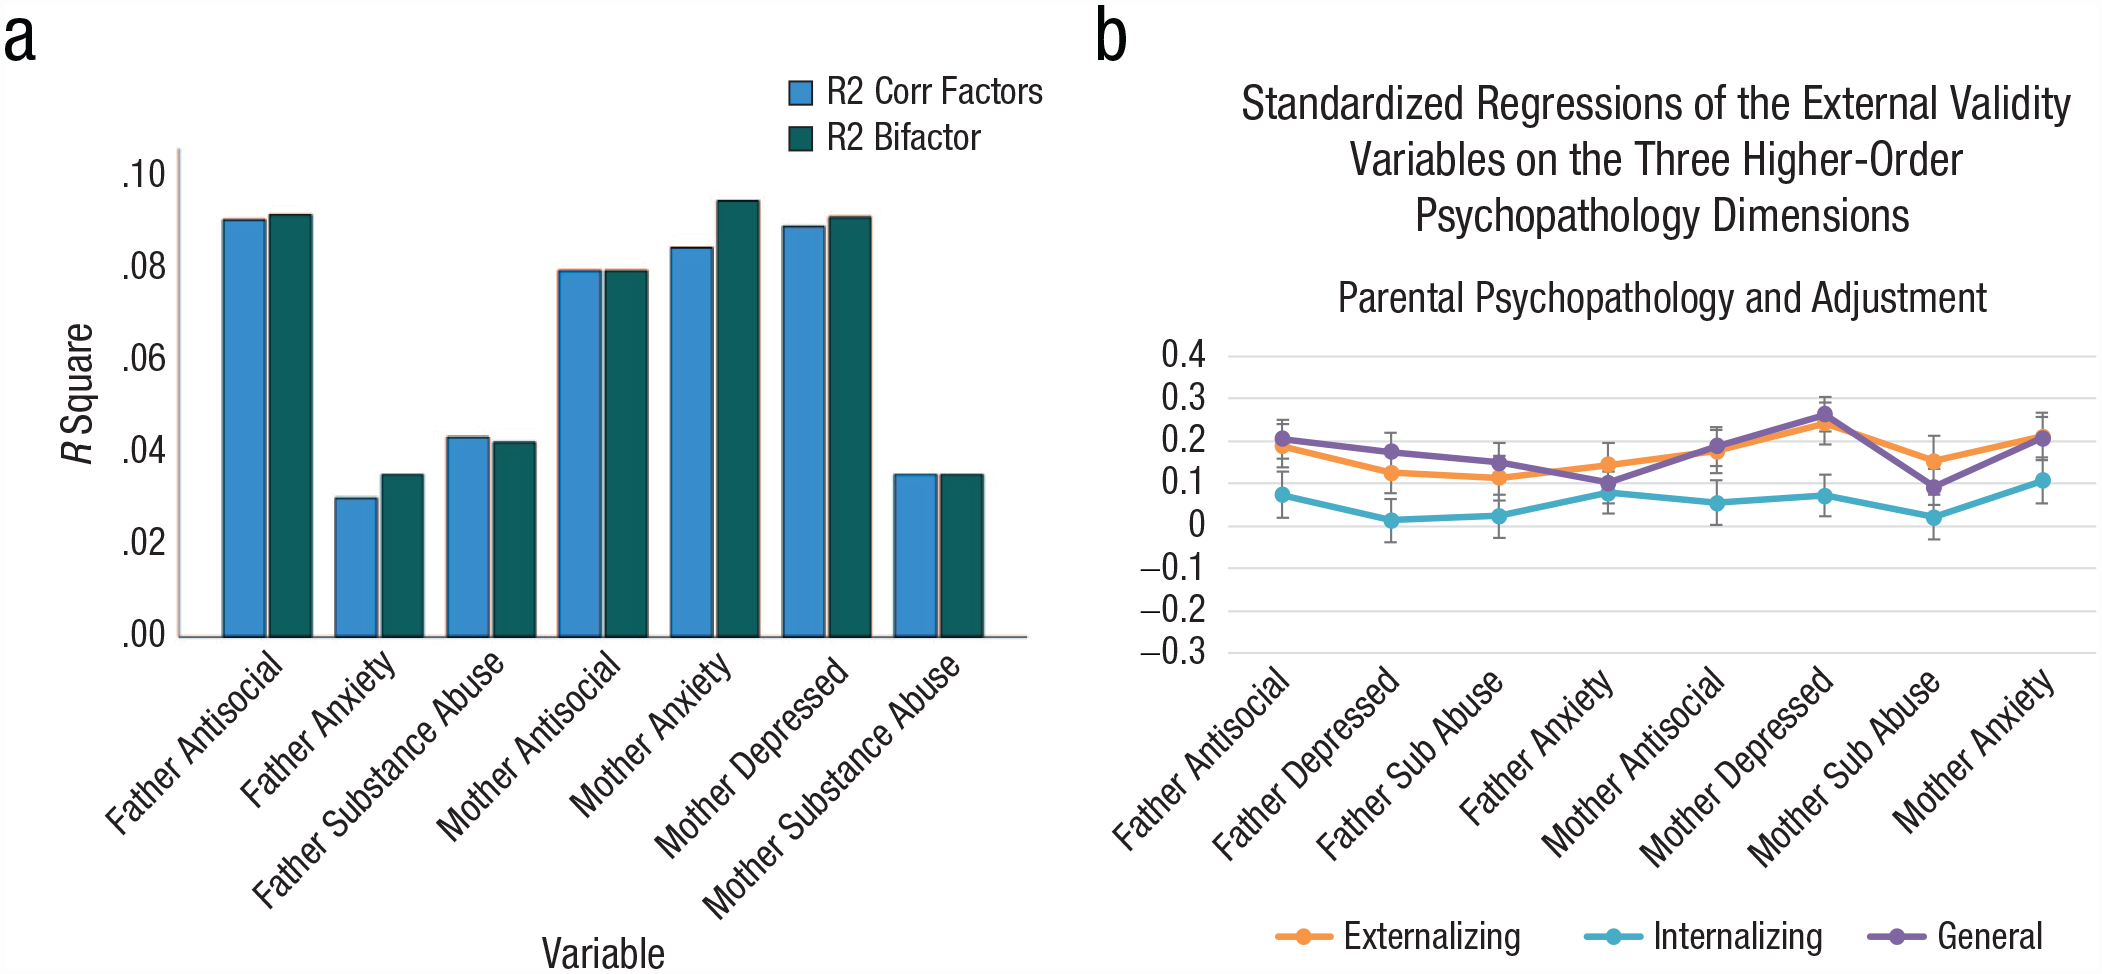
Magnitude and patterns of associations with outcomes in bifactor and correlated-factors models, with (a) showing the percent of variance (R-square) explained in each of 7 criterion variables by the bifactor model (in green) and the correlated factors model (in blue) and (b) showing the standardized regression coefficient (Beta) and its 95% confidence interval for predicting 8 criterion variables from the Externalizing factor (in orange), Internalizing factor (in teal), and general factor (in gray).
Furthermore, it is important to recognize that such comparisons in variance explained cannot be made using a higher-order general factor, as a model in which external variables are regressed on the higher-order general factor and lower-order factors simultaneously is unidentified. Given certain model constraints, only the bifactor structure allows one to separately and simultaneously examine the unique and shared variance associated with outcomes between the general and specific factors. Although this property is a desirable feature of bifactor models in principle, it does not guarantee that inclusion of a general factor will explain additional variance in, or show a different pattern of associations with, causes or outcomes over and above the factors in a correlated-factors model.
One way that tests of alternative structural models of psychopathology can be made more rigorous is by formally contrasting their associations with causes or outcomes. As an example, one can contrast the relations of the factors and their indicators with causes or outcomes under two alternative models that are commonly used in the multivariate behavior genetics literature (Neale & Cardon, 2013) but have rarely been used in the literature on the structure of psychopathology (but see Conway et al., 2022, and Forbes et al., 2020, for a somewhat similar model comparison). These models are the common- and independent-pathway models (Neale & Cardon, 2013), illustrated in Figures 6a and 6b, respectively. In the common-pathway model, associations of the variables A and B (here representing causes but which may also represent outcomes) with the symptom dimensions are mediated by the Fear factor, whereas in the independent-pathway model, associations of the variables A and B with the symptom dimensions are direct and unmediated by the Fear factor. Comparison of these two models is tantamount to testing whether associations of the causes or outcomes with the symptom dimensions are reducible to associations of the variables A and B with the hypothesized latent factor or whether the symptom dimensions have meaningful associations with the causes or outcomes that are not captured by the hypothesized factor. A similar model comparison has been suggested in the context of genome-wide association studies (Grotzinger et al., 2022).
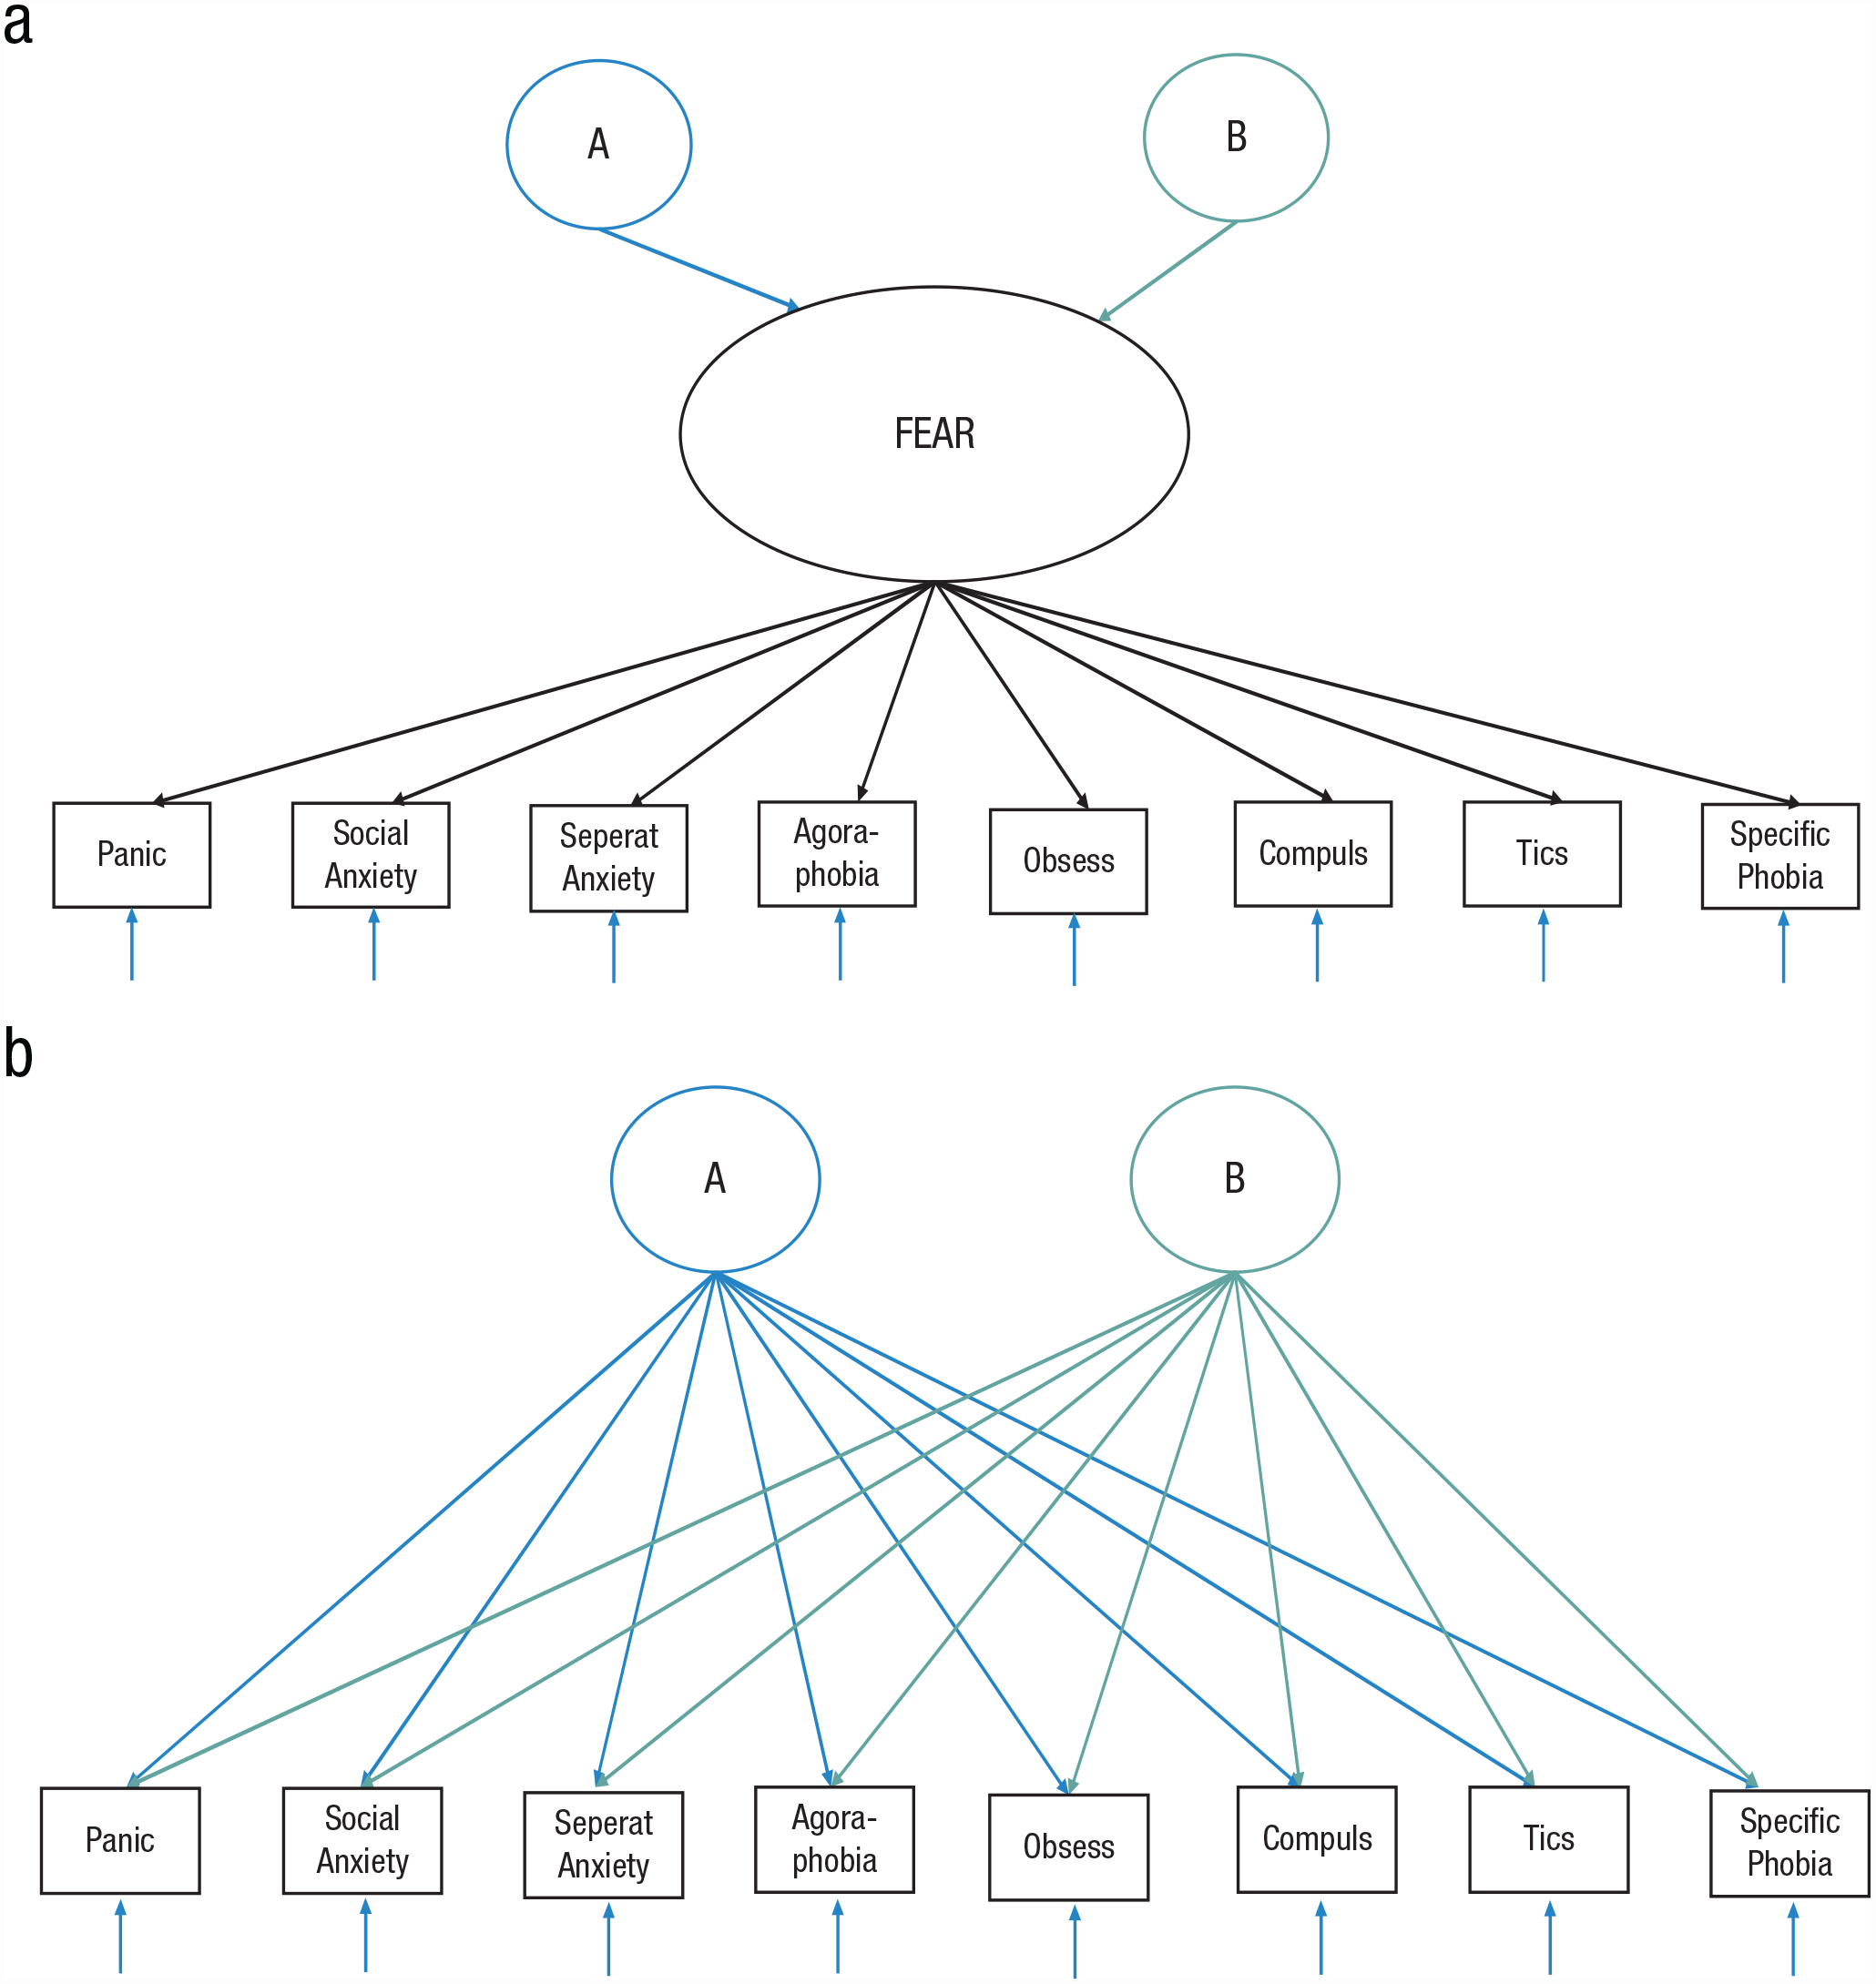
Common-pathway (a) and independent-pathway (b) models for the structure of psychopathology.
Greater awareness of statistically distinguishable versus indistinguishable models
Here, we relied on the bifactor model as a way of including a general psychopathology factor along with specific factors that parallel those in correlated-factors models. An alternative operationalization of a general psychopathology factor is via a higher-order model in which the general factor accounts for the shared variance among the second-order dimensions (e.g., Internalizing, Externalizing, Thought Disorder). Although there are important substantive distinctions between the interpretation and parameterization of bifactor and higher-order models, there are several challenges to distinguishing them on the basis of fit indices. First, a higher-order model requires more than three indicators (i.e., lower-order dimensions) in order to be overidentified and thus testable against the correlated-factors model that is its logical alternative (Loehlin & Beaujean, 2016). Second, even under seemingly favorable conditions in which there are four or more indicators, the fit of the bifactor and higher-order models is often identical or nearly so (Gignac, 2008; Markon, 2019; Mulaik & Quartetti, 1997; Yung et al., 1999). Given these issues, it has recently been suggested that researchers use other criteria for adjudicating between these alternative models containing a general as well as specific factors (Forbes, Greene, et al., 2021; Markon, 2019).
Given increasing concerns with the ability of CFA to definitively adjudicate among competing models, there has been a resurgence of interest in more exploratory approaches for investigating the structure of psychopathology. These have included EFA (Greene et al., 2022; Murray et al., 2019; Ringwald et al., 2023) and its variants, such as exploratory bifactor analysis (Greene et al., 2022; Jennrich & Bentler, 2011, 2012; Lorenzo-Seva & Ferrando, 2019; Mansolf & Reise, 2016; Markon, 2019; Pezzoli et al., 2017; Ringwald et al., 2019; Sellbom et al., 2015; Sharp et al., 2015), the “bass-ackwards” approach (Goldberg, 2006; Kim & Eaton, 2015; Levin-Aspenson et al., 2019), and ESEMs (Asparouhov & Muthén, 2009; Marsh et al., 2014; Wright & Simms, 2015). Although this shift may end up paying dividends over the undue reliance on CFA, this is as yet an open question. One relevant issue that has received insufficient attention, however, is that many of these exploratory models are statistically indistinguishable from each other despite the fact that they are substantively very different (Ringwald et al., 2019), similar to the distinction between the bifactor and higher-order models above. This is illustrated in Table 2, in which we present reanalyses of previously published data from the TTS. We show the fit of three CFA models and three ESEMs, all of which are conceptually quite different. Despite the substantive differences among the models, the three alternative CFA models are distinguishable by their fit statistics, whereas the three ESEMs are completely indistinguishable, notwithstanding the dramatic differences in their substantive interpretations. Although this issue of indistinguishable fit in EFA has long been known in the technical statistical literature, it is often ignored in applied studies of the structure of psychopathology. Thus, although augmenting CFAs with more exploratory methods—especially in a sequential fashion in which EFA methods are used as a sensitivity check to investigate sources of covariance missed by CFAs (Greene et al., 2022)—is an exciting direction for further exploration, authors conducting applied research need to be more cognizant of distinguishable versus indistinguishable models and thus more cautious in their application.
Distinguishable and Indistinguishable Models: Contrasting Fits of Confirmatory Factor Analysis (CFA) Models and Exploratory Structural Equation Models (ESEMs)
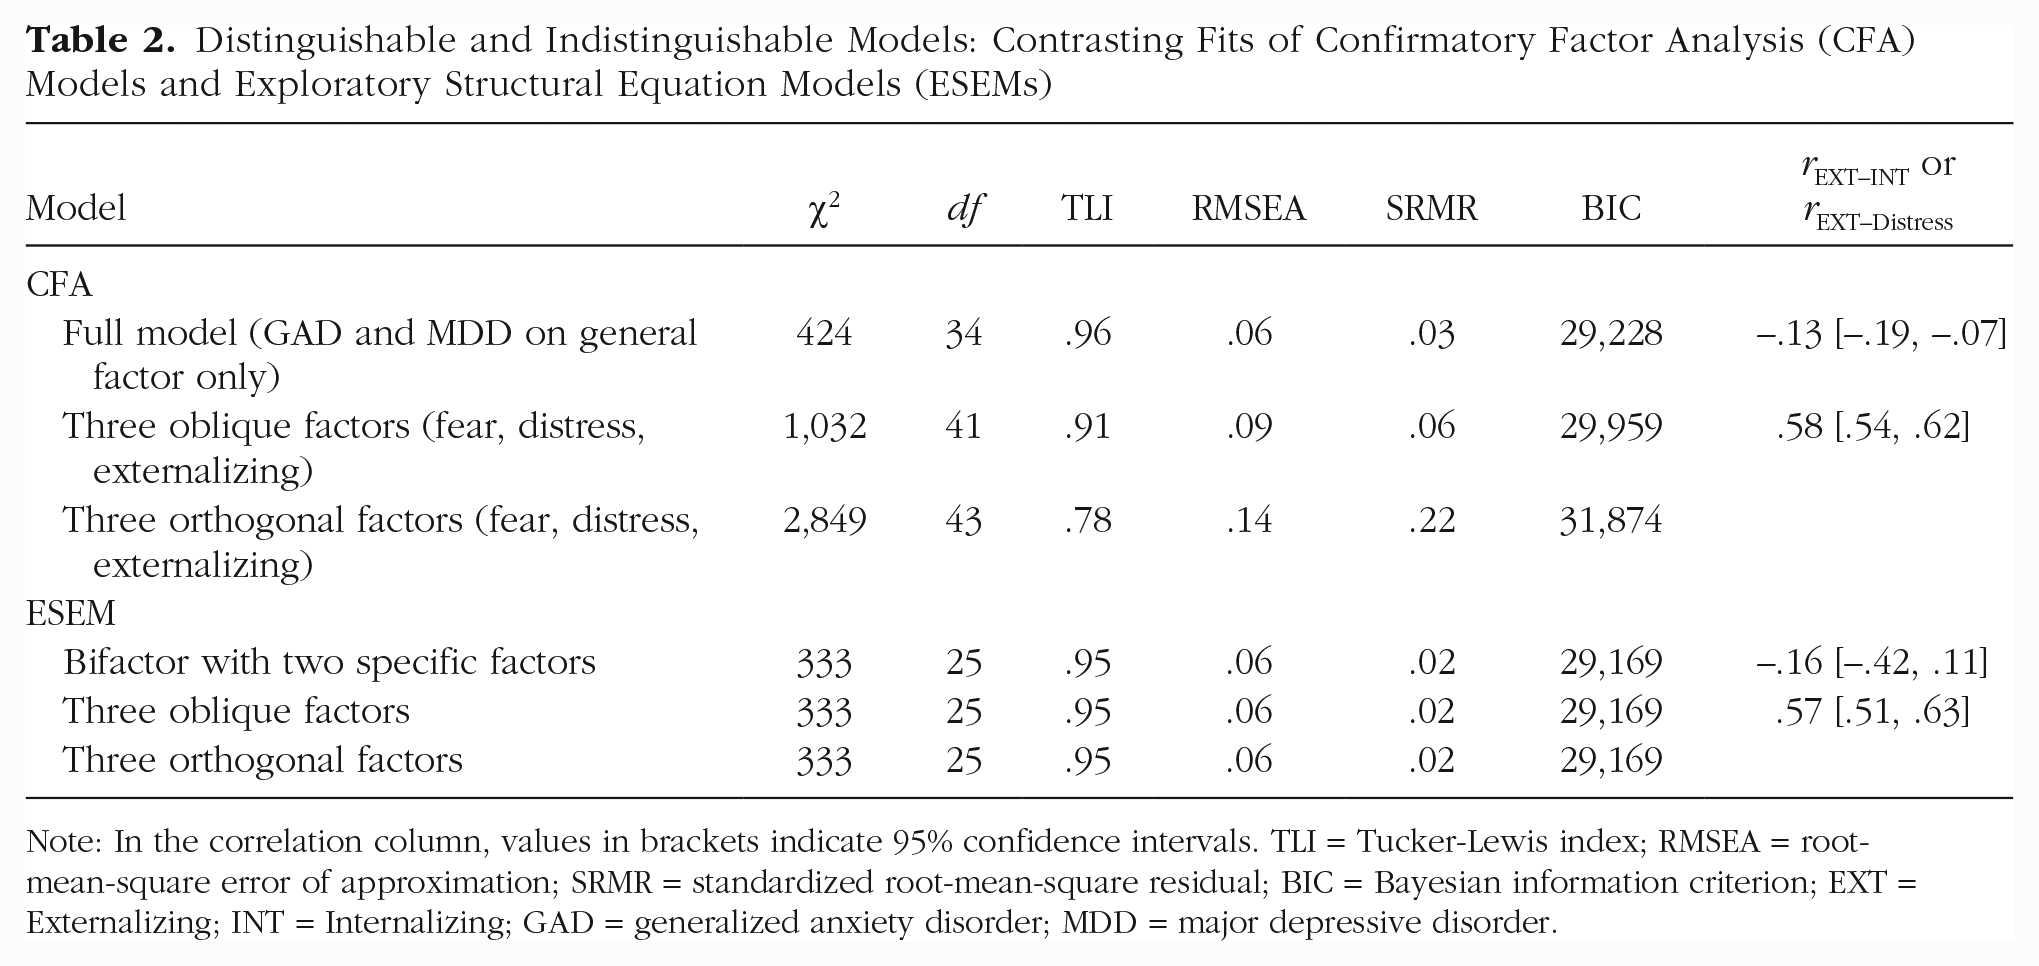
Note: In the correlation column, values in brackets indicate 95% confidence intervals. TLI = Tucker-Lewis index; RMSEA = root-mean-square error of approximation; SRMR = standardized root-mean-square residual; BIC = Bayesian information criterion; EXT = Externalizing; INT = Internalizing; GAD = generalized anxiety disorder; MDD = major depressive disorder.
Discussion
Conclusions and future directions
There are several conclusions that may be drawn from the analyses and results presented here. In addition, on the basis of these results, we have several suggestions for changes that can lead to more consistent, replicable, and comprehensive model
Second, as a corollary to the previous point, researchers need to be wary of using ad hoc or post hoc model modifications to improve model fit, especially the fit of their hypothesized best-fitting model, as chasing model fit is most likely to result in models of the structure of psychopathology that do not replicate across studies or factor analytic methods (i.e., exploratory vs. confirmatory).
Third, researchers should pay greater attention to various model characteristics—such as the magnitude, precision, and consistency of factor loadings and factor correlations—in evaluating alternative structural models of psychopathology. Here, we showed that factor loadings and factor correlations were estimated more consistently, more precisely, and with less bias in correlated-factors than in bifactor models. In addition, the factors in correlated-factors models demonstrated greater parameter invariance, as they were less sensitive to the inclusion or exclusion of any particular indicator than the specific or general factors in bifactor models. Along these lines, the magnitude of factor loadings on the general factor in bifactor models showed considerable variability across the major psychopathology domains and their constituent factors. This relatively weak level of indicator invariance for factors in the bifactor model translates into weaker support for the construct validity and reliability of a general psychopathology construct (Reise, 2012) and supports the notion that specific factors in bifactor models may be untrustworthy as measures of narrow constructs (Kelley & Pornprasertmanit, 2016).
Fourth, although there are good reasons to augment CFAs with exploratory modeling methods (such as ESEMs), given the overreliance on the former (Greene et al., 2022), it is important to recognize the fact that alternative EFA models that are quite different substantively will show identical fit to the data so long as they include the same number of factors. In addition, although replication across samples is always important, this is true to an even greater extent for the findings from EFAs and ESEMs, given their exploratory nature.
Fifth, researchers need to conduct more rigorous tests of the associations of their hypothesized best models and alternative models with external criteria than are currently practiced before declaring victory for the superiority of their hypothesized model. We have illustrated this here by borrowing the concept of common- versus independent-pathway models from the quantitative genetics literature (Neale & Cardon, 2013; see also Forbes et al., 2020; Grotzinger et al., 2022).
Sixth, an extension of the previous point is that researchers need to more systematically contrast the external validity of alternative models to test for differences in the explanatory power of their hypothesized best-fitting model over that of alternative models. We and others (Watts et al., 2019) illustrated this by demonstrating that a bifactor model with two specific Externalizing and Internalizing factors explained no more variance in a set of relevant outcomes than a model with only the two correlated factors. This is akin to the well-known situation in multiple regression in which the variance explained in an outcome by several predictors is decomposed into the variance that is shared among the predictors and the variance that is unique to each predictor. Although inclusion of a general factor in a bifactor model can be useful pragmatically by capturing this common variance, it may often give the illusion that one is gaining something incremental over the correlated factors, both statistically and substantively, which would be misleading (Fried et al., 2021).
Seventh, although we did not have space to examine this issue here, more attention needs to be paid to the appropriate and optimal levels of granularity in the selection of factor indicators in structural models of psychopathology. Diagnoses, symptom dimensions, and individual symptoms have all been used as indicators of higher-order psychopathology dimensions, and each has its advantages and disadvantages. For example, diagnoses are available for very large samples (e.g., ≥ 35,000 in the National Epidemiologic Survey on Alcohol and Related Conditions [NESARC]; Forbes, Greene, et al., 2021; Lahey et al., 2012), but despite the increased statistical power given such a large sample, the factor loadings from some models fitted to NESARC data are quite imprecise, as reflected by large standard errors, and lead to some nonsignificant factor loadings (e.g., Lahey et al., 2012). Many studies have used symptom dimensions as indicators, which can be advantageous because they provide greater information than diagnoses (Faure & Forbes, 2021; Markon, 2010; Markon et al., 2011; van der Sluis et al., 2013; Waszczuk et al., 2020; Wright et al., 2013; Wright & Simms, 2015) but have the disadvantage of often being severely nonnormally distributed and highly skewed and kurtotic. Finally, individual symptoms are the most granular indicators in relatively common use and have the advantages that they better allow one to build structural models “from the ground up” (Forbes, Sunderland, et al., 2021), and building latent-variable models using them can better account for measurement error. A recent study has also shown that in the context of alcohol use disorder, even individual symptoms may be insufficiently granular and lead to spurious evidence for unidimensionality if too few symptoms are used (Watts et al., 2021). In addition, results of a recent study (Forbes, Sunderland, et al., 2021) suggest that symptom-level homogeneity likely inflates the similarity and consequent covariation of some DSM-5 disorders and thus represents a potential source of bias in studies analyzing their patterns of covariation.
Eighth, authors conducting applied research should strongly consider integrating simulations with their analyses of real data to gain a better understanding of which models can be successfully discriminated from each other and which cannot and what model features (e.g., correlated residuals; Greene et al., 2019) might lead to spurious evidence in favor of their proposed model (McNeish & Wolf, 2021). It is fair to say that, despite their utility, simulations are considerably underused in the study of the structure of psychopathology and that the field would benefit from their increased use. This extends to assessments not only of model fit, as used here and elsewhere (Bonifay & Cai, 2017; Preacher, 2006), but also of parameter bias and imprecision.
Ninth, although it may seem rather prosaic, researchers should both examine and provide readers much more detailed results from their studies of the structure of psychopathology than is currently the norm. In our search through 100 articles for this review, we were dismayed at the low rates of reporting of details crucial for adjudicating among alternative structural models of psychopathology. These included factor loadings and standard errors from the best-fitting model (91% and 18%, respectively), factor loadings and standard errors from multiple alternative models (52% and 9%, respectively), and relations of external criteria with factors in alternative models as well as in the best-fitting model (29% of studies that tested multiple models). Given the wide availability of Supplemental Material for most journals, researchers are no longer limited in their reporting of such information as they were in the past.
Tenth, and finally, researchers should test a greater number of alternative models, broadening their evaluation to models that supplement their hypothesized best-fitting model (or models) to avoid confirmatory biases (Fudge, 2014; Platt, 1964). As shown in Figures S5a and S5b in the Supplemental Material, in our review of 100 studies, we found that researchers tested relatively few alternative models (M = 4, SD = 3) and that the number of alternative models tested declined somewhat from 1999 to 2021 (estimates from 4.3 to just over 3.5). In addition to increasing the likelihood of confirmatory bias, testing few models ignores the fact that there may be a set of fungible models with indistinguishable fit (MacCallum et al., 1993; Raykov & Penev, 1999), some of which may end up being better contenders given replication and criteria other than model fit (e.g., relations with criterion variables, utility). Thus, a better analytic strategy might be to test a fuller set of models and select models that the data can more definitively rule out than to “pick a winner.” Rather than trying to decide on the best model, it might be more realistic and useful to say that several models are consistent with the data and await adjudication by further research, whereas other models can be more reliably eliminated (e.g., Kim & Eaton, 2015). Increasing the number of models tested can also aid in examining replicability across studies. Relatedly, researchers should rely less on fit indices based on null-hypothesis significance tests (e.g., χ2 difference tests of exact fit, RMSEA, BIC, comparative fit index, Tucker-Lewis index), given that these scale with sample size and often devolve to context-dependent rules of thumb (Greene et al., 2022; Marsh et al., 2004; McNeish & Wolf, 2021) and endeavor to represent the magnitude of differences in fit among alternative models.
Like all recommendations, the ones proposed here have important caveats. As one example, large and consistent factor loadings may result from selecting items that are highly similar to one another, a psychometrically undesirable strategy. Fortunately, one can guard against this using item-response-theory methods to ensure that factor indicators provide information and reliable measurement across the intended range of the latent psychopathology dimension. This illustrates the fact that although the proposed indices are useful, they are not the only considerations in evaluating the reliability and validity of models of psychopathology.
Limitations
There are several limitations to the current study. First, we did not consider the use of multi-informant data, which may be problematic, especially given its importance in studies of youth psychopathology, nor did we consider how various problems with alternative operationalizations of psychopathology indicators (e.g., the use of diagnoses, symptom dimensions, or individual symptoms) might vary systematically by sample characteristics (e.g., age, sex, ancestry).
Second, in our attempt to provide general guidelines for methods and indices for adjudicating among alternative structural models of psychopathology, we inevitably faced problems with incomplete and inconsistent coverage of psychopathology across studies, which was exacerbated by the differential developmental relevance of psychopathological conditions and constructs across studies.
Third, the simulations we conducted had certain characteristics that may limit their generalizability. These include the use of symptom dimensions as indicators and the modeling of these as normally distributed; the use of only a single large sample size; the use of only two indicators on the Distress factor, which limits the possible models that are identifiable (Loehlin & Beaujean, 2016); and the use of only two sets of true parameter values that were drawn from a single published study (Watts et al., 2019). More extensive simulation studies using alternative true parameter values from alternative best-fitting models using symptoms, symptom dimensions, and diagnoses as indicators at a variety of plausible sample sizes are needed. These will yield a better understanding of the role of each of these factors in model nonconvergence, model fit, bias in the percentage of variance explained in the indicators, and bias and imprecision in estimating factor loadings and factor correlations. These simulations should also yield a clearer picture of the variables involved in adjudicating among alternative structural models of psychopathology and, in distinction to the results presented here, might reveal scenarios in which bifactor models are disadvantaged despite being the true generating model.
Fourth, we focused here on alternative models for the structure of psychopathology. Thus, we did not consider alternative models of psychopathology, such as network approaches (Borsboom & Cramer, 2013; Borsboom et al., 2018; McNally, 2016, 2021; Robinaugh et al., 2020), despite their popularity and increased use (but see Forbes et al., 2017; Forbes, Wright, et al., 2021).
Fifth, similar to many studies in the field, those we reviewed used participants of predominantly European ancestry. Although we believe that the proposed methods and indices for adjudicating among alternative structural models of psychopathology are equally applicable to individuals from all demographic backgrounds, this is a hypothesis that should be evaluated in subsequent research. As a specific example, formal tests of measurement invariance can be leveraged to elucidate similarities and differences in the structure of psychopathology and the validity of the measures thereof across various groups, including sex and ancestry.
Implications for modeling the structure of psychopathology
Deciding among rival models of psychopathology is integral to many areas of psychopathology research. How can we hope to find the underlying genetic and environmental risk factors, neurobiological underpinnings, course and outcome, and most effective treatments for dimensions of psychopathology if we do not know how best to classify those dimensions? There are numerous unresolved issues in the structure of psychopathology that bear on this question. Here, we focused on CFA, but there are many other analytic methods (e.g., various forms of EFA, hierarchical clustering) that are potentially useful for elucidating the structure of psychopathology. Another issue is illuminating the “dark matter” of psychopathology, namely better understanding the placement in a hierarchical taxonomy of psychopathology of conditions the classification of which is unclear (e.g., ADHD, mania, neurodevelopmental disorders, obsessive-compulsive disorder, and dissociation). One reason for the uncertainty surrounding the classification of these conditions is that they are likely multidimensional, a hypothesis that should be tested in future research. These conditions also reflect the balance between well-established and more provisional aspects of a hierarchical taxonomy such as HiTOP, and analytic methods designed for explicitly investigating this balance (e.g., Procrustes or target rotations; Browne et al., 2002; Zhang et al., 2019) may be particularly useful in clarifying the placement of such conditions. Finally, many contemporary models of psychopathology, such as HiTOP, are hierarchical, with lower-level dimensions of psychopathology nested within higher-order dimensions of greater generality. This highlights the importance of determining the relevance of different levels of the hierarchy for different purposes (e.g., etiology, utility), as well as for research on psychopathology more generally.
Another application of the methods and indices proposed here is to investigate the genetic (and environmental) etiology of psychopathology. Valid classification is integral to finding genes and biological pathways that underlie both higher- and lower-order psychopathology dimensions. Although several studies have used novel analytic methods to examine the structure of psychopathology at the genomic level (Grotzinger et al., 2022; Lee et al., 2021; Waldman et al., 2020), each of these studies has found a different higher-order dimensional structure of psychopathology using largely the same data sets. In addition, although none of these studies found evidence for a general psychopathology factor at the genomic level, multiple studies have reported single-nucleotide polymorphism (SNP)-based heritabilities for such a general factor (Neumann et al., 2016; Riglin et al., 2020). It is imperative to better establish the higher-order phenotypic and genetic dimensional structure of psychopathology in order to find the genes and biological pathways underlying these dimensions, as well as their SNP-based heritabilities and genetic correlations with relevant variables.
An overarching theme of this article is that alternative structural models of psychopathology are testable and subject to revision rather than set in stone. For example, an important and often unappreciated feature of the HiTOP framework (Haeffel et al., 2022) is that it is a dynamic entity, one subject to revision in light of new evidence relevant to the classification of psychopathology (DeYoung et al., 2022). The methods and indices described here should facilitate this effort by helping improve studies of the structure of psychopathology that will form the basis of such proposals for revision.
In sum, we recommend that when adjudicating among alternative structural models, psychopathology researchers should supplement the use of fit indices by examining the median or mean, standard deviation, and standard errors of factor loadings for each of the factors within each of the models fit. As a practical matter, it may make sense to also average these indices across the factors in the model and then contrast the averages across the various models examined. It also would be advantageous to examine the sensitivity of the factor loadings on each factor to the inclusion or exclusion of each of its indicators and to report associations with relevant causes or outcomes not only for the best-fitting model but also for alternative models. Using these criteria to augment conventional fit indices and having greater awareness of the fit propensity of alternative models should help increase the validity and replicability of such models and advance progress toward a consensus model of the structure of psychopathology. To return to where we started this article, although Scott Lilienfeld’s research interests and publications branched out far and wide beyond his early work on classification and comorbidity, we like to think that he would approve of our suggestions here and view them as steps toward constructing more valid and replicable models of psychopathology.
Supplemental Material
sj-docx-1-cpx-10.1177_21677026221144256 – Supplemental material for Recommendations for Adjudicating Among Alternative Structural Models of Psychopathology
Supplemental material, sj-docx-1-cpx-10.1177_21677026221144256 for Recommendations for Adjudicating Among Alternative Structural Models of Psychopathology by Irwin D. Waldman, Christopher D. King, Holly E. Poore, Justin M. Luningham, Richard M. Zinbarg, Robert F. Krueger, Kristian E. Markon, Marina Bornovalova, Michael Chmielewski, Christopher Conway, Michael Dretsch, Nicholas R. Eaton, Miriam K. Forbes, Kelsie Forbush, Kristin Naragon-Gainey, Ashley Lauren Greene, J. D. Haltigan, Masha Ivanova, Keanan Joyner, Katherine M. Keyes, Kevin M. King, Roman Kotov, Holly Levin-Aspenson, Thomas Olino, Jason A. Oliver, Christopher J. Patrick, David Preece, Lauren A. Rutter, Martin Sellbom, Susan South, Nicholas J. Wagner, Ashley L. Watts, Sylia Wilson, Aidan G.C. Wright and David Zald in Clinical Psychological Science
Footnotes
Acknowledgements
We thank Niels Waller for his very helpful comments on an earlier draft of this article. This article is dedicated to the memory of Scott Lilienfeld, whose 40-year friendship and 30-year collaboration enriched the first author’s personal and professional life to an immeasurable extent. Scott’s contributions to research, teaching, mentoring, and service in psychology are legendary. We miss the opportunity to have had Scott discuss, disagree, and kibitz with us over aspects of this article.
Transparency
Action Editor: William O’Donohue
Editor: Jennifer L. Tackett
Author Contributions
ORCID iDs
References
Supplementary Material
Please find the following supplemental material available below.
For Open Access articles published under a Creative Commons License, all supplemental material carries the same license as the article it is associated with.
For non-Open Access articles published, all supplemental material carries a non-exclusive license, and permission requests for re-use of supplemental material or any part of supplemental material shall be sent directly to the copyright owner as specified in the copyright notice associated with the article.