
Abstract
Humans learn from both successful and unsuccessful experiences, because useful information about how to solve complex problems can be gleaned not only from success but also from failure. In this paper, we propose a method for investigating this difference by applying Preference based Inverse Reinforcement Learning to Double Transition Models built from replays of StarCraft II. Our method provides two advantages: (1) the ability to identify integrated reward distributions from computational models composed of multiple experiences, and (2) the ability to discern differences between learning by successes and failures. Our experimental results demonstrate that reward distributions are shaped depending on the trajectories utilized to build models. Reward distributions based on successful episodes were skewed to the left, while those based on unsuccessful episodes were skewed to the right. Furthermore, we found that players with symmetric triple reward distributions had a high probability of winning the game.
Introduction
In everyday life, we all learn through experience. Experiential learning has a long philosophical history, from Aristotle (Crosby, 1981) to recent theorization and investigation by David A. Kolb, who focuses on self-directed learning, planning and self-initiated goal setting, and self-development under diverse situations (Kolb, 2015). The characteristics, types, structures, and manifestations of perceived knowledge, experience, and learning cycles have been addressed by (Helate et al., 2022). Experiential learning has recently garnered more attention, as new state of the art technologies including virtual reality enables learning to occur beyond traditional temporal and spatial constraints (Kwon, 2019). Among the many factors which impact learning performance, we focus here on the difference between learning by successful versus failed experiences through computational investigations.
Inverse reinforcement learning (IRL) has been employed to reveal reward distributions from demonstrations in many key domains. In general, these demonstrations have been considered successful. However, some demonstrations can be unsuccessful but useful since they can reveal helpful information. Furthermore, they require little effort and are sometimes easier to access than successful ones (Shiarlis et al., 2016). Therefore, utilizing both successful and unsuccessful experiences and identifying the gap between learning from successes and learning from failures is important in IRL, as this can serve as part of Explainable Artificial Intelligence (XAI), which responds to the need for increased transparency and trust in AI for large-scale social, ethical, and safety application including autonomous driving, weather simulations, medical diagnosis, behavior and facial recognition, business optimization, and security enhancement (Wells & Bednarz, 2021).
In this paper, we propose a method for investigating the difference between learning by successful and unsuccessful experiences through examining reward distributions identified by Preference based Inverse Reinforcement Learning (PIRL) based on Double Transition Models (DTMs) built from StarCraft II replays. Comparing against prior inverse reinforcement algorithms which had not discerned such a difference among experiences, our method can provide both integrated and fractional reward distributions revealed by PIRL.
The integrated reward distribution describes an individual decision maker performing the task under a dynamically changing environment as a whole. Fractional reward distributions further contribute to sub-models of an individual from diverse perspectives. By assuming different perspectives to be developed from different experiences, we built DTMs of human players from successful and unsuccessful experiences and analyzed them through PIRL to see the gaps across diverse perspectives. To implement this idea, we built multiple DTMs from more than a hundred StarCraft II replays, revealed reward distribution by PIRL, and investigated these reward distributions.
Experimental results show that reward distributions were shaped differently depending on the quality of experiences utilized for modeling. In particular, the fractional reward distributions relevant to the successful episodes were skewed to the left, while the others were skewed to the right. With respect to the individual’s performance measured by win ratio, a high negative correlation between symmetry of triple reward distribution and win ratio was observed. The players who had symmetric reward distribution were found to win the game with high probability.
This paper is organized as follows: First, we provide the theoretical background for our approach including Markov Decision Process (MDP), DTM and PIRL in addition to a brief description of StarCraft II (SC2). Next, we provide the experimental results obtained by applying PIRL and DTM to the SC2 dataset. Finally, we present our conclusion and future directions.
Method
In this section, we provide the theoretical foundations of our approach including MDP, DTM and PIRL. In addition, a short description of SC2 has been included.
Markov Decision Process
The MDP formulates the state transition, under Markov property, that the next state is determined only by the current state and the action taken at that time and is independent of all other previous states and actions, while addressing its utility scheme appropriately.
The MDP can be described by five elements
Double Transition Model
Computational cognitive modeling aims to understand human decision-making processes by simulating cognitive processes that lead those decisions. Among diverse variations of computational models based on rationality, the DTM (Yu & Santos, 2016) has been developed to describe the process of human opinion formation and change and represent the human decision-making process in multiple domains. It assumes that the human decision-making process is a MDP where decisions are a series of actions taken by individuals. As the opinion is formed and changed through transitions of nodes of cognitive states, a human decision-making process is demonstrated by traversing these nodes, where graphs of DTMs are composed of nodes representing the cognitive states and edges connecting these nodes. The nodes are of two types: one for query (question asking) and the other for memory (look up/retrieval). The interconnection between these two types of nodes is utilized to demonstrate human cognitive process through traversing memories or queries. Previously, DTMs have been used for various human decision-making processes across multiple domains, but the partial DTM relevant to specific memories and queries has not been fully investigated yet. In this study, we focused on the partial DTM or a subset of DTM associated with specific experiences utilized for modeling.
Preference based Inverse Reinforcement Learning
The PIRL is an IRL algorithm to select the reward function that maximally spaces out the trajectories based on preference as shown by Eq. (1).

where all trajectories (

Linear expected rewards (LERs) in Eq. (3), where K denotes the length of trajectory
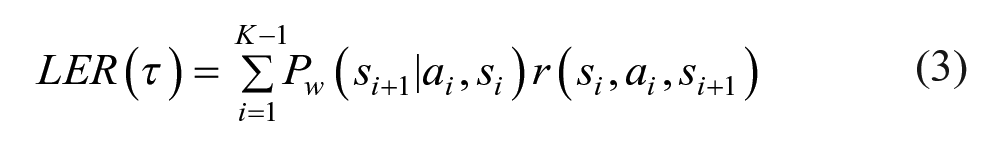
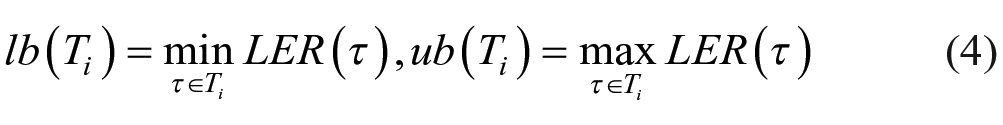
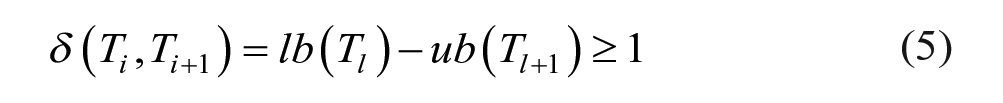
We computed
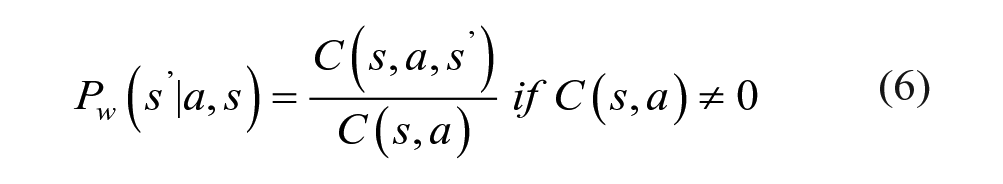
where
The traditional triple rewards (i.e.,

StarCraft II (SC2)
SC2 is a real time computer video game, made by Blizzard Entertainment, in which players are expected to develop strategies for defeating an enemy through gathering resources, building bases for combat, and attacking the opponent.
A near infinite number of situations where a wide variety of actions are possible at any moment can be created with a high level of complexity. Researchers in artificial intelligence have utilized SC2 to test machine learning algorithms and to evaluate their performance (Lee & Ahn, 2021).
Results
We downloaded the IEM 2022 SC2 dataset from (https://lotv.spawningtool.com/replays/?pro_only=on) where 264 replays of 36 players were included, and we used the sc2reader library to analyze the replays. The DTMs of SC2 players were built from the records of actions and events and used for uncovering reward distributions through PIRL. We deidentified the original dataset by changing all players’ names into player #, which is shown on the x-axis in Figure 1 and referred throughout this paper. The reward distributions of 105,507 numeric values were revealed and explored here.
Win Ratio and Action Utility.
First, we computed individual performance by win ratio and action utility. Second, we identified two sets of actions taken frequently and infrequently across players, and computed Pearson correlations between the number of popular actions taken by player, action diversity and individual performance. Finally, we explored whether the reward distributions driven by PIRL based on DTMs were associated with individual performance.
Individual Performance
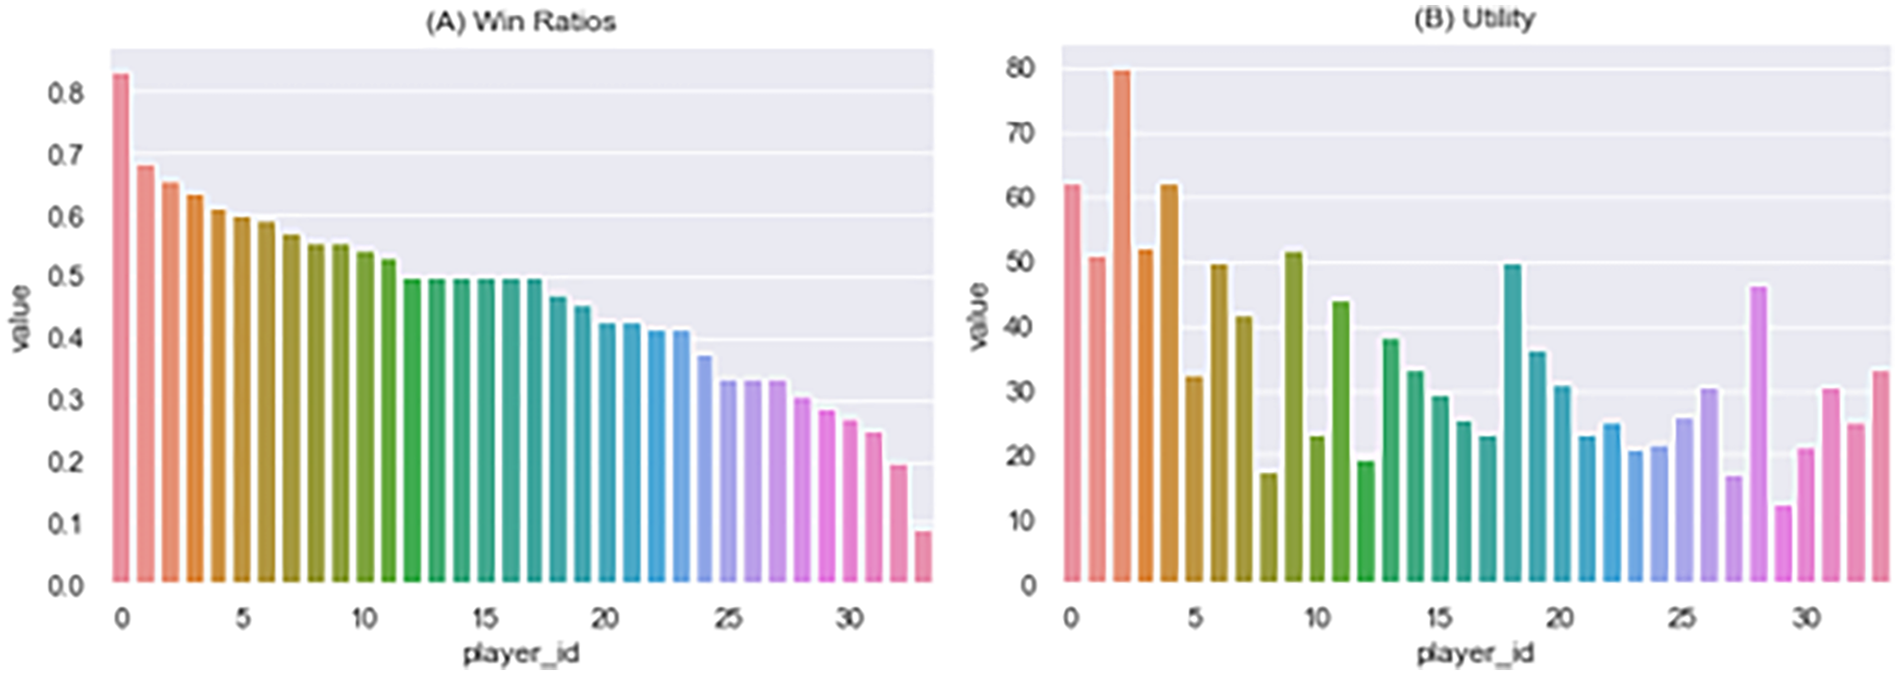
For individual performance, we computed win ratio and action utility as shown by Figure 1. The win ratio in (A) was computed by the number of games won over the total number of games played by a player. To address human players with positive win ratio, the trajectories from only 34 out of 36 players were used, as two players had never won any game during the competition. The win ratios of 34 players were ranged from 0.83 to 0.09 with a mean of 0.464 and standard deviation of 0.153.
The action utility in (B) was computed from the total number of actions divided by the unique number of actions utilized for DTMs. The action utility measures how much each action was utilized repeatedly by player on average. The mean and standard deviation of the action utility was 34.963 and 15.452. The actions were utilized repeatedly from 12.281 (minimum) to 79.889 (maximum). The action utility was found to be correlated with win ratio by 0.586 (p=0.003). They were somewhat correlated with each other, but not high enough to assert that the players with high action utility have high probability of winning.
Action Analysis
The actions are a key to understanding the different characteristics of individual decision makers. We examined the most popular and unpopular actions across players and whether these actions were correlated with individual performance.
51523 total actions were gathered from all 34 players, and 178 actions were identified as unique. The top 10 frequent and infrequent actions across players were listed in Table 1.
The most and the least Frequent Actions Overall.

We found that the actions of [Attack, Train, Build, Gather] were the most popular, where some actions had wide variety. The Attack and Gather were always named as such, while Build and Train had 45 and 25 variations. For instance, the action Build was specified by associated resources, such as BuildPylon, BuildRefinery, BuildSupplyDepot, etc. Similarly, the action Train was specified through variations such as TrainSCV, TrainProbe, TrainMarine, etc.
Figure 2 is a Pearson correlation heatmap where each cell represents the amount of correlation (measure of dependence) between column and row respectively. From A to H denote the parameters of actions taken by player and individual performance. In detail, A, B, C and D denote the number of attack, train, build and gather actions taken by players respectively. E represents the win ratio, F denotes the number of unique actions, G represents the number of all actions taken, and H denotes the action utility.

Correlation Analysis.
The highest correlation of 0.883 between B and C demonstrated the actions of train and build were taken together as expected by their contents. The second highest correlation of 0.808 between G and H showed players taking more actions overall were found to use these actions repeatedly. The lowest corelation of -0.042 between B and H and the second lowest correlation of 0.14 between B and E demonstrated that the number of trains taken was rarely correlated with win ratio and action utility.
Reward Analysis
In addition to actions, events were also important to identifying individual differences between SC2 players. We integrated the records of actions and events through building DTMs and examined reward distributions obtained through PIRL.
The events utilized for DTMs were categorized into four types: Unit, Camera, Command and Control. The Unit events included UnitBornEvents, UnitInitEvents and UnitDoneEvents. In all Unit events, we counted workers and armies active within specified time windows. Time windows were set by the time point when an action was taken by the player. The Camera events were generated whenever the player camera moved, zoomed, or rotated. The Command events were generated when a player issued a command to a unit or group of units. The Control events were recorded when a player action was modified or accessed a control group.
From the DTMs built from the records of events and actions, we uncovered three types of reward distributions using PIRL. The traditional triple rewards (i.e.,
Based on this reward analysis, we aimed to figure out 1) how is learning by successful experiences different from learning by unsuccessful experiences?; 2) can we use the difference caused by varying experiences to identify the characteristics of models?; and 3) what are the benefits of reward distributions identified by PIRL?
To estimate the shapes of reward distributions, we examined the third and the fourth central moments of reward distributions revealed by PIRL from DTMs of SC2 players. The third moment (i.e.,
Figure 3 shows the Pearson correlation between those measures and win ratios. In the top three plots, the x-axis denotes the kurtosis computed from triple, target fractional and non-target fractional reward distributions respectively. The y-axis shows the win ratios. The kurtosis of triple rewards was gathered in the negative side, while those of fractional rewards were spread in the positive side. Compared to the target fractional reward distributions, non-target factional reward distributions were spread more widely.

Shape of Reward Distribution vs. Win Ratio.
In the bottom three plots, the x-axis denotes the skewness computed from triple, target fractional and non-target fractional reward distributions respectively. The y-axis shows the win ratios. The skewness of triple rewards was correlated significantly with win ratio in the negative direction, and we found a correlation of -0.92 (p=1.24 e-14), showing that players having symmetric triple reward distributions had high probabilities of winning the game. In addition, the skewness of target fractional reward distributions was mostly less than zero, while that of non-target fractional reward distributions was greater than zero.
By examining the p-value, we found that the correlations between skewness from target fractional rewards and win ratios were quite inconsistent, although the correlations between skewness from non-target reward distributions and win ratios, and those between skewness from triple reward distributions and win ratios, were quite consistent as shown by Table 2, where p-values were inside parenthesis. The leftmost column denotes the skewness measure used to compute the correlation, and the other three columns show the appropriate measures computed with respect to the reward distributions specified.
Correlation Analysis by Partition.

To explore the inconsistent correlation with respect to target fractional reward distributions further, we subdivided SC2 players into two sub-groups according to individual contribution to the overall correlations. To identify individual contribution to the overall correlation, first, we computed the correlation between skewness of reward distributions and win ratios from all 34 players and compared it against the correlation without an individual one by one. If the correlation of all players was bigger than the correlation without an individual under consideration, then we assert the individual contributed to the overall correlation positively and vice versa.
With respect to triple reward distributions, those with less skewness or smaller kurtosis were likely to win more frequently in general. It was noted that the correlation between the kurtosis and the win ratio of the subset of 19 players was found to be statistically insignificant. For target reward distributions, the positive correlation between kurtosis and win ratios for 19 players and the negative correlation between skewness and win ratio for 17 players was statistically significant. For non-target factional reward distributions, both measures were negatively correlated with win ratio in all subsets.
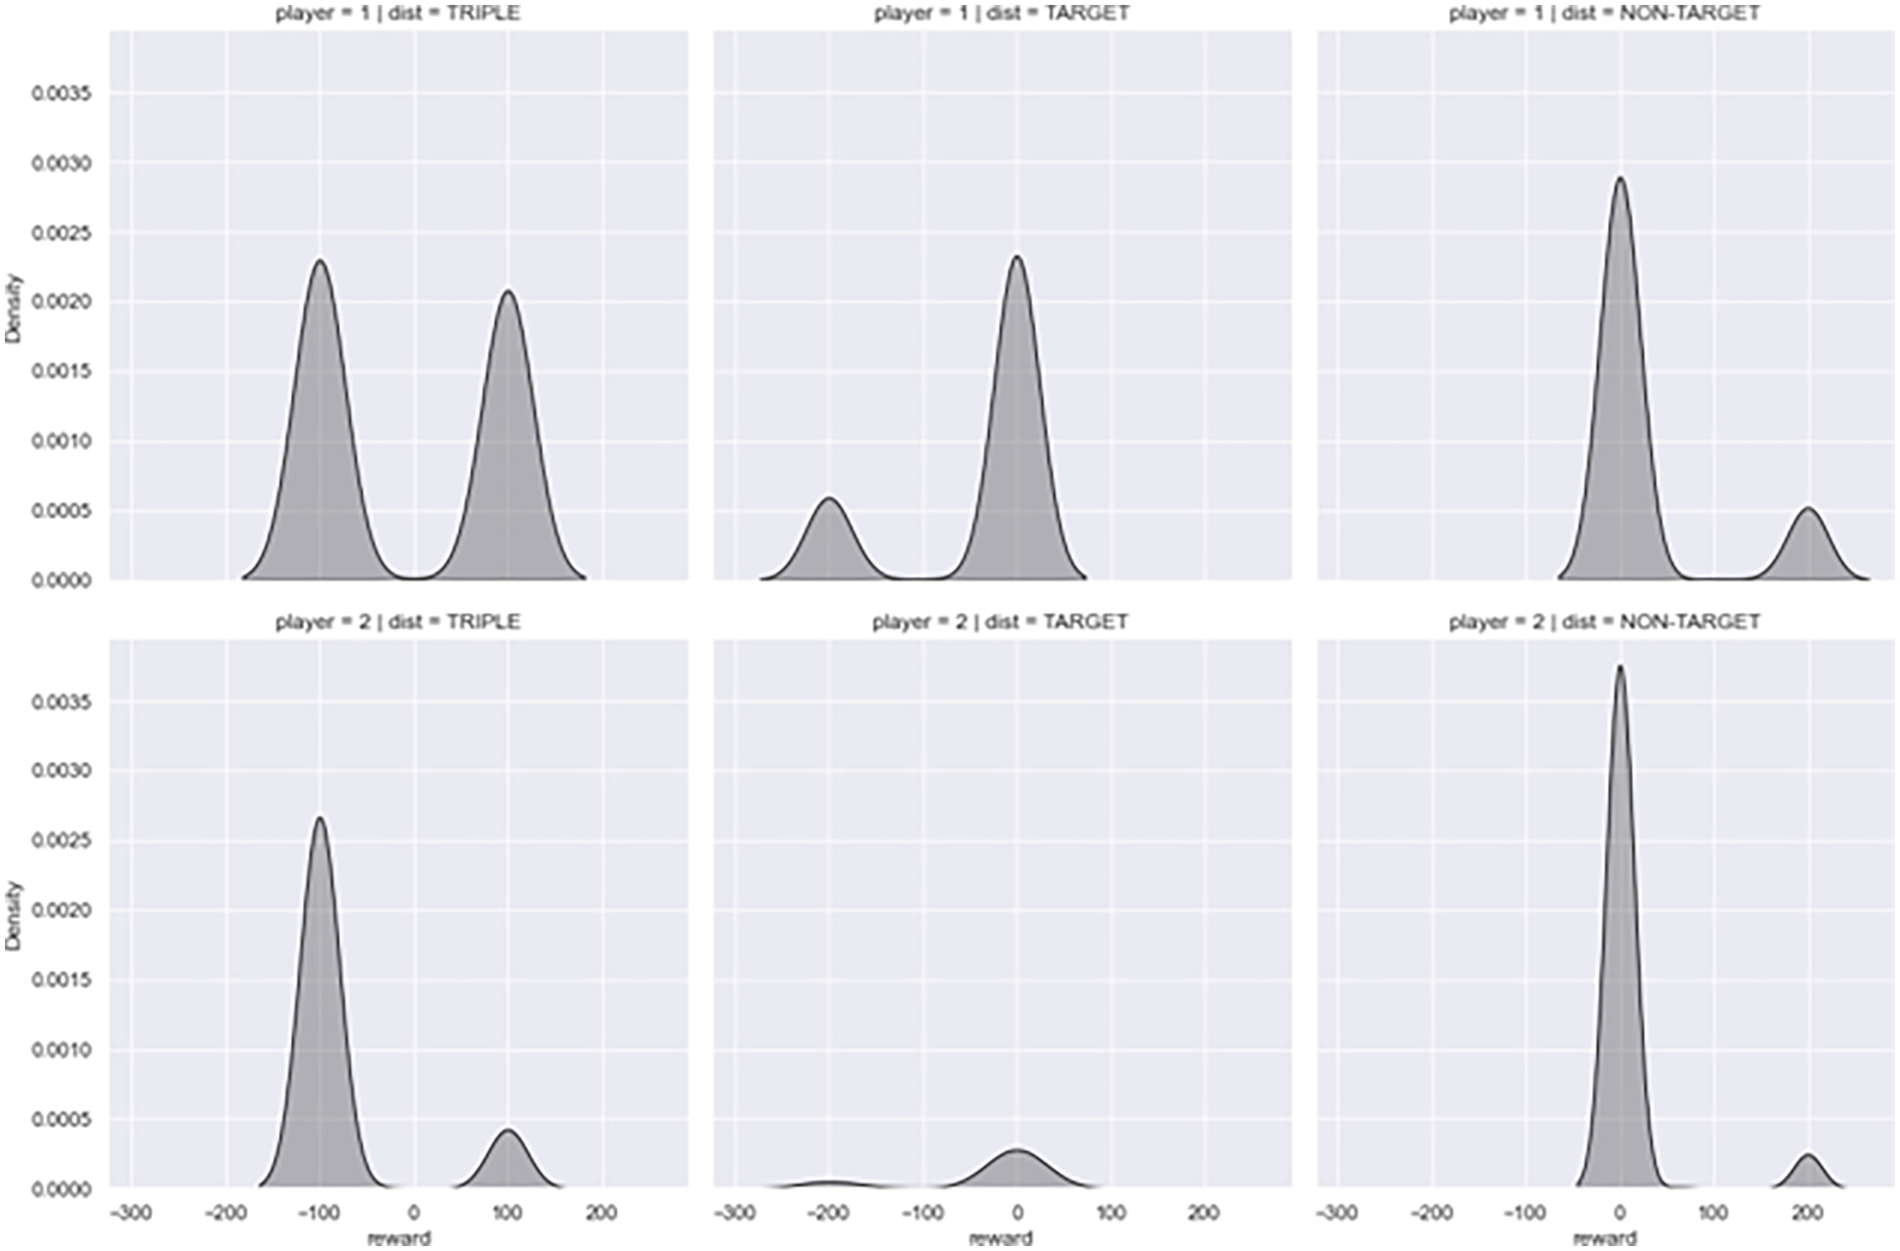
To validate our findings associated with reward distributions of SC2 players, we chose two players randomly: one with a high win ratio of 0.6 (Player #5) and the other with a low win ratio of 0.09 (Player #33), as shown by Figure 4. On the top row, three reward distributions of Player # 5 were displayed, while those of Player #33 were shown on the bottom. In the left most column of the triple reward distributions, the rewards of Player #5 on top were more symmetric than those of Player #33 on bottom. In both top and bottom rows, the target fractional rewards shown in the middle column were skewed to the left, while the non-target fractional rewards shown in the rightest column were skewed to the right.
Reward Distributions of Player #5 and #33.
By examining all players, we confirmed that all target fractional rewards were skewed to the left, and all non-target fractional rewards were skewed to the right, which were anticipated by the plots on the bottom of Figure 3. In addition, by examining all possible pairs of players, we found that 341 out of 561 pairs supported that players with more symmetric triple reward distributions had higher probabilities of winning the game.
In summary, we found that 1) the fractional reward distributions from successful experiences and unsuccessful experiences were skewed in opposite directions. 2) The high correlation between reward shape and individual performance can be used to estimate some characteristics of individuals through analyzing reward distributions driven by PIRL.
Discussion
We have explored the reward distributions revealed by PIRL based on DTMs built from SC2 replays and found that the reward shape was relevant to experiences utilized for modeling and correlated with individual performance.
By examining the third and the fourth central moments of reward distributions, we found that the fractional reward distributions relevant to successful episodes were skewed to the left side, compared to those relevant to unsuccessful episodes skewed to the right side. We also found that the players those who had symmetric triple reward distributions had a high probability of winning.
The findings in this paper were limited to the SC2 players who had participated in a specific competition. However, our method of analyzing human behaviors is general and applicable to any domain.