



Abstract
This study contributes to the growing literature on momentum and overreaction effect by investigating the same within the framework of the Indian stock market. Based on the most adopted methodology that employs monthly data, the empirical results derived confirm the existence of momentum and long-term overreaction effect in the Indian stock market. The overall results from the study are consistent with DeBondt and Thaler (1985) and Jegadeesh and Titman (1993) findings for the US stock market. In addition, we tested the profitability of momentum and contrarian strategies under different market states. The results indicated a strong relationship between the state of the market and momentum profitability, wherein strong momentum profits were observed following an ‘up’ market. On the contrary, long-term contrarian strategies were found to be stronger following a ‘down’ market in the Indian stock market. The market-dependent asset pricing model failed to explain excess momentum profits in the Indian stock market. The evidence from the study provides partial support to various behavioural models to explain these effects in the Indian stock market. However, there exists a need to develop a single behavioural model that could explain these anomalies completely in the emerging markets like India.
Introduction
A considerable and growing literature deals with the empirical evidence which can predict future stock return on the basis of past stock returns. Such evidences sit uneasily within the paradigm of efficient market hypothesis (EMH). In more recent times, this has resulted in critical re-examination of EMH as well as capital asset pricing model (CAPM). Among these, momentum and long-term reversal effect (also known as overreaction effect) have attracted special attention among both investors and academicians. DeBondt and Thaler (1985) were the first to document a reversal pattern in the US stock market, where past long-term poor performing stocks outperformed the past winning stocks over longer time horizons. A contrarian strategy takes advantage of such reversal and is constructed by buying past long-term losers stocks and selling past long-term winner stocks. In contrast, Jegadeesh and Titman (1993) documented the profitability of momentum strategy that is based on purchasing past short-term winner stocks and selling past short-term loser stocks, exploiting the short-term stock return continuation or momentum effect. The success of both these strategies has attracted large attention among the academicians. Subsequent studies also supported the profitability of momentum and contrarian strategies in the US and other developed markets. A number of explanations have been put forward to explain the existence of such momentum and contrarian profits. However, the source and interpretation of these profits are still much in debate.
The current study extends the literature by providing further insights into the momentum and long-term overreaction effect using the stock price data from the Indian stock market. The choice of Indian market is motivated by the fact that it has been the fastest growing emerging market over the last few decades. The past studies provide mixed results about the validity and performance of momentum and long-term contrarian profits within the context of emerging stock markets. For example, Rouwenhorst (1999), Griffin, Ji and Martin (2003), Chui, Titman and Wei (2010) and Naranjo and Porter (2007) reported weak momentum profits among the emerging stock markets, while strong momentum profits were observed by Cakici, Fabozzi and Tan (2013) for the same. Such unanimity among the researchers warrant further examination of momentum and long-term contrarian profitability in the emerging stock market. One of the biggest advantages of analysing the Indian stock market is the access to its large base of stocks that are more liquid in comparison to the other emerging markets. Furthermore, for a country like India, it is more important to study such effects as it is a vibrant emerging market that possess characteristics of both developed and developing market. In addition, the study investigates the profitability of both momentum and contrarian strategy under different market conditions, which to our knowledge has not been studied before using the Indian stock market data. The significance of such study is to develop different investment strategies following different market conditions to maximize profits.
The remainder of the article is structured as follows: Section 2 gives a brief review of academic literature followed by Section 3 that gives detailed discussion on data and methodology employed. Section 4 provides various empirical results that are obtained by applying multiple statistical procedures followed by discussion in Section 5. Section 6 concludes the study.
Literature Review
Overreaction and Momentum Effect: An Overview
The overreaction hypothesis was first documented by Tversky and Kahneman (1974) and later used by DeBondt and Thaler (1985) for stock market. DeBondt and Thaler (1985) argued that stock price usually reversed itself after a sharp increase or decrease in the price. As a result, investors can earn unusual profits in a longer time horizon by buying undervalued stocks and selling overvalued stocks. To verify the hypothesis, DeBondt and Thaler (1985), using the NYSE monthly return data, compared the performance of two groups—extreme losers (loser portfolio) and extreme winners (winner portfolio) over the period from 1933–1982. Empirical results of the study showed that on an average the loser portfolio outperformed the market by 19.6 per cent and winner portfolio underperformed the market by 5 per cent over a longer hold, generating a statistically significant return differential of 24.6 per cent.
Jegadeesh and Titman (1993) shed new light on the influential work of Debondt and Thaler (1985) and found evidence in favour of short-term continuation pattern in stock returns that exhibit reversals in a longer time horizon. Jegadeesh and Titman (1993) were among the first few researchers to observe that stocks with the highest return over the last 3–12 months subsequently outperform the stocks with lowest return over the same period. They reported strong momentum effect in the American stock markets with an average monthly return of 1 per cent.
Due to the increased attention towards the profitability of momentum and long-term contrarian strategy in the US stock market, the same were tested in other international markets as well. Baytas and Cakici (1999) examined seven developed markets including the USA, Canadian, Japanese, French, Italian, German and UK and observed strong evidence of overreaction effect over two- and three-year period for all countries except the USA and Canada. Similarly, Alonso and Rubio (1990) for Spanish, Stock (1990) for German, Campbell and Limmack (1997) for the UK, Swallow and Fox (1998) for New Zealand, Fung (1999) for Honk Kong, Chiao and Hueng (2005) for Japanese and Pepelas (2008) for the UK stock markets confirmed the presence of long-term overreaction effect. Similarly, Rouwenhorst (1998, 1999) examined profitability of momentum strategy in 12 different European countries and concluded that the momentum profits were not limited to a particular market, but was present in all 12 European markets. More recently, Fama and French (2012) reported strong momentum profits for 23 developed stock markets and Cakici, Fabozzi and Tan (2013) for emerging markets. In addition, other researchers have individually checked different stock markets over different time periods, and have consistently reported positive abnormal returns after implementing momentum strategies. Some of these include Rey and Schmid (2007) for Swiss, Chelley-Steeley and Siganos (2008) for the UK, Du, Huang and Liao (2009) for Taiwan, Phua, Chan, Faff and Hudson (2010) for Australian and, Alphonse and Nguyen (2013) for Vietnam stock markets. In the Indian context, however, the studies are limited. Sehgal and Balakrishnan (2002), Chui et al. (2010), Ansari and Khan (2012) and Dhankar and Maheshwari (2013a) provide evidence of strong momentum effect in the Indian stock market. On the other hand, Locke and Gupta (2009) and Tripathi and Aggarwal (2009) provide evidence of strong overreaction effect in the Indian stock market.
Sources of Contrarian and Momentum Profits
The significant momentum and contrarian profits in various international stock markets have encouraged several researchers to find the sources of these effects (Dhankar & Maheshwari, 2013b). Many alternative explanations for such outcomes have been proposed by the academicians. They include time varying risk (Chan, 1988), size effect (Zarowin, 1990), bid and ask biases (Conrad & Kaul, 1993), industry returns (Moskowitz & Grinblatt, 1999), volume (Lee & Swaminathan, 2000) and microstructure related effects such as bid–ask biases, illiquidity, etc. (Conrad & Kaul, 1998). However, none of these explanations have been completely successful in explaining these two effects. A number of studies have reported results that go against these explanations for various stock markets. This has led to the search for new models and ideas that could predict and explain various market anomalies and behaviour from various psychological biases. Various behavioural models were proposed that explains momentum and long-term contrarian returns as the result of irrational trading by investors under fundamental values.
Daniel, Hirshleifer and Subrahmanyam (1998) proposed two patterns from psychology as an explanation for the momentum effect and long-term reversals: overconfidence and self-attribution bias. They assumed that investors are overconfident about their private information and overr-eact to that. Due to self-attribution bias, the investor’s overconfidence increases following the arrival of confirming news. This increase in overconfidence promotes initial overreaction and generates return momentum. The overreaction in prices will eventually be corrected in the long run as investors realized their mistakes, leading to long run reversals.
Barberis, Shleifer and Vishny (1998) use different psychological behaviour to explain stock momentum in the short run and reversal in the long run. Barberis et al. (1998) showed that conservatism bias lead investors to underreact to information initially. Due to the conservatism bias, the price of the firm rises too little as investors do not react sufficiently to the news and push the prices of stock below its fundamental value. However, prices will slowly adjust to the new information and hence cause momentum. In addition, investors also suffer from representative heuristic, due to which they mistakenly believe that a series of good earnings in the past is a representative of good earnings potential in the future. This behavioural tendency will lead to long horizon negative returns for stocks with consistently high returns in the past. In combination with representative heuristics, conservatism bias will lead to initial price under-reaction to good news that will eventually overshoot the fundamental values due to the representative heuristics.
Although Hong and Stein (1999) also seek to explain the same phenomenon as Barberis et al. (1998), they do not base their model on any specific behavioural elements. They consider the presence of two groups of investors: the news watchers and the momentum traders who have different information but act rationally given their information. News watchers base their decisions on the fundamental news available to them at a certain time. The prices are initially driven by news watchers. Thus, news information does not get fully incorporated into the market, giving rise to the under-reaction. The news gradually gets transmitted to the market where momentum traders react to the news and push the prices above the base values. However, in the long run, prices revert to the base values.
A recent important finding by Cooper, Gutierrez and Hameed (2004) put forward an explanation of the momentum and subsequent reversal based on the market state or conditions. They argued that momentum strategies generate stronger positive returns following an ‘up’ markets as compared to ‘down’ market, since an investor’s overconfidence is higher in the ‘up’ market. They classified the market state as ‘up’ and ‘down’ based on past three year returns. Their findings are considered indirect validating evidence in favour of overreaction based behavioural theories of Daniel et al. (1998) and Hong and Stein (1999). Cooper et al. (2004) claimed that under the influence of self-attribution bias, investors will falsely attribute any increase in stock prices, post market gains, to their own skills and judgement. As a result, the overreaction is stronger in the wake of ‘up’ market, generating stronger momentum profits. In the Hong and Stein (1999) model, it is the change in risk aversion of momentum traders that increases the momentum profits following an ‘up’ market.
However, further empirical evidences relating momentum to market conditions have produced mixed results. Griffin et al. (2003) reported momentum profits in both good and bad state of the economy. Similarly, Chou, Wei and Chuang (2007) documented stronger contrarian strategies in both bull and bear markets. In contrast, Antonios and Patricia (2006) observed stronger momentum following bear market only. Further, Huang (2006) indicated that the acceptance of the relationship between market states and momentum is dependent on the definition of ‘up’ and ‘down’ market. However, Du, Huang and Liao (2009) further extended the relationship between market state and momentum and provide support in favour of Cooper et al. (2004). They attributed the lack of profitability of momentum strategies in emerging market to the greater frequency of down markets in them. More recently, Daniel and Moskowitz (2013) also report negative momentum profits when the market is under stress. They observed major losses from the momentum strategy following a severe market downturn.
It is clear from the above discussion that there is no unanimity in the existing literature regarding the relationship between the profitability of momentum–contrarian strategy and the overall state of the market. Different results are found from different markets. Such findings motivated the present authors to test this relationship in the context of the Indian stock market.
Data and Methodology
The sample consists of month-end closing adjusted prices of 328 stocks traded on National Stock Exchange (NSE) over the period January 1997–March 2013. The data was collected from PROWESS, a financial database offered by the Centre for Monitoring Indian Economy (CMIE). The study uses monthly data instead of daily data, which has substantially high random noise associated with it, as suggested by Mun, Vasconcellos and Kish (2000). The earlier similar international studies (Jegadeesh & Titman, 1993; Chordia & Shivakumar, 2002; Cooper et al., 2004; Daniel et al., 2012) also employed monthly data to avoid the problems that arise out of using daily or weekly data including bid–ask effect and the consequences of infrequent trading.
Share prices of all the selected stocks were further converted to returns in MS Excel software by formula 1

where Rjt is monthly return, Pjt is the price on month t and Pjt – 1 is the price on month t− 1.
To test the contrarian and momentum trading strategies for the Indian market, we followed the methodology used by Jegadeesh and Titman (1993) with a few modifications.
The monthly market-adjusted excess return were calculated for each stock j in every month t with the formula 2

where uj,t represents market-adjusted excess return on stock j for the month t, Rj,t is the return on stock j for the month t, and Rm,t is the return on market index for the month t.
To investigate the short-term momentum and long-term overreaction effect, the stocks were ranked in descending order on the basis of their past cumulative average return during the prior formation period (F). The best 20 per cent performing stocks were grouped as ‘Winner’ portfolio and the worst 20 per cent were grouped as ‘Loser’ portfolio. The cumulative average return (CAR) for both portfolios was computed over the next holding period in months (H). If the average cumulative return (ACAR) of the winner portfolio during H is higher (or lower) than that of the loser portfolio, the outcome is momentum (or contrarian) profit.
Various combinations of formation (F) and holding period (H) were used. For momentum strategy formation period of 6 months and holding period of 3, 6, 9 and 12 months were examined. In contrast, to investigate overreaction effect, formation period of 36 months and holding period of 12, 18, 24 and 36 months were used. This gives a total of eight strategies, where F = 6 and H = 3, 6, 9, 12, also represented as (6×3), (6×6), (6×9) and (6×12), are short- to medium-term strategies. Whereas F = 36 and H = 12, 18, 24, 36, represented as (36×12), (36×18), (36×24) and (36×36), are long-term strategies. The bid–ask bias, price pressure and lagged reaction were reduced by skipping one month between the formation and holding periods as suggested by Jegadeesh and Titman (1993). Further, the study also uses full rebalancing technique instead of overlapping portfolio technique. The statistical significance of the profitability of momentum and contrarian strategies was tested using parametric one-sample t-test. If the average cumulative unusual returns on the winner–loser portfolios during the holding period are significantly positively (or negatively) greater than zero, the hypothesis of the presence of momentum (or contrarian) profit can be accepted.
Empirical Results
Existence of Momentum and Overreaction Effect in the Indian Stock Market
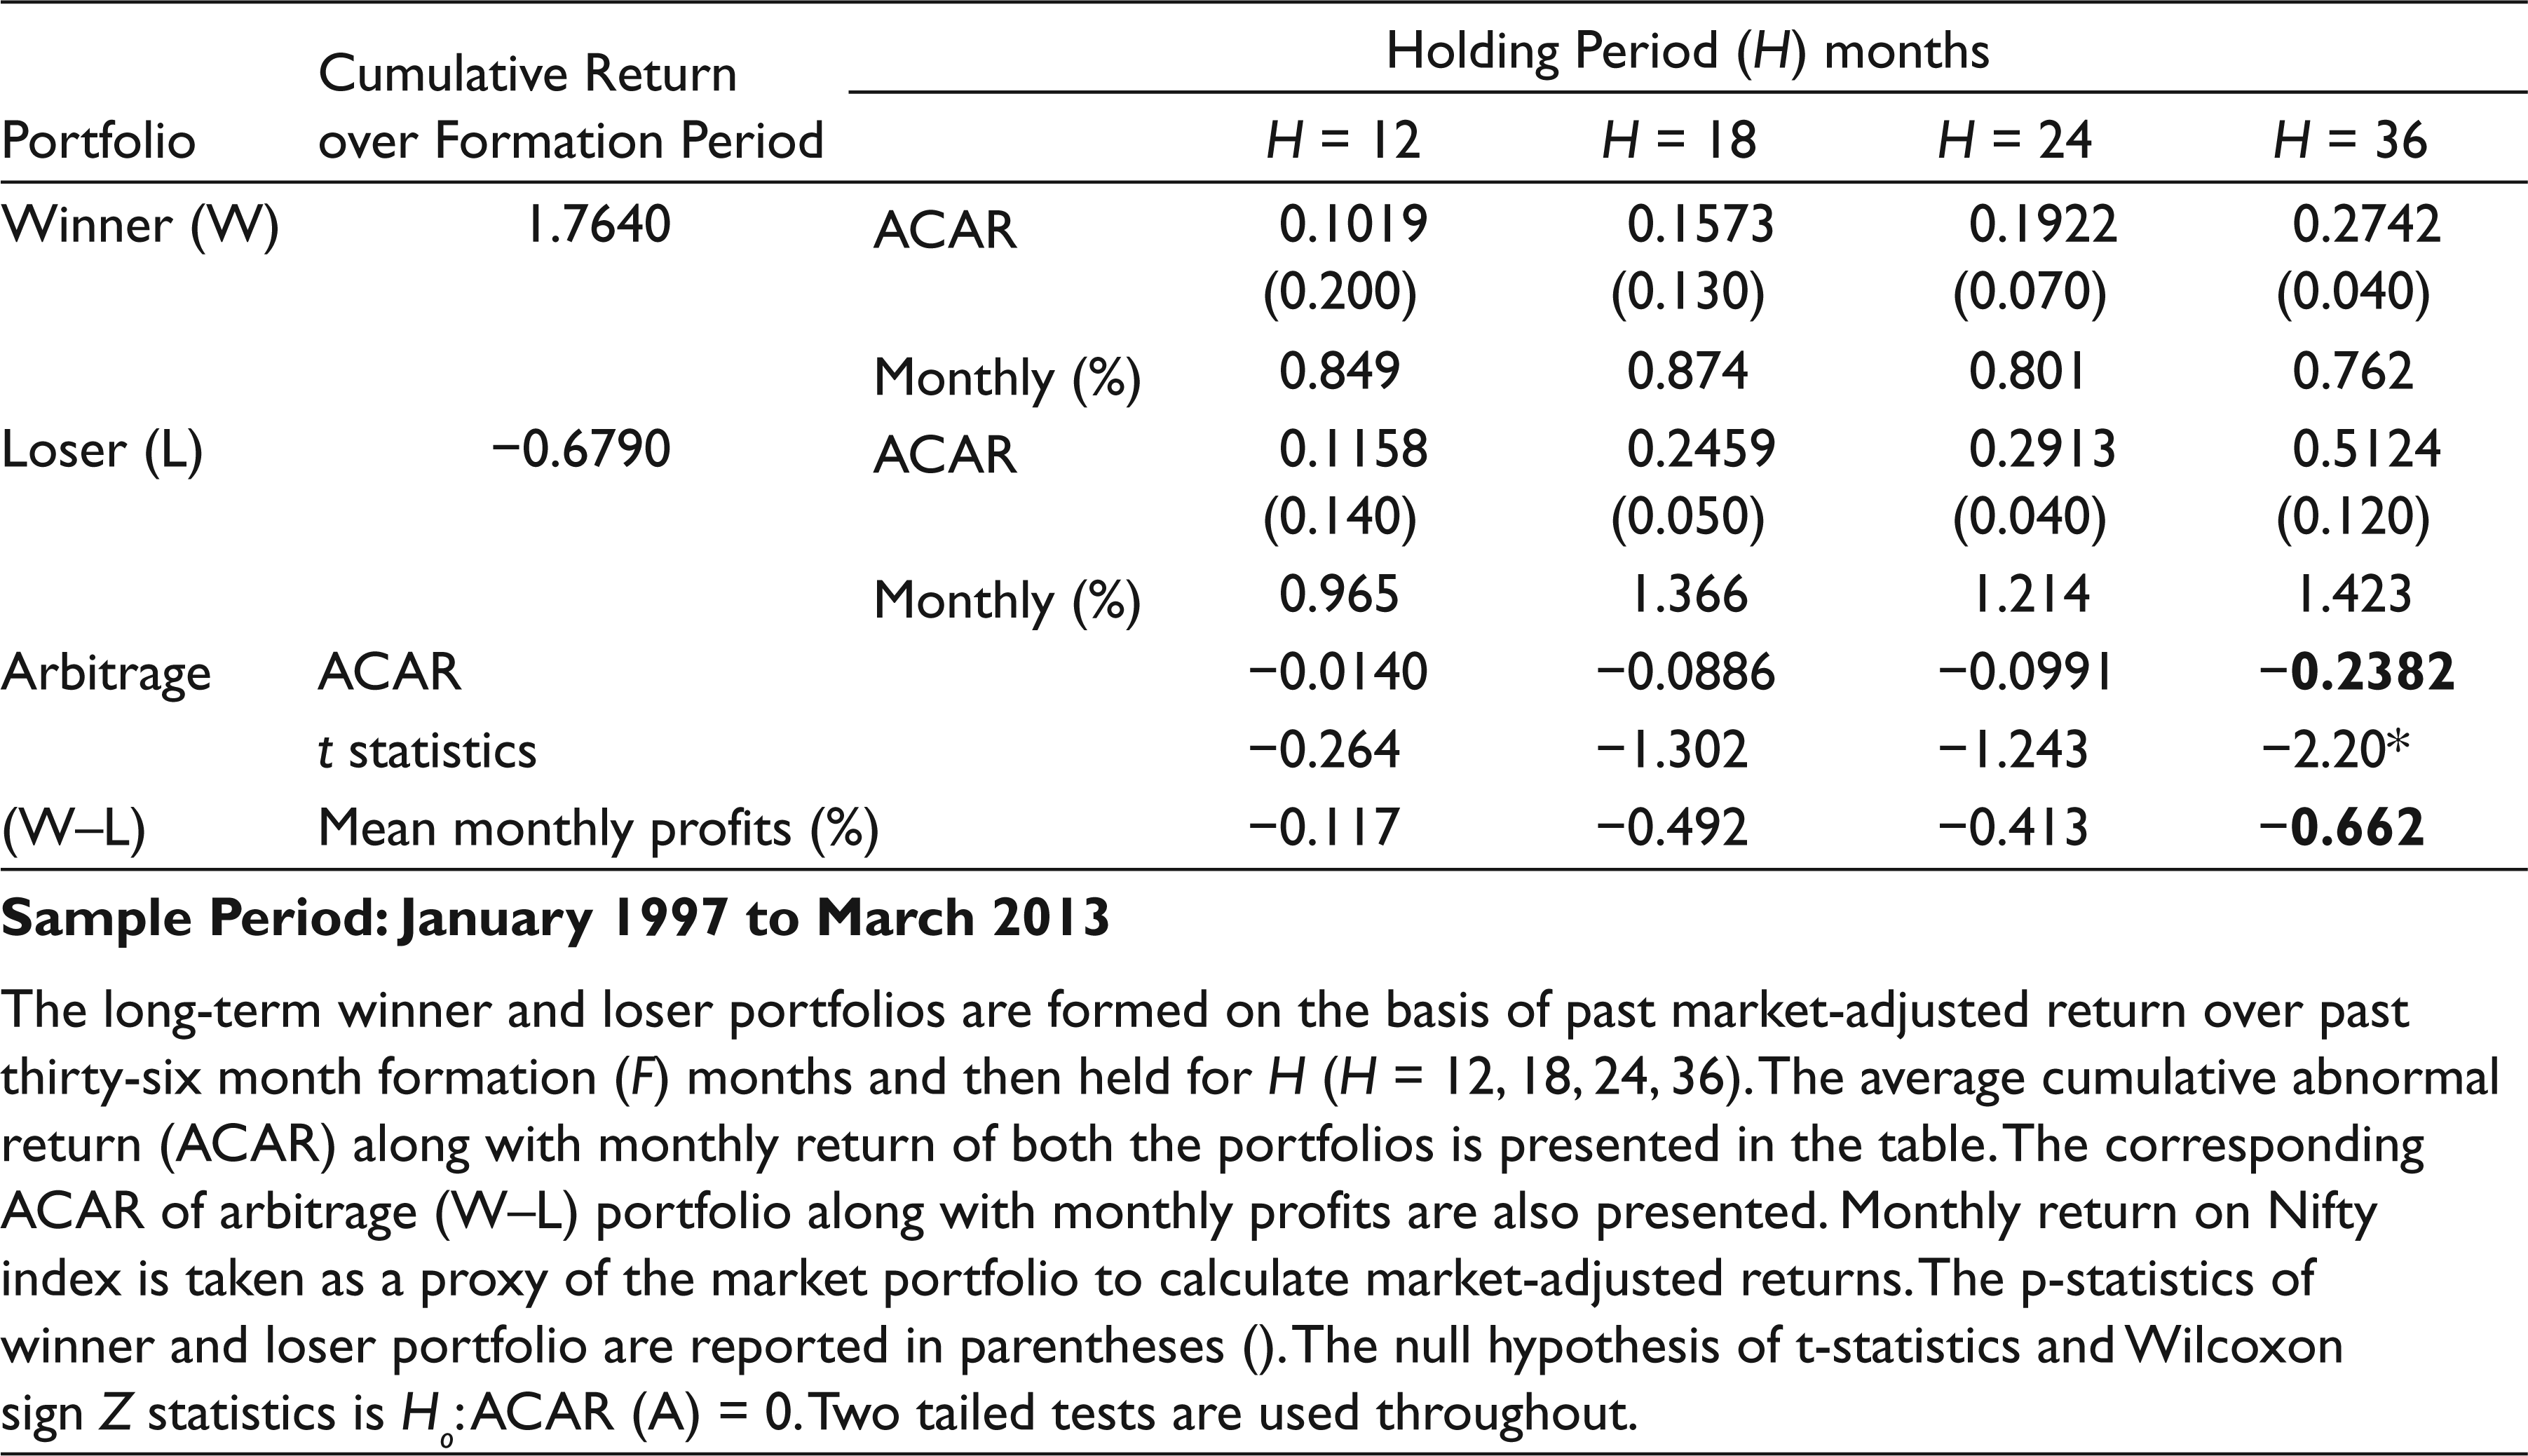
Tables 1 and 2 present the returns of 6-months momentum and 36-months contrarian strategy for the sample period from January 1997 to March 2013. As shown in Tables 1 and 2, the formation periods are arranged vertically and holding periods are spread horizontally. If the difference between the winner and loser portfolio is significantly larger than zero, then momentum profits do exist, whereas if the difference between the winner and loser portfolio is significantly smaller than zero, it confirms the presence of long-term contrarian profits in the Indian stock market.
Tables 1 and 2 document the presence of strong momentum effect for short formation–holding period and strong long-term return reversal effect in the Indian stock market. Both momentum and long-term contrarian strategies are observed to be profitable in the Indian stock markets. These results are in agreement with the results from DeBondt and Thaler (1985) and Jegadeesh and Titman (1993) for the US stock market. The portfolio of the past winner stocks outperforms the portfolio of the past loser stocks as early as three months post formation. The statistically significant momentum profits are observed over (6×3), (6×6) and (6×9) momentum strategies. The most profitable momentum strategy is identified to be the one with a holding period equal to three months (6#3) with market-adjusted monthly return of more than 1.83 per cent. The overall evidence of the profitable momentum strategies in the Indian stock market is in conformity with the previous studies of Sehgal and Balakrishnan (2002), Ansari and Khan (2012) and Dhankar and Maheshwari (2013a).
Summary Statistics of Short-term Past Return-based Portfolios over NSE

**Statistically significant at 10% level.
All the values are rounded off to four decimal places.
Summary Statistics of Long-term Past Return-based Portfolios over NSE
**Statistically significant at 10% level.
All the values are rounded off to four decimal places.
Moving the discussion to longer time horizon, contrary results were observed. Consistent with DeBondt and Thaler (1985) and Jegadeesh and Titman (1992), longer time horizon return patterns indicate strong reversal. The results from the study are found to be consistent with the overreaction hypothesis that predicts outperformance of long-term loser stocks over long-term winner stocks: 36 months post formation period. The contrarian strategy (36#36) generates 23.8 per cent cumulative unusual profits in the Indian stock market, generating annual contrarian profits of approximately 8 per cent. Evidence in favour of long-term contrarian profits in the Indian stock market is also reported by Sehgal and Balakrishnan (2002), Locke and Gupta (2009) and Tripathi and Aggarwal (2009).
Market States and Investment Strategies
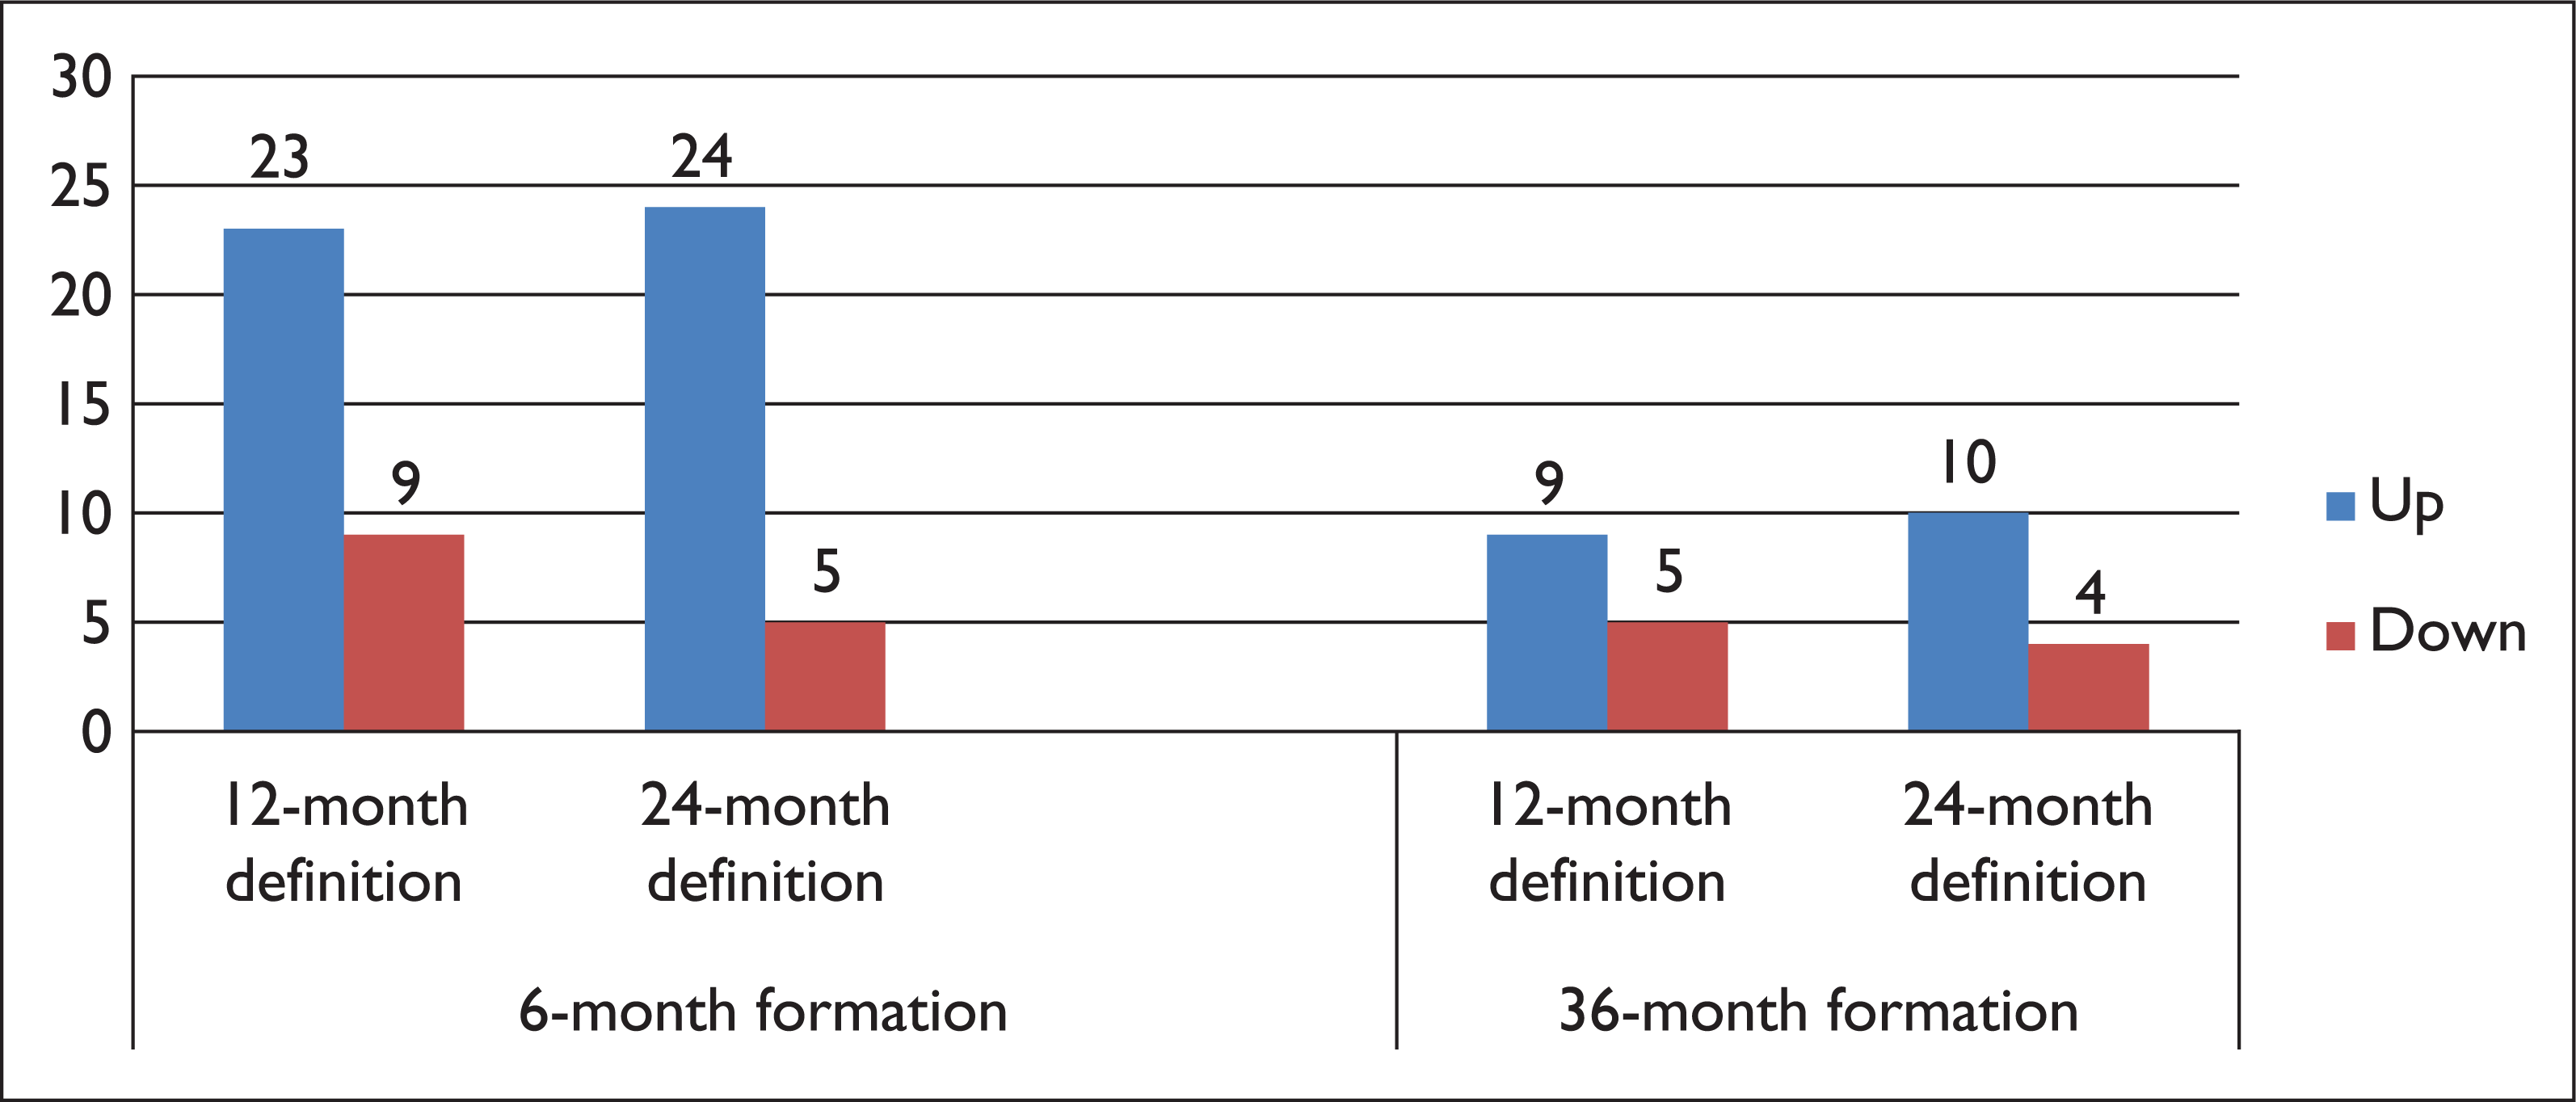
The previous section of the study suggests strong profitability of both momentum and long-term contrarian strategies in Indian stock market. However, before drawing any conclusion, it is essential to test the same over different market conditions. The state in which average market returns (proxy by NSE–Nifty returns) prior to the strategy’s holding period are positive, the market is defined as ‘up’ (or bull market); likewise if the returns are negative, it is defined as ‘down’ (or bear market). Cooper et al. (2004) use various time horizons (36, 24 and 12 months) to define these states. They further suggest the use of longer horizon in defining the state of the market, as they capture more dramatic changes in the market states, though they also reduce the number of observations of changes in the market state. In contrast, Abinzano, Muga and Santamaria (2010) argued that since emerging markets have high volatility, longer horizon may not capture the state of the market properly. They suggested the use of shorter time horizon of 12 months to capture the market state when dealing with emerging markets. Since the choice of market state is very important, we used the time horizon of 12 and 24 months in defining the market state considering the competing views of Cooper et al. (2004) and Abhinzano et al. (2010). Figure 1 depicts the number of ‘up’ and ‘down’ states using different definitions of market state for 6-month momentum and 36-month contrarian strategies.
To test whether contrarian and momentum profits are robust regardless of the state of the market, momentum and long-term contrarian profits are estimated for both ‘up’ and ‘down’ state of the market. The momentum and contrarian profits are calculated by estimating ACAR as well as mean monthly profits over holding period across different market states.
Market State and Momentum Profits
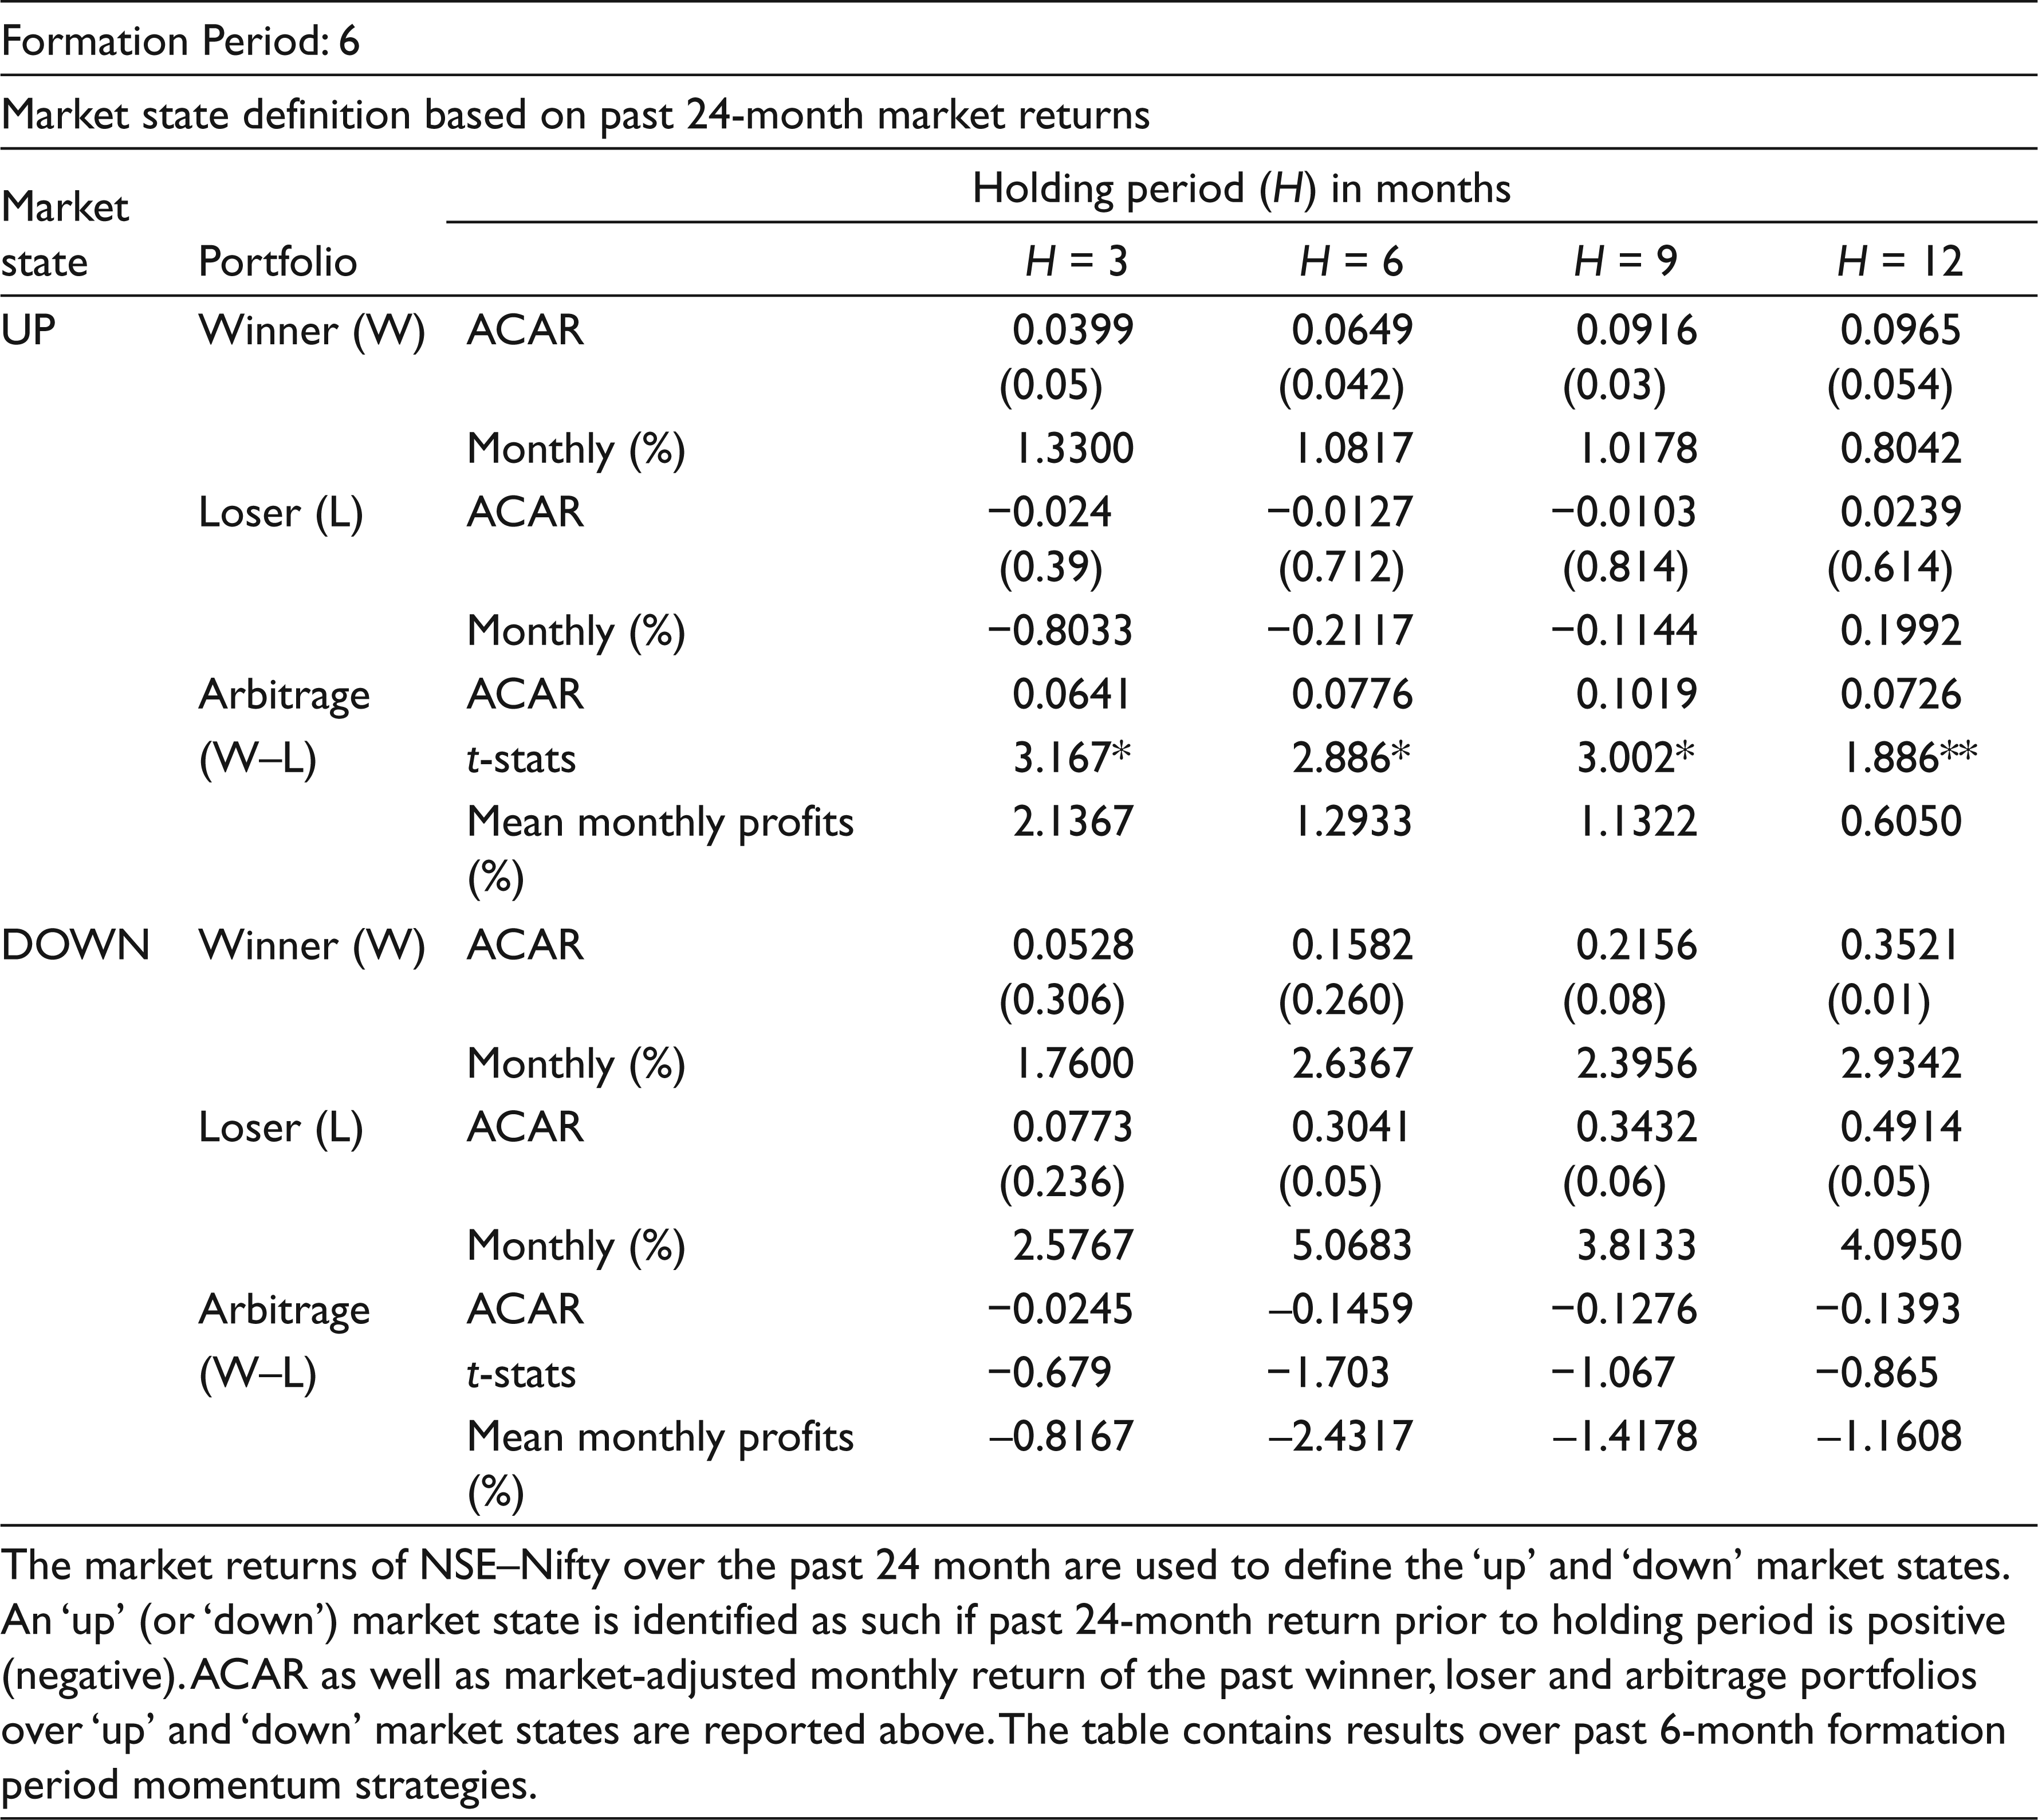
To examine whether the state of market has an effect on the profitability of momentum strategies, the momentum profits are decomposed into ‘up’ or ‘down’ market state. The empirical results presented in Table 3 (Panel I) show that over the sample period from 1997 to 2013, momentum profits are found to be positive for all 6-month formation period based momentum strategies following an ‘up’ state. In contrast, the performances of the momentum strategy following ‘down’ state are not that attractive. The momentum profits following ‘down’ market in the Indian stock market are observed to be small and statistically non-significant.
To be more specific, using 24-month definition for the state of the market, statistically significant market-adjusted monthly profit of 2.13 per cent, 1.293 per cent, 1.13 per cent and 0.605 per cent are observed over 6#3, 6#6, 6#9 and 6#12 momentum strategy following an ‘up’ state as shown in Table 3. On the contrary, corresponding market-adjusted monthly momentum profits following ‘down’ state are −0.817 per cent, −2.43 per cent, −1.41 per cent and −1.11 per cent. As illustrated, none of the momentum profits following ‘down’ market are found to be statistically significant.
To further clarify the relation, an alternative definition for the market state based on the past 12-month market return was also used. The results remained the same though as presented in Table 3 (Panel II). In short, momentum profits are sensitive to market conditions in the Indian stock market. Further, in order to understand the economical profitability of market state conditioned momentum strategies, the standard momentum strategy returns, over the complete sample period, are compared with the market state conditional strategies. Table 4 compares the results for standard momentum strategy against the ‘up’ market state average momentum profits. The strategy conditioned on the market state (‘up’) outperformed the standard momentum strategy in the Indian stock market for almost all momentum strategies investigated. The results remain the same irrespective of the definition used for the state of the market. Hence, the acceptance of the fact that the momentum profits comes from the ‘up’ markets is not dependent on the definition of ‘up’ and ‘down’ market as suggested by Huang (2006).
Market States and Momentum Profits

**Statistically significant at 10% level.
Comparison of Standard Strategy with ‘Up’ Market State Momentum Strategies

Figure 2 shows the momentum profits that are generated following an ‘up’ and ‘down’ market in India using 12-month market return definition. Since, (6×3) is observed to be the most profitable momentum strategies in the Indian stock market, the graph is shown only for the same. As can be seen in the Figure 1, majority of the negative momentum profits in the Indian stock market occurs in the ‘panic’ state, that is, following market declines. Similar results were obtained by Du et al. (2009), Daniel and Moskowitz (2013) for other stock markets. Taken together, the results for the Indian stock market are consistent with the findings of Cooper et al. (2004) that momentum profits depends critically on the state of the market. It can be concluded that statistically significant and economically higher momentum profits in the Indian markets can be obtained following an ‘up’ (or bull) market.
On a closer examination of the winner and loser stocks returns when conditioned on the market state, some striking observations are obtained. Specifically, both winner and loser stocks perform better in ‘down’ market state as compared to ‘up’ market state. The winner stocks exhibit stronger momentum following a ‘down’ market state, while loser stocks show stronger momentum following an ‘up’ market state. The higher momentum profits following an ‘up’ market state appeared to be driven by the different reactions between winner and loser stocks over different market states. Specifically, loser stocks appeared to be more sensitive to market condition as compared to winner portfolio. That is, loser portfolio display strong momentum in ‘up’ market state, generating lower returns and hence increasing the overall profitability of the momentum strategy. However, over the ‘down’ market state, loser portfolio exhibit strong reversal pattern and generates higher market-adjusted returns, decreasing the overall profitability of momentum strategy following ‘down’ market state. Since, the loser portfolio shows high return reversal over short to intermediate period, it would be further interesting to see the pattern of long-term winner and loser portfolios over longer holding period.

Table 4 compares the monthly market-adjusted momen-tum profits from different formation-holding period standard momentum strategies to those obtained from conditioning on up market state. All the momentum profits are in percentage.
The monthly momentum profits over different test periods are plotted for three- and six-month momentum strategy from 1997:01 to 2013:03 following 12-month based definition for market state.
Market State and Long-term Contrarian Profits
Using the same methodology as used for decomposing momentum profits, we have tried to isolate the ‘up’ and ‘down’ market state contrarian profits using two alternative market state definitions based on past 12- and 24-month market return.
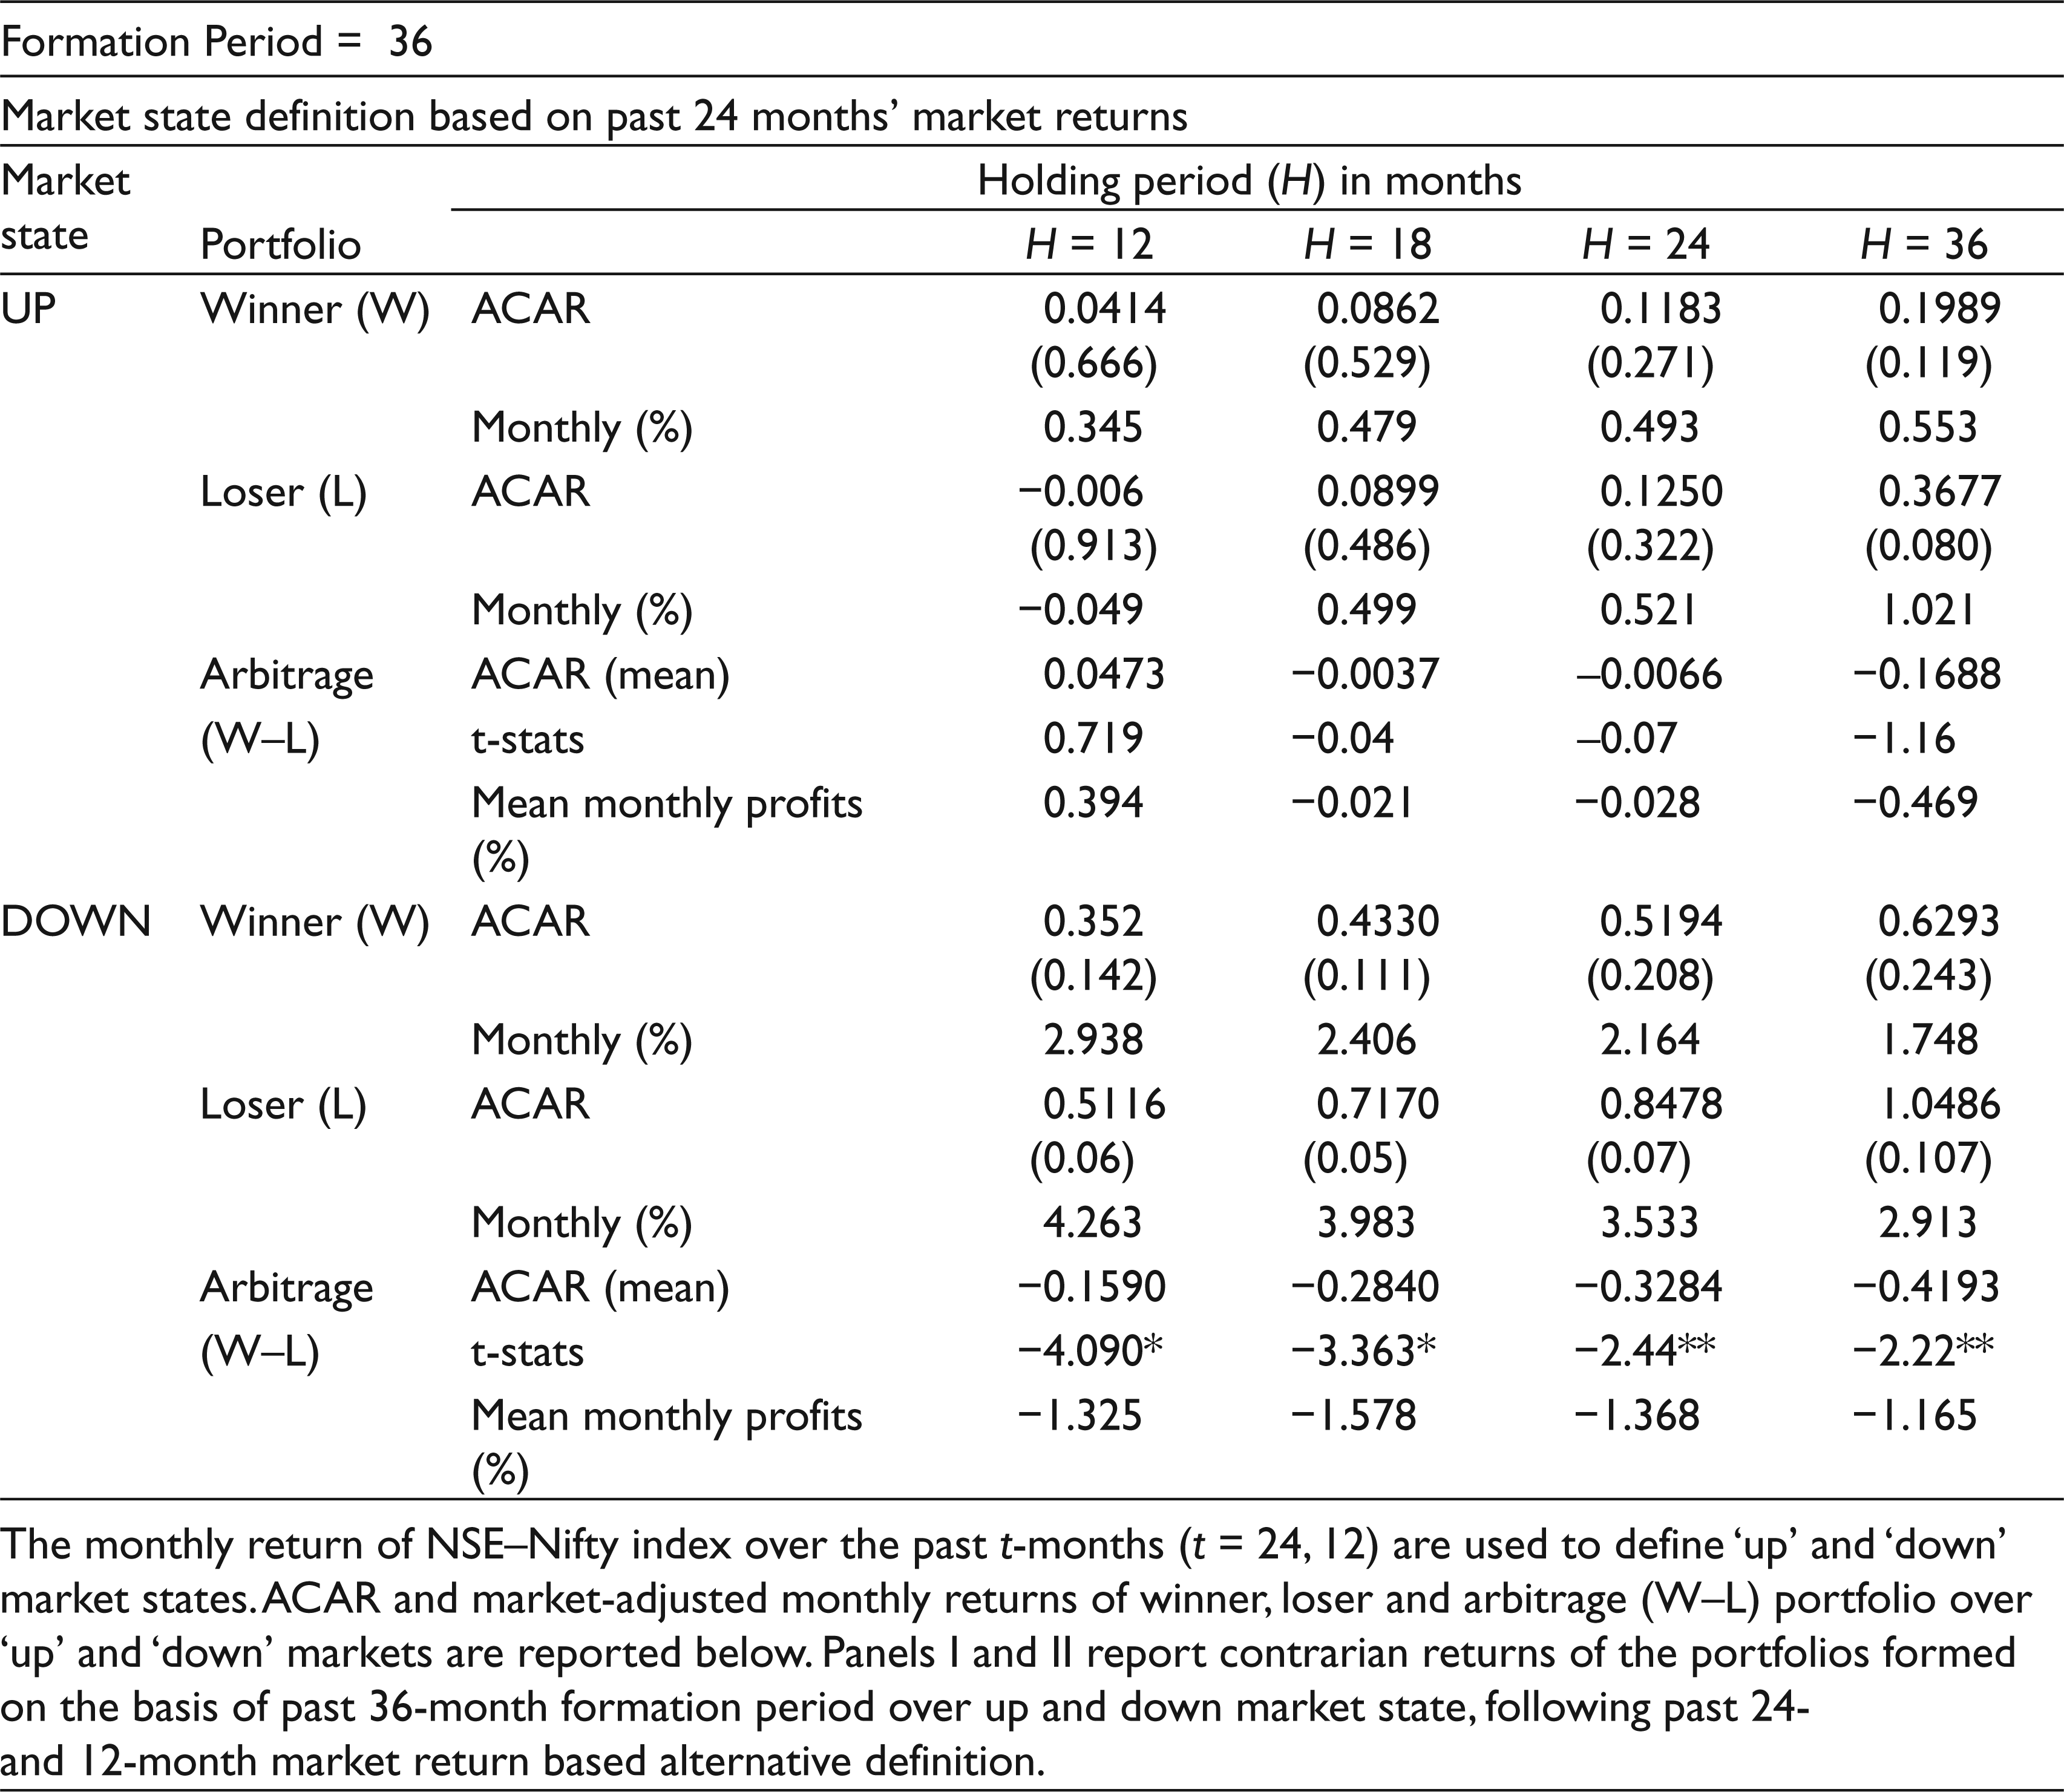
The results from the Table 5 suggest that long-term contrarian strategies are more profitable following ‘down’ market state. Similar results are obtained using the alternative definition. To be more specific, using 24-months definition of market state (Table 5, Panel I), statistically significant contrarian profits are observed only following ‘down’ market state using 36-month formation period. The statistically significant monthly contrarian profits of 1.32 per cent, 1.57 per cent, 1.36 per cent and 1.165 per cent over 12, 18, 24 and 36 months’ holding period are observed following a ‘down’ market. The corresponding contrarian profits following an ‘up’ market are statistically non-significant. Similar and more robust results are obtained using past 12-months market definition (Table 5, Panel II). In short-, long-term contrarian profits are also sensitive to market conditions in the Indian stock market, wherein stronger profits are observed in ‘down’ market.
However, the above results must be read with caution. The lower number of ‘down’ state contrarian strategies (less than 5) during the sample period casts strong doubts on the validity of the above results and the possibility that the results were obtained by chance cannot be ruled out.
It can further observed from the Table 5 (Panels I and II) that both long-term past winner and loser stocks generate higher market-adjusted return in ‘down’ market as com-pared to ‘up’ market. Similar results were obtained for short-term winner and loser portfolio in the previous section. However, during the ‘down’ market state, long- term losers generate significantly higher returns, exhibiting strong reversal in the returns. These findings of the study can be attributed to the pessimistic as well as conservative nature of the Indian investors who react negatively in the ‘down’ market. Following a ‘down’ market, Indian investors overreact to the bad news and underreact to the good news. Thus, generating stronger momentum among winners whereas reversals among the losing stocks.
It appears that in the Indian stock market both momentum and long-term contrarian profit are sensitive to the market conditions. Higher and significant momentum profits can be obtained following an ‘up’ market whereas in ‘down’ market, long-term contrarian profits are more feasible.
Interaction between Market State, Size and Investment Strategies
In addition to the market’s influence, numerous researches have also predicted the influence of size on momentum and long-term contrarian profits. Although, Carhart (1997) indicated that momentum and size are priced separately, the relation between size and momentum–contrarian profits have been questioned multiple times across multiple stock markets. The study adds to the existing literature by studying the influence of market state combined with size on momentum and contrarian profitability. To investigate the same, momentum and contrarian profitability was calculated separately for large- and small size stocks in both ‘up’ and ‘down’ market states. At the end of each formation period, two groups were formed: one comprising 40 per cent of the stocks with larger market capitalization (large) and the other with 40 per cent of the stocks with smaller market capitalization (small). Stocks were further sorted on the basis of past stock returns during the formation period to form winner and loser (for both momentum and long-term contrarian strategies) portfolio from both size groups. Momentum and long-term contrarian profits were calculated for both small and large size stocks under different market states (‘up’ and ‘down’).
Strong momentum profits are observed for both small and large size stocks in bullish (‘up’) market, as reported in Table 6 (Panels I and II). Lending support to the previous results, none of the momentum profits were found to be statistically significant in ‘down’ market for any size group. Hence, it can be argued that momentum profits not only strengthen during the growth periods, but also outperform the size effect in the Indian stock market. In addition, we uncovered some intriguing phenomena. The momentum effect was observed to be stronger in larger firms as compared to smaller stocks. Earlier studies have reported stronger momentum profits among small size stocks, which is inconsistent with our results. Similar to our results, Alhenawi and Evansville (2015) also reported stronger momentum profits in larger firm in bullish market. It can be argued that in bullish market smaller companies grow fast riding the momentum wave; as a result they simultaneously exhibit strong momentum and rise in market value. On the other hand, smaller companies that do not catch up the bullish market wave remain small and hence exhibit weak momentum.
However, similar argument cannot be presented for long- term contrarian strategy. Providing support to the previous result, strong contrarian profits are observed only in ‘down’ market. However, long-term contrarian profits are observed to be small and statistically weak for smaller firms as compared to larger firms (Table 7, Panels I and II). One of the reasons for weak contrarian profits among small size firms is the strong size effect in the Indian stock market. As a result both small size winner and loser firms generate higher returns, resulting in low contrarian profits. In short, long-term contrarian profits are stronger in ‘down’ market but are not strong enough to outperform the size effect in the Indian stock market.
Market States and Long-term Contrarian Profits

**Statistically significant at 10% level.
To sum up, strong momentum profits are observed in the Indian stock market in bullish market, irrespective of the size of the stocks. These results suggest that the sensitivity of momentum profits to market conditions is unaffected by the size effect in the Indian stock market. Moreover, stronger momentum profits among large size stocks suggest efficacy of momentum strategies in the Indian stock market considering the lower trading cost of large size stocks.
Market-dependent Risk-adjusted Returns
Previous researchers have argued that momentum and long-term contrarian profits in the US stock market disappeared if risk-adjusted returns are used. The higher return associated with momentum and long-term contrarian portfolio gets eliminated when beta—adjustments are made using the traditional CAPM. However, Pettengill, Sundaram, & Mathur (1995, 2002) argued that the common assumption that betas are same in ‘up’ and ‘down’ market leads to misleading results. Pettengill et al. (1995, 2002) using US stock market data tested the dual hypothesis of relation between stock returns and beta, wherein positive association was observed during ‘up’ market but negative during ‘down’ market. In the light of Pettengill et al. (1995) argument, it is possible that a simple beta adjustment in momentum and contrarian profits may not be adequate in reflecting compensation of risks. DeBondt and Thaler (1987) also reported that once betas are allowed to vary with market condition, the abnormal returns associated with long-term strategies disappear. Rouwenhorst (1998) also reported that winner and loser portfolios have differential betas in ‘up’ and ‘down’ markets. To evaluate the similar possibility in the Indian stock market, a methodology similar to Rouwenhorst (1998) was adopted. We recalculated the regression over different strategies in a way that permits different betas in ‘up’ and ‘down’ market as follows:

where Rpt is the monthly return of portfolio (winner or loser) in month t, Rft is the risk free rate of return in month t, RMt is the market index return, Dt is dummy variable that is 1 if RMt > 0 and 0 if RMt < 0. β+ is the systematic risk in up market and β— is the systematic risk in down market.
Market State, Size and Momentum Profitability
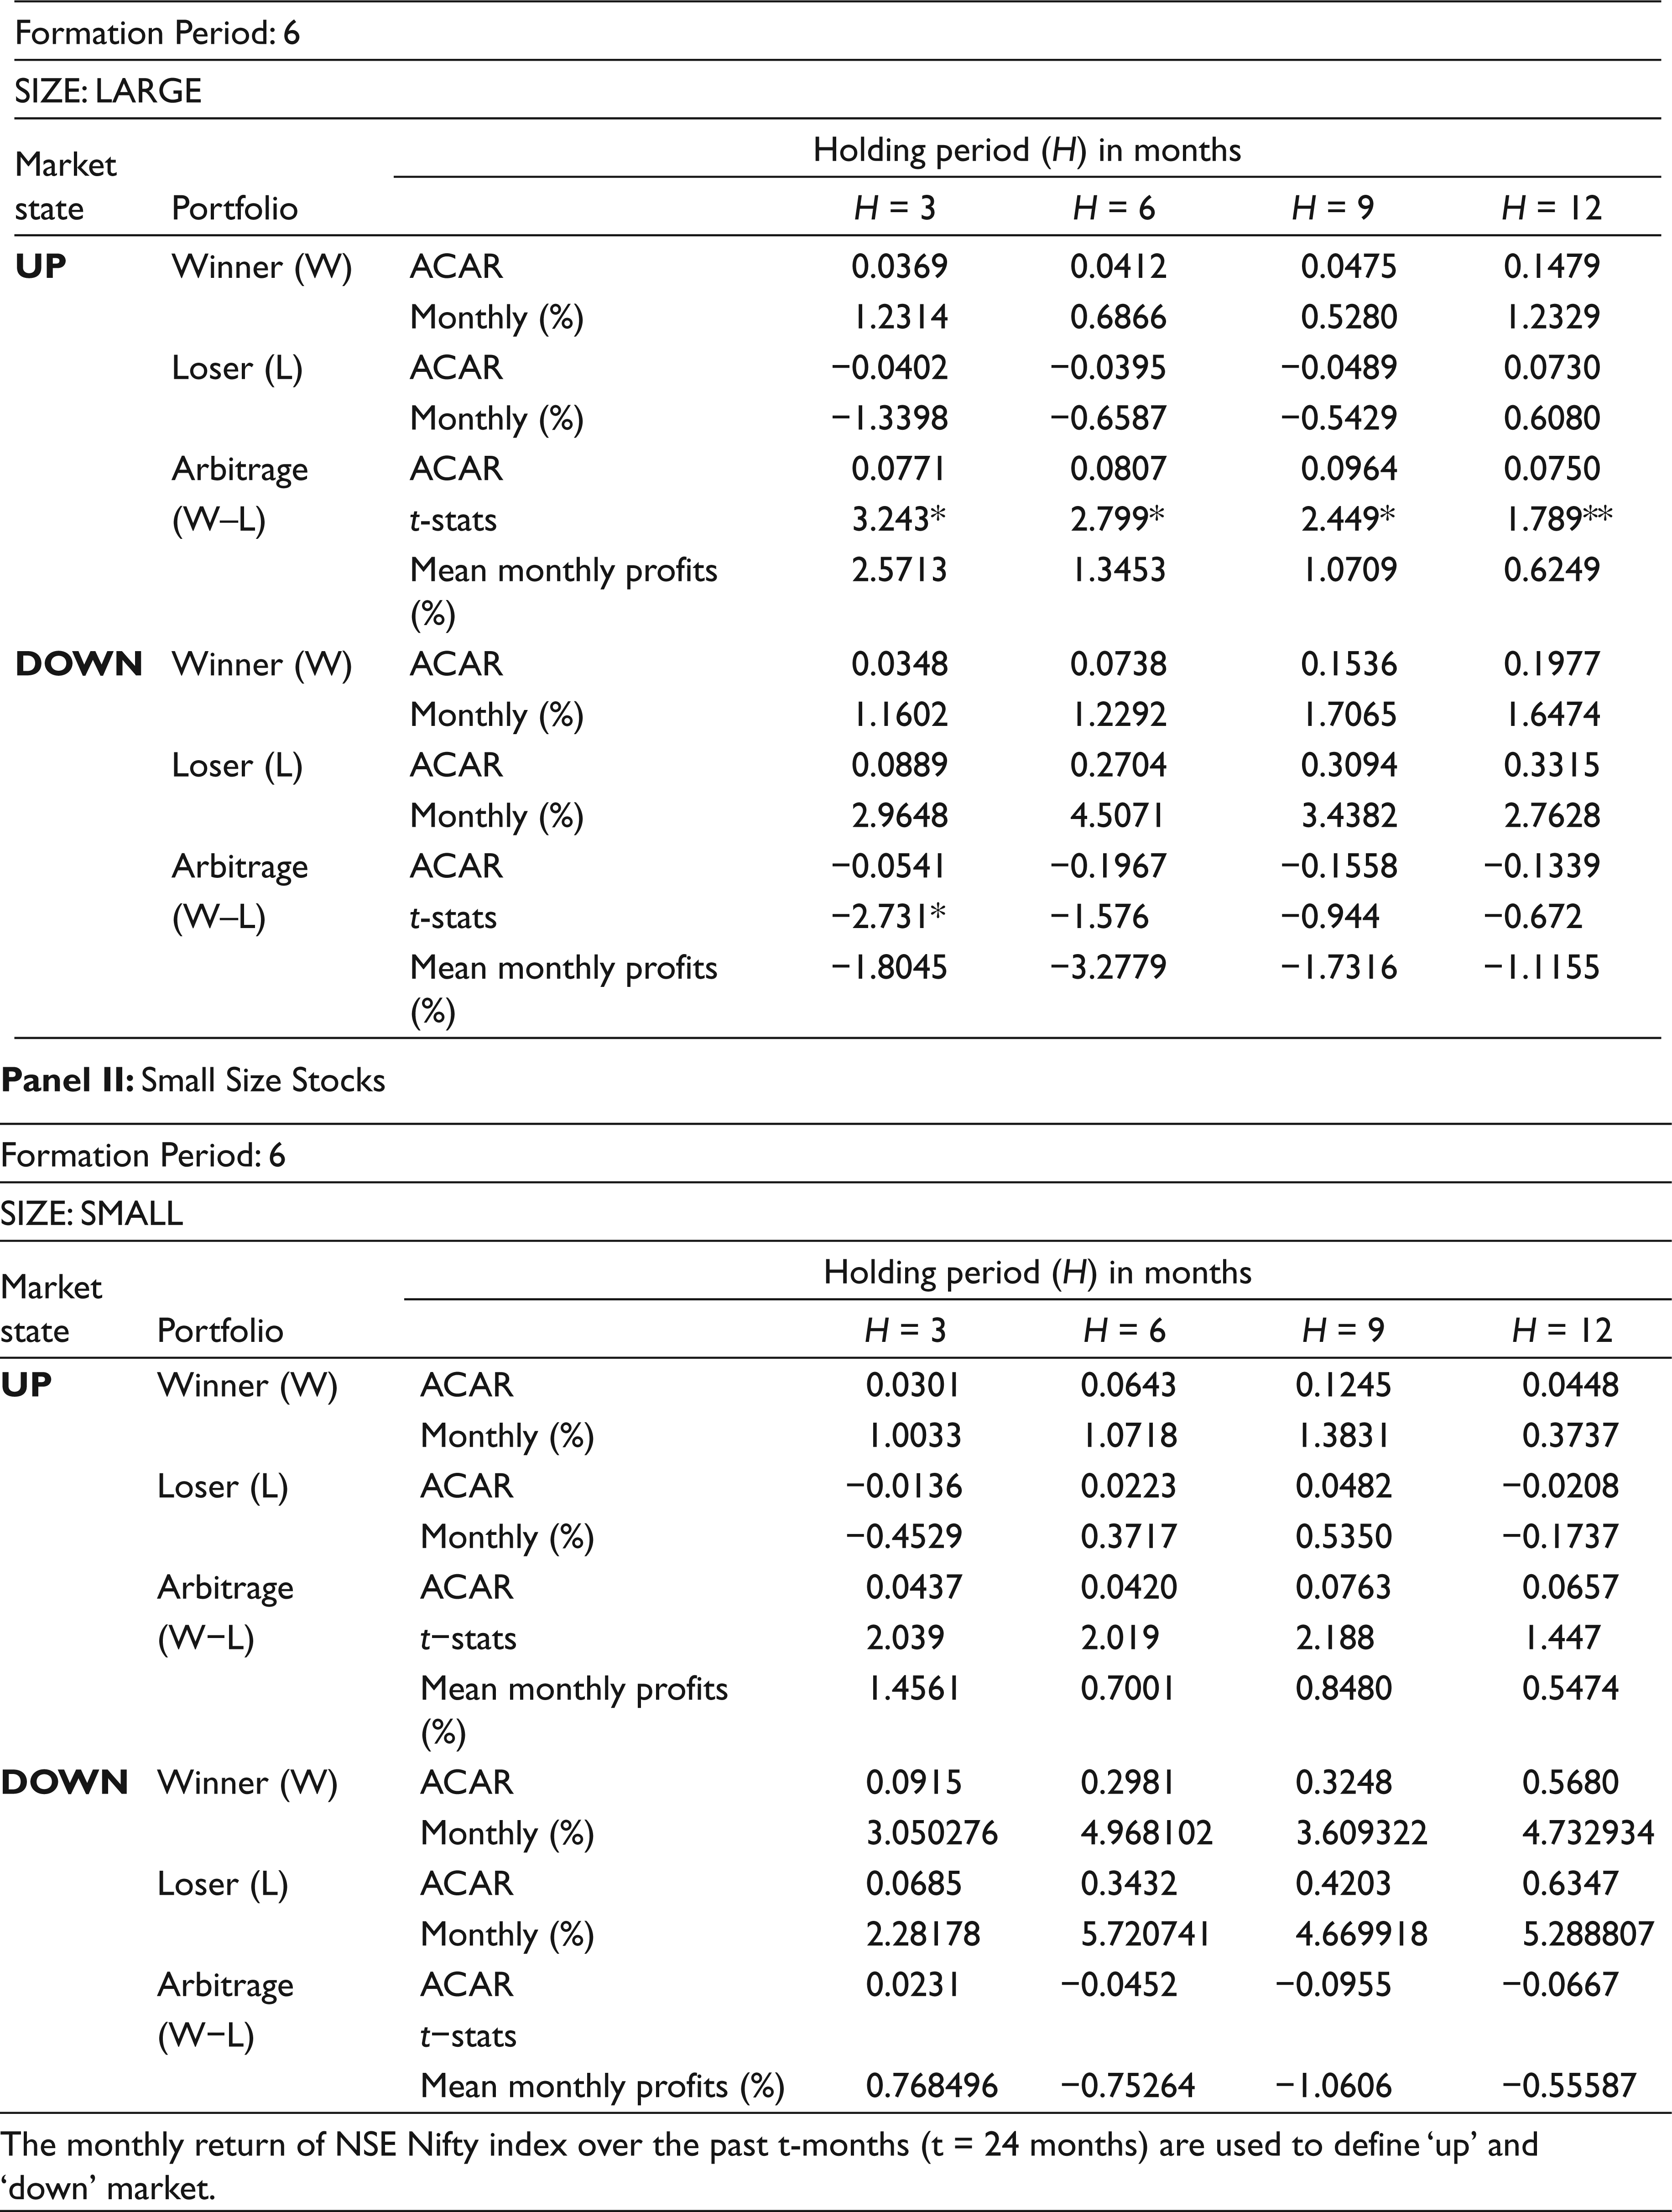
**Statistically significant at 10% level
Market State, Size and Long-term Contrarian Profitability

**Statistically significant at 10% level.
For momentum and contrarian profits to be consistent with the market dependent beta risk explanation there should be insignificant α. In addition, Rouwenhorst (1998) further suggested that for the momentum effect to be consistent with the market dependent beta explanation, it is expected that loser portfolio must have higher beta than winner portfolio in ‘down’ market and lower beta in ‘up’ market. In other words, following an ‘up’ market, momentum strategy winners tend to be stocks with beta greater than one, so that momentum strategy tend to place positive beta bet on the market. Conversely, following ‘down’ market, it will place negative beta bet on the market. Similarly, if long-term reversal (or overreaction effect) is consistent with market dependent beta risk explanation, long-term past winner portfolio must have higher beta than loser portfolio in ‘down’ market and lower beta in ‘up’ market.
Table 8 (Panel I) reports results of the winner, loser and arbitrage portfolio (W–L) after adjusting for the market-dependent betas. As shown in the table, alpha of winner as well as arbitrage (W–L) portfolio remain significantly positive for all momentum strategies, even after allowing beta to vary with the state of the market. On further examination of market-varying beta of winner and loser portfolios, it can be observed that even though the beta does vary with the market condition, losers uniformly have higher beta in ‘up’ market and lower beta in ‘down’ market as compared to winner portfolio. As a consequence, the beta of arbitrage portfolio (W–L) is negative in ‘up’ market and positive in ‘down’ market (though not significant in most of the cases), making alpha more anomalous. Hence, it can be said that the high returns of momentum strategy in ‘up’ market state (as discussed in previous section) is not due to higher risk of winners as compared to losers. These results are in agreement with Rouwenhorst’s (1998) findings that momentum profits are strong enough even after allowing beta to vary with the market conditions.
Market-dependent Risk-adjusted Returns

**Significant at 10% level.
Similar results cannot be obtained for long-term reversal effect as shown in Panel II of Table 8. Once beta is allowed to vary with the market condition, the alphas of long-term winner and arbitrage portfolio (W–L) are no longer statistically significant. Though, loser portfolio generates statistically significant (at 10%) monthly profits of 1.55 per cent, the abnormal returns associated with long-term contrarian strategy disappears once beta is allowed to vary with the market condition. Contrary to the results of DeBondt and Thaler (1987), the winner portfolio have higher beta as compared to loser portfolio in both ‘up’ and ‘down’ market states. This suggests that it is profitable to buy long-term losers only following a ‘down’ market, since in falling market winner have higher tendency to lose as compared to loser. Similar results were obtained in previous section, wherein losers exhibited strong reversal in ‘down’ state of market as compared to ‘up’ state of the market.
In sum, even though the abnormal returns associated with the long-term reversal contrarian strategy disappears once beta is allowed to vary with the market condition, the momentum profits remains robust for the same. This further provides support to the profitability of momentum strategies in the Indian stock market.
Discussion
The results so far suggested that there exist a significant relationship between market states and momentum in the Indian stock market, which size as well as risk discrepancy fail to explain. Existing literature suggests three behavioural based explanations for momentum profitability: Daniel et al. (1998), Barberis et al. (1998) and Hong and Stein (1999). We tried to examine the implication of these models in the light of the evidence from the current study. More specifically, it provides support in favour of Daniel et al. (1998) behavioural model that predicts stronger momentum effect following market gain, due to stronger overconfidence among Indian investors post market gains. However, the empirical results of the study suggests strong asymmetric reaction for both winner and loser portfolios in the Indian stock market. Specifically, it was observed that winner portfolio exhibits stronger momentum following a ‘down’ market state while loser portfolio generates stronger momentum following an ‘up’ market. Such an asymmetric behaviour is not predicted by Daniel et al. (1998) model, which predicts that investors would become more confident about their private information during ‘up’ markets that will generate greater momentum for winner portfolio. Similarly, loser portfolio would exhibit greater momentum during ‘down’ markets. Contrary results from the Indian stock market challenges the overall acceptability of Daniel et al. (1998) behavioural explanation of momentum returns. The results from this study partially support overreaction based behavioural model, suggesting a need to develop a single model that could explain all stock market anomalies in all the market conditions.
To sum up, the study suggests some kind of future stock return predictability suggesting informational inefficiency of the Indian stock market. It can be interpreted that Indian stock market may not be efficient enough to incorporate all information in current prices. As a result, continuation momentum patterns in stock returns evolve. Further, the study emphasizes the importance of market sentiments in driving the future stock returns, and hence, profitability of various investment strategies. Such results provide support in favour of adaptive market hypothesis (AMH) proposed by Lo (2004) who proposed that intelligent investors constantly adapt to changing market environment to earn higher profits. Even though momentum strategies are profitable in the Indian stock market, the momentum returns are not constant over time and vary with the market conditions. Hence, it can be argued that the momentum strategies will perform better in certain environments but not in others. In other words, only market-based conditioned momentum strategy works well in the Indian stock market, providing support for AMH. However, whether Indian market is fully adaptive or not is left for the future research.
Conclusion
Momentum and long-term return reversal effect still remain the most prominent anomalies found in the financial literature. This article contributes to the current literature by providing an out of sample evidence on these effects in one of the fastest growing economy, India, over a sample period from 1997 to 2013. The results of the study suggest strong short-term momentum and long-term return reversal effect in the Indian stock market. The momentum strategy provides significant monthly market-adjusted profits up to 1.83 per cent, while, the long-term contrarian strategy produces abnormal annual market-adjusted profits of 8 per cent.
Further, it was observed that momentum strategy works significantly differently across different market states. Strong and statistical significant momentum profits can be exploited in the Indian stock market following an ‘up’ or bull markets only. As far as long-term contrarian profits are concerned, a weak evidence of stronger contrarian profits following a down market is observed in the Indian stock market. In other words, in the Indian stock market, the market conditions can be used as a predictor for the profitability of momentum and long-term contrarian strategies.
In addition, dual beta CAPM model proposed by Pettengill et al. (1995, 2002) failed to explain the excess Indian momentum profits. Even though the findings of the study suggest evidence of asymmetries in market-factor sensitivity conditioned on the state of the market, higher momentum profits in the ‘up’ market cannot be attributed to the higher risk of the winner’s as compared to the loser’s stocks. However, on examination of market-varying beta of long-term winner and losers stock, contrary results were obtained. Once beta is allowed to vary with the market condition, all contrarian profits in the Indian stock market disappear and not found to be statistically significant. It can be thus concluded that market-varying dual beta CAPM can explain the long-term contrarian profits, though it fails to capture the abnormal momentum profits in the Indian stock market. Such results provide support in favour of practical implementation of momentum strategy in the Indian stock market.
This study is the first study that observes a strong positive association between momentum profits and the state of the Indian stock market. The results obtained also have strong investment implications. Indian investors could improve their investment returns by following a conditional momentum strategy as against the unconditional momentum strategy. Higher profits can be obtained by employing a momentum strategy following an ‘up’ market and contrarian strategy when the prior market state is ‘down’ Furthermore, during bullish market, larger firms’ exhibits stronger momentum profitability. Though, overall results of the study provide support only in favour of momentum profitability in the Indian stock market as long-term contrarian profits are explained within the paradigm of market-varying asymmetric risk asset pricing model.