
Abstract
Relative momentum strategies yield large and substantial profits in the Indian Stock Market. Nevertheless, relative momentum profits are negatively skewed and prone to occasional severe losses. By taking into consideration 450 stocks listed on the Bombay Stock Exchange, the present study predicts the timing of these huge momentum losses and proposes a simple risk-managed momentum approach to avoid these losses. The proposed risk-managed momentum approach not only doubles the adjusted Sharpe ratio but also results in significant improvements in downside risks. In contrast to relative momentum payoffs, risk-managed momentum payoffs remain substantial even in extended time frames. The study’s findings are particularly relevant for asset management companies, fund houses and financial academicians working in the area of asset anomalies.
Introduction
Momentum, a pervasive cross-sectional anomaly, has remained one of the most debated topics documented in the financial literature (Blitz et al., 2020; Grobys et al., 2018). Initially, Levy (1967), in his research study titled ‘Relative strength as a criterion for investment selection’ notice that top equity performers continue to yield higher returns over the next six months. However, the momentum anomaly got real recognition with the iconic work of Jegadeesh and Titman (1993). In their work, Jegadeesh and Titman (1993) reveal the price continuation patterns, i.e. securities that have generated superior returns in the near past, will continue to produce higher returns in the immediate future and vice-versa. They suggest that investors can generate large and substantial profits by taking a long position in past winners and short position in past losers. Carhart (1997) named this price continuation pattern as momentum effect. Later on, several academic studies document the price momentum effect across several geographical markets and periods (Chui et al., 2010; Geczy & Samonov, 2018; Rouwenhorst, 1998; Schmidt et al., 2019). Financial researchers also report the efficacy of relative momentum strategies across various classes of financial assets, i.e. mutual funds, cryptocurrencies, currencies and real estate investment trusts (Cheng et al., 2019; Gorman, 2003; Hung & Glascock, 2010; Orlov, 2016).
Nevertheless, in the last five years, financial academicians focus on downside risks associated with relative momentum payoffs (Daniel & Moskowitz, 2016; Moreira & Muir, 2017). They reveal that relative momentum payoffs are negatively skewed. In simple words, these momentum payoffs are prone to occasional severe losses. Though occasional, these losses deplete the returns of several years. These features of relative momentum strategies make these strategies an unappealing option for risk-averse investors.
To limit these huge momentum losses, several financial academicians have recommended numerous risk-managed momentum frameworks. These frameworks are based on either volatility scaling or the idiosyncratic component of asset returns. Implementation of these frameworks requires additional complex estimations or extra capital (Dobrynskaya, 2019). Therefore, the study’s main objective is to propose a novel risk-managed momentum that is easy to implement and requires minimal estimations. To achieve this objective, the authors carefully investigate the timing relative momentum crashes and find that relative momentum crashes are predictable. These crashes mainly happen at the time of overall market recovery. The authors also reveal that the poor performance of past losers (short positions) causes these huge momentum losses. Thus, the proposed risk-managed momentum strategy works on positions of the relative momentum strategy. To decide whether to take a long, short or both long and short positions in a particular month, the proposed momentum framework compares the lagged two years’ market return with the lagged one-month market return. The proposed momentum approach is motivated by the work of Cooper et al. (2004), who find that market states capture the relative momentum payoffs. To define market states, they consider lagged 36 months’ market return. For a particular month, if lagged 36 months’ market is positive (negative), they consider that month as bullish (bearish). They also use lagged 24 months’ market return for robustness.
Further, the risk-managed momentum framework results in significant improvements both in terms of risk and returns. Calmer ratio ameliorates from 0.41 for relative momentum to 1.43 for risk-managed momentum. There is a considerable drop in downside risk, i.e. conditional value at risk (CVaR) falls from −21.105% to −8.007%. Besides, cross-alpha comparisons of relative and risk-managed momentum payoffs also reveal the superiority of risk-managed momentum strategies over relative momentum strategies as the authors got positive and significant alphas while regressing risk-managed momentum payoffs against relative momentum payoffs.
The contribution of the present study in the existing literature is twofold: (1) the study suggests a novel risk-managed momentum approach based on long-short positions of relative momentum portfolios (2) by providing more comprehensive evidence, the present study updates the existing research on the profitability of relative momentum strategies in the Indian Stock Market. Risk-managed momentum is a nascent area in the momentum investing literature. Most of the risk-managed momentum approaches are tested in developed markets, and these approaches require complex estimations. In contrast, the present study is conducted in the Indian Stock Market and offers a simple solution for managing the momentum risks. The study’s findings are particularly relevant for asset management companies (AMC), fund houses and financial academicians working in the area of asset anomalies. The authors have arranged the remaining article as follows. The second section reviews the major research studies on relative and risk-managed momentum. Data and research methods are described in the next section. Sections four and five report the results, discussions and managerial implications of the study. The last section concludes the study.
Prior Synthesis
Academic literature on conventional momentum begins with the iconic work of Jegadeesh and Titman in 1993. Jegadeesh and Titman (1993) report the continuation patterns in U.S. stocks, and they find that zero-cost relative momentum strategies based on ‘buying recent winners and selling recent losers’ yield substantial payoffs in the U.S. market. Chan et al. (1996) and Lee and Swaminathan (2000) also report significant momentum effect in the United States. Further, academic studies have tested the performance of relative momentum strategies across various developed European markets and document that these strategies generate significant profits (Antoniou et al., 2007; Forner & Marhuenda, 2003; Griffin et al., 2005; Lui et al., 1999; Rouwenhorst, 1998; Schiereck et al., 1999).
Financial academicians do not restrict themselves to only North American and European markets; they also explore relative momentum effect across Asia-Pacific, Latin America and Middle East/North Africa regions. Chan et al. (2000) examine the performance of conventional momentum strategies in 23 countries (9 from the Asia-Pacific region) and report significant intermediate momentum effect in most Asian-Pacific markets. Nevertheless, academic studies also report weak or no momentum effect in some Asian countries, i.e. Japan, China (Asness, 2011; Lin, 2019; Pan et al., 2013). There is consensus among the financial researchers regarding the presence of momentum effect in the Indian Stock Market. Sehgal and Balakrishnan (2002) report short-term return continuation patterns in the Indian financial market. After that, several studies confirm the findings of Sehgal and Balakrishnan (Ansari & Khan, 2012; Maheshwari & Dhankar, 2017; Mishra & Mohapatra, 2015). Further, research studies also report large and noticeable momentum payoffs in Latin American and Middle Asian countries (Berggrun et al., 2020; Hanauer et al., 2015; Muga & Santamaria, 2007; Zaremba, 2018). In short, the prevalence of momentum effect in almost all parts of the world makes it a universal phenomenon.
More recently, many academic studies report the crash risks associated with conventional momentum strategies (Barroso & Maio, 2019; Barroso & Santa-Clara, 2015; Chabot et al., 2014; Daniel & Moskowitz, 2016; Dobrynskaya, 2015, 2019; Fan et al., 2018; Gaunt, 2016; Grobys et al., 2018; Moreira & Muir, 2017). Barroso and Santa-Clara reveal that relative momentum delivers a return of −73.42% in just two months of the year 2009. Daniel and Moskowitz (2016) find that these severe relative momentum losses occur due to the poor performance of past losers (short positions). Academic studies compare the returns of various factor investment strategies and report that momentum investment strategies are the riskiest investment strategies in terms of higher-order moments and volatility (Barroso & Maio, 2019; Moreira & Muir, 2017). Sensing the importance of this issue, many financial academicians propose alternative momentum frameworks to avoid substantial momentum losses. Several researchers offer volatility-scaled momentum portfolios to reduce the chances of momentum crashes. Barroso and Santa-Clara (2015) suggest that constant volatility-scaled momentum portfolios yield superior payoffs than traditional relative momentum portfolios. In contrast, Daniel and Moskowitz (2016) propose dynamic volatility-scaled momentum portfolios. Fan et al. (2018) compare both of these volatility-scaled approaches and document that dynamic volatility-scaled portfolios perform better. Based on the work of Daniel and Moskowitz (2016), Grobys et al. (2018) propose a risk-managed industry momentum approach. They report that dynamic volatility adjusted industrial momentum portfolios perform better than the standard industrial momentum approach. Financial academicians also propose a residual or idiosyncratic momentum approach to evade momentum crashes. Initially, Blitz et al. (2011) notice formulating momentum portfolios on the basis of idiosyncratic returns rather than total returns results in substantial improvement in risk and return related parameters. To compute idiosyncratic returns, Blitz et al. (2020) use Fama–French three factors. Apart from this study, several other research studies prove the superiority of the residual momentum approach over the relative momentum approach (Chiao et al., 2020; Chang et al., 2018; Lin, 2019; Page et al., 2020). Hanauer and Windmüller (2020) go one step ahead and compare the performances of idiosyncratic momentum, dynamic-scaled and constant-scaled momentum. They report that although all three momentum approaches avoid enormous momentum losses, the idiosyncratic momentum approach proves superior to volatility scaling momentum approaches. Apart from volatility scaling and idiosyncratic momentum, several financial researchers have proposed their own risk-managed momentum approaches. Jacobs et al. (2016) suggest skewness-enhanced momentum. In this approach, long (short) positions are taken in stocks with low (high) skewness. To restrict the huge momentum losses, Han et al. (2016) recommend a plain stop-loss strategy. They find that there is a substantial drop in the monthly momentum losses at a stop loss of 10%. In addition, Dobrynskaya (2019) put forward a ‘dynamic trading strategy’. This dynamic trading rule follows conventional momentum strategy in ordinary circumstances; however, it shifts to contrarian framework following the overall market crash. Recently, Singh et al. (2020) propose triple momentum approach to avoid enormous momentum losses. Table 1 summarizes the significant findings and research studies related to various risk-managed momentum approaches.
Major Research Studies and Their Findings Related to Risk-Managed Momentum Approaches
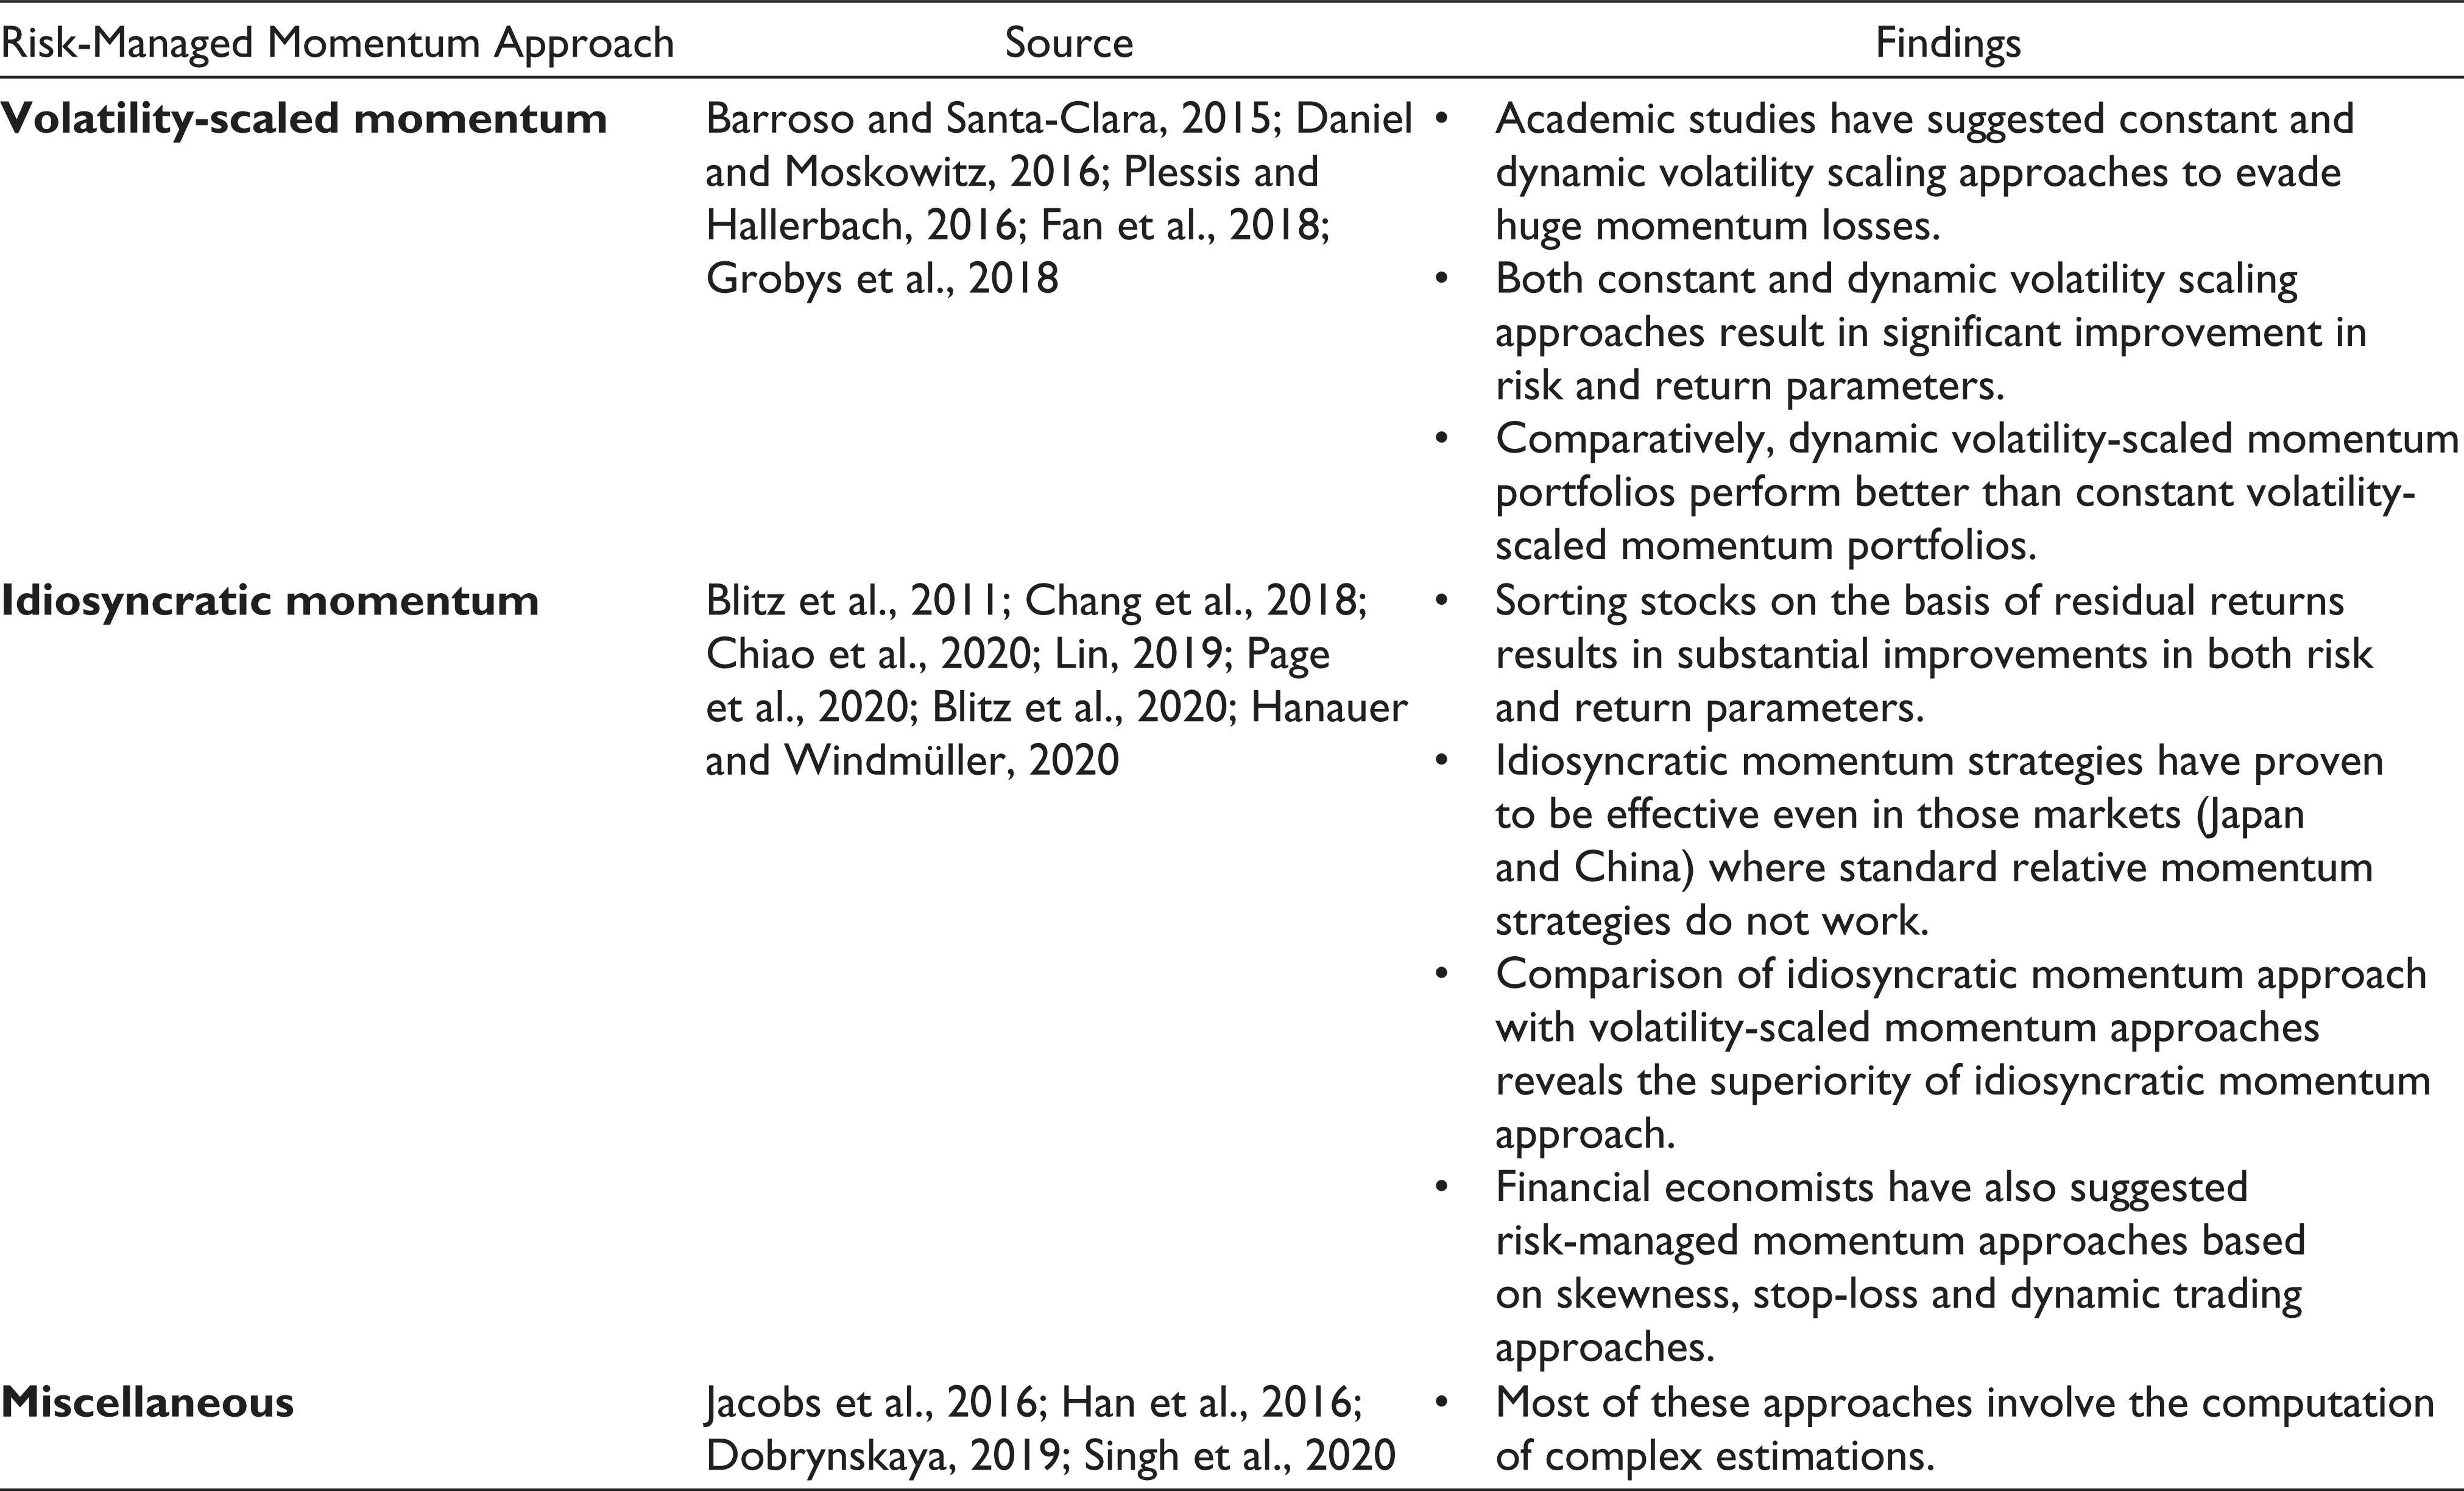
Although financial economists have proposed several risk-managed momentum approaches, the majority of the above-mentioned risk-managed framework involves convoluted computations, which cause difficulty in implementation of these frameworks. In addition, these approaches are tested in developed markets. The present manuscript suggests a plain risk-managed momentum approach and implements this approach in an emerging market, i.e. Indian market.
Data and Methodology
Data Description
The present study has considered the Indian market as research setting. As one of the fastest emerging economics, the Indian market has emerged as the second best-emerging market option for global fund managers (BloombergQuint, 2019). Further, the study has focused on the Bombay Stock Exchange (BSE) as the exchange is the largest stock exchange in the world in terms of listed companies. At first, the study collects monthly adjusted closing prices of all the stocks listed on the BSE covering the period January 2004 to March 2020. The present research considers this sample period as the sample period takes into account all the major expansion and contraction periods over the last two decades. For the final selection of sample stocks, the study uses the following checks: (1) Security should remain listed on BSE over the entire sample period and (2) stock should not be a penny stock. The rationale behind excluding the penny stocks is to avoid potential biases that may arise due to the inclusion of penny stocks (Ince & Porter, 2006). Finally, the authors select 450 stocks after applying above mentioned filtration criteria. The present study has taken implied yield on three months’ treasury bills as a substitute for riskless rate. As most of the academic literature has reported momentum effect in short to intermediate period (3–12 months), the authors have considered monthly data. Required data (monthly stock prices, market price, market capitalization, price to earnings ratio) for the study have been collected from the ProwessIQ financial database. The present study has also relied on Database on Indian Economy for collecting the data related to yields on three months’ treasury bills. After collecting the monthly adjusted closing prices and other related data, the study has applied the following formula to convert these prices into logarithmic returns.
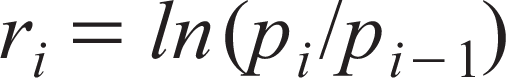
where ri stands for stock i’s log return, ln is natural logarithm, pi stands for current month’s stock price, and pi-1 represents previous month’s stock price.
Relative Momentum Methodology
The authors employ the research methodology outlined by Jegadeesh and Titman (2001) to compute the relative momentum payoffs. As an initial step, the study uses the following formula to calculate 12 months’ cumulative return for each stock.
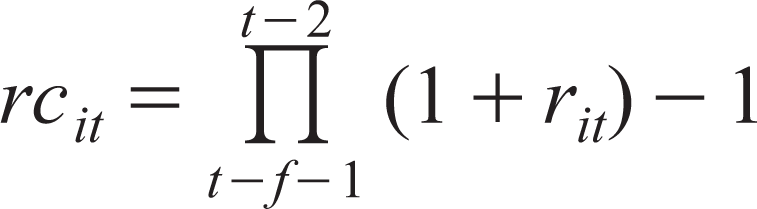
where rcit represents the cumulative return of stock i at time t, f stands for formation period (12 in this case 1 ) and rit represents log return of security i at time t.
Further, the present study ranks these securities in descending order based on their cumulative returns. After ranking, stocks are sorted into ten equal deciles where the top decile represents past winners (best performing securities in recent past), and the bottom decile represents past losers. Following the methodological process recommended by Jegadeesh and Titman (2001), the study takes a long position in past winners and short position in past losers. These long and short portfolios are held for five different time frames (1, 3, 6, 9 and 12 months). For portfolio rebalancing, the study relies on BHAR 2 approach. In the end, we calculate relative momentum payoffs by subtracting the returns of the short portfolio’s payoffs from long portfolio’s payoff. As autocorrelation and heteroscedasticity are general characteristics of most financial series, the present article uses Newey–West t statistics for testing the statistical significance of conventional momentum payoffs.
Risk-Managed Momentum Methodology
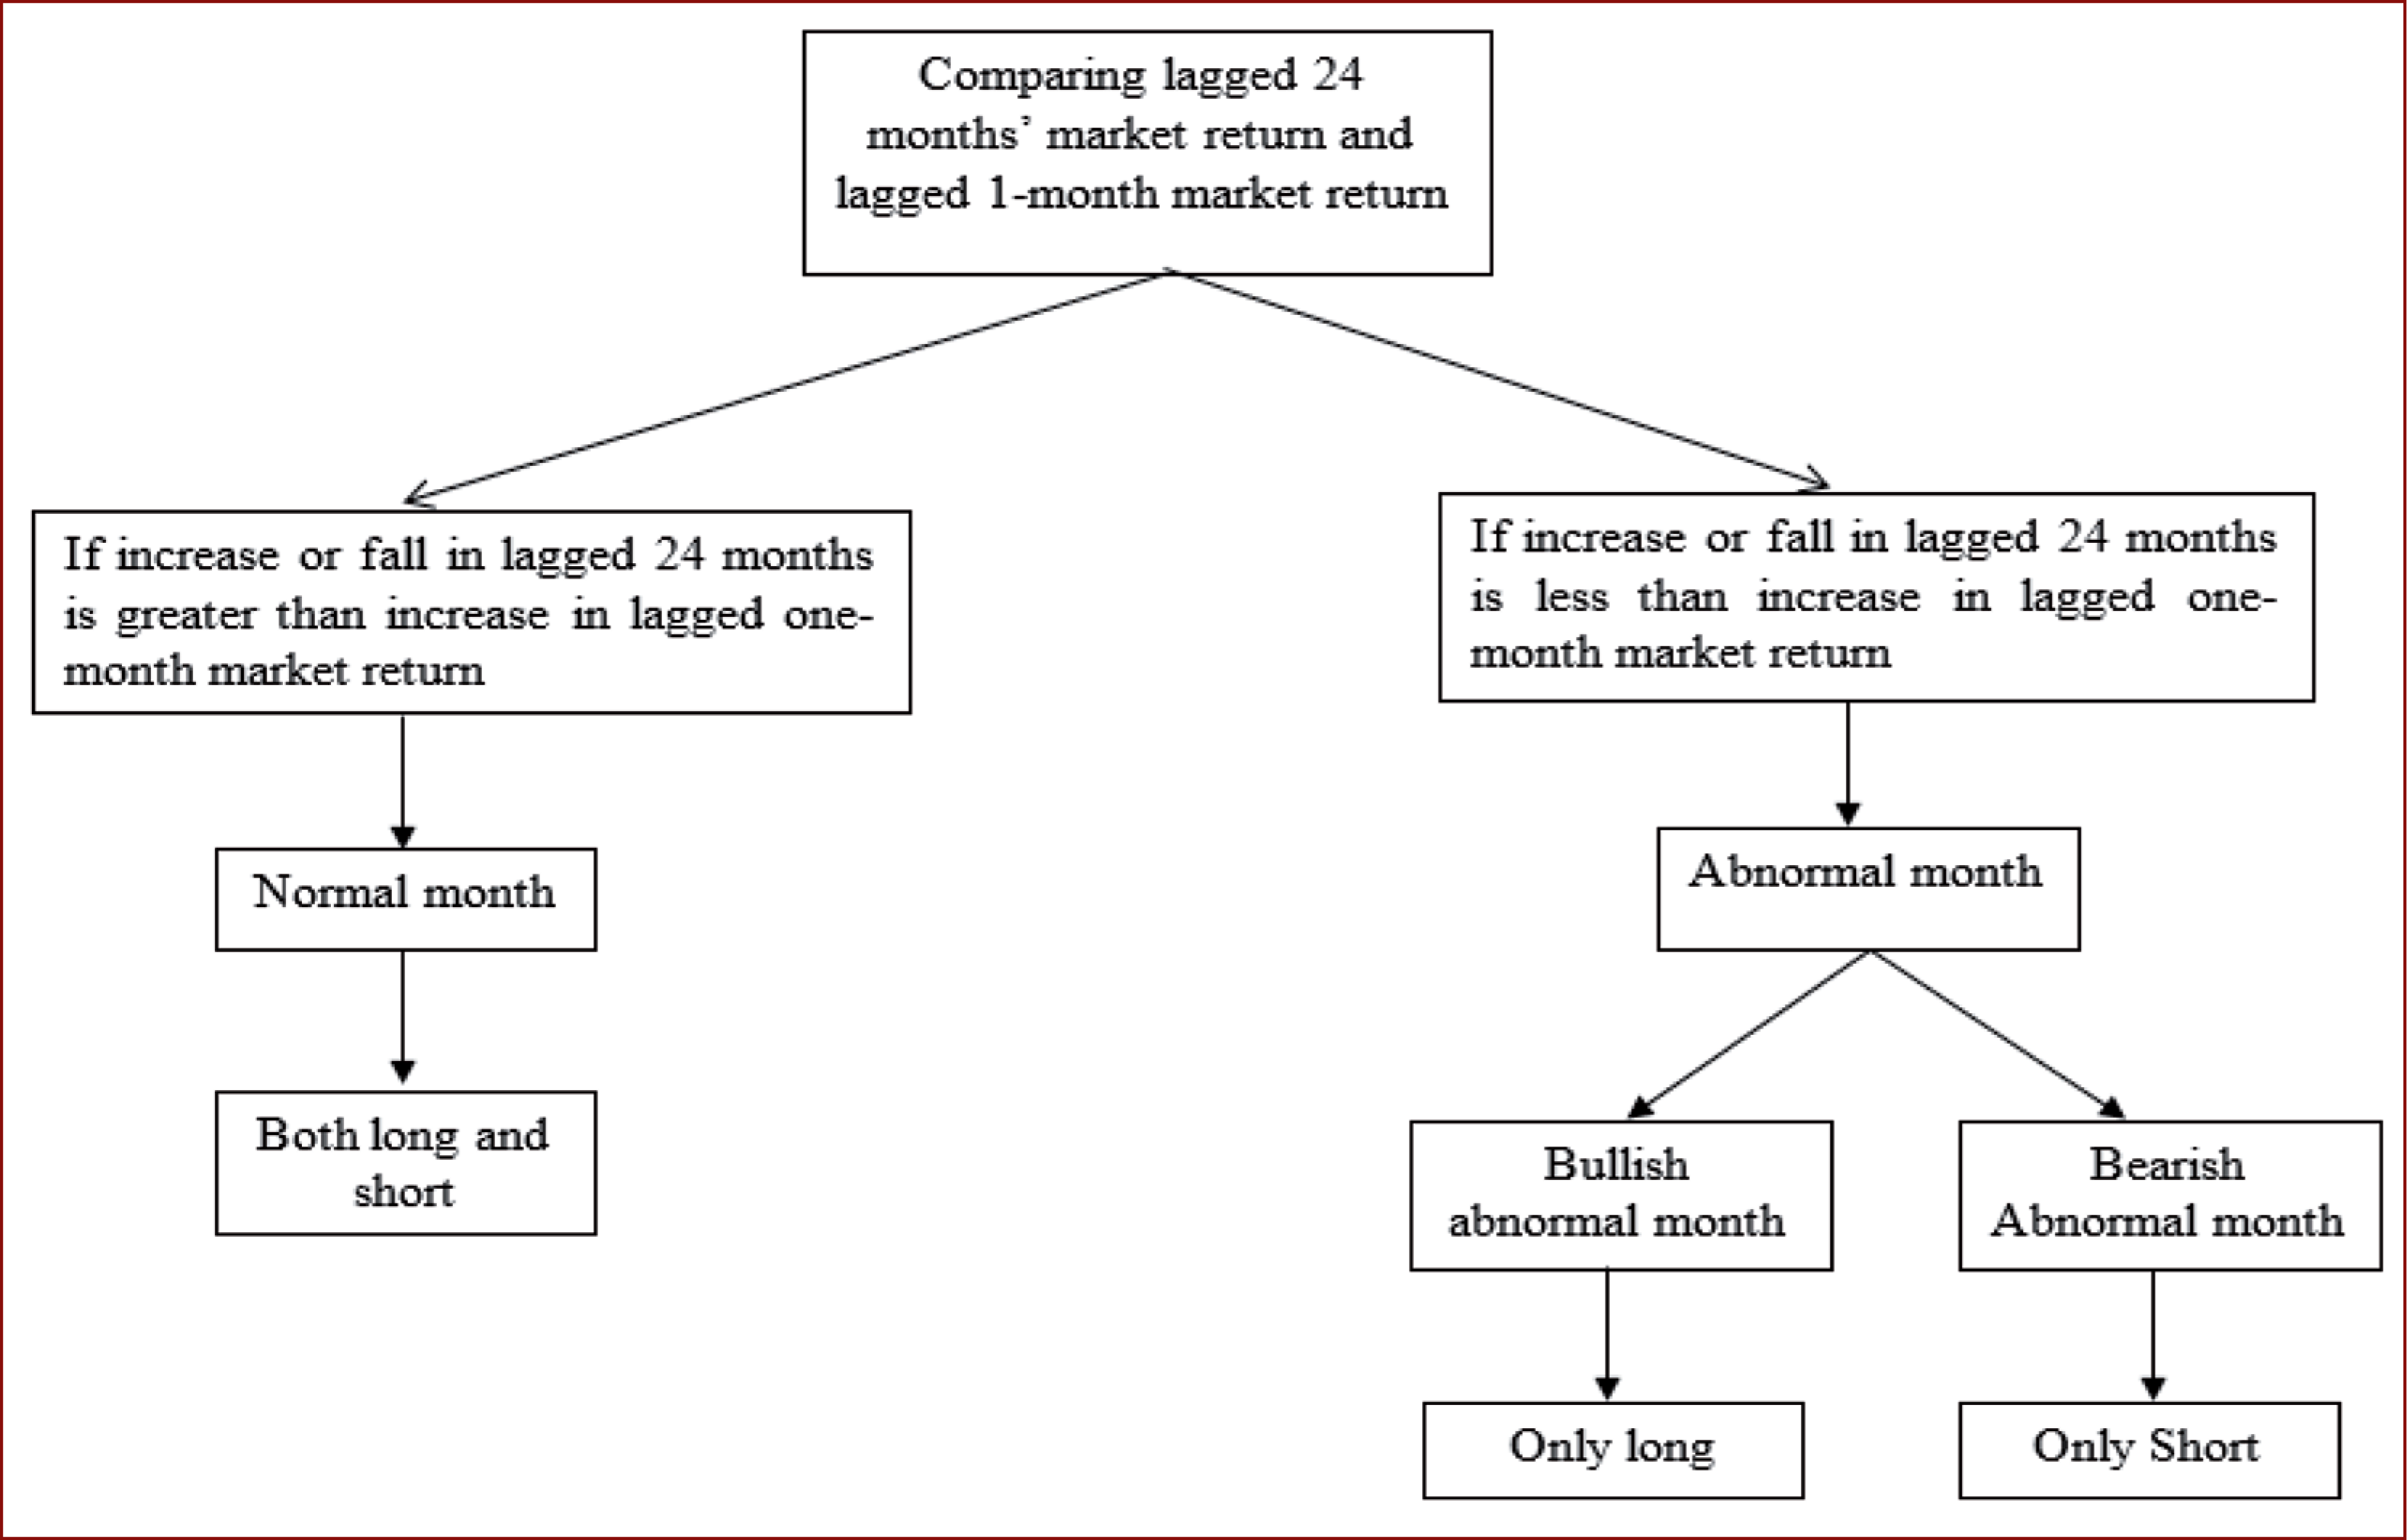
Due to the fact that short positions in relative momentum cause severe losses during the market recovery phase, the present study works on the position aspect (long and short positions) of relative momentum. Risk-managed momentum compares the lagged one-month return with the lagged 24-month market return to determine whether one should take long, short or both long and short positions in a particular month. If increase or fall in lagged 24-month market return is greater than increase or fall in lagged one-month market return, the authors consider this month as a normal month. During normal months, the study takes both long and short positions. In other scenario, if increase or fall in lagged 24-month market return is less than lagged one-month market return in a period, that period will be considered as an abnormal month. Further, the study divides the abnormal periods into two categories: bullish abnormal period and bearish abnormal period. During bullish abnormal months (when increase in lagged one-month market return is greater than the increase in lagged 24-month market return), the study takes only long positions, whereas, during bearish abnormal periods (when fall in lagged one-month market return is greater than fall in lagged 24-month market return), we take only short positions. Figure 1 depicts this whole process. For portfolio weighting, portfolio rebalancing and testing statistical significance, the study follows the same approaches as described in ‘Relative Momentum Methodology’.
Results and Discussions
Relative Momentum Strategies
The study commences the empirical analysis by testing the performance of the relative momentum strategies. Table 2 reports the raw and risk-adjusted returns of various relative momentum strategies along with other descriptive statistical measures. Relative momentum strategies yield considerable and positive payoffs. These payoffs remain substantial even after controlling standard risk factors. 3 These results support the existing relative momentum literature on the Indian market (Ansari & Khan, 2012; Misra & Mohapatra, 2017; Sehgal & Balakrishnan, 2002). However, there is a significant fall in these profits when relative momentum portfolios are held for longer periods (holding for 9 and 12 months). This fall signals towards contrarian effect. Relative momentum generates superior results when portfolios are held for one month as at this combination; relative momentum yields an average monthly return of 1.720%. Although relative momentum strategies generate substantial returns, these returns suffer from excess kurtosis and negative skewness.
Performance of Relative Momentum Strategies
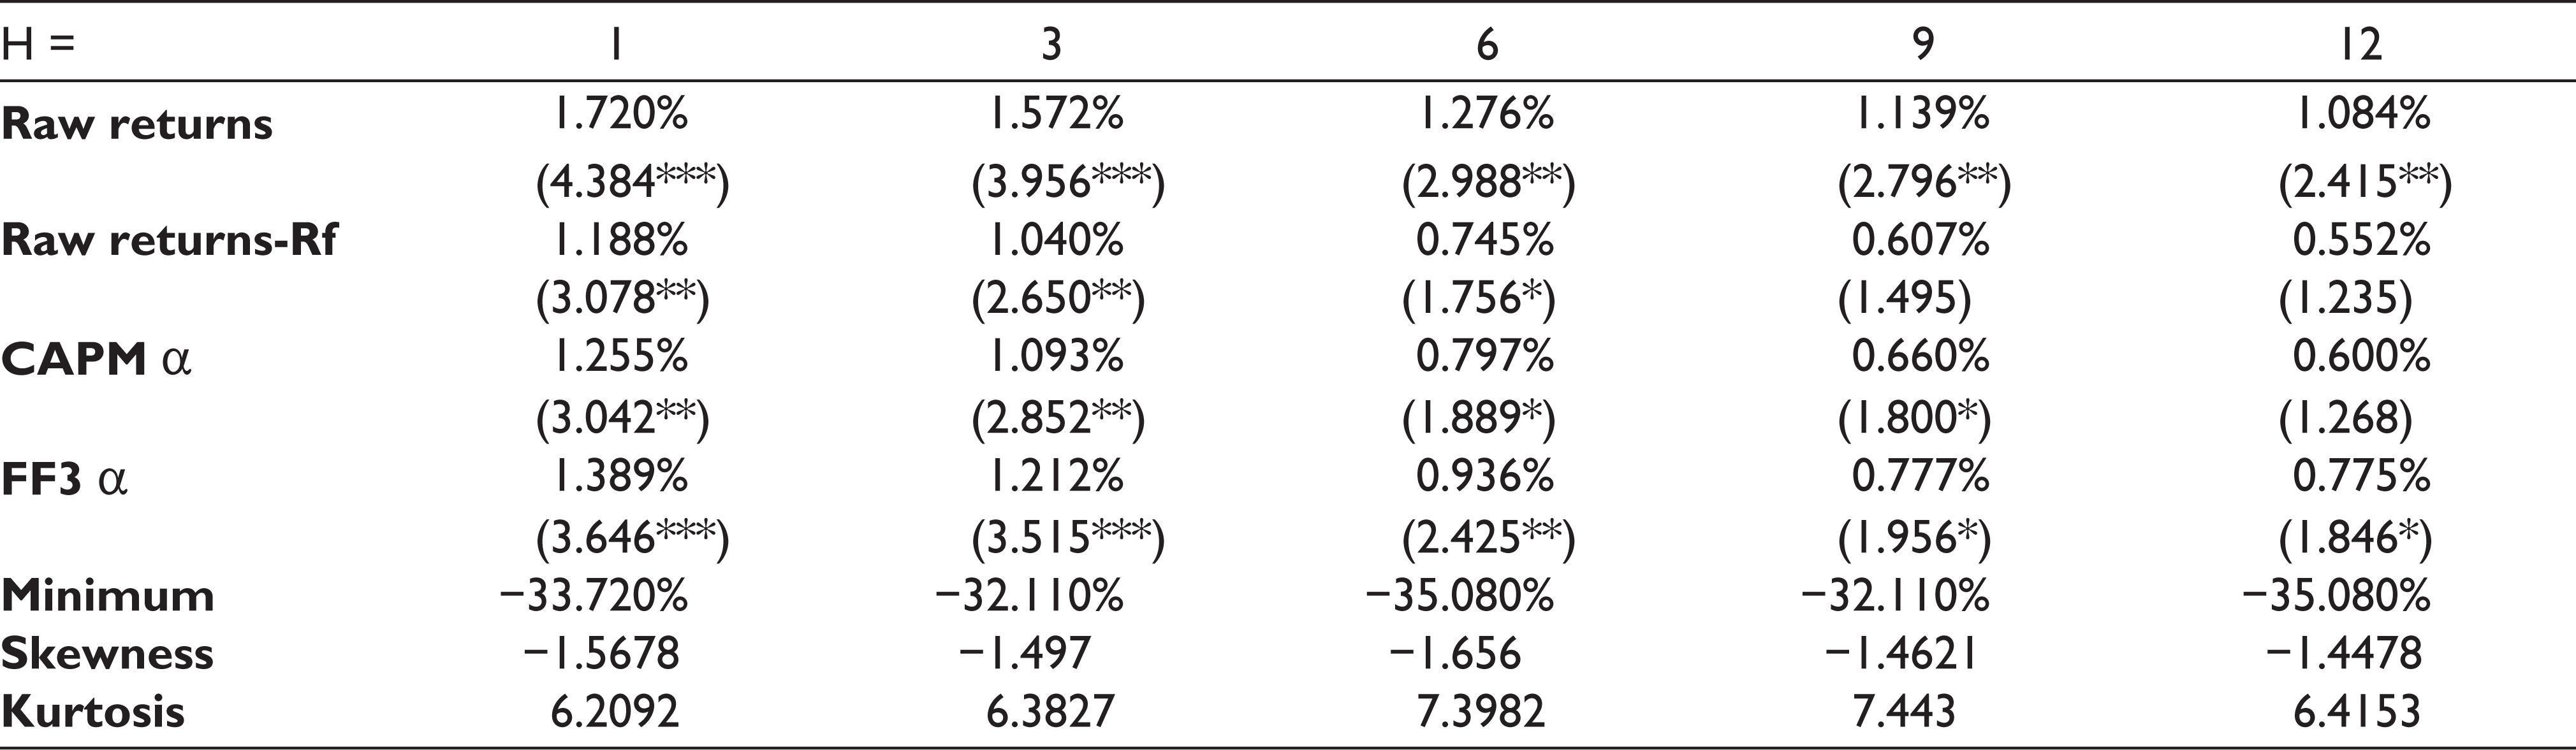
***, **, * represent significance at the 1%, 5% and 10% levels, respectively.
4.2 Relative Momentum Crashes
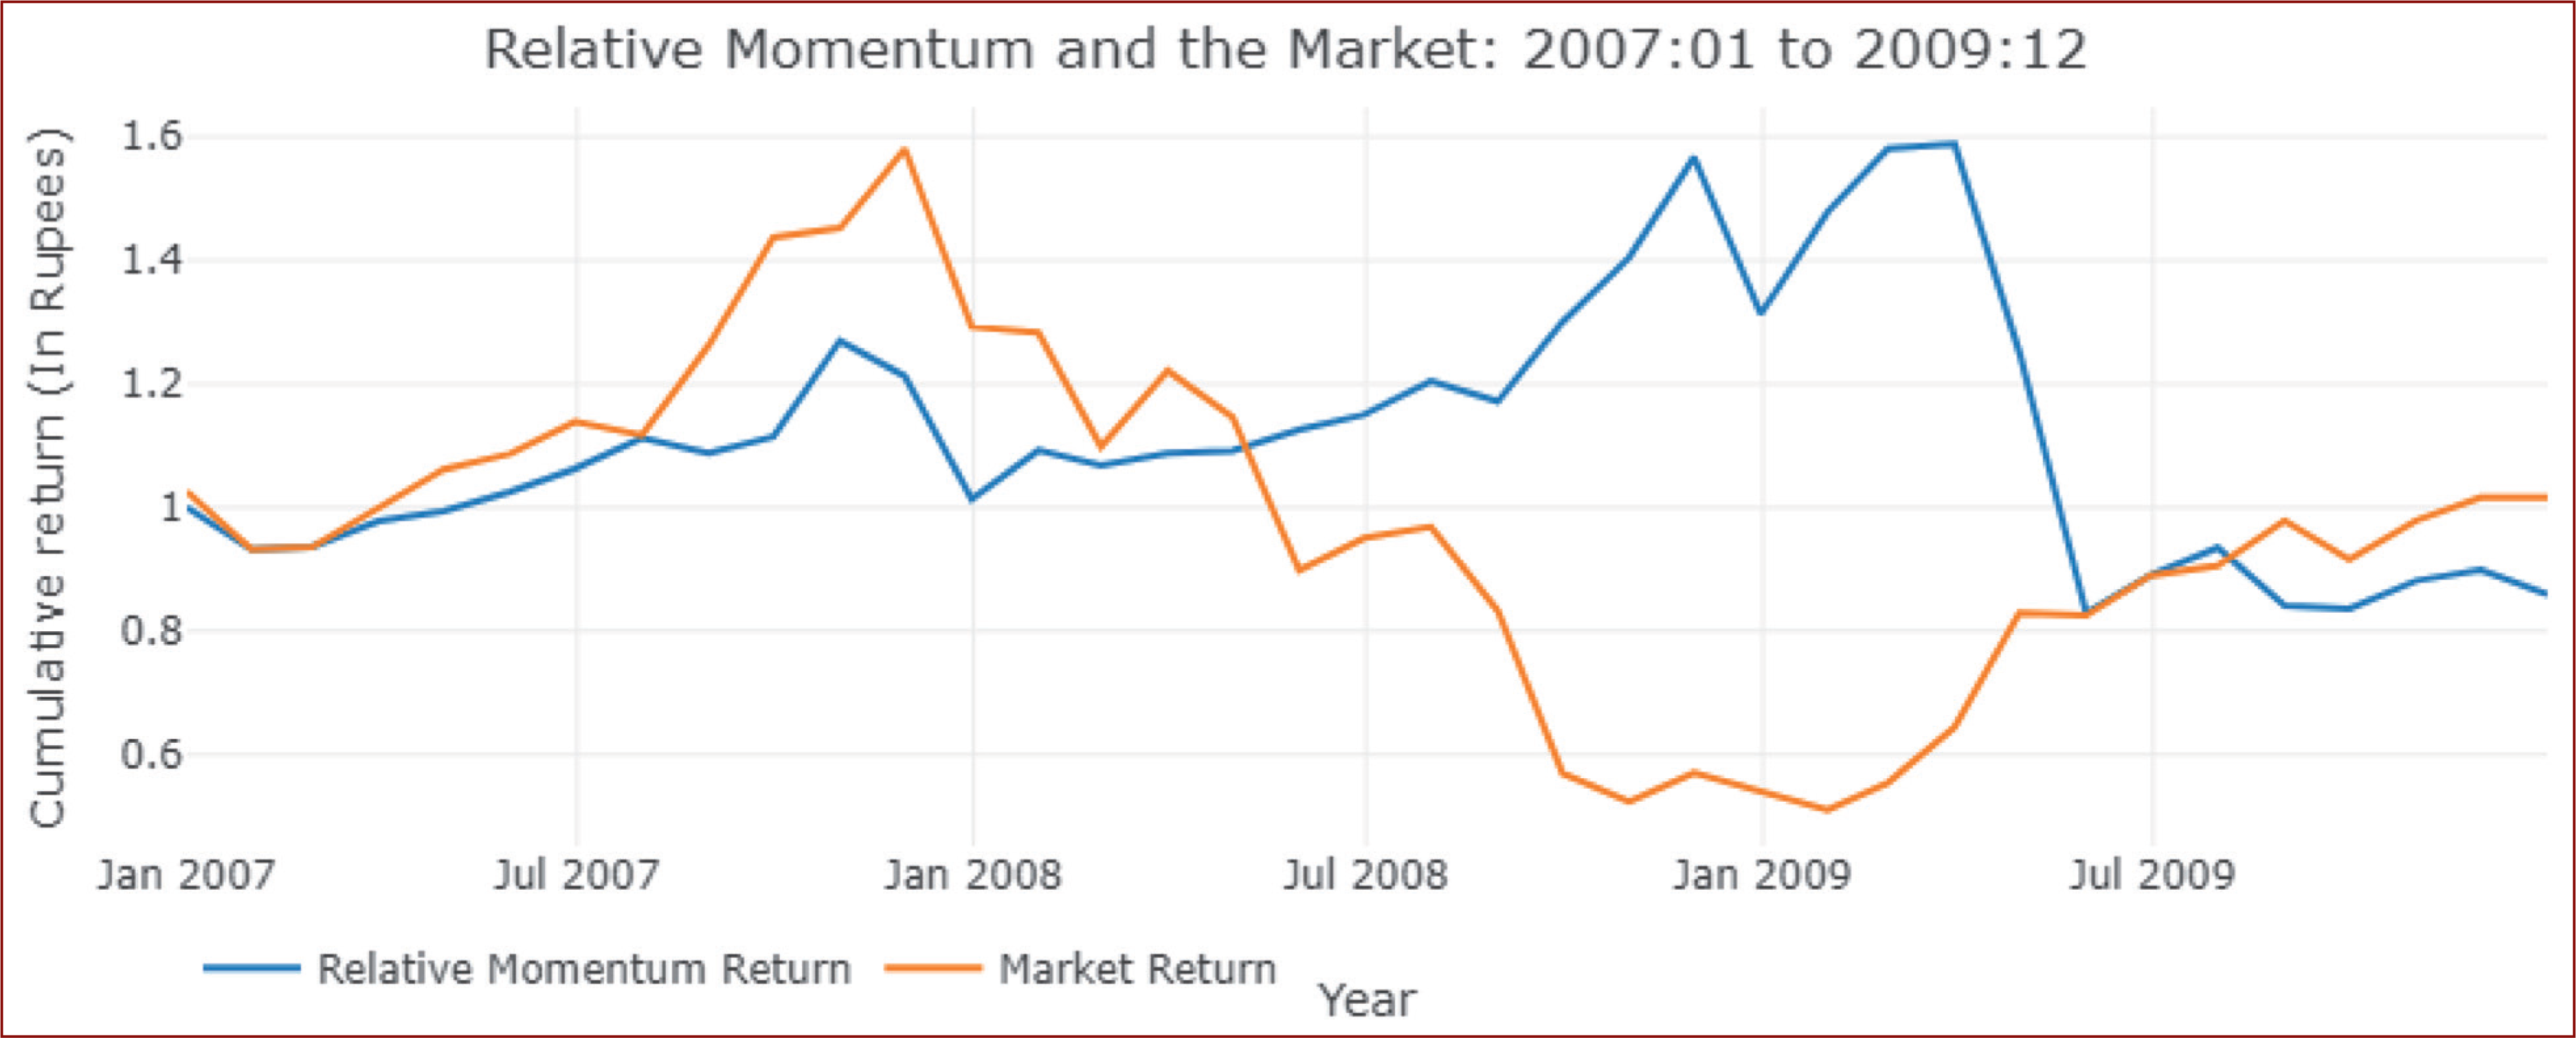
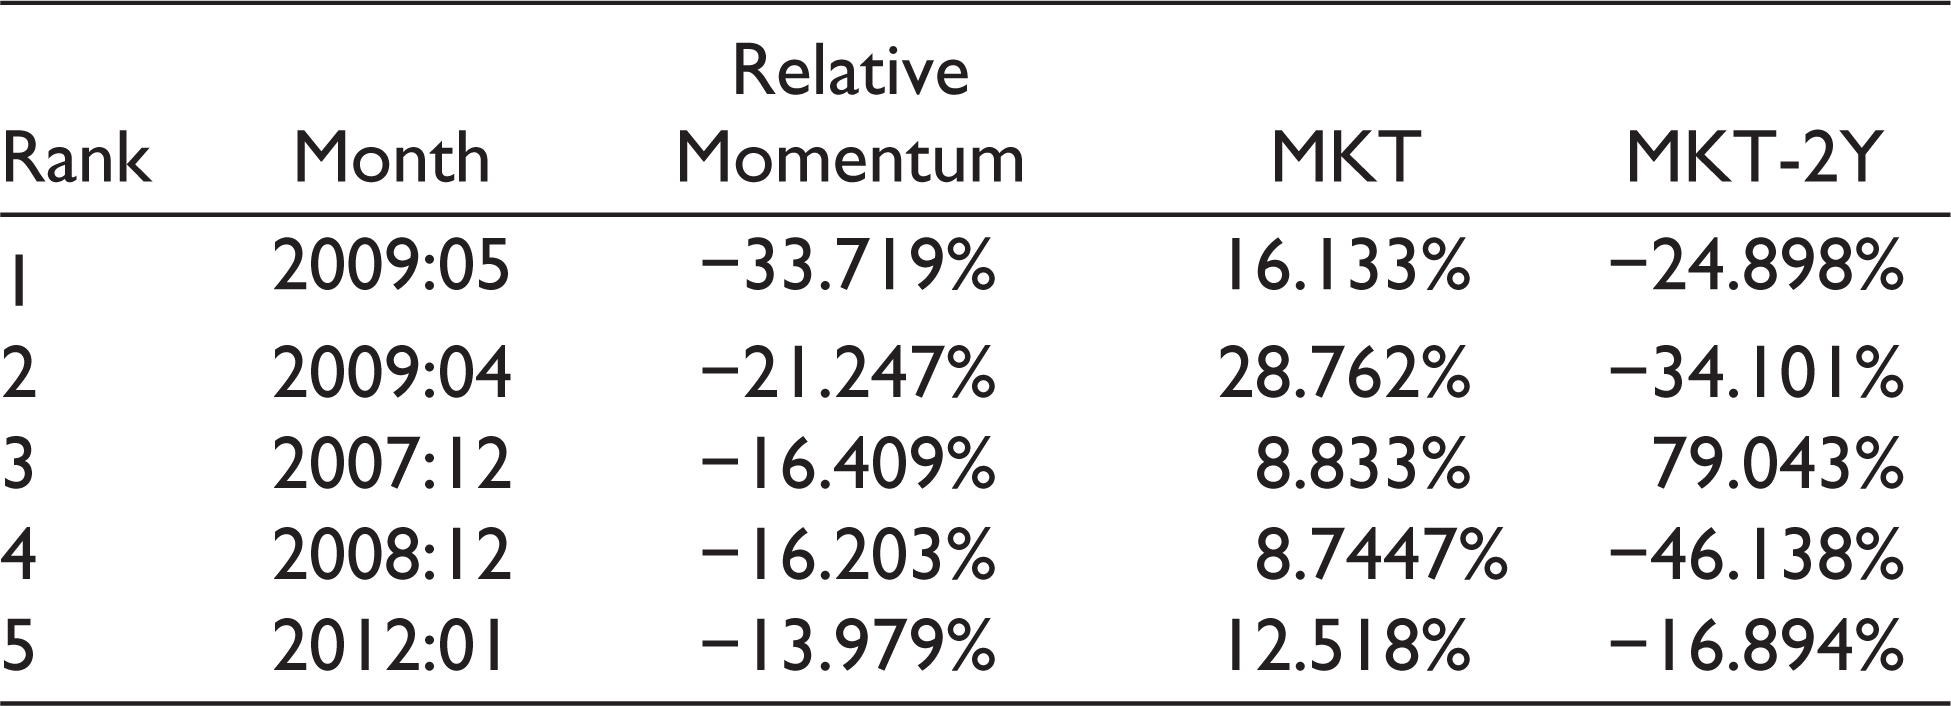
Substantial returns associated with relative momentum make it an attractive trading framework among the investors. Nevertheless, relative momentum payoffs suffer from ‘extreme downside risk’ (Daniel & Moskowitz, 2016; Han et al., 2016). These payoffs are prone to crash occasionally (Barroso & Santa-Clara, 2015; Dobrynskaya, 2019). These rare crashes can eradicate the returns of several years. In Figure 2, the study has shown cumulative market and absolute momentum returns from January 2007 to December 2009. The authors have purposely selected this period, as this period includes the crisis and recovery periods. For showing cumulative returns, the study has set wealth index equal to one. As shown in Figure 2, relative momentum generated a cumulative return of −54.96% from April to May 2009. In just two months, investors lost more than half of their wealth. Further, one more intriguing observation can be drawn from Figure 2. Relative momentum crashes mostly occur during the market recovery phase. During this phase, stocks in the short portfolio (recent losers) experience significant increase, resulting in severe losses. Supporting these findings, Table 3 reports that four out of five worst relative momentum payoffs happened during the months when concurrent (same month) market return experienced a drastic increase and 24-month lagged market return was negative.
Worst Months Relative Momentum Returns
Risk-Managed Momentum
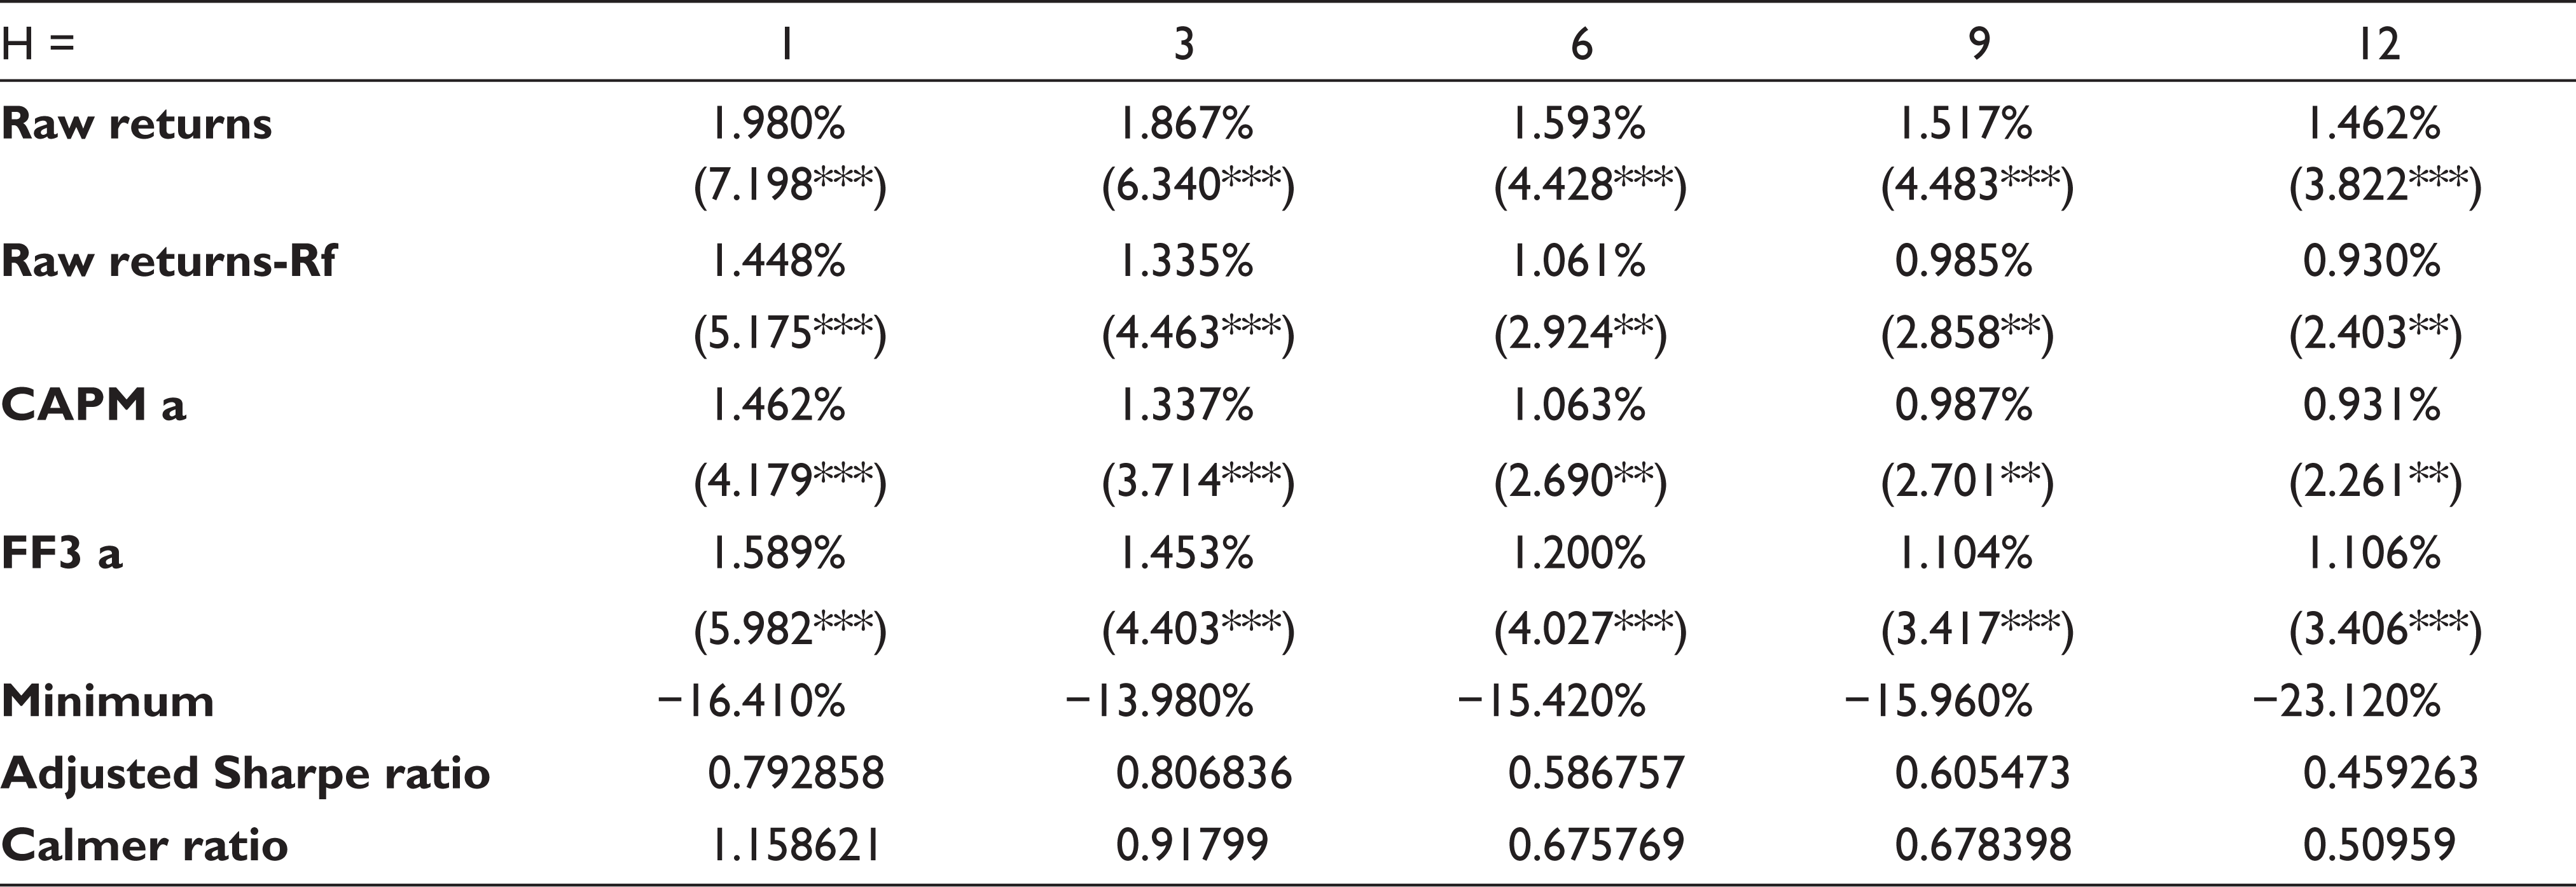
The present research thoroughly examines the relative momentum portfolios and finds that disappointing performance of loser portfolios (short positions) at times of market recovery causes momentum crashes. These findings support the existing literature on momentum crashes (Dobrynskaya, 2019; Fan et al., 2018). Therefore, the present study works on the positions aspect of relative momentum to avoid these crashes. To decide whether to take a long, short or both long–short positions in a particular month, the study compares the lagged one-month return with the lagged 24-month market return. If increase or fall in lagged 24-month market return is greater than increase or fall in lagged one-month market return in a month, that particular month will be considered as a normal month. During normal months, the study will take both long and short positions. If increase or fall in lagged 24-month market return is less than lagged one-month market return in a period, that period will be considered as abnormal month. Further, the study will divide the abnormal periods into two categories: bullish abnormal period and bearish abnormal period. During bullish abnormal months, we will take only long positions, whereas during bearish abnormal periods, we will take only short positions. Authors termed this framework as risk-managed relative momentum. Raw and risk-adjusted returns of various risk-managed relative momentum strategies, along with other descriptive statistics, are reported in Table 4. Consistent with the relative momentum strategies, risk-managed momentum strategies yield large and significant momentum payoffs. These payoffs remain significant even after adjusting standard risk factors. Unlike relative momentum payoffs, risk-managed momentum payoffs remain significant even when momentum portfolios are held for a longer period, i.e. no contrarian effect. Further, risk-managed relative momentum also results in significant improvement in higher-order moments over traditional momentum. Similar to the traditional momentum, risk-managed momentum also delivers superior performance for the shorter time frame (when the holding period is one month).
Performance of Risk-Managed Momentum Strategies
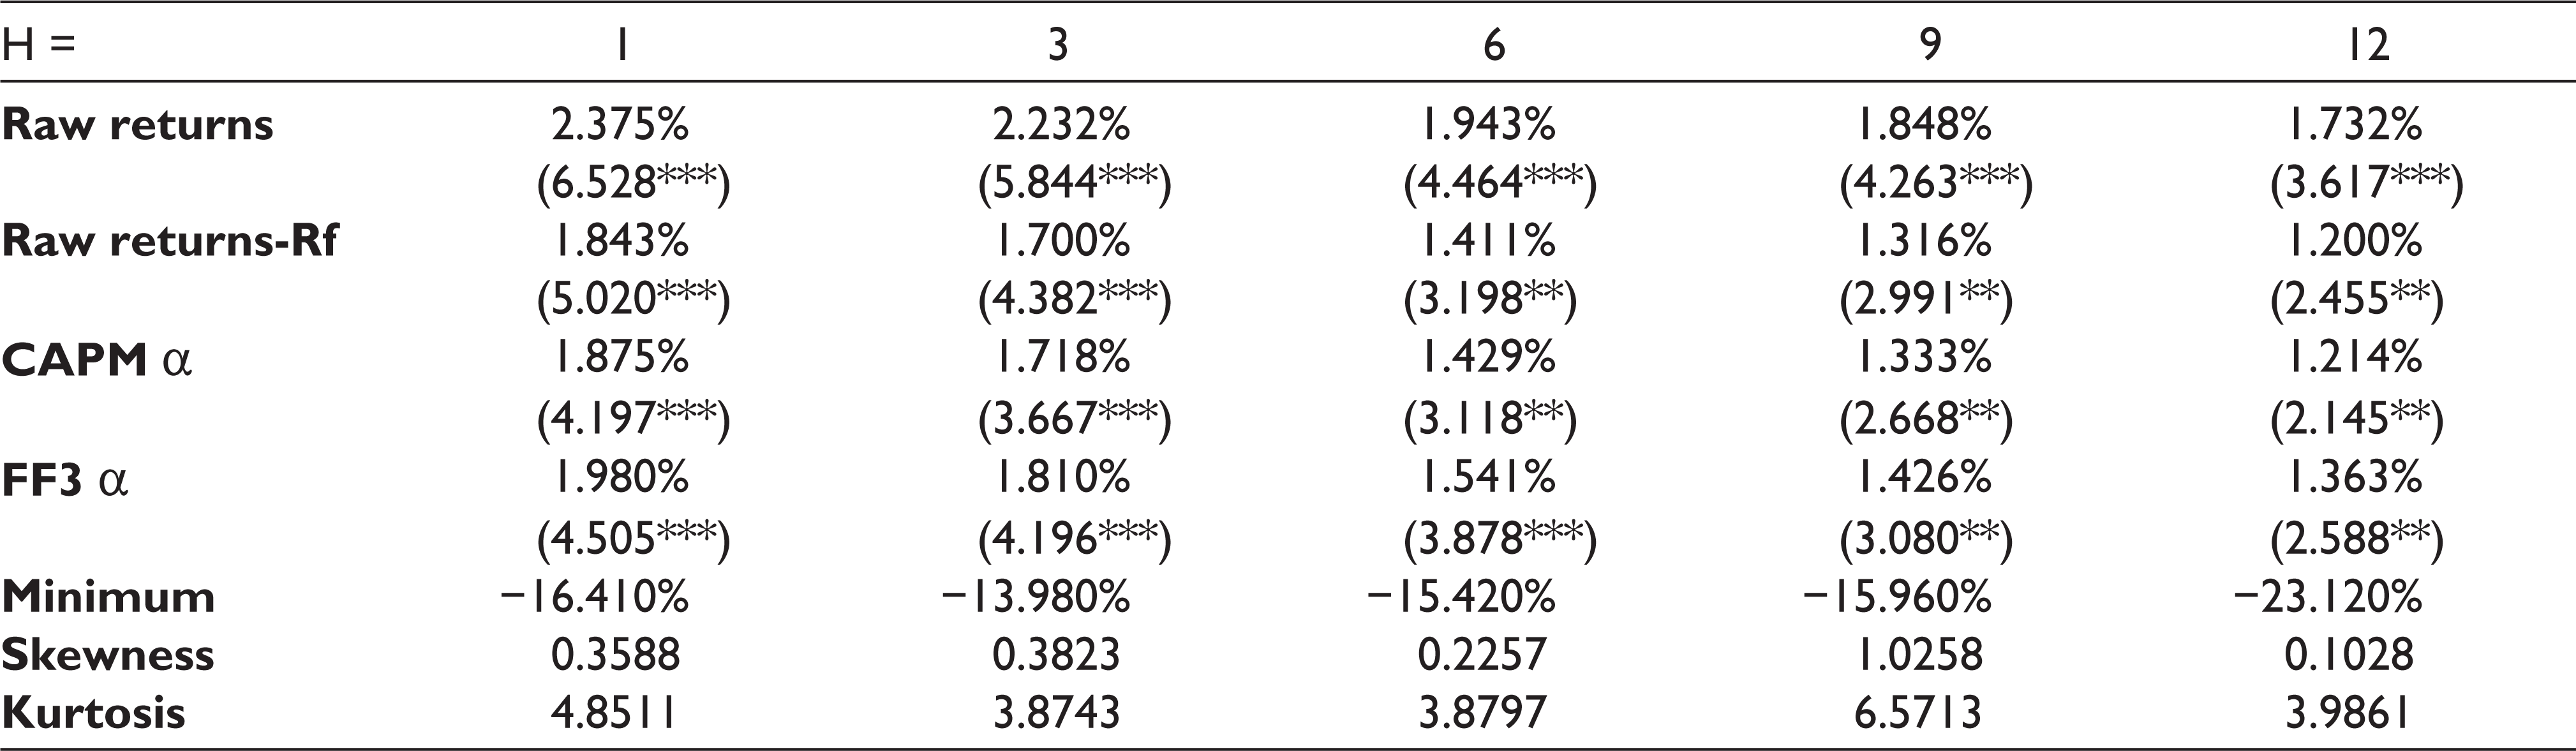
***, **, * represent significance at the 1%, 5% and 10% levels, respectively.
Comparing Relative and Risk-Managed Momentum Payoffs
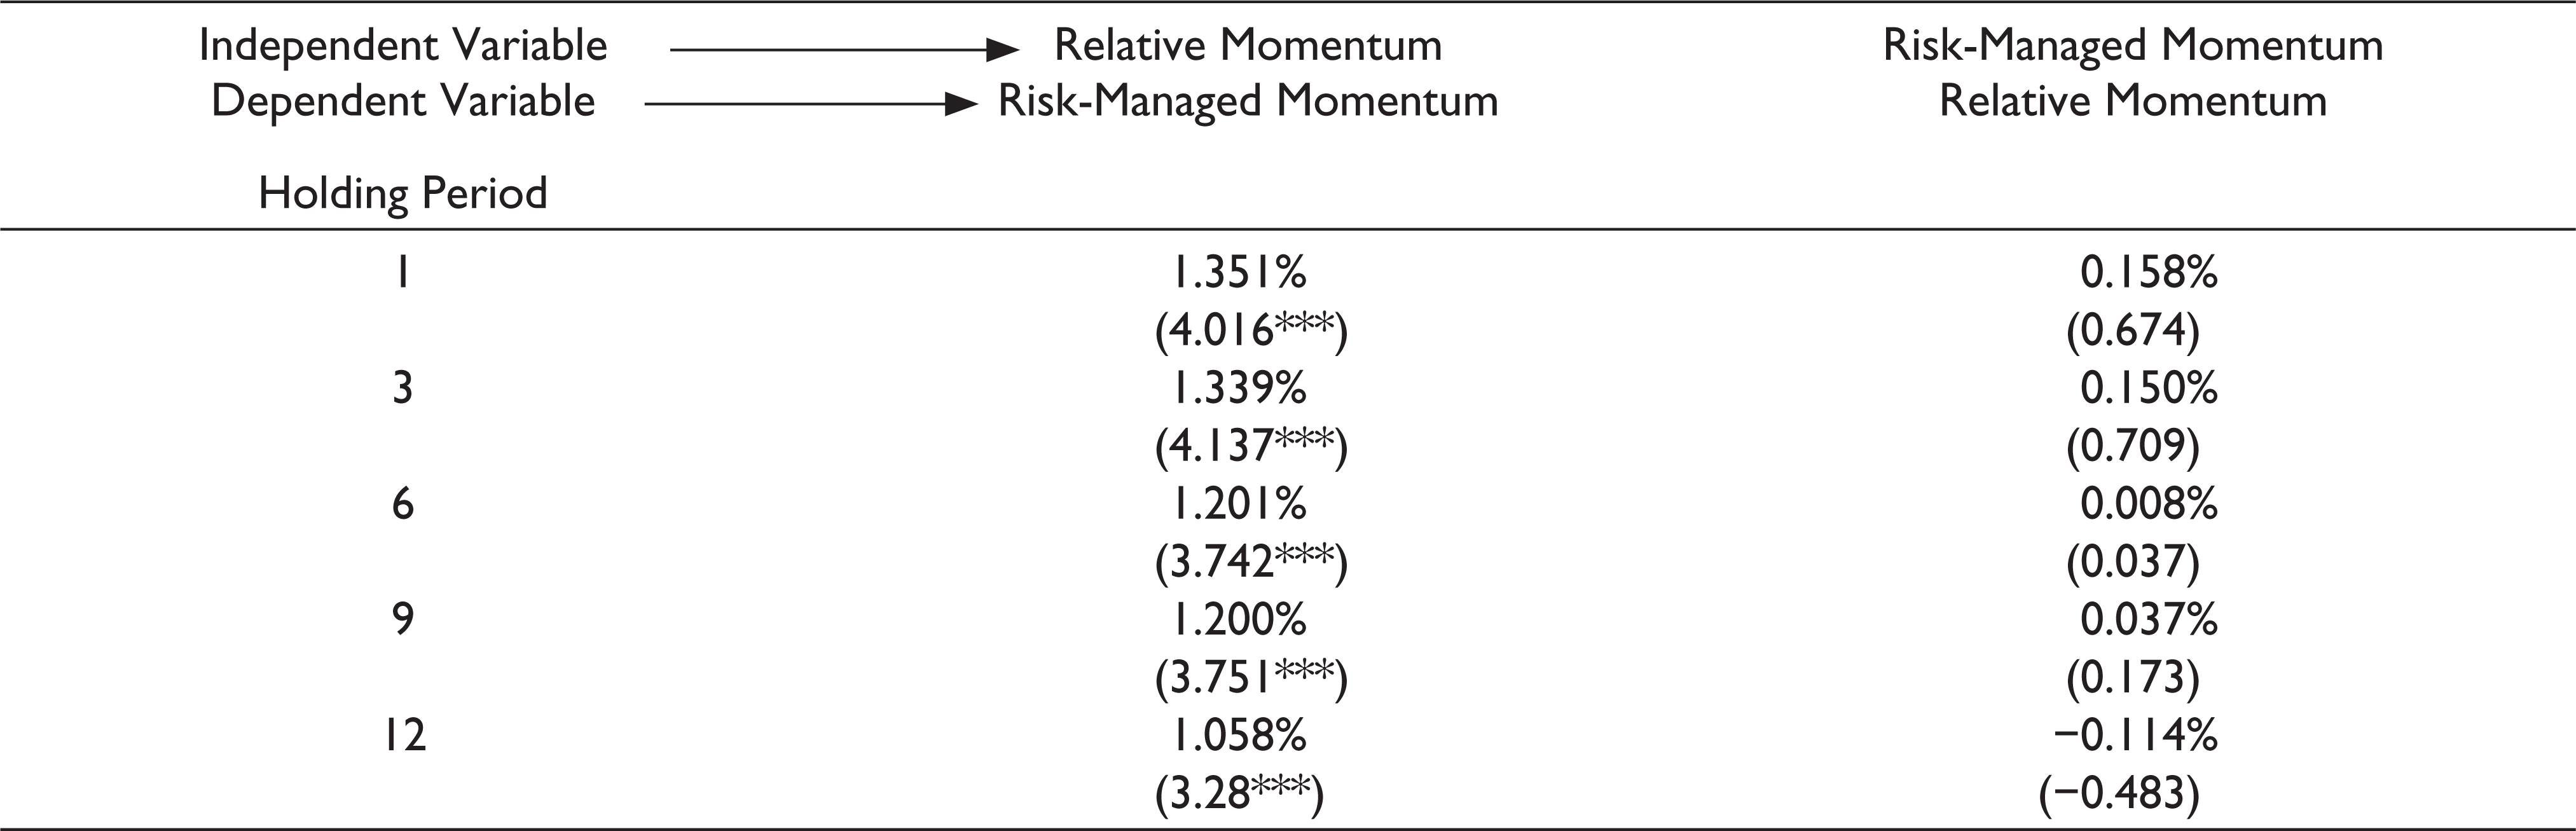
The study adopts the methodology of Moskowitz et al. (2012) to compare the relative and risk-managed relative momentum payoffs. The present study regresses the relative momentum payoffs against risk-managed momentum payoffs and vice versa. Table 5 presents the intercepts from the regression of risk-managed momentum returns against returns of relative momentum and alphas (intercepts) from the regression of relative momentum returns against risk-managed momentum returns. The study finds that risk-managed momentum generated substantial and positive alphas for all holding periods. Substantial and positive alphas imply that relative momentum strategies cannot capture risk-managed momentum payoffs. In contrast, the study finds insignificant alphas (negative in some instances) while regressing relative momentum payoffs against risk-managed momentum payoffs. The above finding implies that risk-managed momentum can explain relative momentum payoffs. In simple words, one can say that risk-managed momentum strategies yield better returns than relative momentum strategies.
Cross Alpha Comparison
Apart from returns, the study also considers risk–reward ratios, 5 downside risks 6 and maximum drawdow 7 for comparing relative and risk-managed momentum payoffs. One can see from Table 6 that risk-managed momentum delivers better results than relative momentum. Risk-managed momentum almost doubles the adjusted Sharpe ratio. It also reduces the downside risk as CVaR (at 5%) drops from −21.105% in case of relative momentum to −8.007% in case of risk-managed momentum. Most significant benefit of risk-managed momentum comes from reduction in maximum drawdown. Maximum drawdown drops from −47.80% to −20.95%.
Comparison of Relative and Risk-Managed Momentum
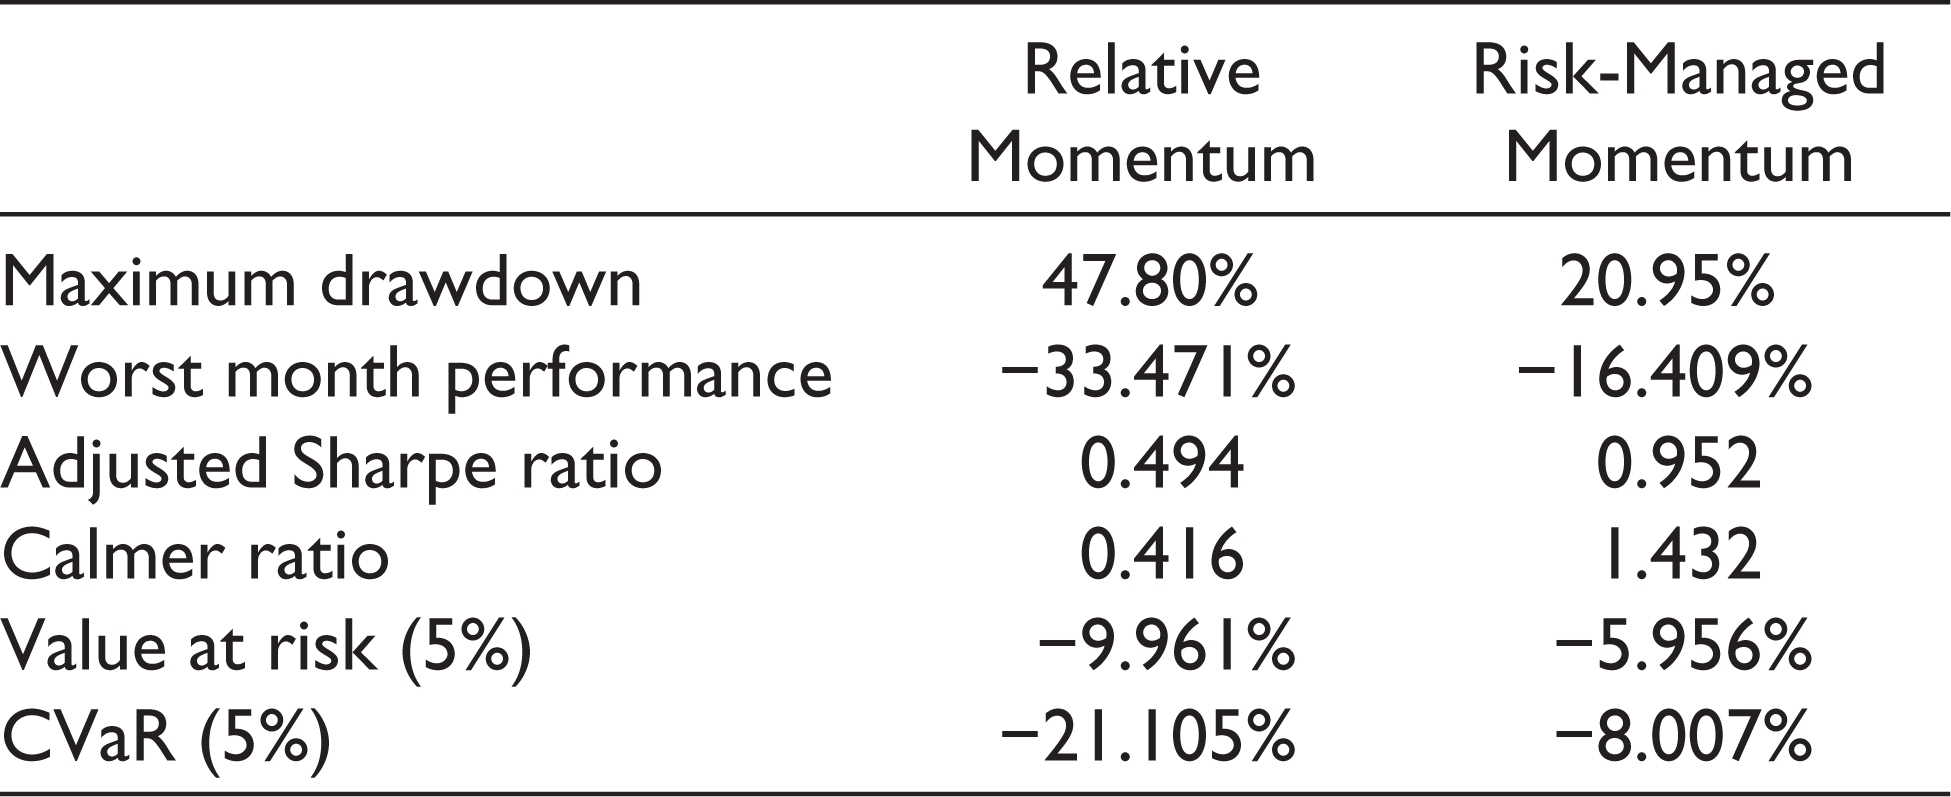
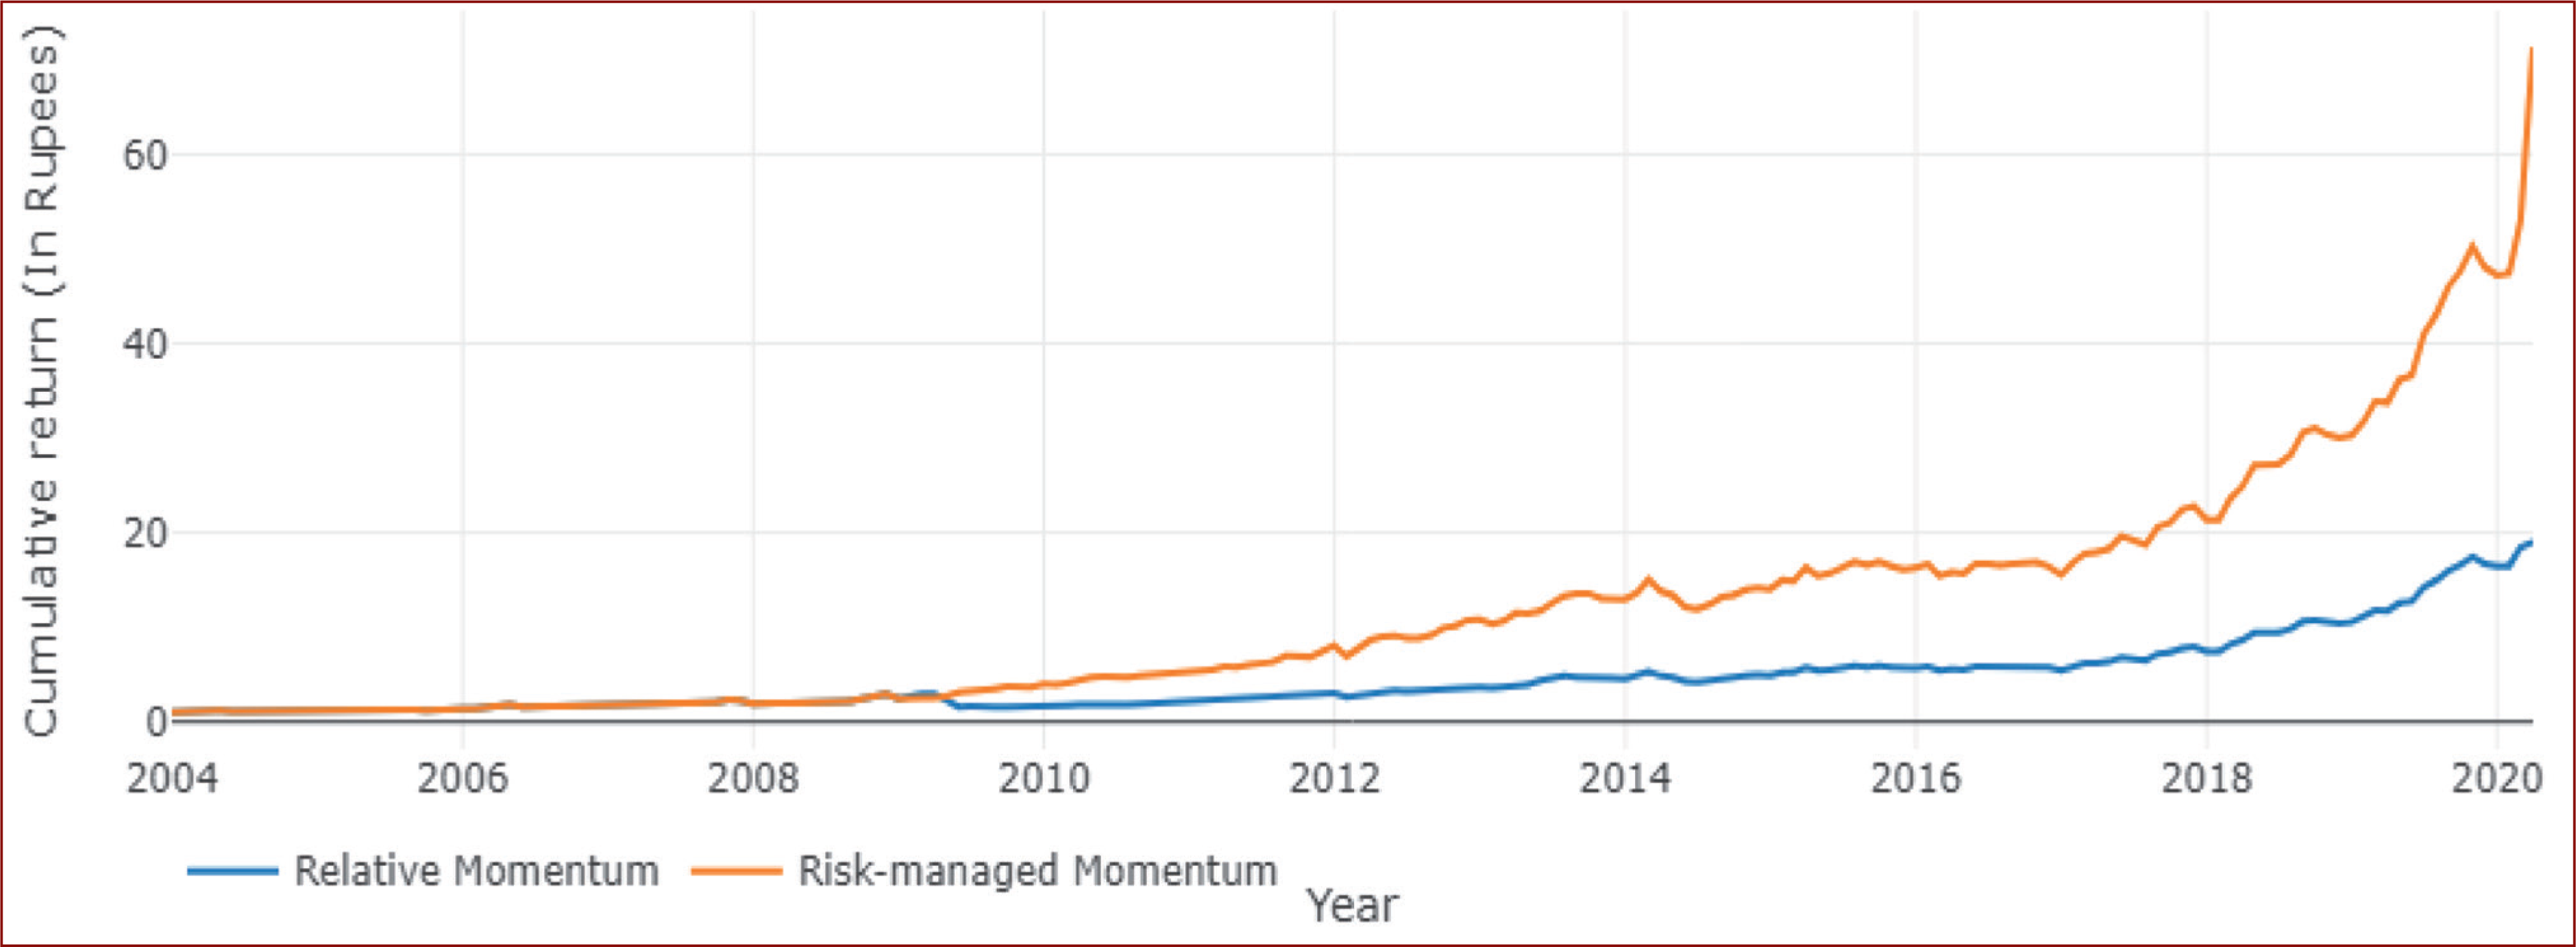
Figure 3 validates the above results by showing that risk-managed momentum delivers better cumulative return than relative momentum. One can see from the figure that one rupee invested (at the beginning of the sample period) in risk-managed momentum portfolios would be worth ₹71.30 at the end of the sample period. On the other hand, it would be worth ₹19.06 if invested in relative momentum portfolios.
Robustness Tests
In this final part of the results and discussions section, the study performs a couple of robustness tests to validate the findings of the study.
Alternative Risk-Managed Momentum
To ensure the consistency of the above results, the study uses an alternative risk-managed momentum framework. In this alternative framework, the present study compares the lagged three-year market return (instead of lagged two years’ market return) with the lagged one-month market return. The research keeps all other settings the same as in the main analysis. Results of the profitability of alternative risk-managed momentum strategies are reported in Table 7. Consistent with the original risk-managed momentum strategies, alternative risk-managed momentum strategies also yield superior returns than classical (relative) momentum. Alternative risk-managed momentum strategies also beat traditional momentum strategies in terms of other performance measures, i.e. risk–reward ratios. These results confirm that risk-managed momentum consistently performs better than relative momentum.
Performance of Alternative Risk-Managed Relative Momentum Strategies
***, ** and * represent significance at the 1%, 5% and 10% levels, respectively.
Subsample Performance Analysis
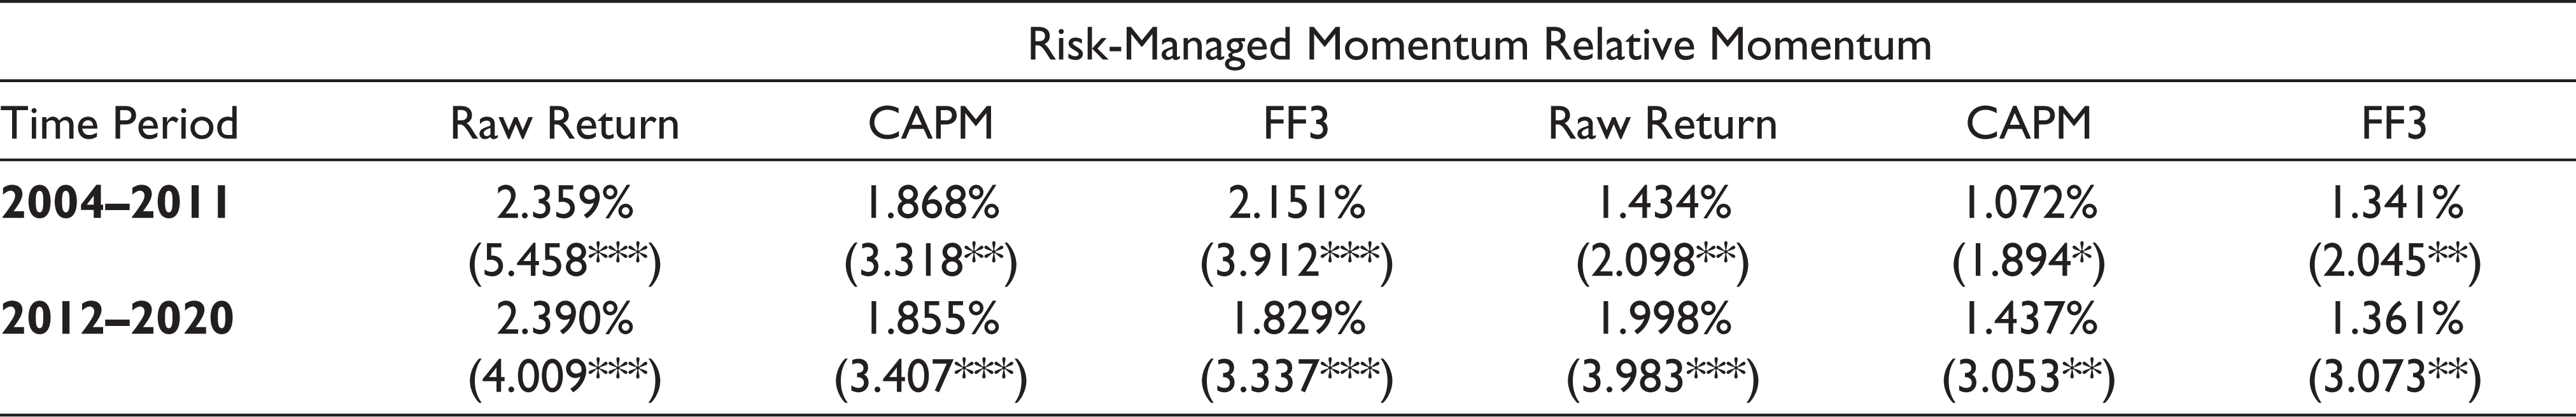
Further, the study divides the overall sample period into two subsample periods: January 2004–December 2011 and January 2012–March 2020 and compare the unconditional and risk-adjusted payoffs of relative and risk-managed momentum payoffs. As shown in Table 8, risk-managed momentum strategies achieve better outcomes than relative momentum frameworks. From these two robustness tests, one can conclude that risk-managed momentum is more improved version of momentum than relative momentum.
Performance of Relative and Risk-Managed Strategies Across Different Subsample Periods
Theoretical and Managerial Implications
Present article offers a plain risk-managed momentum approach. This proposed momentum strategy will help the investment practitioners in consistently generating superior returns. The major issue with conventional momentum strategies is that these strategies work only in the normal circumstances (Maheshwari & Dhankar, 2017). However, the proposed momentum framework continues to generate superior returns in uncertain times. Further, the major challenge in appraisal of active fund managers is the selection of appropriate base (benchmark) index. The payoffs of the proposed momentum strategy can be used as benchmark index. Style-based mutual funds and exchange traded funds have attracted a large number of investors from the last few years. AMC and fund houses can introduce risk-managed momentum funds both for retail and high-net-worth individuals. Nevertheless, the appearance of intermediate term momentum profits has major implications for market regulators as these momentum profits contradict the weak-form efficiency of the Indian market.
Conclusion
Relative momentum continues to generate economic and statistical significant momentum profits in standard settings. Nevertheless, in certain circumstances, i.e. during the times of market recovery, these trading strategies experience severe losses. The poor performance of short portfolios (positions) causes these losses. Therefore, the present study proposes a risk-managed momentum framework which considers the position aspect of original momentum strategies to avoid momentum crashes. Proposed momentum framework delivers superior returns than traditional momentum. In addition, risk-managed momentum also leads to a significant drop in downside risks and maximum drawdowns. Further, the authors obtain consistent results in various robustness checks, i.e. sub-period analysis and alternative risk-managed momentum framework. The study contributes to existing momentum literature by proposing a new momentum framework. Future studies can test this momentum framework in other financial markets. Risk-managed momentum is still in a nascent phase. Academic studies can also focus on potential sources of risk-managed momentum framework. There are certain limitations in the present study. First, the study suffers from survivorship bias as only those stocks are considered that remained listed on BSE during the entire sample period. Second, the study focuses only on the Indian market. Future studies can test the proposed risk-managed momentum strategies in other financial markets. Finally, the study has tested the momentum strategies only in the equity segment. Financial economists can test the efficacy of the proposed risk-managed momentum approach in commodities and currency segments.
Footnotes
Declaration of Conflicting Interests
The authors declared no potential conflicts of interest with respect to the research, authorship and/or publication of this article.
Funding
The authors received no financial support for the research, authorship and/or publication of this article.