
Abstract
The twin paradigm of e-commerce and just-in-time has impelled the global markets for door-to-door service. Shippers do not particularly seek special modes of transport but rather demand performance of transport such as door-to-door service from the multimodal transport service (MTS) operators. Door-to-door service has also led to shift in common terms of trade such as free on board (FOB) and cost insurance freight (CIF) to delivery at place (DAP) or delivery duty paid (DDP) International Commercial Terms (incoterms). In such a case, the sellers are required to plan end-to-end rather than concentrate on port-to-port leg of the delivery process. Multimodal transportation (MMT) includes multiple modes of transport, multiple nodes (terminals) and numerous stakeholders. So far, researchers have focused on the attributes of MTS providers that affect expectations of customers. The present study looks into factors affecting performance of MTS. The approach cuts across the spectrum of qualitative to quantitative assessment. The authors, here, propose opinion mining to decipher the sentiments of clients of logistics service providers followed by open discussion (in a semi-structured format) to collate the soft and hard aspects of MMT chain. The findings of these exercises are used to frame a structured questionnaire for quantitative analysis. Four dimensions affecting quality of MMT have been identified, and one of them is found to be significant only under certain conditions. This article suggests implementation of an integrated digital ecosystem to enhance the quality of MMT in emerging markets like India.
Keywords
Introduction
The twin paradigm of e-commerce (Gunasekaran & Ngai, 2012; Holguı́n & Thorson, 2003) and just-in-time (Lai, 2004; Lu, 2000, 2003; Pearson & Semeijn, 1999; UNCTAD, 1995, 2003; Yang, Marlow, & Lu, 2009) has impelled the global markets to opt for door-to-door service. In addition, the competition in global markets has induced the adoption of strategies such as total quality management (TQM), flexible manufacturing systems (FMS), agile manufacturing, lean production and quick response manufacturing (QRM), among others (Gunasekaran & Ngai, 2012). These also call for on-time, door-to-door delivery and minimization of waste (time and money). Moreover, shippers do not particularly seek special modes of transport but rather demand performance of transport such as door-to-door service from the multimodal transportation (MMT) operators (Henstra & Woxenius, 1999). Door-to-door service can be achieved through MMT and hence it becomes a subject of strategic importance.
Door-to-door service has necessitated a shift from common incoterms such as free-on-board (FOB) and cost-insurance-freight (CIF) to deliver-at-place (DAP) and deliver-duty-paid (DDP). In such a case, the sellers are required to plan end-to-end rather than concentrate on port-to-port leg of the delivery process. This entails plan ning of multimodal logistics that includes multiple modes of transport, multiple nodes (terminals) and numerous stakeholders. The choice of the right incoterms affects the delivery commitments and the total landed cost (Banomyong & Beresford, 2000). The erstwhile popular incoterms such as FOB or CIF are only applicable to marine transporta tion and hence are not considered multimodal terms of trade. The quality of multimodal logistics, together with the product offerings, determines the competitiveness of products in global markets. In developing countries, the logistics cost may constitute around 40 per cent of the total landed cost. The firms need to monitor the quality of transportation (multimodal) and cost of delivery. So far, three dimensions for multimodal transport service (MTS) provider, using the work of Williamson, Spitzer, and Bloomberg (1990), have been tested by Chao (2011). These three dimensions include transportation, facilities, and communication and information. The literature has so far firmly established the key performance indicators of supply chain activities and the attributes of MTS providers (Jharkharia & Shankar, 2007; Lai, 2004; Lai, Ngai, & Cheng, 2002; Lu, 2000, 2003, 2007; Mentzer, Flint, & Kent, 1999; Pearson & Semijn 1999; Stock & Lambert, 1992; Yang et al., 2009), but has provided very little indication on the factors that impact the outcome of service providers, such as the quality of MMT.
In this article, the authors identify these factors and their causality with the perceptions of stakeholders on the quality of MMT. The subject is dealt with in the context of service, whereby the authors base their study on the proposition made by Bienstock, Mentzer, and Bird (1997). In the service context, while expectations of service customers are important, factors affecting the service such as people, procedures, and infrastructure and communication cap abilities are used to develop valid and reliable service-quality measurement instrument. The authors delve beyond the existing research findings and test the causality. The approach cuts across the spectrum of qualitative to quantitative assessment. The authors propose opinion mining to comprehend the sentiments of clients of logistics service providers followed by an open discussion (in a semi-structured format) to collate the soft (i.e., perception of customers and service providers) and hard (i.e., physical parts such as transportation infrastructure) aspects of MMT chain. The findings of these exercises are used to frame a structured questionnaire for quantitative analysis.
The research is directed towards multimodal movement of containerized exports. The next section presents literature review, which is followed by a description of the method ology, analysis and discussions and future scope of research.
Literature Review
Mellat-Parast (2015) explored the determinant of supply chain quality and performance. They found that little attention is paid to quality practices outside the firm level and, hence, advocated the need to bring the concept of quality management outside the firm. The logistics service quality had been found to be interlinked with marketing mix wherein it affects customer satisfaction (Leuschner, Lambert, & Knemeyer, 2012). Politis, Giovanis, and Binioris (2014) used structural equation modelling (SEM) to show that quality management practices affect business performance in German logistics companies. The performance measurement system (PMS) may contain selective bias (Gunasekaran & Kobu, 2007) and, that is why, the authors of this work are suggesting quality improvement. Likierman (2009) had also mentioned flaws in performance measurement as manipulation of metrics, emphasis on numbers, comparison with previous years and previous results. In this article, the authors have taken variables from performance research to identify variables affecting the quality of MMT, but have proposed a distinct tool to measure the effects on the quality.
The existing literature on MMT is skewed towards the First World countries. Dua and Sinha (2016) analysed the literature and found that research on MMT in the Indian context is in a pre-pragmatic phase. According to Neuman (2008), in the pre-pragmatic stage, the research community is small, referencing is done within a group and the problem definition, hypotheses and concepts are also limited. They also stated that concepts and techniques applicable to unimodal transportation require customization, to be applied to MMT. A definite causality between these factors and economic growth needs to be defined to identify the impact of any policy decision made by the governments. Stahlbock and Voß (2007) carried out an extensive literature review on different aspects of a container terminal; however, their focus was on a single point in the transportation chain. Significant research has been done on logistic optimization of container MMT (Assadipour, Ke, & Verma 2015; Bruns, Goerigk, Knust, & Schöbel, 2014; Choong, Cole, & Kutanoglu, 2002; Sun & Lang, 2015), which dealt with aspects of MMT such as optimization exercises for load planning, route planning, wagon settings, cost minimization, empty container movement and congestion reduction. However, these optimization exercises have been discussed in the context between pairs or at a point. A comprehensive analysis considering the complete chain of MMT is also absent in these studies.
Methodology and Data Collection
This section forms the basis to measure the quality of MMT for containerized export. The research methodology for measurement of quality follows the guidelines prescribed for statistical (Churchill, 1979; Gerbing & Anderson, 1988) and contextual (Parasuraman, Berry, & Valarie, 1991; Parasuraman, Berry, & Zeithaml, 1993; Parasuraman, Zeithaml, & Berry, 1985) methods, that is, with regard to measuring the quality of MMT.
Three channels of data collection, namely opinion mining, semi-structured interview and survey administration, have been used in this work to measure the quality of MMT. Semi-structured interview and opinion mining are used to form a structured questionnaire.
No discussion about quality is considered complete without customer’s viewpoint (Reeves & Bednar, 1994). Cook et al. (2002) had also concluded in their work that customer emotions should be considered in a service design. Reduced stress on the customer in availing the service can help in improving customer experience and efficiency gains. To get unbiased customer viewpoints (independent from vendors’ perception), the authors analysed the comments posted by clients in the Facebook pages of the selected logistics service providers. The comments were processed using the SentiStrength software. The outcome of this processing reflects the sentiments or opinions of clients of the logistics service provider. This can be interchangeably referred to as opinion mining or sentiment analysis. A sentiment analysis (opinion mining) programme uses natural language processing statistics to identify sentiment in a text. Sentiments may be positive, negative or neutral. Most of the opinion mining programmes give binary decision, while SentiStrength (software) gives a score in the scale of –5 to +5. This scale has been adopted, described and evaluated in several peer-reviewed academic articles with a large number of citations (Thelwall, 2011). Gonçalves, Araújo, Benevenuto, and Cha (2013) analysed seven opinion mining software, Positive and Negative Affect Schedule [PANAS-t], Emoticons, SailAil Sentiment Analyzer [SASA], Sentinet, Happiness Index, SentiStrength and Linguistic Inquiry and Word Count [LIWC], and found that SentiStrength stands second in the context of maximum agreement among methods and is the only tool that considers weight for adverbial texts. For example, ‘very bad’ is considered more negative than ‘bad’.
The use of opinion mining tools is increasing; however, they still have some drawbacks and limitations. These limitations relate to object identification, feature extraction, grouping of synonyms, opinion orientation classification, identification of comparison between words, different writing styles of people, change of opinions with time, strength of opinions, sarcasm of opinions, mixed view of opinions and spam opinions. In view of the above limitations, the authors in this article have considered opinion mining method as a supporting technique to the semi-structured interview to have a better understanding of the perceptions of the clients in the MMT chain.
The sentiment score of clients is calculated as prescribed by Thelwall (2017). The core of SentiStrength is a lexicon of 2310 sentiment-words and word count programme. The output of SentiStrength is said to be positive when the score is in the range of 1 to 5 and negative when it is between –1 and –5. In the positive sentiment category, the maximum positive score of 5 is the maximum positive value, and similarly –5 shows the maximum negative value. Comments are put in positive or negative category depending upon the absolute higher value of the score. The comments written by the customers, guided by their sentiment, form the basis of the score computed by the software. The absolute score reflects the perception of the client. This programme does not consider grammatical parsing to disambiguate between different senses of a word, as it intends to process informal text and is not completely machine dependent. This makes it more appropriate for social media opinion mining.
The authors applied this tool on customers’ feedback posted on the Facebook pages of five leading logistics companies, namely FedEx, DHL, DTDC, OM Logistics and GATI. The sentiment score for each comment was calculated selecting the maximum between positive sentiment and negative sentiment on the basis of their absolute score. The findings from this opinion mining are:
The shippers get concerned when there is variation in delivery in terms of time, cost, form and quantity. The customers feel discontented when there is a delay in response to their queries by the exporters. The customers of the logistics service providers seek effective information-sharing process and precise consignment tracking facility, which reduces their anxiety and increases satisfaction.
The following hypotheses were put forward from these findings for validation:
H1: The communication in the MMT chain has a positive and significant impact on the expectation of the client in MMT. H2: The variation in the expected time to transport container, cost of transportation, the condition and/or quality of the product inside the container and quantity of products has a significant effect on expectation of stakeholders in the multimodal transport chain.
According to Reeves and Bednar (1994), the definition of quality is subjective and the interpretation may vary between entities. An entity is likely to highlight the areas relevant to it or the difficulty faced by it in particular. In order to have a comprehensive view of the factors affecting the quality and the interpretation of the quality of MMT, the researchers conducted a semi-structured interview. The views and opinion of the stakeholders formed the basis of a structured questionnaire. Zeithaml, Berry, and Parasuraman (1993) inferred that for the purpose of measurement, service quality can be assessed based on the satisfaction of customers against their expectations. Several authors (Reeves & Bednar, 1994; Seth, Deshmukh, & Vrat, 2006) have revealed that the quality-related discussion must be based upon a thorough understanding of constructs.
In this work, respondents comprised manufacturers and exporters, middle-level managers of inland container depot (ICD) and container freight station (CFS), third-party logistics service providers, transporters and operational managers in shipping lines such as Maesrk and COSCO. The researchers developed the understanding of constructs (based on the responses from the semi-structured interview) affecting the quality of MMT and developed the structured questionnaire to collect responses. They independently generated items for endogenous and exogenous constructs. This interpretation provides clear understanding of the meaning of constructs used to define ‘quality of MMT for exports’. The interviewees agreed to the conclusions drawn from the SentiStrength analysis. In addition, the following two hypotheses were formulated based on the observations received against the semi-structured interviews:
H3: The process and documentation has significant effect on the expectation of the clients in MMT. H4: The collaboration among stakeholders in the supply chain has a positive and significant effect on expectation of stakeholders in MMT of goods.
The different constructs, formulated from the aforementioned exercises, are described in the following section.
Constructs
The literature review, SentiStrength analysis and semi-structured interviews revealed five constructs. These include communication, variation, process and documentation, collaboration and expectation of stakeholders.
Communication
As interpreted from the SentiStrength and semi-structured interviews, communication is an important enabler in any supply chain. It requires infrastructure, soft as well as hard, to carry out communication in the supply chain. The information can be utilized in planning if it is received correctly, timely and is easy to interpret. To measure the communication construct, five items on a seven-point scale are used. These are: the infrastructure required, timeliness and willingness of the communicator, the skill of the representative and standardization of information.
Variation
It is the measure of unexpectedness. Timeliness, safety and cost are direct indicators of an effective MMT chain. The variations in time, cost, quantity and form indicate the quality of MMT. Here variation in time implies deviation from the expected arrival time. By variation in time, the researcher intends to find the frequency of deviation from the scheduled time of operation. Variation in cost refers to the overrunning of the cost of logistics or operation by stakeholders executing MMT. The interviewees informed that they experience unexpected cost levied by different agencies under the nomenclature of ‘landside cost’. These are lesser known costs that sneak into the shipper’s cost. These costs are less complicated if the buyer and the seller understand them. However, such costs are incurred due to lack of communication or uncertainty in the terminals. ‘Variation in quantity’ means short shipment or short landing and receipt of goods (in terms of quantity) due to incorrect stowage planning, damage, theft or misplacement. ‘Variation in form’ implies distortion or deformation of the shape, characteristics or quality of products dispatched. The interviewees opined that low cost, per se, is not an important criterion once the shipper agrees to bear the same. This means, they are looking for the right service at the right cost. However, any deviation means a disruption of flow of goods and materials.
Process and Documentation
Process and documentation is an important component in an MMT chain. Especially in international business, the number of documents and complexity of processes are high. This complexity affects the performance of an MMT chain. The interviewees put forward that the outcomes of MMT are affected by the bureaucratic system, lack of standardization and low competence of the service providers in matters related to process execution and documentation.
Collaboration
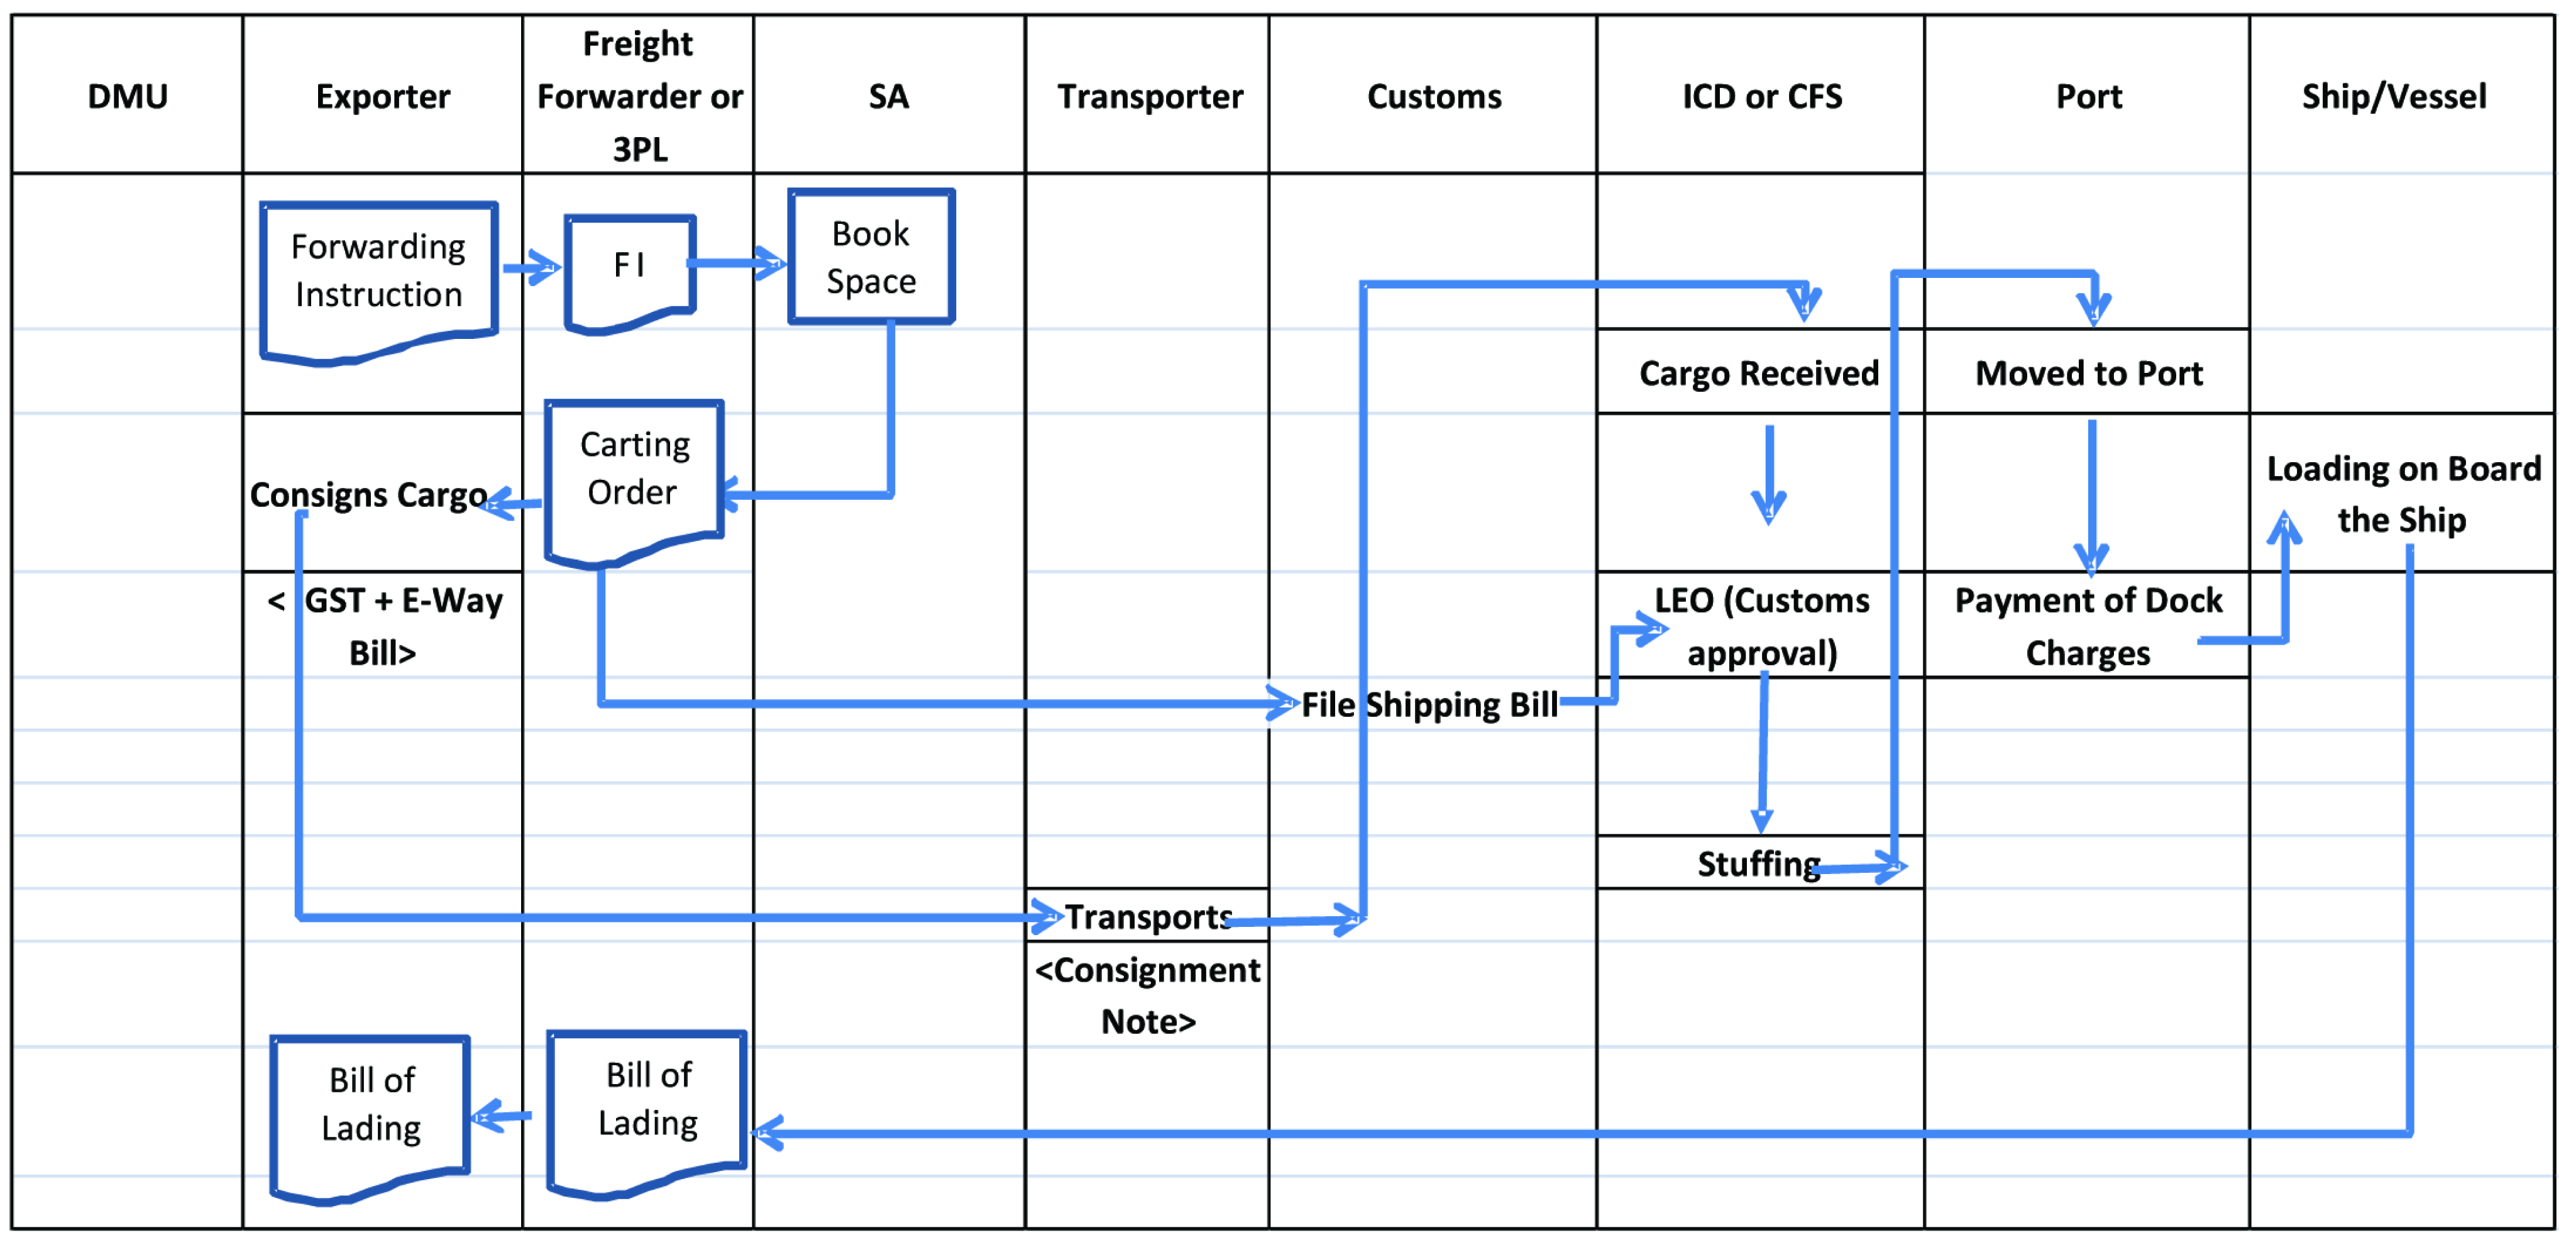
It refers to shared spirit of tackling challenges among the stakeholders in MMT chain. The chain comprises multiple modes, nodes (terminals) and stakeholders. The respondents (of semi-structured interviews) observed that the quality of delivery in an MMT chain suffers when collaboration among the entities is weak. This is especially experienced when the stakeholders are fragmented, weak in compliances and their planning (strategic, operational and tactical) is disjoint. In case of containerized movement of export cargo, the shippers forward the forwarding instructions to the freight forwarder or the third-party logistics provider, who in turn negotiates with the shipping lines and forwards the cargo to an ICD or CFS. At this point, the cargo is stuffed in a container, and with due approval from the Customs it is moved to the port. At the port, the documents meant for ports are submitted and acknowledged followed by the loading of the cargo on the ship. This is illustrated in Figure 1, which shows that there are eight stakeholders, around 10 documents and three nodes (the exporter’s warehouse, ICD or CFS and port). Collaboration between the stakeholders appears to be of utmost signi ficance. Hence, this hypothesis needs testing too.
Expectation of Stakeholders
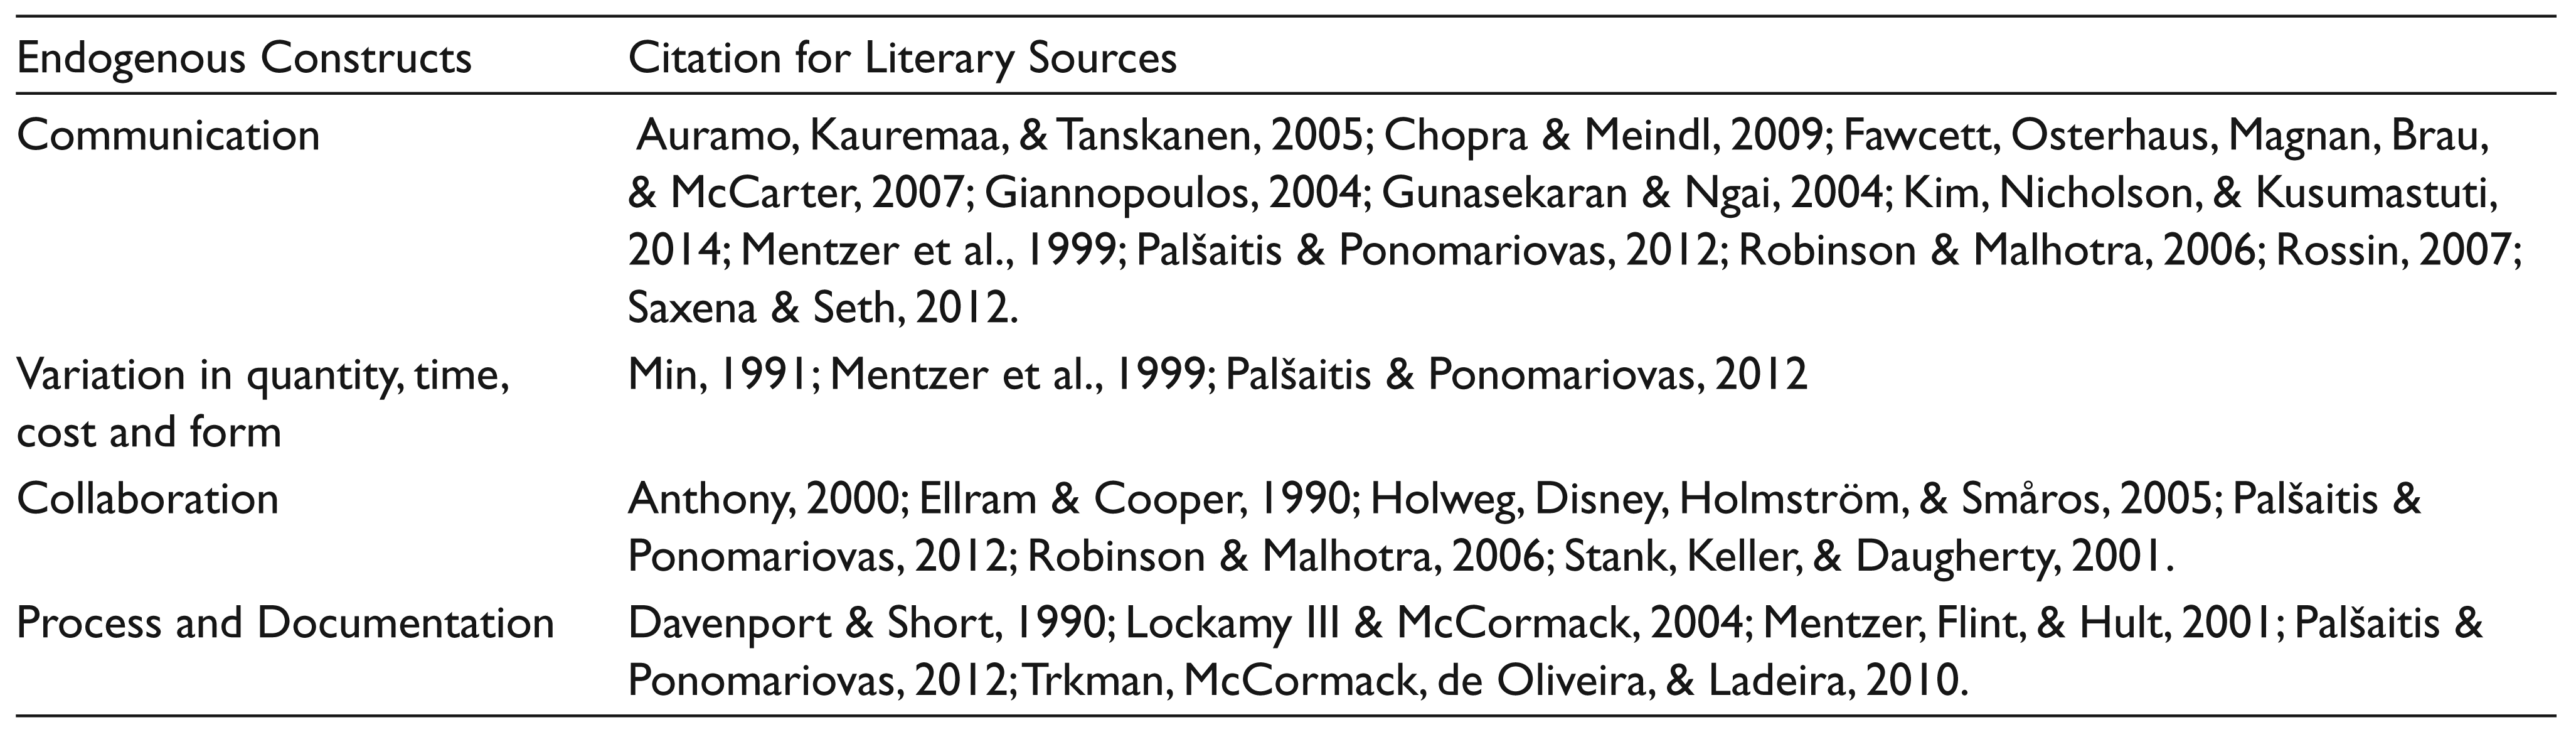
The execution of business processes is expected to fulfil the expectations of clients or stakeholders.. The gap between the expected service and perceived service is a direct measure of service quality. The aforementioned four factors impact the expectation in an MMT chain. The items for measuring the expectation of the client have been selected as per the recommendations of Parasuraman et al. (1991) and Zeithaml, Berry, and Parasuraman (1993). Table 1 enlists the literature that supports these constructs.
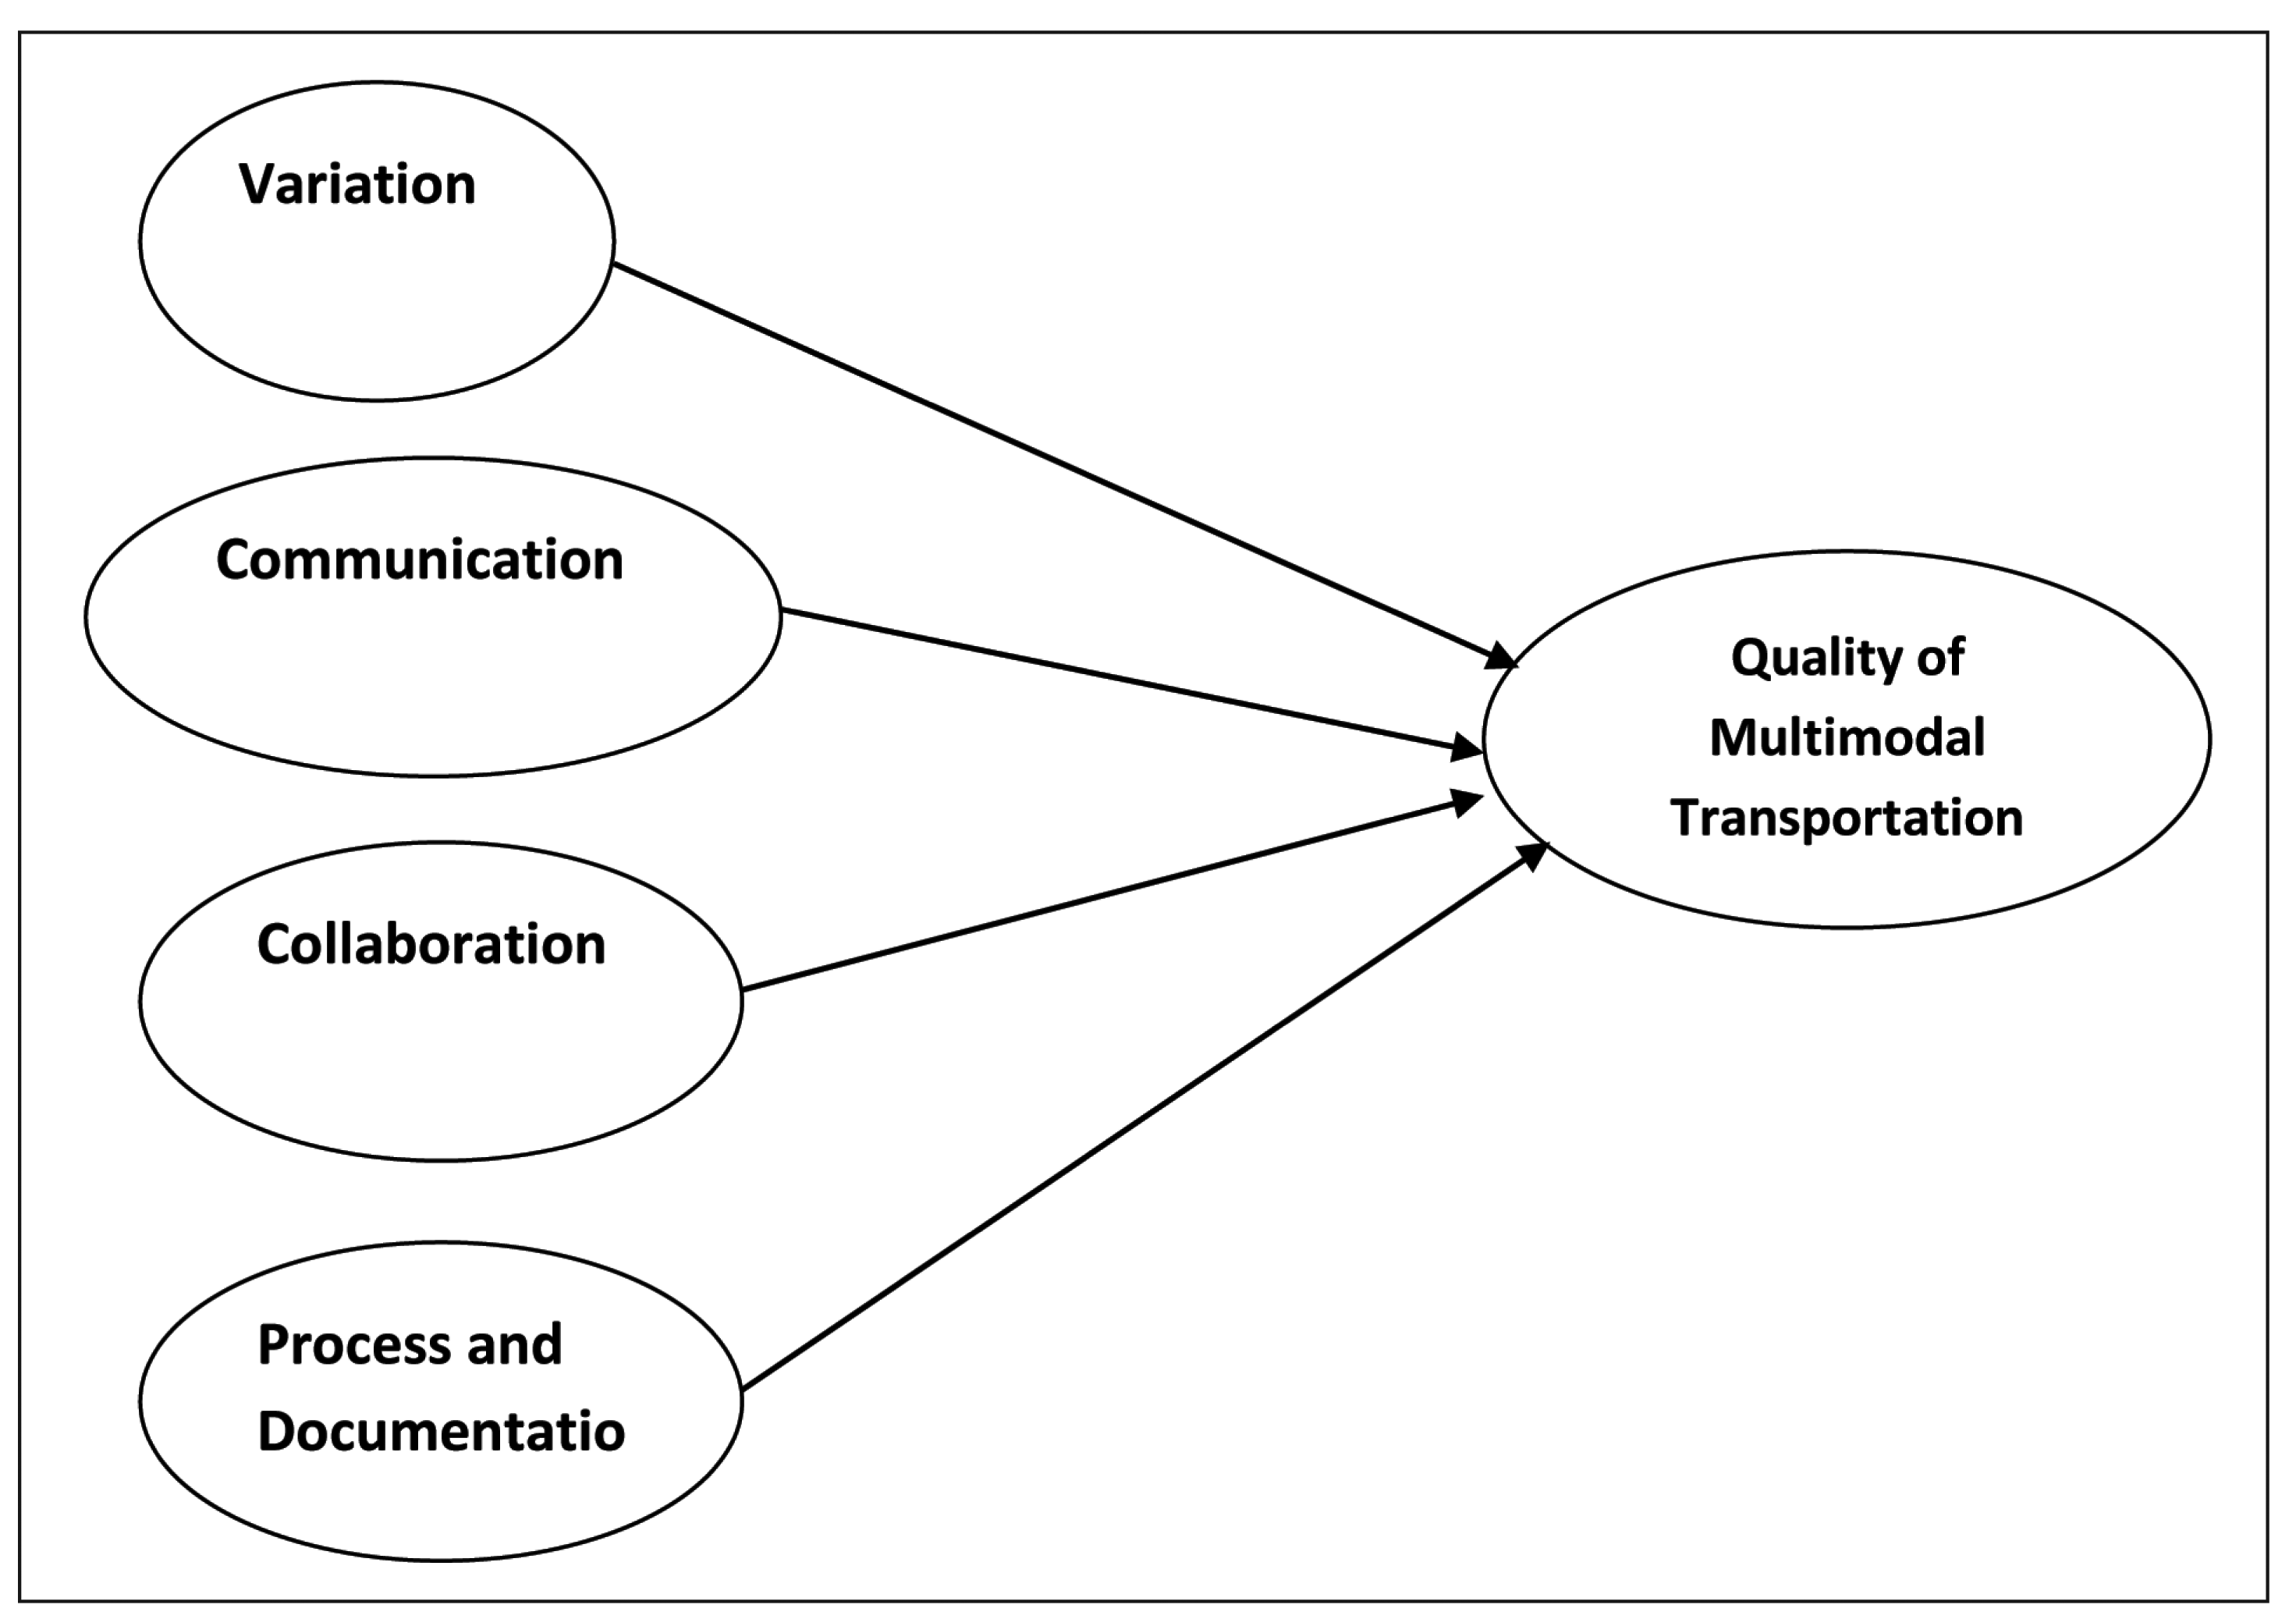
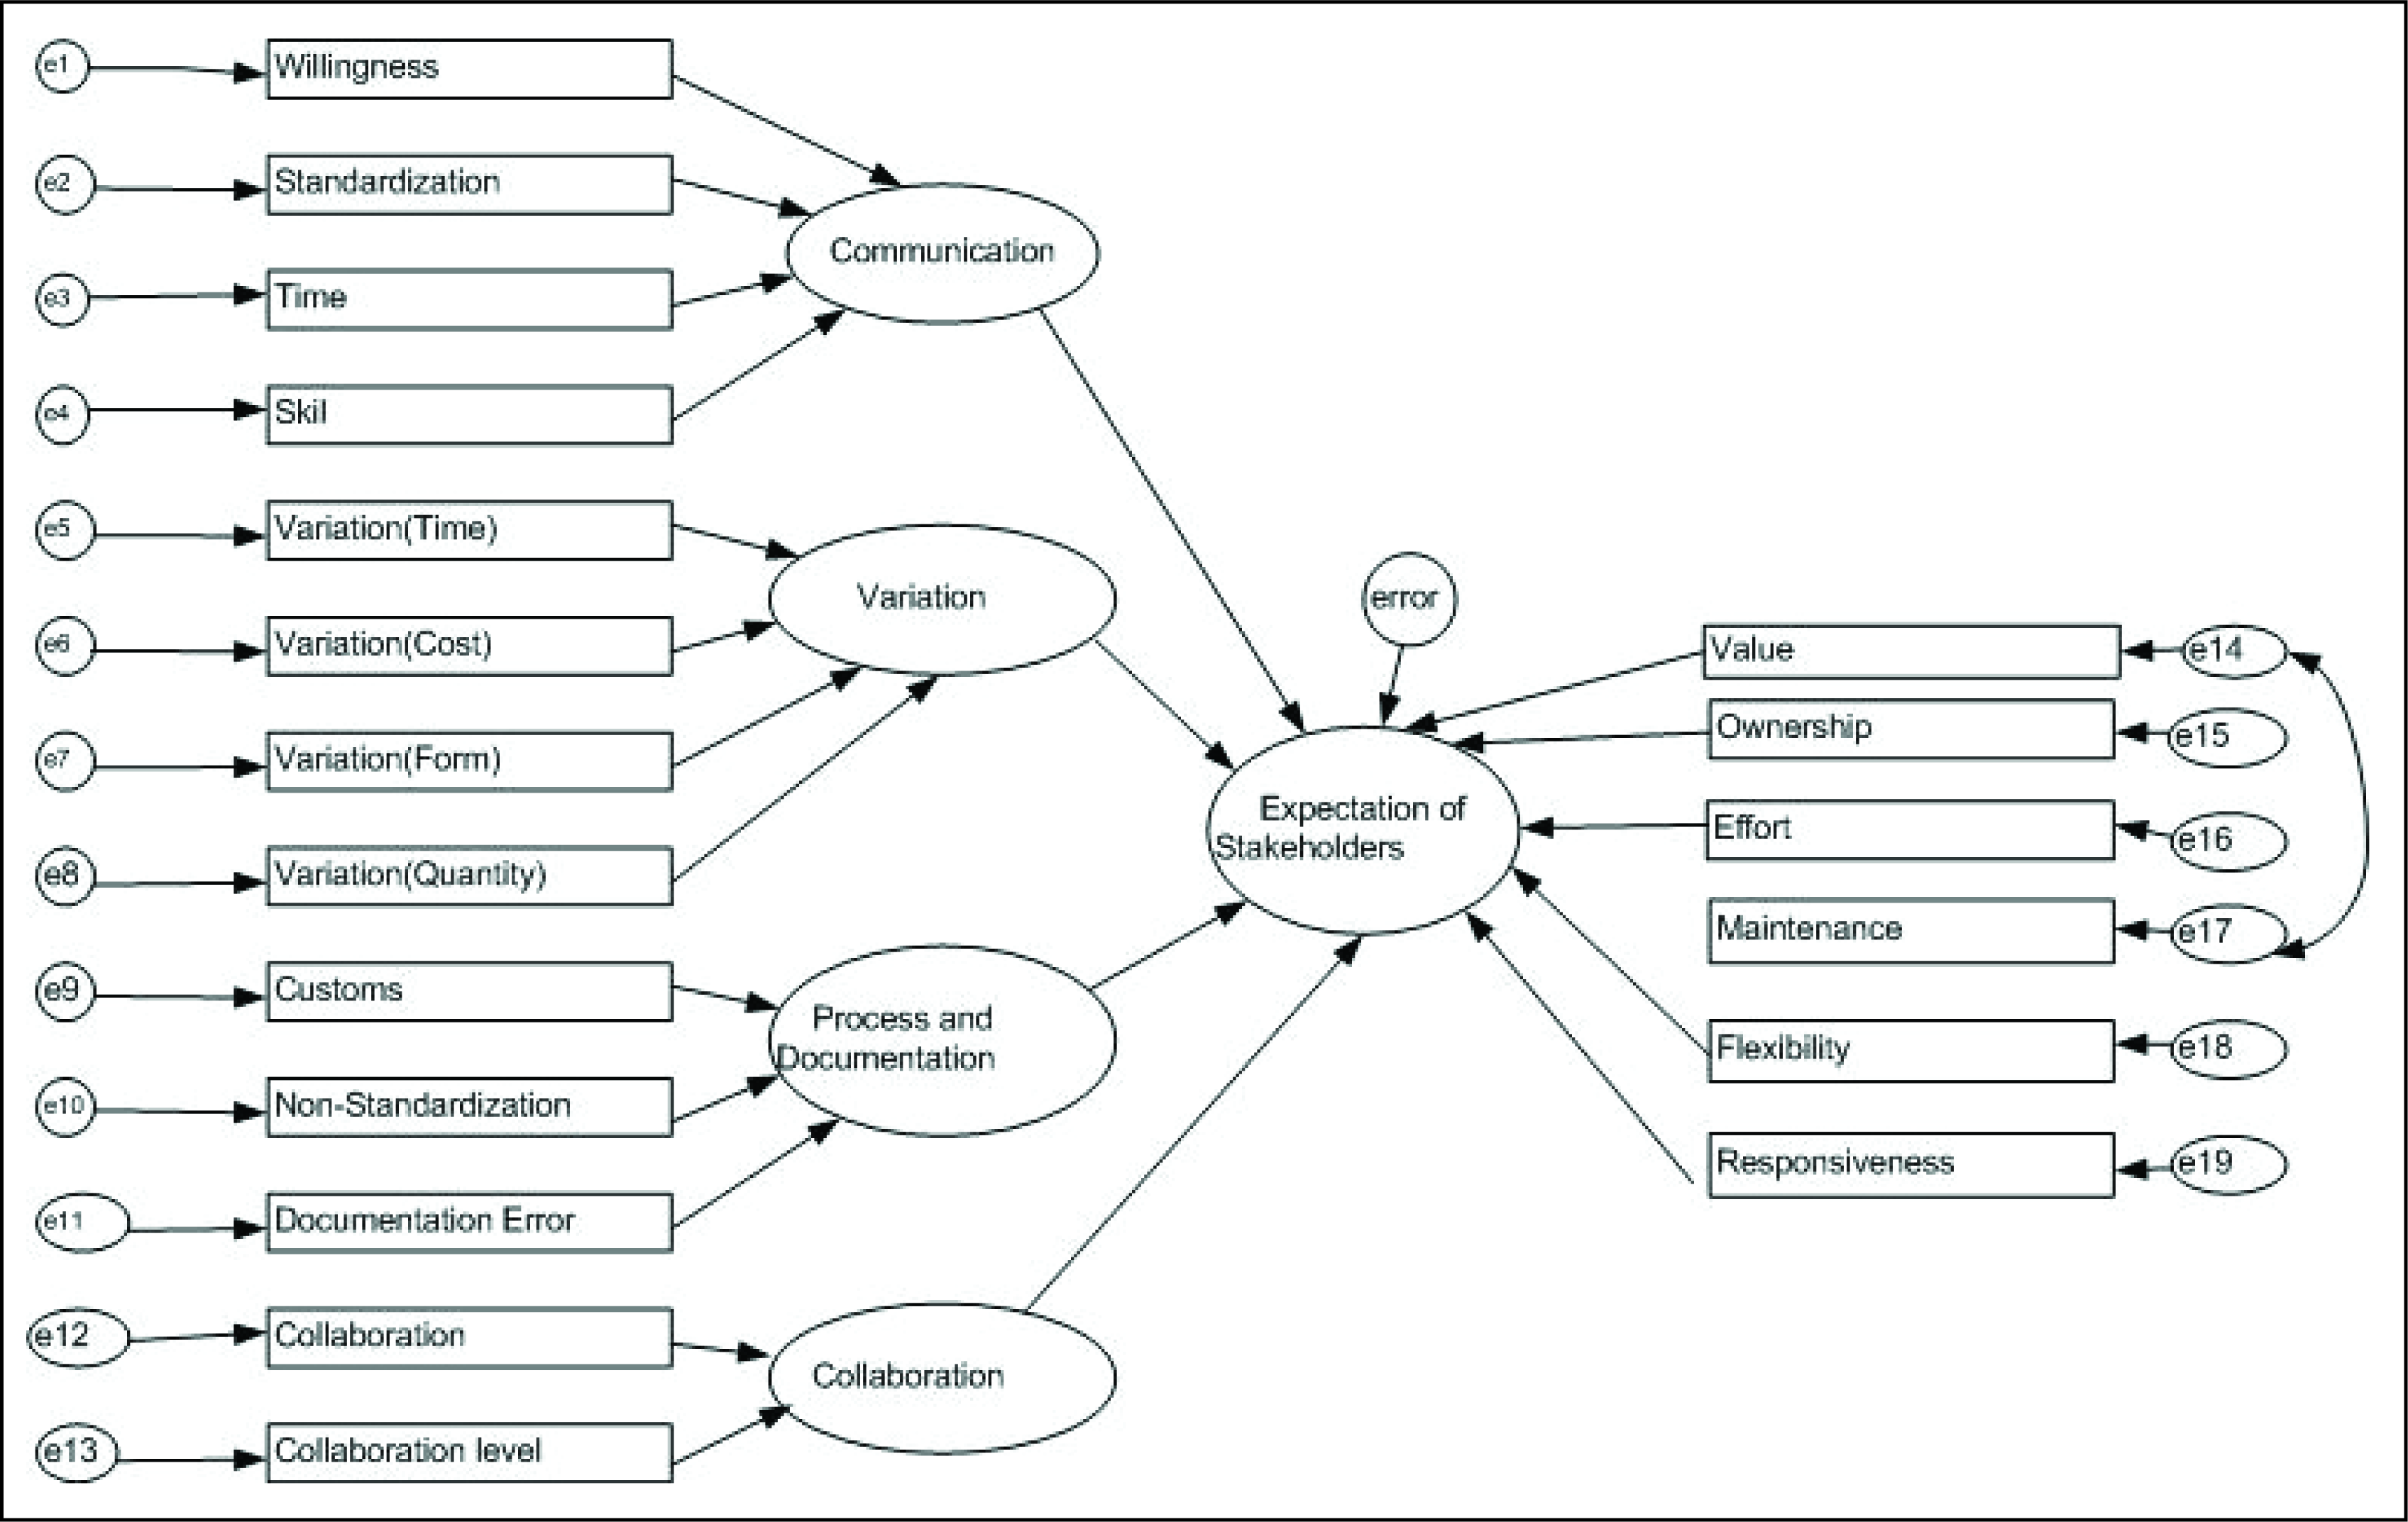
Figure 2 shows the conceptual model based on the aforementioned findings.
Survey Administration
The authors administered the survey on 190 respondents and collected the responses offline. They are able to generalize the survey across industries because respondents were taken from Section C and Section D of National Industrial Classification. In this list, only Sections C (Manufacturing) and D (Electricity Gas Steam and Air Conditioner supply) qualify for the containerized export. The 190 respondents significantly represent these sections. The authors made sure that the respondents had academic credit, that is, more than graduation, as they are responding to issues for which concern starts at middle management. The sample size of the survey is adequate to conduct SEM, according to Hair, Black, Babin, Anderson, and Tatham (1998) and Nunnally (1978).
Exploratory Factor Analysis
The authors collected responses from the stakeholders using the structured questionnaire and conducted exploratory factor analysis (EFA) on 155 data points (out of 190 responses). The responses were obtained after cleansing the primary data set. The KMO (Kaiser Mayer Olkin) measure of sampling adequacy was sufficient. Four factors with Eigenvalue of 1 and above explain 65.99 per cent of variance. The total variance of 60 per cent explained by the factors in social sciences is considered satisfactory (Hair et al., 2003). These factors conformed to the conceptualized theoretical understanding. The authors labelled these factors as Communication (communication between stakeholders in an MMT chain); Variation (variation in cost of transportation, time, quantity and form); Collaboration (among stakeholders) and Process and Documentation (of the entire multimodal chain). The Cronbach alpha value for these factors was more than 0.7, which confirms the equivalence reliability. The unidimensionality of constructs was measured by CFA.
Mapping of Constructs with Literature
Factor 1 includes four indicators: Information ontime, Information willingness, Information skill and Information standardized. In view of the loadings of the indicators, this factor was labelled as the Communication dimension. Factor 2 includes four indicators: Time EOV, Cost EOV, Form EOV and Quantity EOV. EOV refers to the extent of variation. This factor was labelled as the Variation dimension of MMT. Factor 3 includes three indicators, namely Process complexity, Process customs and Process non-standardiza tion. This factor was labelled as Process and Documentation (PD). Factor 4 includes two indicators: Collaboration comp liance and Collaboration level. This factor was labelled as Collaboration.
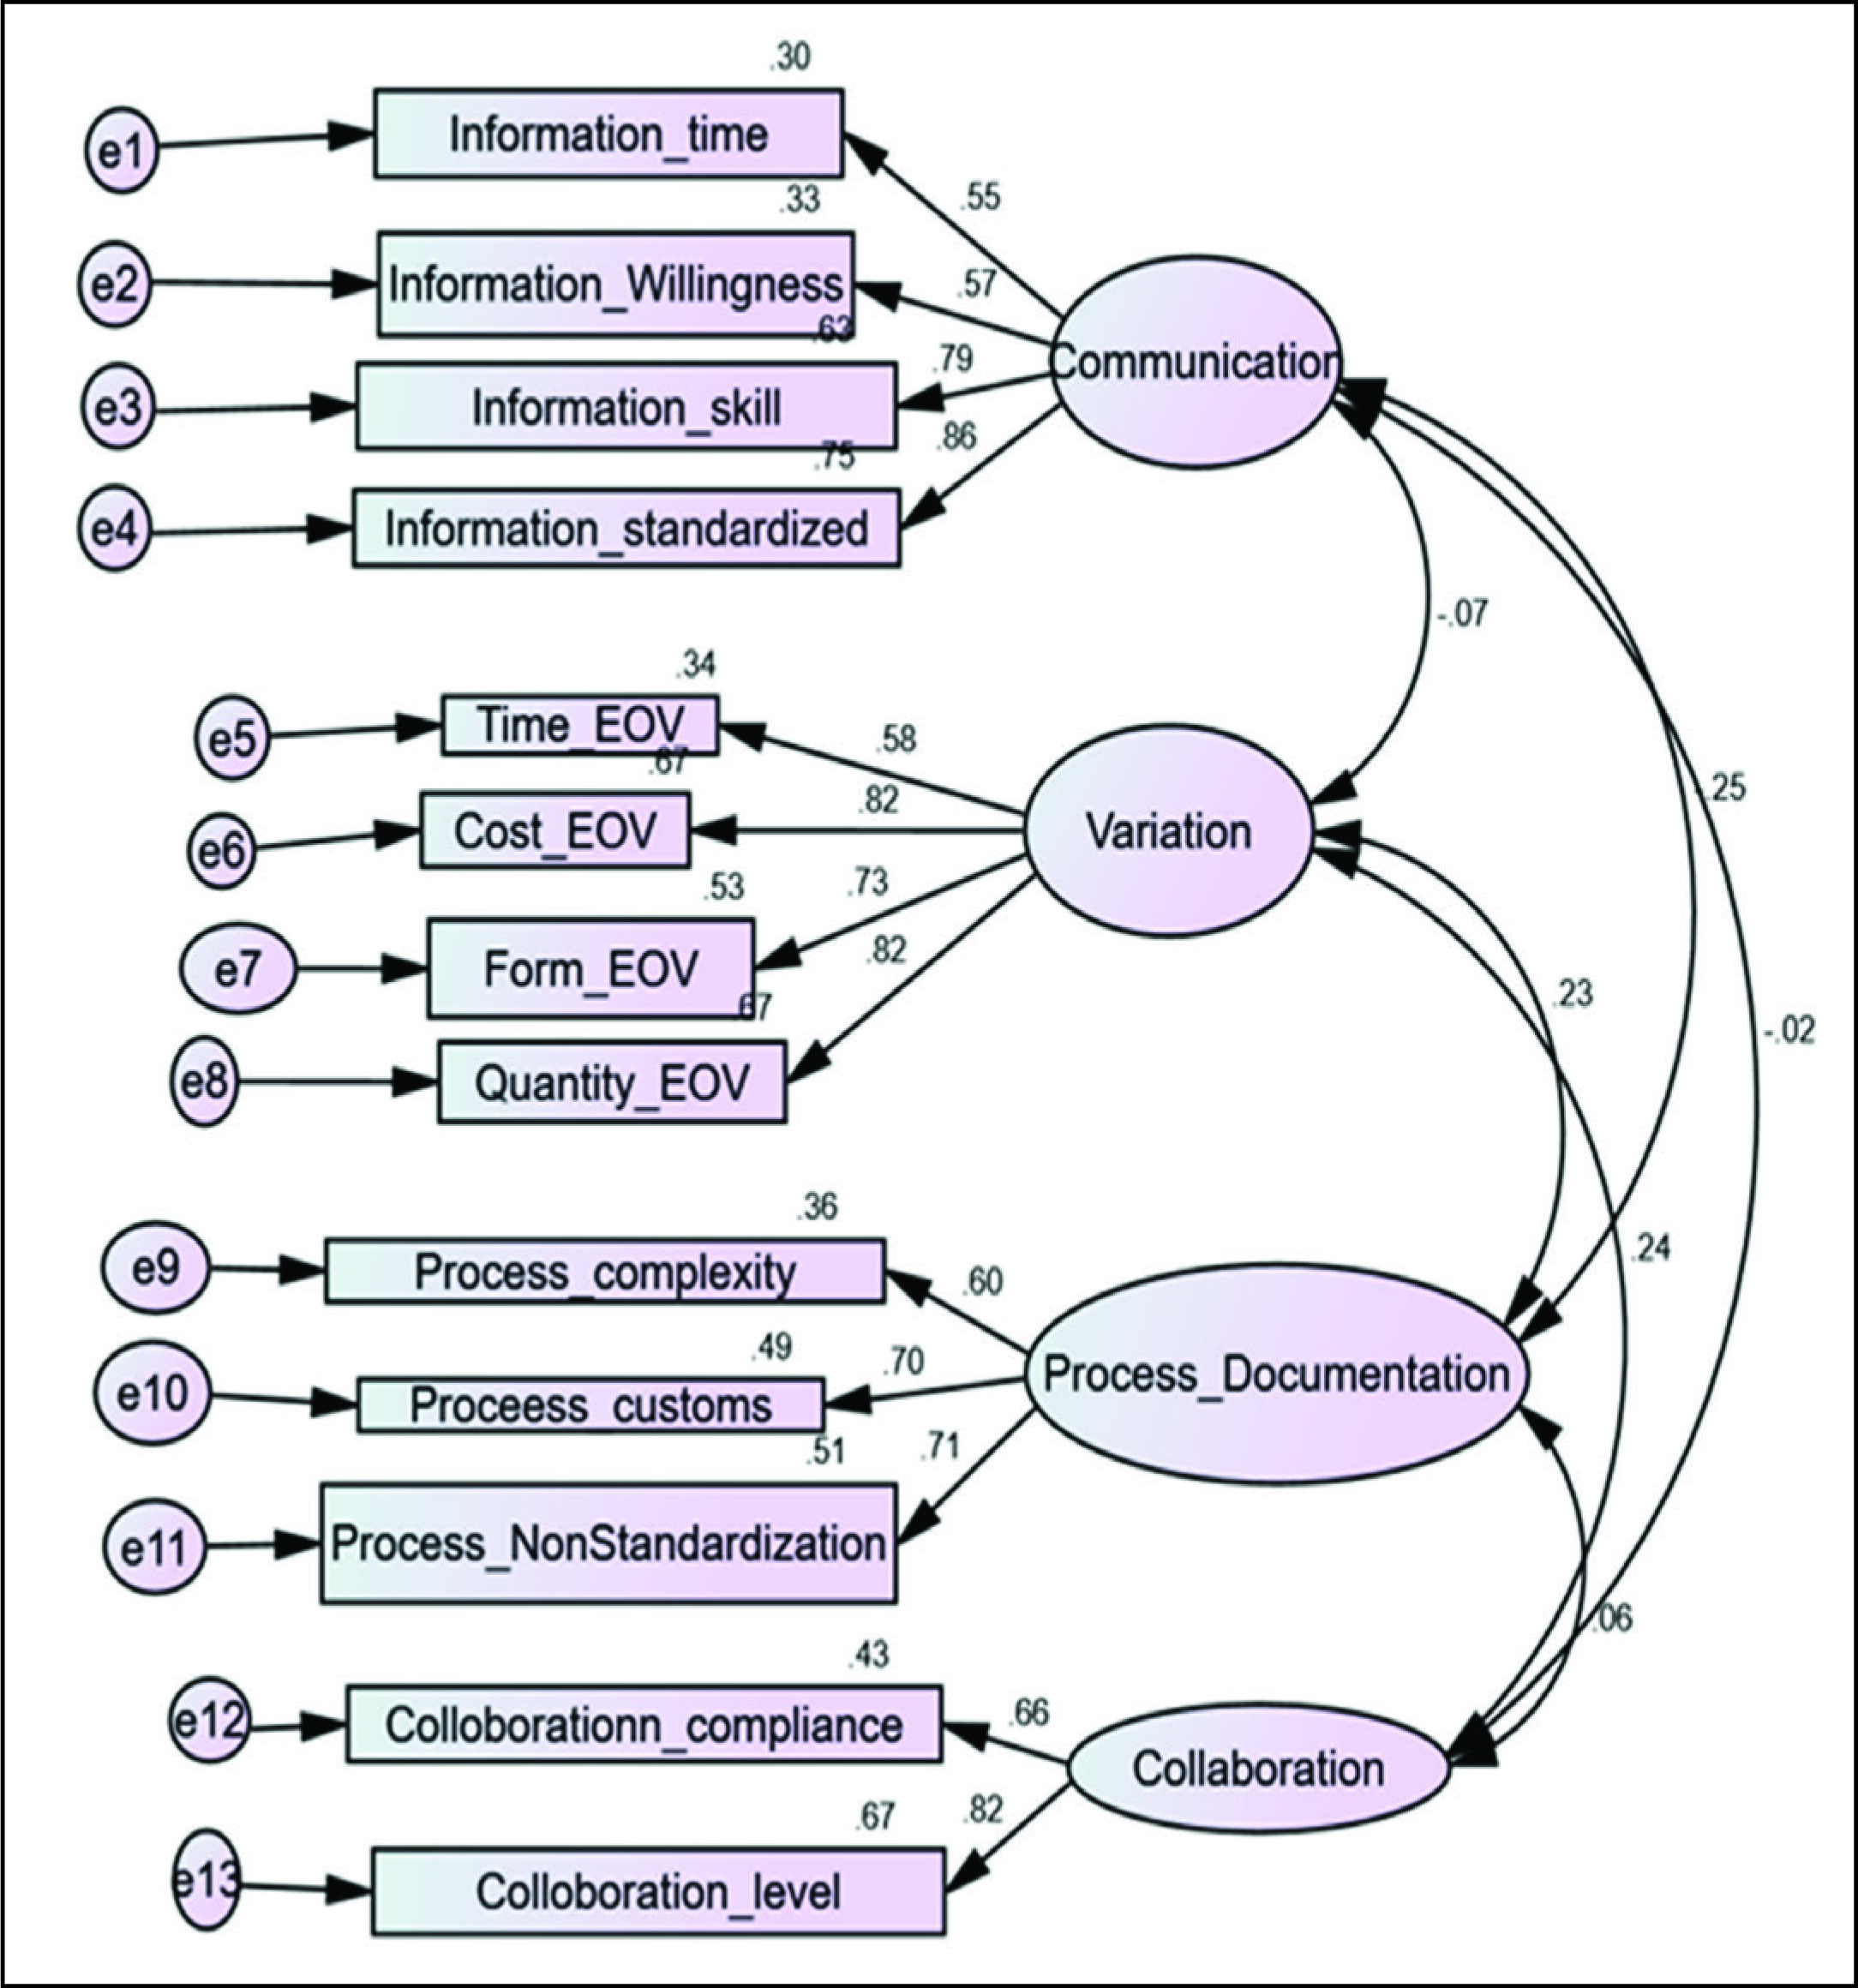
Confirmatory Factor Analysis (CFA)
The overall measurement fit of the findings of EFA was carried out using CFA, which portrays the degree to which the specified indicators represent the hypothesized constructs (Hair, Anderson, Tatham, & Black, 2003). The four factors that have emerged from EFA were subjected to CFA.
The Chi-square statistic was 1.148, while the comparative fit index (CFI) and normed fit index (NFI) were 0.985 and 0.895, respectively. This confirmed the congeneric measurement property of the tool. The RMSEA value of 0.048 indicates a good fit. Table 2 lists these values. Researchers calculated the composite reliability (CR) and average variance extracted (AVE). According to Hair, Black, Babin, and Anderson (2010) and Malhotra and Dash (2012), these are in range.
Fit Assessment for the Structural Model in Figure (with Variation)
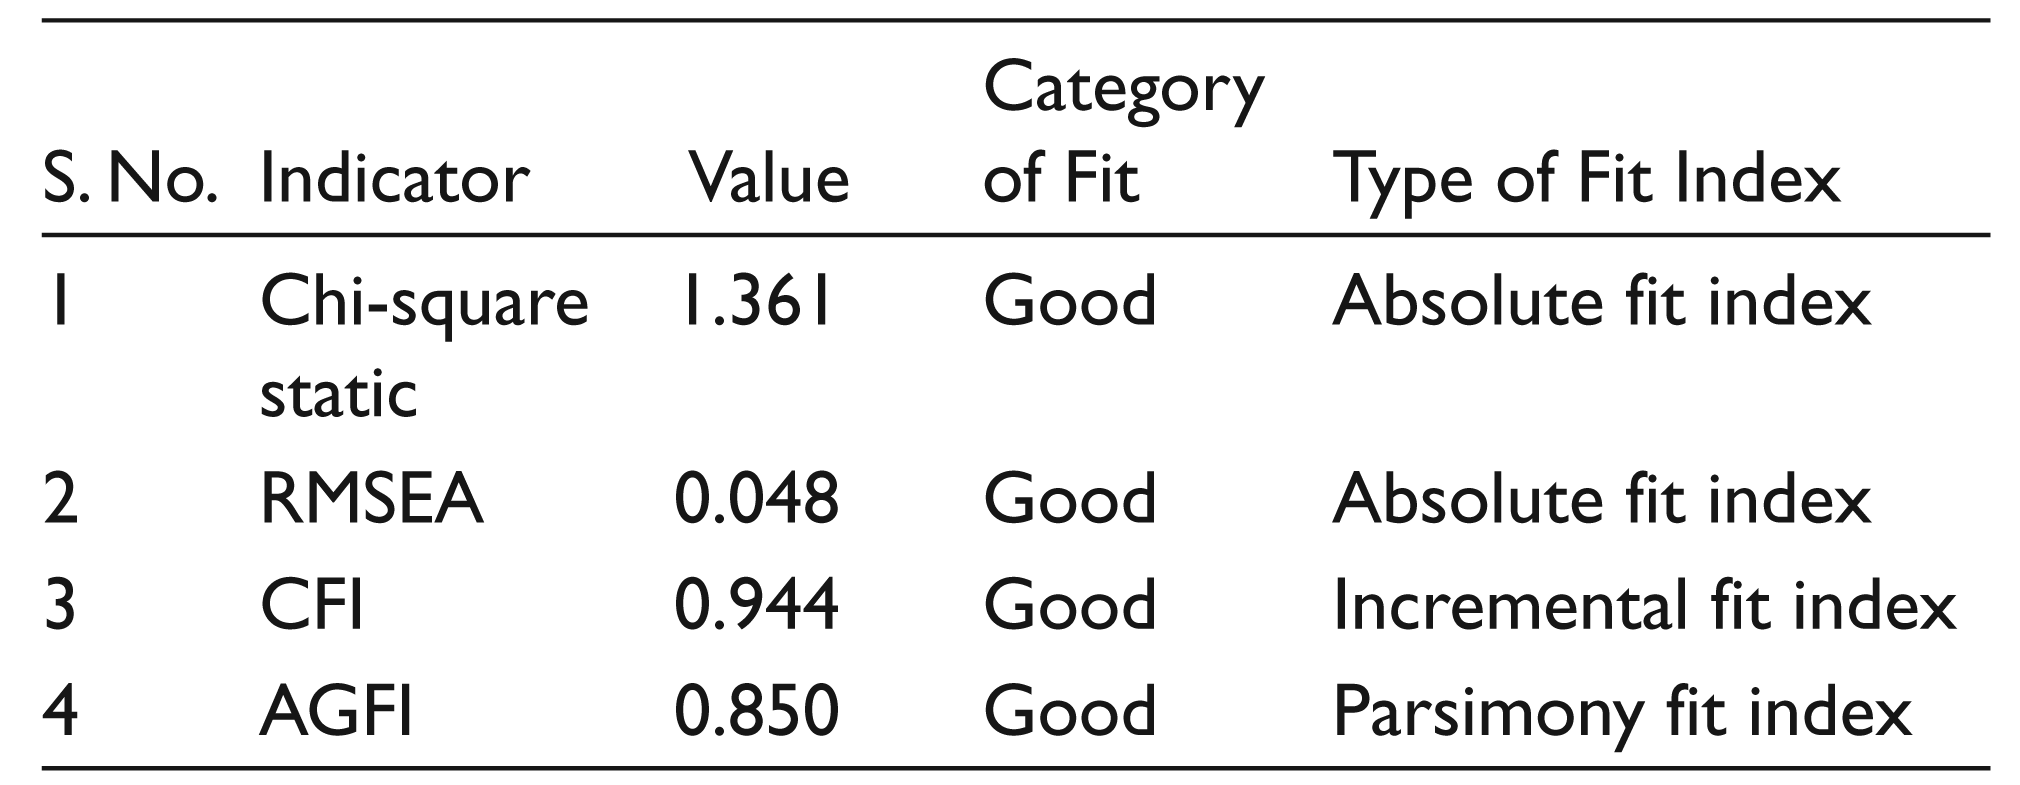
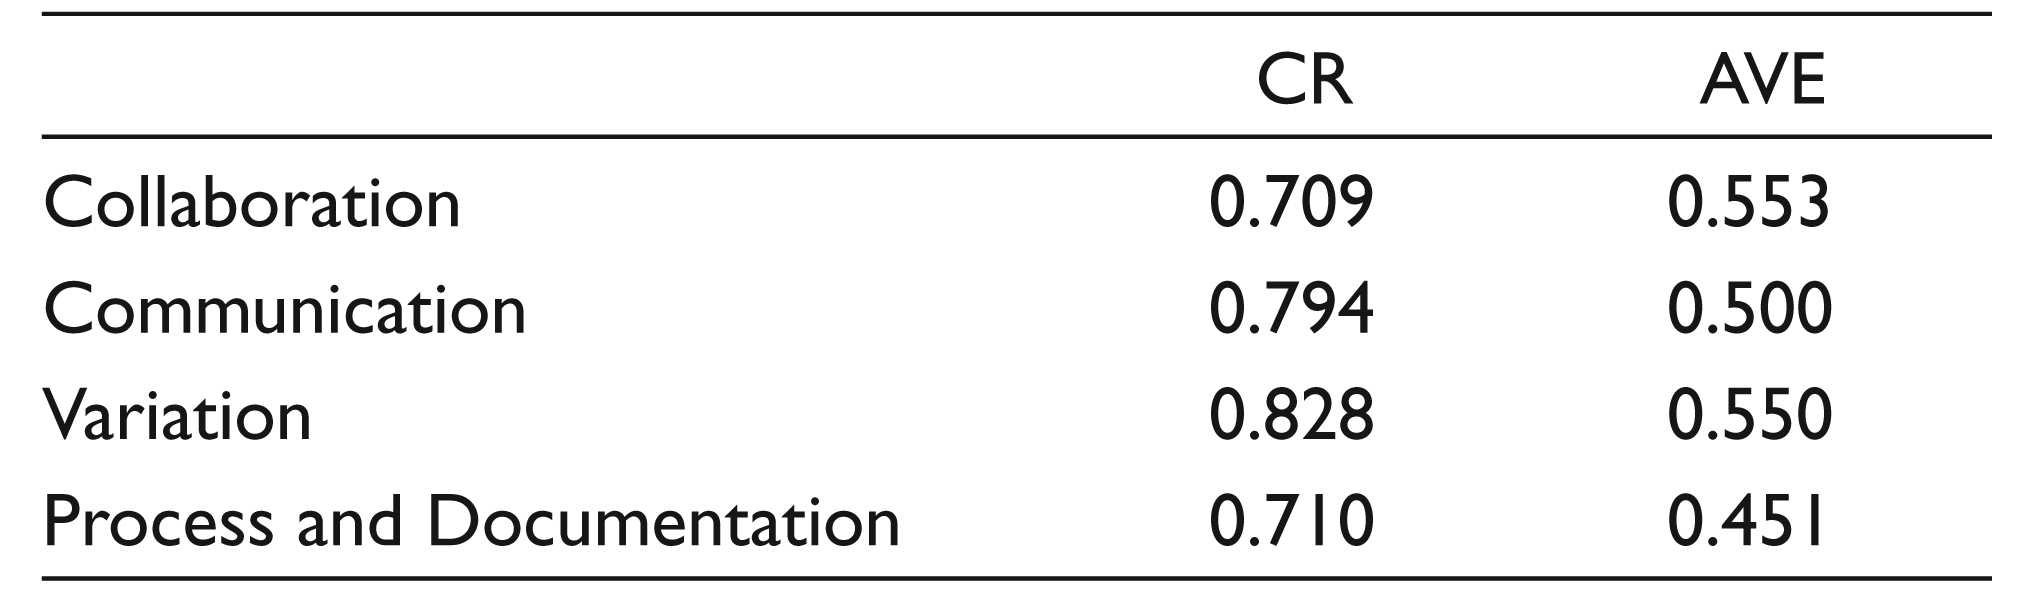
Table 3 lists the values of CR and AVE. This confirmed that the measurement of these four factors is unidimensional and reliable in an MMT chain.
The Validity and Reliability Indicator for Constructs
Structural Equation Modelling (SEM)
The SEM model was developed (Figure 3) and tested using the four factors. The goodness of fit was acceptable according to Hair et al. (2010).
However, the regression weight for ‘Variation’ at the 0.05 level was not found to be significantly different from zero (two-tailed test). The findings were discussed with the industry experts, who opined that the variation in time and cost were frequent in India and hence are inbuilt in the planning component. For example, a situation where a freight forwarder or a 3PL experiences a time variation of 2 days over and above 3 days to stuff and get Customs’ approval in an ICD or CFS would commit 5 to 6 days of clearance time to the exporter. Similarly, in terms of cost, the additional margin is also inbuilt in the expenditure to export. In other words, the stakeholders have accepted the current state. This phenomenon has been termed as ‘the unholy equilibrium’ by Raghuram and Shah (2004). Although stakeholders are of the opinion that improvements are necessary in the MMT chain in India to reduce the variation in time and cost, they have no clue as to how such improvements could be made. The variation in form and quantity are less because containerization saves the consignment from any damage or change in shape owing to its thick cast-iron wall. Besides, the reason for low significance of the ‘Variation’ dimension could be in terms of the findings of Iravani, Van Oyen, and Sims (2005). They found that response to variation depends on the capa city of the system for the supply chain. Thus, hypothesis H2 stands rejected.
In view of the aforementioned findings, the authors removed the ‘Variation’ construct from the analysis and retested the model (Figure 4).
The goodness of fit was acceptable according to Hair et al. (2010). The new Chi-square static is 1.361 (earlier: 1.628), RMSEA is 0.048 (earlier: 0.06). CFI is 0.944 (earlier: 0.92), AGFI is 0.85 (earlier: 0.84). After rerunning the SEM, it was found that Chi-square static is improved; however, it depends on the sample. In this test, the RMSEA, the CFI and the AGFI also improved (Hair et al., 2010). The improvement in goodness of fit indicates the superiority of the modified model (i.e., the model without variation). However, the authors still recommend that in administering the questionnaire in a different geography and route, the ‘Variation’ construct should be included as it is dependent on the logistics effectiveness of the country as a whole, and is subsumed while planning for multimodal movement of containerized cargos.
Discussion and Contribution to Theory and Practice
With CFA and two-stage hypothesis testing, the authors confirmed the factors affecting the quality of MMT. According to Shah and Goldstein (2006), no model is the perfect fit for the real-world scenario. The desirable outcome from SEM analysis is to show that a hypothesized model provides a significant replication of reality. Jöreskog and Sorbom (1996) postulated three strategies for model specification, namely strictly confirmatory, model generation and development of alternative models. Shah and Goldstein (2006) mentioned that strictly confirmatory approach is highly restrictive and has a rigid scope towards a system under study, while model generation approach may lack validity. They recommended that researchers should compare the alternative models rather than selecting the model that best fits the data. Hence, in this work, the authors decided to use the alternative model strategy. Several authors (Golob, 2003; Gollob & Reichardt, 1987, 1991; MacCallum & Austin, 2000; Shah & Goldstein, 2006) emphasized on causal interpretation of the SEM model developed and tested to be fit. According to Anderson and Gerbing (1988), ‘A CFA model specifies the relations of the observed measures to their posited underlying constructs, with the constructs allowed to intercorrelate freely. A SEM model then specifies the causal relations of the constructs to one another, as posited by some theory.’
This study brings out that variations in time, cost, form and quantity do not affect the quality of MMT when such phenomena are frequent, or cannot be recorded or are subsumed in planning. However, this needs to be included when the geography differs. The results show that stakeholders look for standardized, simplified processes and communication promptness coupled with effective collaboration.
The final model and its overall fit establish the causality of the constructs with expectation of the stakeholders reflecting the quality of an MMT chain. The communication among the nodes can be best established by reducing the communication distance between the stakeholders. This can be achieved by standardizing the messages, ensuring timeliness, providing training to the players on skill and motivating them on willingness to communicate. Modern systems include electronic data interchange (EDI) and real communication systems made possible through techno logies based on RFID (Radio Frequency Identification tag, a technology to track goods), GPS (Global Positioning System, a technology to track vehicles) and GSM (Global System for Mobile communication). Hoffman, Lusanga, and Bhero (2013) suggest that the exchange of information using RFID- and GPS-based systems can ensure visibility to the stakeholders and in turn increase security and efficiency of cross-border freight operations. Besides, any isolated system needs to be integrated with the flow of messages between systems using EDI systems. In a country like India, every entity has its own EDI systems; for example, the PCS (Port Community System, an electronic data interchange platform for port stakeholders in India), ICEGATE (Indian Customs and Excise Gateway, an electronic data interchange system for Customs and Excise in India), DGFT (Director General of Foreign Trade) e system, SWIFT (Society for Worldwide Interbank Financial Telecommunication) and NEFT (National Electronic Funds Transfer, an electronic system for transfer of funds in Indian banking system)/RTGS (Real Time Gross Settlement, an electronic system for transfer of funds in Indian banking system) for banks, FOIS (Freight Operations Information System, an electronic data interchange for railway stakeholders in India) and GSTN (Goods and Services Tax Network). However, they stand isolated in operation and integration. Korpela, Hallikas, and Dahlberg (2017) suggest developing a digital ecosystem for creation of value in transactional logistics chain. They call for integration of EDI and block chain technologies. This will enable flow of funds along with documents and messages such as bill of lading, packing list, invoice and other shipment documents. This, in turn, is expected to provide visibility, security and efficiency in the supply chain across borders. The kind of communication could be transactional and/or informational and/or discussions and/or joint decision-making. If all these are inbuilt in the communication system along with resource sharing, an effective collaboration between stakeholders can be established (Gonzalez-Feliua & Salanova, 2012). This will lead to improvement of performance of the MMT chain, meeting the expectations of the stakeholders. The extent of coalition between stakeholders can be limited, extensive and integrated (Zinn & Parasuraman, 1997). There could be collaboration with respect to pick-up and delivery schedules, load factors and vehicle-capacity matching to ensure reduction in delay, cost and uncertainty (Hernández & Peeta, 2014). This will ensure reduction in non-full-haul trips. The stakeholders in the MMT chain can take a consortium approach, if they are not sharing assets to improve the collaboration. The integrated digital ecosystem can enable such possibilities. Thus, an immediate requirement in India is to integrate the existing EDI system of the country with online interfaces provided to the stakeholders. This will necessitate vehicle sharing as well, ensuring reduction in long empty-back hauls after delivery (Sprenger & Monch, 2012) and reduction in freight.
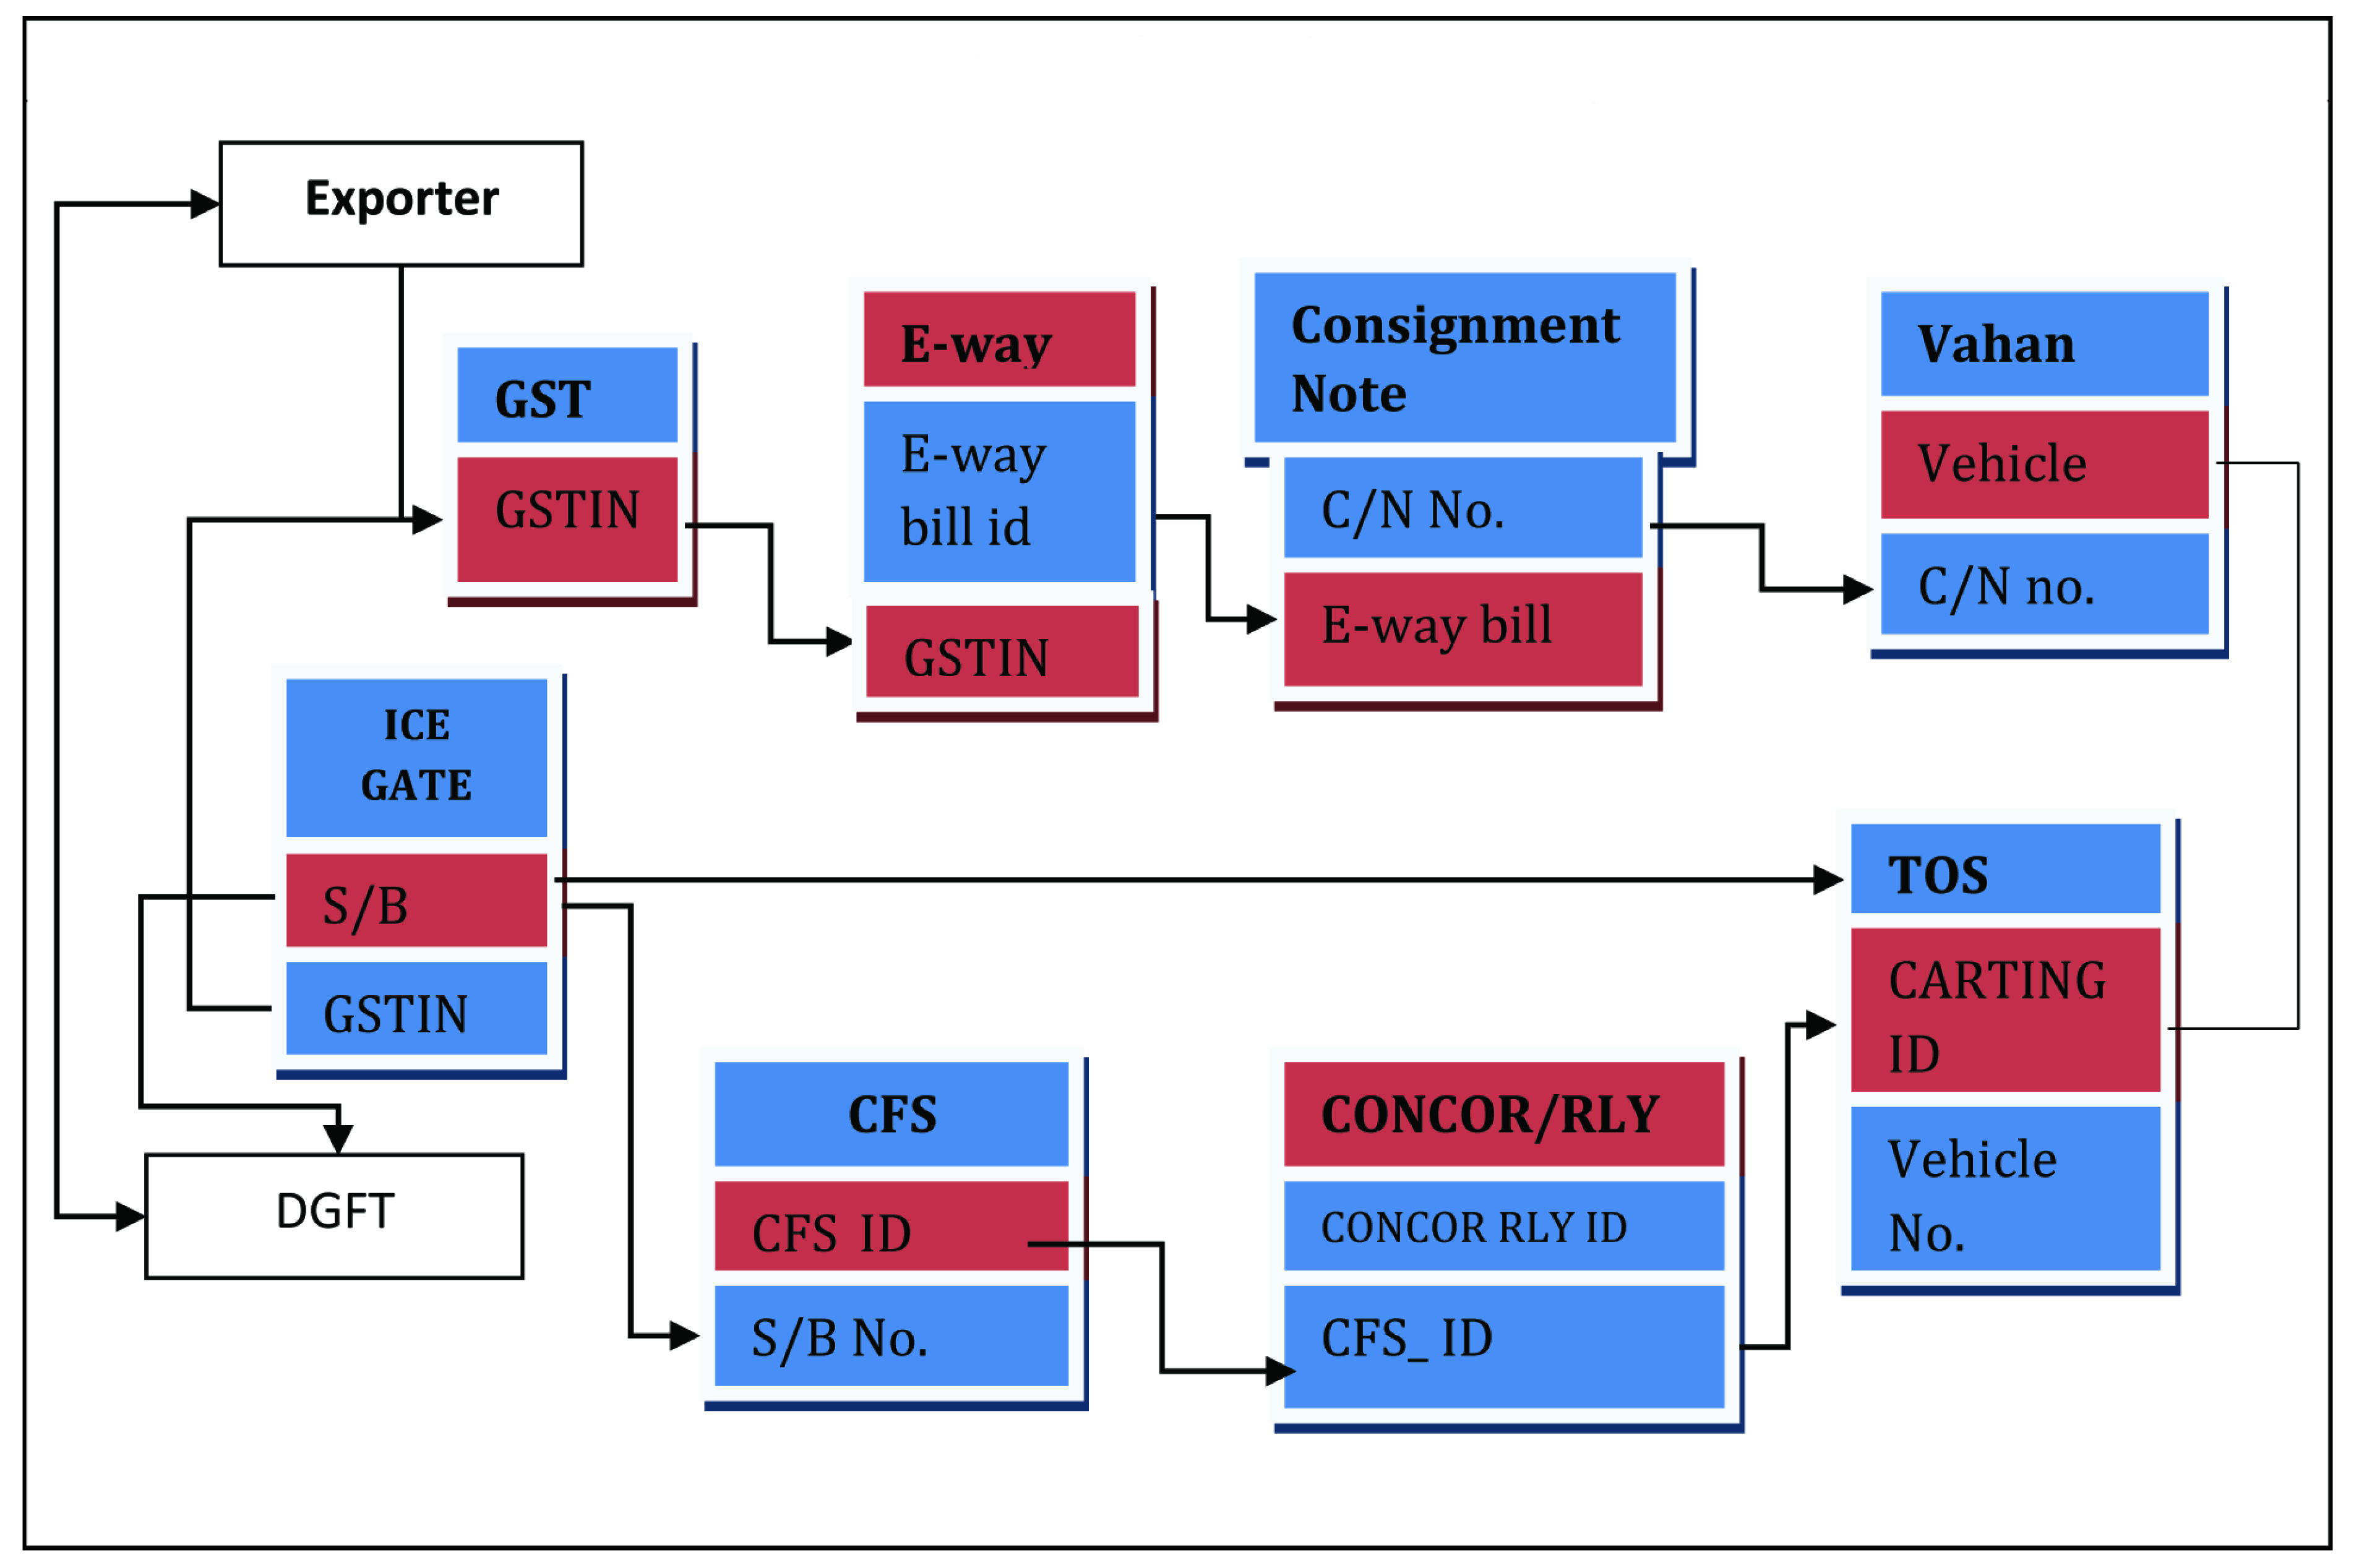
In view of this discussion, the authors suggest an integrated digital ecosystem as illustrated in Figure 5.
It illustrates that the journey of an exporter’s cargo to port starts with the filing of GST details in the GSTN system followed by e-waybill from the transporter. On loading the cargo onto a carrier, the carrier issues a consignment note as a contract-of-carriage document, indicating the e-waybill details and carrier details. In India, the carrier and driver details are available in the Vahan database and the Sarathi system, respectively. An integration between the Vahan and Sarathi databases will facilitate the within-state movements of the cargo/carrier and help in the inspection carried out by road transport authorities (RTA) at state checkposts. The cargo moves to ICD or CFS and the system needs integration with dry-port systems. At this stage, the shipping bill for export cargo needs to be filed with Customs’ ICEGATE system, which can fetch information from GSTN and e-waybill, while the ICD or CFS can receive the information from ICEGATE if these are integrated. From ICD or CFS, the cargo moves to a port through railway service by Container Corporation of India (CONCOR) and, hence, these need to be integrated. Finally, the cargo moves to the port which has its own terminal operating system (TOS) and can fetch information from GSTN/ICD or CFS/Customs and CONCOR. For road-bound containers, every carrier has to obtain port-entry permits. The port-entry permit system can issue permits from the data available with Vahan and TOS. Post shipment, the export incentives are made available from the DGFT e-system, which receives information from the Custom’s ICEGATE system and banking systems such as SWIFT, NEFT or RTGS. All these enable the creation of an integrated information system. The system may be developed under a cloud platform with multi-stakeholder participation in the end-to-end movement of goods.
As a future scope of research, the authors propose to validate the work through simulation studies. The causality established in this research can be used to develop a causal model such as the one proposed by Forrester (1995).