
Abstract
The research used the Autoregressive Distributive Lag (ARDL) model to examine the long- and short-term impact of changes in currency rates and global income on tourist demand in India employing monthly data from 2003 (1) to 2020 (12). We find that exchange rate volatility, global income, and tourism demand are all significantly interrelated. A 15% convergence to the long-run equilibrium path of tourism demand occurs in line with the pace of adjustment through the channel of global income and currency rate. Positive and substantial effects of rising global income are shown over the short and long terms. There is, nevertheless, a positive short-term relationship between currency depreciation and visitor numbers. Additionally, the Toda–Yamamoto method is used for Granger non-causality. The results point to a one-way causal relationship between the currency exchange rate and the number of visitors. It has also been shown that there is a causal relationship in both directions between the demand for tourism and global GDP. The nation is in a special position due to its location, physical characteristics, cultural heritage, and other comparative advantages. According to the findings, a stable currency rate and global income are the two most important factors in increasing tourist interest in India.
Keywords
Introduction
The strong economic performance of the travel and tourist industry in recent years, as reported by the United Nations World Tourism Organization (UNWTO), illustrates the ability of the sector as a vehicle for governments to bring about development (United Nations World Tourism Organization [UNWTO], 2019). As a consequence of this, it is evident that the travel and tourism sector has the potential to be a driver of economic prosperity and development.
The tourism industry, which caters to tourists from all over the globe, is one of the export industries that is growing at the quickest rate globally. When growth rates are compared between 2009 and 2019, the growth rate for the tourism sector, which is 5.4%, is greater than the growth rate for the global GDP, which is 4.4% (UNWTO, 2020). In the year 2019, there were around 1,460 million tourists. This sector of the service economy is expanding all around the world, as shown by the growing number of individuals participating in tourism-related activities (Mitra, 2019; UNWTO, 2020).
Unfortunately, the pandemic outbreak had a disproportionately negative effect on the travel and tourism economy globally. It is anticipated that the number of tourists from other countries will drop by 78%, which will result in a loss of US$1.2 trillion in profits for the tourism industry and a reduction of 120 million jobs directly related to tourism. This amount of damage is seven times greater than that was caused by the 9/11 attacks (UNWTO, 2021).
The Indian nation boasts one of the fastest-growing economies in the world, in addition to its well-known rich history, diversified culture, and great hospitality (Jauhari & Jauhari, 2009). The nation is visited by a large number of people from other countries, which results in the creation of new work opportunities and an increase in tax income for the government. In addition, the number of international visitors visiting India increased by 3.2% from 2018 to 2019, resulting in significant foreign currency revenues from tourism in India (UNWTO, 2020).
However, as a direct consequence of the ongoing pandemic, the travel and tourism sector around the globe has come to a total stop, and India is not an exception. When compared to the same month in the previous year, the number of visitors from other nations that travelled to India in March 2020 experienced a decline of 66.4% from the previous year’s total. It is projected that India would see a loss of over 40 million jobs, both intrinsically and extrinsically during the next several years (FICCI, 2020). The trend that has been manifesting itself in the hospitality sector is shown in Table 1. Since 2001, the tourism sector has seen constant growth, except for the period during which COVID-19 was in effect (Ministry of Tourism, 2021; Sharma et al., 2022). There are reasons to believe that the tourism sector in this nation is on its way to making a full comeback. Despite this, the tourism sector has not yet resumed the rate of increase at which it was functioning before the commencement of COVID-19 (World Travel and Tourism Council [WTTC], 2021).
Growth of Inbound Tourism Sector in India.

Existing research has thoroughly explored the relationship between tourism and economic development, except for the COVID-19 Pandemic period. Balaguer and Cantavella-Jordá (2002) ground-breaking research confirms that international visitors are a key factor in a country’s economic growth. While human capital and technological advancements are often credited for driving economic development, foreign currency reserves may also play a significant impact (Mckinnon, 1964). The tourist business boosts the economy via its multiplier impact on related sectors such as transportation, building, infrastructure, beverages, and hospitality. Revenue from tourists is a significant source of foreign currency (Mishra et al., 2011). To some extent, inbound tourism may be thought of as an economy’s export, and like exports, it contributes to the development of the economy (Du et al., 2014). As a bonus, the tourist industry helps to generate new employment opportunities (Lee & Chang, 2008). Because it requires fewer resources in terms of technology, it has the potential for use in less developed nations. The tourist industry has the potential to boost economic growth and alleviate poverty in developing countries (Njoya & Seetaram, 2018).
After assessing the tourism industry’s potential for stimulating economic development, it’s vital to investigate the forces that shape tourists’ spending. The number of visitors to a nation is often directly proportional to its geographical location. Costs associated with transportation increase proportionally with distance. Disincentives to travel stemming from a great distance between the home and destination countries (Tavares & Leitao, 2017). Institutional quality, law, and order all play a significant part in explaining visitor arrivals due to security’s centrality as a determining factor in the tourism industry (Ghalia et al., 2019).
In terms of macroeconomic factors, which are the subject of this study, the exchange rate and tourist income have a significant impact on influencing visitor arrivals. If visitor income rises, it bodes well for the travel and tourism business since it encourages people to spend money on leisure activities (Khoshnevis Yazdi & Khanalizadeh, 2017; Martins et al., 2017). The other factor is the currency rate, which is viewed as the cost of visiting any country. Depreciation of the destination country’s currency makes it cheaper for visitors, while appreciation makes it more costly, which is bad for host countries since it can work as a deterrent for tourists visiting the country (Martins et al., 2017).
Recognizing the relevance of the tourism industry in creating jobs and stimulating development, the government of India has made substantial adjustments to its various policies like the visa policy. India is making considerable strides in improving its infrastructure and is working to bring its levies on luxury goods in line with those in other countries (Ministry of Tourism, 2021).
Furthermore, India is among the countries where the tourist industry is expanding at a quicker pace than the world average, with Turkey, Thailand, and France. India’s ranking on the Travel and Tourism Competitive Index improved from 40th to 34th between 2017 and 2018, according to the most current available data (TTCI). In terms of the TTCI, India is in the leading 25%, of orthe list of the world’s most visited countries. Even though India has made great strides in eco-friendly practices and business travel, there remains still room for development in the country’s tourist service infrastructure (World Economic Forum [WEF], 2019).
When considering the potential of the tourism industry in the future, it is essential to research the factors that influence the demand for tourism in India. In light of this background information, the purpose of the present research is to establish the extent to which the demand for tourism in India is affected by two significant factors—namely, global income and changes in currency rate. In addition, the research makes use of monthly data beginning in 2003 (1) and continuing through 2020 (12). Therefore, the purpose of this research is to analyse the causal as well as long-run and short-run nexus between global income, the exchange rate, and the number of tourists who visit India.
The article is classified in the following way. The second section discusses the literature review, which is organized around the factors of interest. The third section discusses the data sources as well as the econometric technique. The fourth section deals with the empirical results, and the fifth section elaborates on the study’s policy implications with concluding remarks.
Review of Literature
Findings from studies of tourism demand and currency exchange rates show a wide range of variability (Brida et al., 2016; Crouch, 1994). While some research suggests that a country’s exchange rate has a substantial impact on the number of visitors that arrive, other studies have shown no such link (Tang et al., 2014). A review of the existing evidence reveals that the real effective exchange rate (REER) is a more reliable indicator of currency movements than the nominal exchange rate (Witt & Witt, 1995). Similarly, a study of eight major nations’ demand for tourism to South Korea using annual figures from 1970 to 1989 found that the exchange rate and the visitor’s income both had a key role in influencing the market (Li et al., 2005). Webber (2001) claims that foreign exchange rate changes have a major impact on tourists. Taking into consideration the currency rate one at a time will provide a more accurate forecast for tourism demand (Martin & Witt, 1988).
Furthermore, an OECD panel study found that a single currency and fixed exchange rate regime are conducive to tourism demand (Reinhart & Rogoff, 2004). They highlighted the need for stable exchange rates for the tourist industry. Vogt (2008) claims that fluctuations in currency values and purchasing power are the key determining factors to visit a certain location. The impact of the currency rate in influencing tourist arrivals is highlighted by Ming Cheng et al. (2013). Since adopting the common currency, the euro, Greece’s tourism sector has flourished, according to a study by Thompson and Thompson (2010). By analysing daily data on tourist arrivals in Taiwan, Chang and Mcaleer (2012) investigated the impact of fluctuating exchange rates on international visitors. The results show that monetary instability prevents tourists from visiting any country.
By analysing New Zealand’s tourism sector’s exposure to currency volatility, Schiff and Becken (2011) can isolate many distinct reactions to fluctuations in the value of the currency market. They saw that Asian countries responded more quickly to changes in the value of their currency than the United States and Australia. Martins et al. (2017) found that an increase in tourist demand was associated with a decline in local currency value and an increase in global income. Karimi et al. (2019), who looked at tourist demand in Malaysia using asymmetric ARDL, found that the value of the ringgit dropped in response to both its appreciation and depreciation, contradicting more common findings. Meo et al. (2018) used a nonlinear framework to simulate tourism demand in Pakistan and discovered that when the Pakistani rupee depreciates, more visitors visit the country.
The relationship between the dollar’s value, GDP growth, and foreign tourists visiting the United States was studied by Obi and Ogbeide (2022). The researchers backed up their claim that visitors contribute positively to economic growth with data. The research also found that higher levels of real GDP are linked to an increase in tourism. These results lend credence to the theory that a weak dollar encourages international visitors, especially those from countries with higher average living costs. In a similar vein, Aslanoglu et al. (2021) examined Turkey via a tri-variable lens, this time examining the interplay between tourist demand, global income, and the currency exchange rate. Panel cointegration was used to analyse the quarterly data gathered. Findings highlighted the significance of foreign income and exchange rates in determining the accuracy of projected tourist expenditures.
Also analysed by Chaudhry et al. (2021) was how the present exchange rate affects demand for outbound international tourism to East Asia and the Pacific. The authors used a robust panel approach based on dynamic common correlated effects to address the problem of cross-sectional dependency (DCCE). A favourable and statistically significant relationship between the actual exchange rate and tourist demand was discovered by the authors. In their research, the authors discovered that the value of a currency relative to another has a significant effect on the decision to travel. Vacation packages for foreign tourists may be made more affordable by a favourable exchange rate.
There are, however, studies that argue that countries should exchange their currency for a greater value to attract more visitors and hence more revenue (Irandoust, 2019; Karimi et al., 2015). Similar costs (like the currency rate) may not deter high-end travellers from going on their dream vacation (Irandoust, 2019), but they may lead them to choose a more luxurious experience. Karimi et al. (2015) speculated that the demand for tourism in ASEAN nations was affected by many macroeconomic factors. These included the price level, FDI, trade openness, and the real exchange rate. There is evidence that both trade liberalization and foreign direct investment (FDI) boost tourism numbers. However, the real exchange rate volatility, and inflation had an undesirable impact on tourists’ arrivals and also had a statistically significant link.
Only a limited handful of studies have been undertaken to assess the degree of interest in India among potential visitors. According to Dhariwal’s (2005) research on the effects of local and foreign disturbances on tourist arrivals in the country, he discovers that turbulence and international conflicts have a detrimental effect on tourism revenues. Barman and Nath (2018) examined the interest of foreign visitors to India using generalised moment methods and yearly data from the years 2000–2015. The authors conclude that the number of international tourists to India is significantly affected by the affluence of the home country. While increased investment in infrastructure has boosted India’s inbound tourism, rising prices have deterred visitors.
While the importance of income of the tourists and exchange rate is vital for tourism demand, however, we conclude from the literature survey that short-run and long-run effects and causal analysis of world income and exchange rate fluctuation with tourist arrivals have not been covered. It can have potential policy lessons for studying tourist arrivals in the nation. Thus, the study seeks to fill the research gap.
Data and Methodology
The actual effective exchange rate, a trade-weighted index of 36 currencies based on the Consumer Price Index, serves as a proxy for the exchange rate, while international tourist arrivals are used to estimate demand for tourism. Measures of global wealth have traditionally been derived from the IPI, an indicator of industrial output compiled from the world’s most developed economies (Karimi et al., 2019). Researchers have chosen to look at monthly data starting in 2003 (1) and ending in 2020 (12). The reason for selecting this specific era is that international travel was mostly unaffected by the recession until around 2002. Following a period of stagnation, the Indian government undertook reforms and regulatory adjustments that helped the tourist sector pick up and develop steadily after 2002 (Ministry of Tourism, 2021; Sharma et al., 2022).
The data series is transformed into natural logarithms (ln) for efficiency in estimation, thus coefficients will indicate output elasticities.
The functional form can be represented as

here Tt stands for tourism demand while WI t for world/global income and Rt for the real effective exchange rate.
Following the current literature, natural logarithms are used to convert all series for a more efficient estimate. After taking the natural log we can present the functional relationship as

All variables are in natural log form and µt represents the error term.
Bounds Test
The autoregressive distributed lag (ARDL) model is used to investigate the possibility of a long-run relationship between the variable of interest. Unlike most of the classic cointegration methods, it is not necessary for the variables to be integrated in a similar order. It performs well in terms of robustness in the combination order of stationarity. However, the technique has one limitation, it does not operate well when the series is not stationary even after the first difference or integrated at higher-order I(2). The f statistic produces inaccurate findings that invalidate the whole estimation (Pesaran et al., 2001). To mitigate this problem the unit root tests supplemented by Augmented Dickey and Fuller (1979) and Phillips and Perron (1988) are utilized. Therefore, it should be verified that no variable is stationary at I(2). The bounds test is performed once the level of integration has been determined. The findings may be determined with certainty if the calculated f-statistic value is larger than the limit indicated by Table 2. We can conclude cointegration is inconclusive, If the calculated f-value is in the interval between the upper I(1) and lower I(0). For the cointegration to be accepted, the projected f-value must be larger than the I(1) constraint (Pesaran et al., 2001).
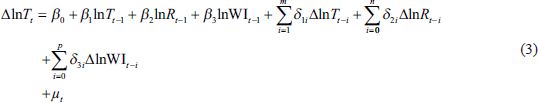
The ARDL equation of the model is as follows:
Variables and Data Sources.

The above equation Δ denotes the differenced form of the variable. β0 stands for intercept, β1, β2, β3 are coefficients of the long run and coefficients of the short run are denoted with δ1i δ2i δ3i and µ depicts random error in the equation. Also, m, n, p denotes the optimum lags of the series defined by Akaike criteria (AIC).
Following confirmation of the long-run equilibrium between the variables, an unconstrained error correction model will be conducted to ascertain the short-run dynamics. The Error correction format of the equation is depicted below:

while ECT represents the error correction term and (Φ) is the rate of adjustment that is used to attain equilibrium. While the lags of the relevant variables are m, n, p and α0 denotes intercept. Also, the coefficients of the short-run are depicted by A1i A2i A3i.
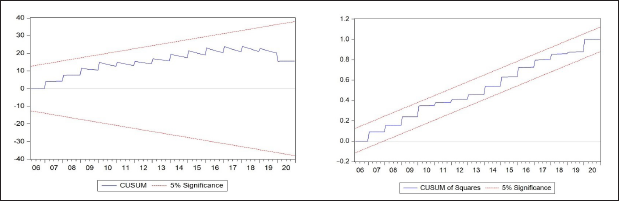
Following ECM, multiple tests, including the cumulative sum (CUSUM) and cumulative sum of squares (CUSUMSQ), are conducted after ECM to assess the model’s stability and robustness (Brown et al., 1975).
The Causality Analysis
To add extra support to the study after the bound estimation, Toda and Yamamoto (1995) causality analysis has been utilized to unravel the causal nexus among world income, currency rate, and tourist arrivals. The approach has an improvement over the existing Granger causality approach in that it can be utilized in the mixed level of the variables. The variables’ VAR format is provided in Equations (5), (6), and (7) shown below:
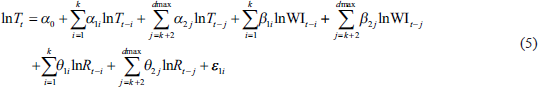
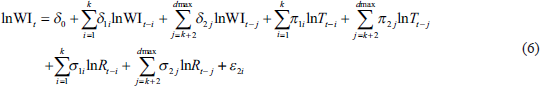
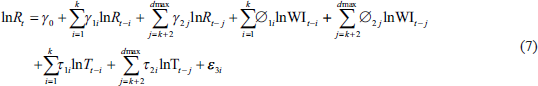
where the series is presented in (5) to (7). When the p-values lie inside the customary 1–10% significance level, the null hypothesis of no causality is rejected. Hence, in (5), Granger causality from lnRt to lnTt, lnWI t to lnTt implies θ1i ≠ 0∀i and β1i ≠ 0∀i respectively. Similarly, in (6), from lnTt to lnWI t and lnRt to lnWI t and ύ1i ≠ 0∀i and σ1i ≠ 0∀i respectively; from (7) lnWI t to lnRt and lnTt to lnRt if ∅1i ≠ 0∀i and τ1i ≠ 0∀i respectively.
Discussion of Empirical Results
Two separate unit root tests, ADF and PP, are used to determine the degree of stationarity and their results are depicted in Table 3.
Stationarity Test.

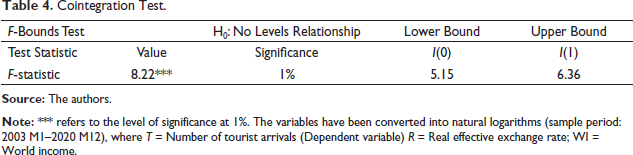
In the levels, all variables are not stationary. To be more specific tourist arrivals are not stationary in levels. Also, the real effective exchange rate is not stationary at levels. However, the same is not true for the variable world income. To conclude all are stationary at the difference by both criteria. As indicated by Table 3 all variables when first differenced are stationary. The findings reiterate the fact that is recognized in empirical analysis, that most of the macro variables are stationary at the first difference (Nelson & Plosser, 1982). For cointegration, the ARDL model is applied. The optimal lag criteria are AIC-based. Table 4 depicts that the computed f-stat is above the I(1) bound value and confirms the cointegrating relationship. The critical values of the I(0) and I(1) bounds given by Pesaran et al. (2001) are used to decipher cointegration among the series. Hence the null hypothesis of no level relationship among the series, that is, H0: β1 = β2 = β3 = 0 is rejected. As the calculated F value is well above the I(1) bound of the tabulated value at 1% of significance. Thus, the null hypothesis is not accepted. Consequently, cointegration is present among the series.
Cointegration Test.
The presence of cointegration further motivates us to analyze the short and long-run dynamics among the variables. Table 5 part (1) depicts the long-run estimates. The real effective exchange rate and tourism demand have a considerable positive long-run connection (tourist arrivals). Hence, a 1% increase in the exchange rate results in a 0.7% increase in tourist arrivals, holding all other things constant. The finding is logically correct. As the exchange rate of the rupee depreciates it is relatively cheaper for visitors. Thus, it impacts positively tourist arrivals.
Estimation Results of ARDL Model.

Estimation Results of ARDL Model.

Moreover, a favorable and significant linkage is noted between world income and tourism demand. Hence, all things remain constant, a 1% increase in world income results in a 3.24% rise in tourist arrivals, and other things remain the same. An increase in the Income of the visitors enhances tourist visits in India. The result is in line with Martins et al. (2017) and Seetaram (2010) where the income of the tourist and tourist arrivals in the destination country has a positive association.
In the short run, part (2) of Table (5) reveals exchange rate is significantly impacting tourist arrivals in the short run. The result further strengthens the findings of Aslanoglu et al. (2021), Martins et al. (2017), and Obi and Ogbeide (2022). Similarly, world income is found to be significant and positive. The Estimated lagged value of the error term ECT is found to be significant and has the required negative sign. The error correction term implies the speed of adjustment in the equilibrium process. That implies that any change in the equilibrium path from the short run to the long run is corrected by the speed of adjustment.
From what follows, Table 6 represents the results of Granger non-causality based on the Chi-square (χ2) value. We note that tourist arrivals and world income have a bidirectional causal linkage. However, unidirectional causality is noted from real effective exchange rates to tourist arrivals. The results of the study are aligned with the existing literature (Dogru et al., 2017; Martins et al., 2017; Obi & Ogbeide, 2022). Also, Karimi et al. (2019) noted that real effective exchange is a crucial determinant of tourist arrivals. Furthermore, in terms of combined causation where the combined impact of excluded variables is taken into consideration, it is shown that excluded variables have combined causation on tourist arrivals and world income.
Causality Analysis.

CUSUM and CUSUMSQ are utilized to assess the stability of the parameters. In Figure 1 the findings depict stable parameters as the plots lie in the 5% interval. Moreover, the empirical analysis of ARDL is found to be free from autocorrelation, heteroscedasticity, and normal distribution is noted. Also, we have tested against the presence of serial correlation in the results, and the probability of chi-square is 0.48. Hence, we conclude that the analysis is robust and free of serial correlation. Breusch–Pagan–Godfrey statistic for heteroscedasticity is 0.21. Therefore, no problem of heteroskedasticity is noted. Since the study deals with monthly data, there is a possibility of seasonality. Thus to take care of the issue the data has been deseasonalized using seasonal and trend decomposition using Loess (STL) (Zhang et al., 2021).
Conclusion and Policy Implication
The research, covering the period of 2003 (1) through 2020 (12), using the bounds test and ARDL framework, analysed the monthly temporal impacts of global income and currency rate on tourist visits in India. Causal direction is also analysed using a non-causality paradigm in this research. When analysing tourist arrivals as a dependent variable alongside income and exchange rate, the research finds a statistically significant long-run association between the variables. The study shows that rising global GDP has a dramatic impact on the tourist industry. The actual effective exchange rate also plays a crucial role in the short term. As a corollary, the Toda–Yamamoto non-causality test found that there was a unidirectional link between the currency exchange rate and the number of visitors. However, the bi-directional causal relationship between visitor numbers and global GDP suggests that both are strengthening one another.
At the very least, our findings highlighted two crucial macro-variables that play a role in the tourist market. This finding suggests that the exchange rate might be a significant predictor of tourist interest. India’s tourist industry would benefit from a more careful approach to managing the currency exchange rate. Policymakers in India need to take the booming tourist industry seriously and craft measures that support it.
An important result of this research is that the economic benefit of inbound tourism is influenced directly by the exchange rate. It is vital for the promotion of Indian tourism overseas to understand that the purchasing power affects their choice to visit India. Further research shows that unexpected changes in the currency have a considerable impact on people’s preferences for vacationing. Therefore, it is likely beneficial to establish a tourism brand that emphasizes the country’s strengths, like the relative cheapness of the Indian rupee and the renowned vivacity of many Indian towns.
The finding that the currency value has an immediate effect on tourism development highlights the significance of maintaining currency stability as a policy objective for central banks. Systemic dangers including war, recession, natural disasters, and epidemics are unfortunately common, but they must be mitigated as soon as possible. Keeping oneself adequately ready stresses essential investment in tourism-supporting infrastructure.
To sum up, India has to take the tourism industry by its horns and make it thrive since the money it makes from tourists is a significant part of the country’s export earnings. This is particularly noteworthy given the substantial contribution tourism makes to employment generation. Immediate monetary help to crucial industries like hospitality and entertainment should lessen the impact of any crisis on the sector as a whole in the long run.
It should be noted, however, that there are limitations to this research. The following topics may form the basis of the study’s future direction. Tourism demand modelling might benefit from a more in-depth analysis that takes into account a wider range of factors, such as the quality of government institutions, the availability of natural attractions, and the convenience of public transportation. Nonlinear models may be useful for future research since they have more explanatory power and include other key aspects like Information and Communication Technology (ICT) to reach the desired and policy-based outcomes.
Footnotes
Authors’ Contributions
All authors have read and approved the manuscript. The first author formulated the research idea and methodology section. The second author contributed towards the introduction and Literature review. The third author gave inputs regarding the conclusion and policy implications as well as proofreading the entire article.
Declaration of Conflicting Interests
The authors declared no potential conflicts of interest with respect to the research, authorship, and/or publication of this article.
Funding
The authors received no financial support for the research, authorship, and/or publication of this article.