



Abstract
Stock price manipulation can be defined as trading behaviour that distorts stock prices with the intent of personal gains. Securities market regulators around the world undertake market surveillance to prevent market manipulation protect investors and ensure market integrity. The Securities Exchange Board of India along with stock exchanges has implemented a novel additional surveillance measure (ASM) which tracks stocks on a daily basis for abnormal price and volume activity accompanied by the participation of market-dominating investors in trading activity. Stocks that breach predefined limits of the above parameters are categorized as ASM category and subject to overall additional margins and selective additional margins for the dominating investor. There are mainly two types of ASM, Long term additional surveillance measures (LTASM) and short-term additional surveillance measures (STASM). STASM consider a shorter duration time (5/15 days) for share price observation LTASM considers a longer duration (1 month/1 year) for screening of the stock for surveillance measures as per ASM criteria. This study is based on STASM. The mechanism, on the one hand, is expected to deter manipulators and on the other, warn investors about suspicious activity in the stock, which is not supported by fundamentals. This article analyses the impact of surveillance actions on a price return and liquidity. The article also looks at the degree of speculative activity surrounding the event. This study used regression analysis for impact assessment. The study results show that the prices of the stock stabilize after inclusion and there is an overall fall in liquidity post-inclusion. However, the liquidity impact is different for stocks with positive abnormal returns as compared to those with negative abnormal returns. The result of the study gives insight into the effectiveness of STASM which will be useful for regulators and investors to prevent market manipulations.
Keywords
Introduction
Securities market manipulations may take the format of traditional manipulations or open market manipulations. Open market manipulations are prima facie legal trades that are not accompanied by any identifiable misconduct. Hence such manipulation is hard to differentiate from legal trades, and harder to regulate. Putniņš (2012) stated ‘There is no generally accepted definition of the term market manipulation. Legal definition of the term is intentionally not explicit. The term is used in literature in an imprecise manner’. The supreme court of India in its judgments on different cases has provided some guidance regarding market manipulation. In the case of SEBI Vs. Rakhi (2018), the supreme court observed that market manipulation is a ‘deliberate attempt to interfere with the free and fair operation of the market and create artificial, false, misleading appearances with respect to price, market, product, security and currency’. From the above definition, it can be inferred that any legal trade that is not genuine, attempts to interfere with market operations or mislead the market is ‘manipulative’. The contemporary definitions across other global markets also rely heavily on the intention behind price distortion, as an important factor differentiating truly legitimate trades from manipulative ones. Some studies have recommended that legal trades that cause abnormal return volatility and changes to liquidity should be assessed using a combination of ‘intent’ and ‘effects’ on market quality, to determine the manipulative behaviour of the players (Baoling, 2021; Fletcher, 2018). There are multiple past cases where the Securities Exchange Board of India (SEBI) has penalized or barred securities market intermediaries for adopting unfair trade practices like synchronized trading, and front running can be found. One such example is the case of Ruchi Soya where three entities were found to place buy orders at prices higher than the last traded price and four entities simultaneously placed sell orders at higher prices so as to establish higher closing prices in the last half hour of trade on 27th 2012. These entities were penalized for fraudulent trade practices by the regulator. 2 SEBI received 454 price manipulation compliance for 2019–2020 and 921 complaints for 2020–2021. During 2020–2021, 46 cases (32.9%) completed pertained to market manipulation and price rigging as compared to 35 cases in 2019–2020 (SEBI, 2021).
The examples of surveillance actions implemented under the existing regulations related to Fraudulent and Unfair trade practices involve a process of enquiry, a hearing followed by an order for penalty or barring trading activities by the erring entities if adjudged guilty. The process is time-consuming the erring entities may continue to operate during this period. To have a more effective, pre-emptive surveillance action SEBI along with the exchanges has implemented an Additional Surveillance Mechanism (ASM) as an effect-based mechanism to deter open market manipulations. The ASM include Graded Surveillance Measures (GSM), reduction in price bands, periodic call auctions, short-term ASM and long-term ASM. STASM consider a shorter duration time (5/15 days) for share price observation as per the ASM criteria for surveillance while LTASM considers a longer duration (1 month/1 year) for selection of the stock for surveillance measures as per the market capitalization. Past literature studies (Baoling, 2021) conclude that stocks whose prices are manipulated exhibit common trading characteristics like extreme short-term price movements that are accompanied by volume increases and the existence of dominating investors.
ASM is a unique enhanced surveillance mechanism that measures and identifies the existence of the above common characteristics among stocks and imposes surveillance actions on stocks that breach the pre-defined limits concerning daily prices, volatility and market dominance measured across a period of 5–15 days. These stocks are subjected to overall additional margins and selective additional margins for the market-dominating investors, thereby increasing capital and cost of capital for trading in STASM stocks. The data of stocks included in the STASM category is shared through the trading terminals as well as on the exchange websites. The mechanism, on the one hand, is expected to deter manipulators and on the other, warn investors about suspicious activity in the stock that is not supported by fundamentals. This initiative is unique, as it imposes additional capital cost selectively on the market-dominating trader, thereby extending surveillance impact to the scrip level and investor level. The study analyses the impact of STASM action on the Liquidity of the stocks in the post-inclusion period.
Literature Reviews
Fletcher (2018) studied open market manipulations from a regulatory and legal perspective. Securities Exchange Commission (SEC) regulations look at ‘intent’ as an important element that contributes toward transforming a legal trade into a manipulative one. They argued that both intent and harm done to the market must be considered. The accompaniment of a legal trade by the intention to manipulate causes harm to the markets, that is impedes efficiency and liquidity, causes information asymmetry, etc., hence, it should be regarded as manipulative. Aggarwal and Wu (2006) documented that brokers, underwriters, large shareholders and market makers are likely to be manipulators of more illiquid stocks. Further, manipulation increases volatility and it exits in the presence of high liquidity that results in higher prices and higher volatility. Baoling (2021) examined 24 open market manipulation cases in the Chinese markets and concluded that the apparently legitimate transactions are likely to be classified as manipulative in case the price and quantity of the security traded are affected by the trading, and there is an intent to cause such an effect. Fischel and Ross (1991) argued that it is not possible to make a profit through open market manipulation because price increases with continuous demand (purchase) of stocks and decreases with consistent supply (selling) of those stocks. Hence, with no other fundamental reason for the prices to remain at higher levels, such trading strategies cannot be profitably deployed. Therefore, the researchers concluded that there is a very low probability for the manipulator to profit through open market manipulation and hence such manipulations are self-deterring in nature. Further, a trade-based manipulator does not take any publicly observable action or release false information to manipulate the price, which makes it difficult to regulate and enforce. The social cost and enforcement cost of such regulation are very high; hence, it is not essential to regulate such trades. Contrary to Fitchel’s opinion, Allen and Gale (2002) in their article concluded that in a rational and asymmetric information framework, it is possible to profitably manipulate stock prices They explain that in an asymmetric information framework, investors tracking stock price and volume movements are misled and tend to believe that large price and volume movements are because of fundamental reasons that make the stock undervalued at current prices and that such information is available in the private domain. Hence, continuous buying by a large trader can give the wrong signal to others, resulting in the formation of artificial prices and demand for the stock. Previous studies on the same question by Hart (1977) and Jarrow (1992) show that profitable manipulation is possible only if there is ‘price momentum in the stock.
Khwaja and Mian (2005) study abnormal trading patterns and systematically profiting out of them. The study concludes that colluding market intermediaries such as stock brokers are able to generate significantly higher returns than outside investors by using pump-and-dump price manipulation methods. The researcher further emphasises that the manipulator and naïve traders impose participant’s cost to new entrants who wants to raise capital through stock markets and the absence of governance for market manipulation may hamper the development of the markets.
The impact of inclusion on market quality is done using Regression. Key characteristics of manipulated stocks are documented in studies by Baoling. (2021), Huang et al. (2007) are large spikes in stock prices, high volatility, upward spike in trading volumes, short-term price continuation and long-term price reversals. Manipulated stocks are also generally mid or small-cap stocks with low liquidity. The stocks included in STASM include stocks with both positive and negative abnormal returns and show both continuation and reversal price patterns. We apply dummy variable regression analysis to understand the impact on liquidity, for different subsamples of companies differentiated based on continuing and reversing price patterns. We also see if liquidity impact is different for companies based on size measured using market capitalization.
Research Gap
Earlier studies were on various other surveillance measures and market manipulation. Parmar and Chaturvedula (2017) studied the stock return and volatility of stock when securities shift to trade to trade segment and the study conclude the trade-to-trade surveillance measure has a significant impact on price return and volatility. Aggarwal et al. (2019) studied GSM introduced by SEBI in India, the measure temporally restrict trading, and it conclude GSM results in a decline in stock prices and trading activity. Studies have also been done on the effectiveness of price bands to curb price manipulation (Chari & Inamdar, 2017; Kim et al., 2001). While Aitken et al. (2015) in their study across 34 markets studied various surveillance measures to curb insider trading and concluded that market surveillance assures better market integrity and enhances market efficiency. Very few studies have evaluated the impact of surveillance actions on market liquidity in the context of emerging markets. Hence, this study attempts to make a contribution to the literature in this less-explored area. This study is the first attempt to evaluate STASM and its impact on securities.
Research Methodology
The study used event study methodology to calculate the abnormal returns and abnormal volume (Binder, 1998; Boehmer, 1991; Brown et al., 1985). STASM has been implemented by the exchanges in November 2018. National Stock Exchange (NSE) surveillance department issued its first circular categorizing companies into STASM on 21 November 2018, which has become effective from 22 November 2018. For the purpose of this study, the data of companies included and excluded from STASM along with the date of inclusion and exclusion is provided by the surveillance department of NSE. To study how the inclusion and exclusion events affect trading activity, price and market quality, a sample set of 245 events of inclusion announcement and exclusion announcements made in the first 3 months of implementation, that is from 21 November 2018 to 28 February 2019 is used. From the sample size of 245 events, we have excluded events related to companies that have carried out mergers or acquisitions in the pre-event estimation window and finally, we have a sample of 218 events and 188 unique companies.
It is seen that the sectoral distribution of the companies entering into STASM was generally spread across various sectors. The top sectors having more than 10% of the companies in the sample are IT, financial services, metals and construction sector companies. However, these companies are included in the STASM category on various dates spread across the 3 months.
The number of days spent by companies in the STASM category before exclusion is given in Table 1.
Days Spent in STASM.

For these 218 events, the trading activity data of adjusted closing price, shares traded, number of transactions, and shares deliverable as a percentage of shares traded is collected for a period of 150 days before the event and up to 10 days after the exclusion from the Center for Monitoring Indian Economy (CMIE) prowess database.
Measures of Market Quality
This article measure impact of STASM on volume-based liquidity and speculative interest in the stocks surrounding the inclusion event and post-exclusion from the STASM category. The measures and their calculations are provided.
Shares Deliverable as % of Shares Traded
The equity cash market products available for trading in the National stock exchange include delivery trading and intra-day trading. Intraday trading involves the use of intraday price movements and leveraged trades for making profits by taking both short and long positions in equities depending upon expected stock price movement during the day. The NSE provides data about the trade volume that is delivered based and those that are intraday trades. The data of percentage shares traded for delivery shows the investor interest in shares, and the intraday trades represent the speculative interest in the shares. Hence, if the percentage of shares traded for delivery reduces, it can be said that the speculative interest in the share has increased. We have not found the use of this variable in the literature examined by us. The changes to shares deliverable as a percentage of shares traded (cpd) across the event window of (−5, +5) are useful in understanding the speculative interest surrounding the event. It is calculated as below:

where cpd is the changes to the percentage of shares deliverable in the event period −5 or +5 days.
Volume-based Liquidity Measures
The study uses popular measures of volume-based liquidity found in the literature to analyse the impact of STASM on liquidity. Turnover ratio and trade size are measured both on inclusion and exclusion the examine the liquidity impact of STASM on trading.
Turnover Ratio (stso)
The ratio helps to measure daily trading volumes surrounding the event and is calculated using Equation (2). The turnover ratio calculated is similar to the calculation done by Campbell et al. (1996). The log10 of turnover ratio is taken to ensure that the data is normal. An increase in the ratio of shares traded to shares outstanding represents more volumes and vice versa. We have calculated the change in trading volume using the difference between the turnover ratio of +5 and −5 days event window and the estimation window of 120 days.
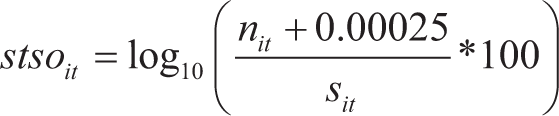
where n is the number of shares traded for company ᵢ at time t. The constant 0.00025 is added to avoid the log value from becoming zero. sit is the number of outstanding shares as on 30 September 2018, the half year before November 2018.
Trade size (tradesize)
Trade size represents the quantity traded per transaction executed on the day. If trade size increases, it means more volumes could be exchanged per transaction, implying an increase in order quantity per order. An increase in trade size indicates more liquidity and depth. It may be said that orders with larger quantities have been placed. Trade size is calculated below:

Size (lsize)
The size of the company is measured as the natural log of the market capitalization as on 1 April 2019 for all the companies in the sample.
Regression Analysis—Market Quality
The objective of STASM is to curtail speculative transactions by increasing margins in general and specifically increasing margins for investors who dominate the market by holding more than 30% of the turnover in the respective stock. The inclusion of stock into STASM means the stock has breached the parameters specified and has an increased Cumulative Abnormal Return (CAR) and market-dominant investors who have taken positions in the period of 5/15 days preceding the inclusion. Huang et al. (2007) conclude that stocks whose prices are manipulated show return continuation patterns during the manipulated period that are accompanied by higher trading volumes and price volatility which reverses after the manipulation period are over. Hence, it is felt that the impact of STASM on liquidity measures on different classes of shares may be different, and analysing the price continuation patterns and reversal patterns of stocks on inclusion in STASM may provide insights.
The examination of the company-level CAR in the pre and post-inclusion event windows shows that some companies continue the original price trends after inclusion into STASM, whereas there are others that show a reversal. The market quality impact on firms that exhibit continuation and reversal patterns in CAR can be different. Hence, we use an event case analysis method developed by Kim and Rhee (1997) and classify the sample into sub-samples based on the direction of CAR in the pre- and post-inclusion period of five days. We compare the CAR in the pre-inclusion period with CAR in the post-inclusion period, over the 5-day event window. If the direction of movement of CAR in the post-event window of five days is the same as the pre-event window of 5 days, then it is treated as a continuation pattern. If the direction changes then it is defined as a reversal pattern.
The sample is classified into four categories based on the direction of price momentum using CAR. The details of the sub-samples are given in Table 2.
Classification Based on Price Momentum in Pre/Post Event Inclusion Period.
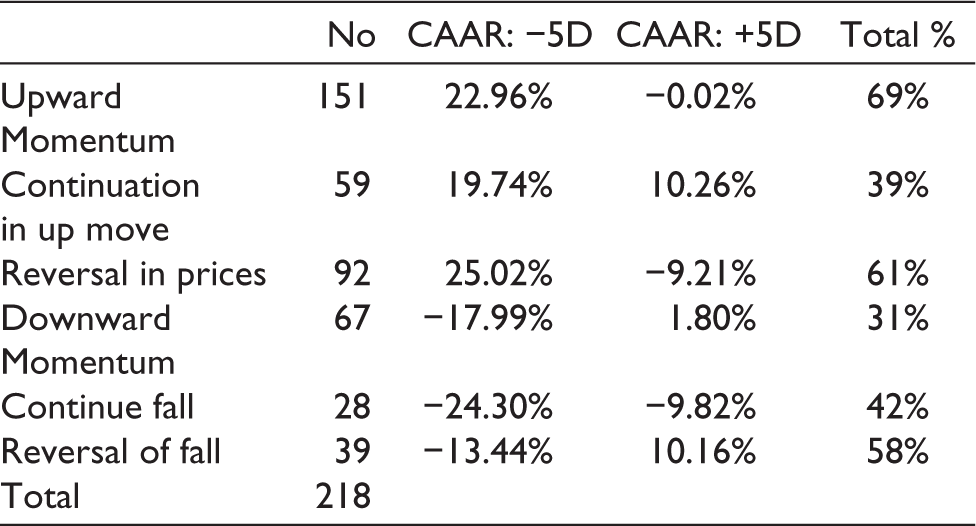
From Table 2, it can be seen that 69% of the stocks in the sample record an upward price momentum of 22.96% on an average in the 5 days window during the preinclusion period and reverse on an average by only 0.02% in the post-inclusion period of 5 days. Only 31% of the stocks enter the STASM category with a fall in average prices by 17.99% and a record reversal of 1.80% in the post-inclusion period of 5 days. It is interesting to note that, 40% of the stocks exhibit a continuation of price momentum patterns in the post-STASM inclusion period, which is relatively large.
Cross-sectional Regression Analysis
We use a cross-sectional regression analysis with the data of 5 days event window to understand the relationship between Cumulative Abnormal returns (CAR) and abnormal volume (CAV), turnover ratio (lnstso), speculative interest (lnpsd), trade size (lntradesize) and size (lsize) surrounding the event. This is done using the following regression equation across the full sample of events before and after inclusion into STASM.

CAR it is the cumulative abnormal return for stock i in time t, psd is the measure of percentage shares delivered, stso is the natural log of turnover ratio, trade size is the natural log of trade size and lsize is the log of the market capitalization of the company.
Regression Analysis—Heterogeneity in Liquidity impact based on price patterns
The liquidity measures outlined in the third Section are calculated for each stock for the period of 5 days before and 5 days after the event. The cross-sectional means of the measures are calculated and tested for significant differences using paired t-tests. Further, the study uses an ordinary least square dummy regression framework to test if the market quality is affected differently with respect to stocks that have a continuation price trend as compared to those that show a reversal. Similarly, we also test to see if the liquidity and extent of speculative interest are significantly different across the pre- and post-inclusion period to conclude the effectiveness of the STASM measures. The following regression with dummy variables is done to understand the impact heterogeneity of STASM on market quality in the pre- and post-inclusion period and across different price trends. Four sets of regressions are done with each of the liquidity measures as the dependent variable. The price pattern combinations analysed include stocks with positive CAR on entry and continuation trend after inclusion, stocks with negative CAR on entry and continuation trend after inclusion, stocks with positive CAR on entry and reversal after inclusion and stocks with negative CAR on entry and reversal after inclusion. The interpretations are based on the sign and significance of the beta coefficient of the respective independent variables. The equation used for the analysis is given
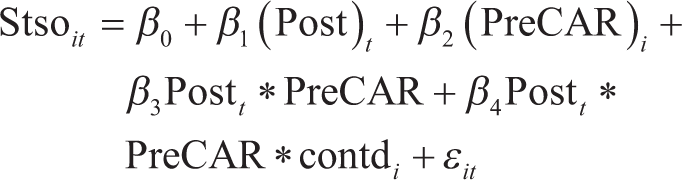
where Stso it is the natural log of turnover ratio or lntrade size is the natural log of trade size, preCAR represents the sign of CAR when the stock was included. That is stock was included with a positive or negative price spike on entry,
Post t represents dummy variable 1 for the post-inclusion period and 0 for the pre-inclusion period.
Contd is the continuation pattern of CAR for the stock which may be continuation or reversal.
Regression Analysis—Heterogeneity in Speculation Interest Based on Price Patterns
The interest in speculation as measured using shares deliverable as % of shares traded (cpd) (as in the third section) is calculated for pre-inclusion and post-inclusion periods of 5 days for each of the stock. The cross-sectional means of cpd before and after inclusion are tested for significance using paired t-test. The impact heterogeneity with respect to speculative activity surrounding the inclusion event for each of the price patterns is measured using the regression framework. Where cpd is the dependent variable. The different price patterns described above are repeated for this study also.
Regression Analysis—Size Impact on Liquidity and Speculative Interest
This section also looks into heterogeneity in size measured using the market capitalization of firms. The analysis is done to understand if there is any difference in that is the way in which the market quality measures are affected between large and small firms. We have classified the companies into large and small companies by taking into account the top and bottom 30 percentile based on market capitalization. We have eliminated 40% of the samples that fall in between the top and bottom 30%. It looks at how the difference in Size affects both liquidity and speculative interest among the stocks.
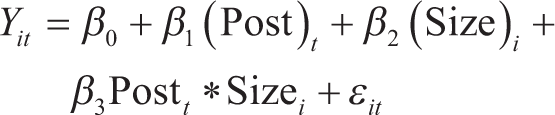
Yit is the Turnover ratio or trade size or percentage of stock delivered for stock i in the period t.
Post t represents dummy variable 1 for post inclusion period and 0 for pre inclusion period. Size is the dummy variable 1 for large market cap companies. The sign of the coefficient of the interaction dummy β3inter will show the impact of large companies in the post-inclusion period on different measures. The negative sign indicates a fall and vice versa.
Results and Discussion
The descriptive statistics of abnormal returns and the volume-based liquidity measures in the pre-inclusion and post-inclusion window of 5 days were calculated. The details are presented in Table 3.
Descriptive Statistics Inclusion Event.
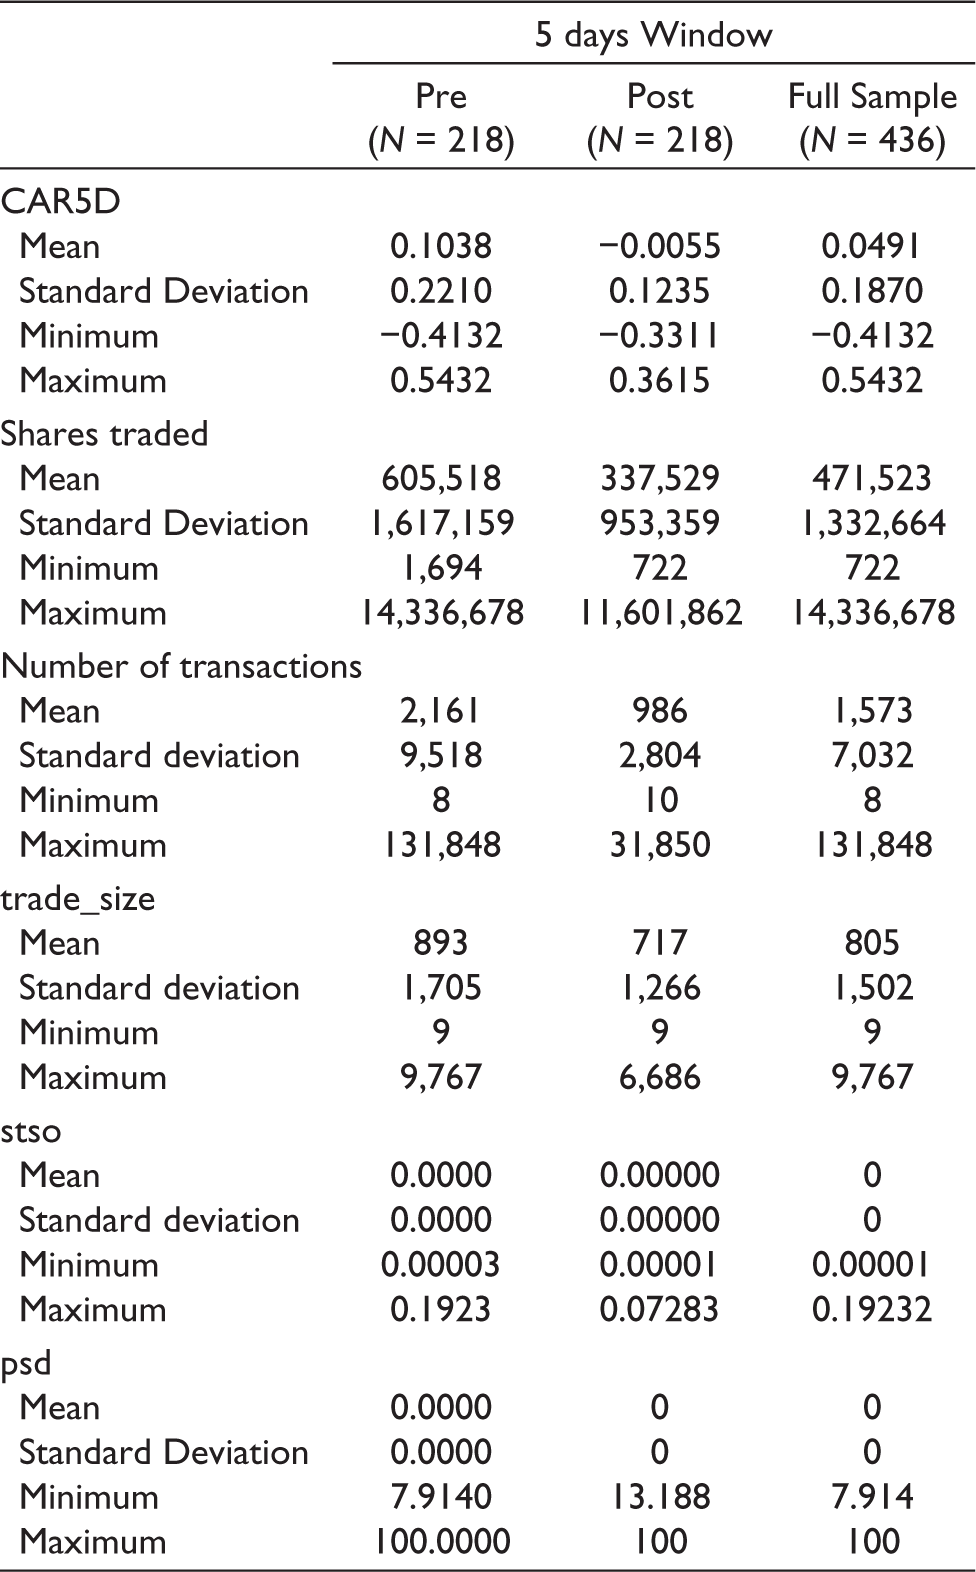
From the descriptive statics provided, it can be seen that the sample mean of CAR is falling in the post-inclusion period of 5 days. Liquidity volume-based measures, such as shares traded, the number of transactions per day and the ratio of shares traded to shares outstanding increase substantially in the pre-inclusion window of five days and then fall in the post-inclusion period. The share deliverable as the percentage of shares traded shows the volume of shares traded by investors as compared to those by intraday speculators. This percentage of shares of the deliverable was lower in the 120 days estimation window and then increased in the preinclusion event window and further increased post-inclusion. This can be interpreted as a fall in speculative interest in the shares both in the pre-inclusion and post-inclusion stages. Thus, trading activity in the pre and post-inclusion periods is less speculative as compared to the estimation event window of 120 days.
Table 4 provides the summary results of the analysis of the association of CAR with abnormal volume and other liquidity measures and speculation activity surrounding the inclusion event across the full sample. It is seen that Cumulative abnormal return increases with an increase in cumulative abnormal volume. Trade size also significantly increases with an increase in CAR. Thus, an increase in CAR is accompanied by an increase in both volumes of trade and transaction size, which is similar to the results by Huang et al. (2007).
Association of CAR.

Results—Heterogeneity in Liquidity Impact Based on Price Patterns
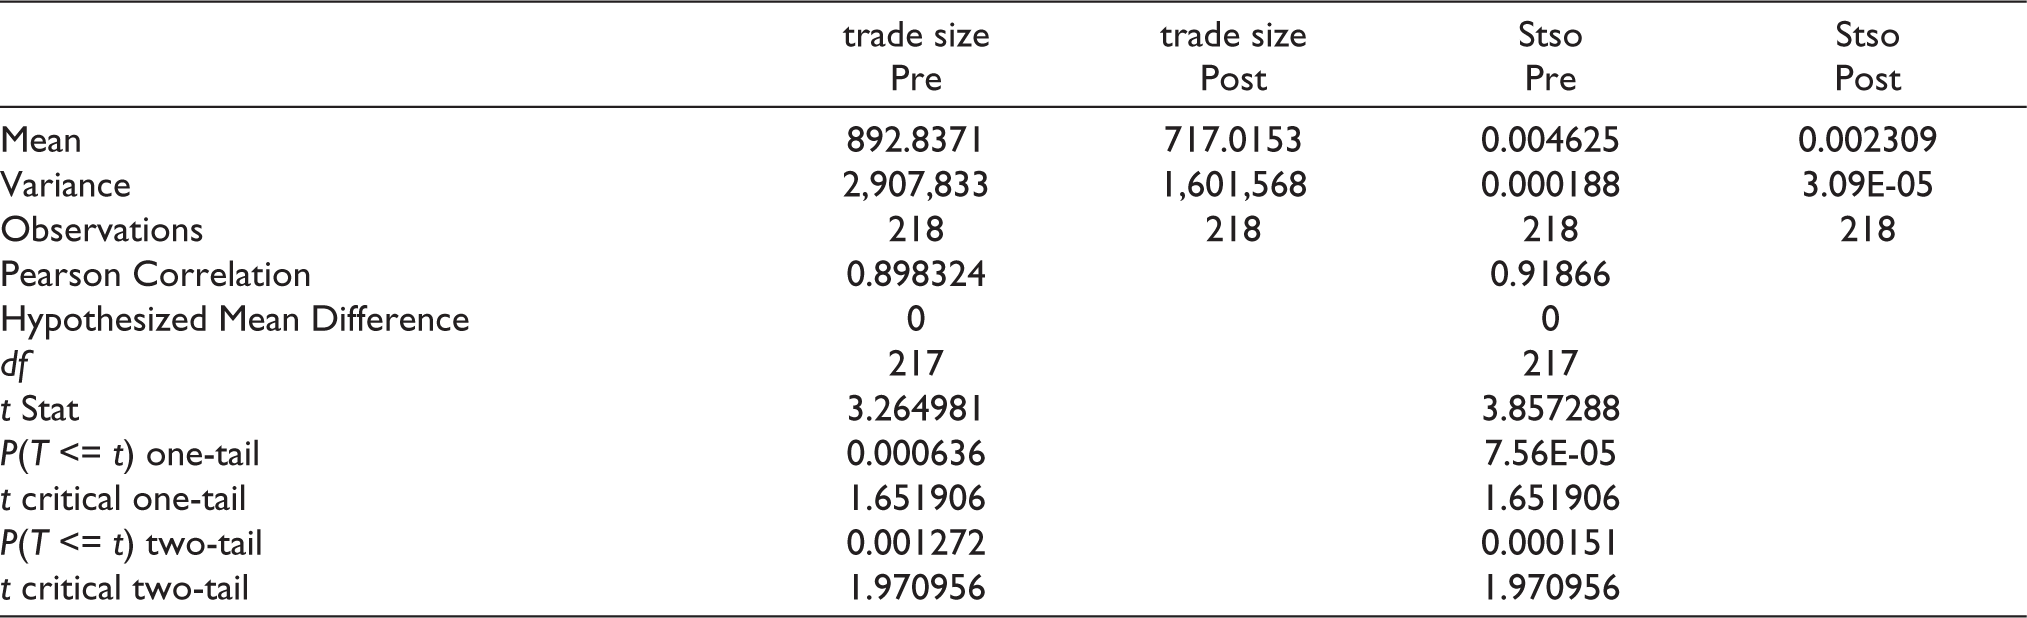
Table 5 reports the results of the univariate analysis of liquidity measures trade size and turnover ratio. The means and the variances of the pre-inclusion and post-inclusion periods are given in the table. It can be seen that the average liquidity of the cross-section of events has fallen in the post-inclusion period for the sample. Both market depth and volumes were significantly affected due to the inclusion of stocks in the STASM period. The paired T-test results show that the means are significantly different across the two periods.
Results t-test—Paired Two Sample for Means for Liquidity Measures.
The question of differences in liquidity impact on stocks with different price patterns is examined using a dummy regression framework. Results of liquidity impact on stocks with price pattern that is CAR positive on inclusion are provided in Table 6.
Liquidity Impact on Stocks with Positive CAR on Inclusion.
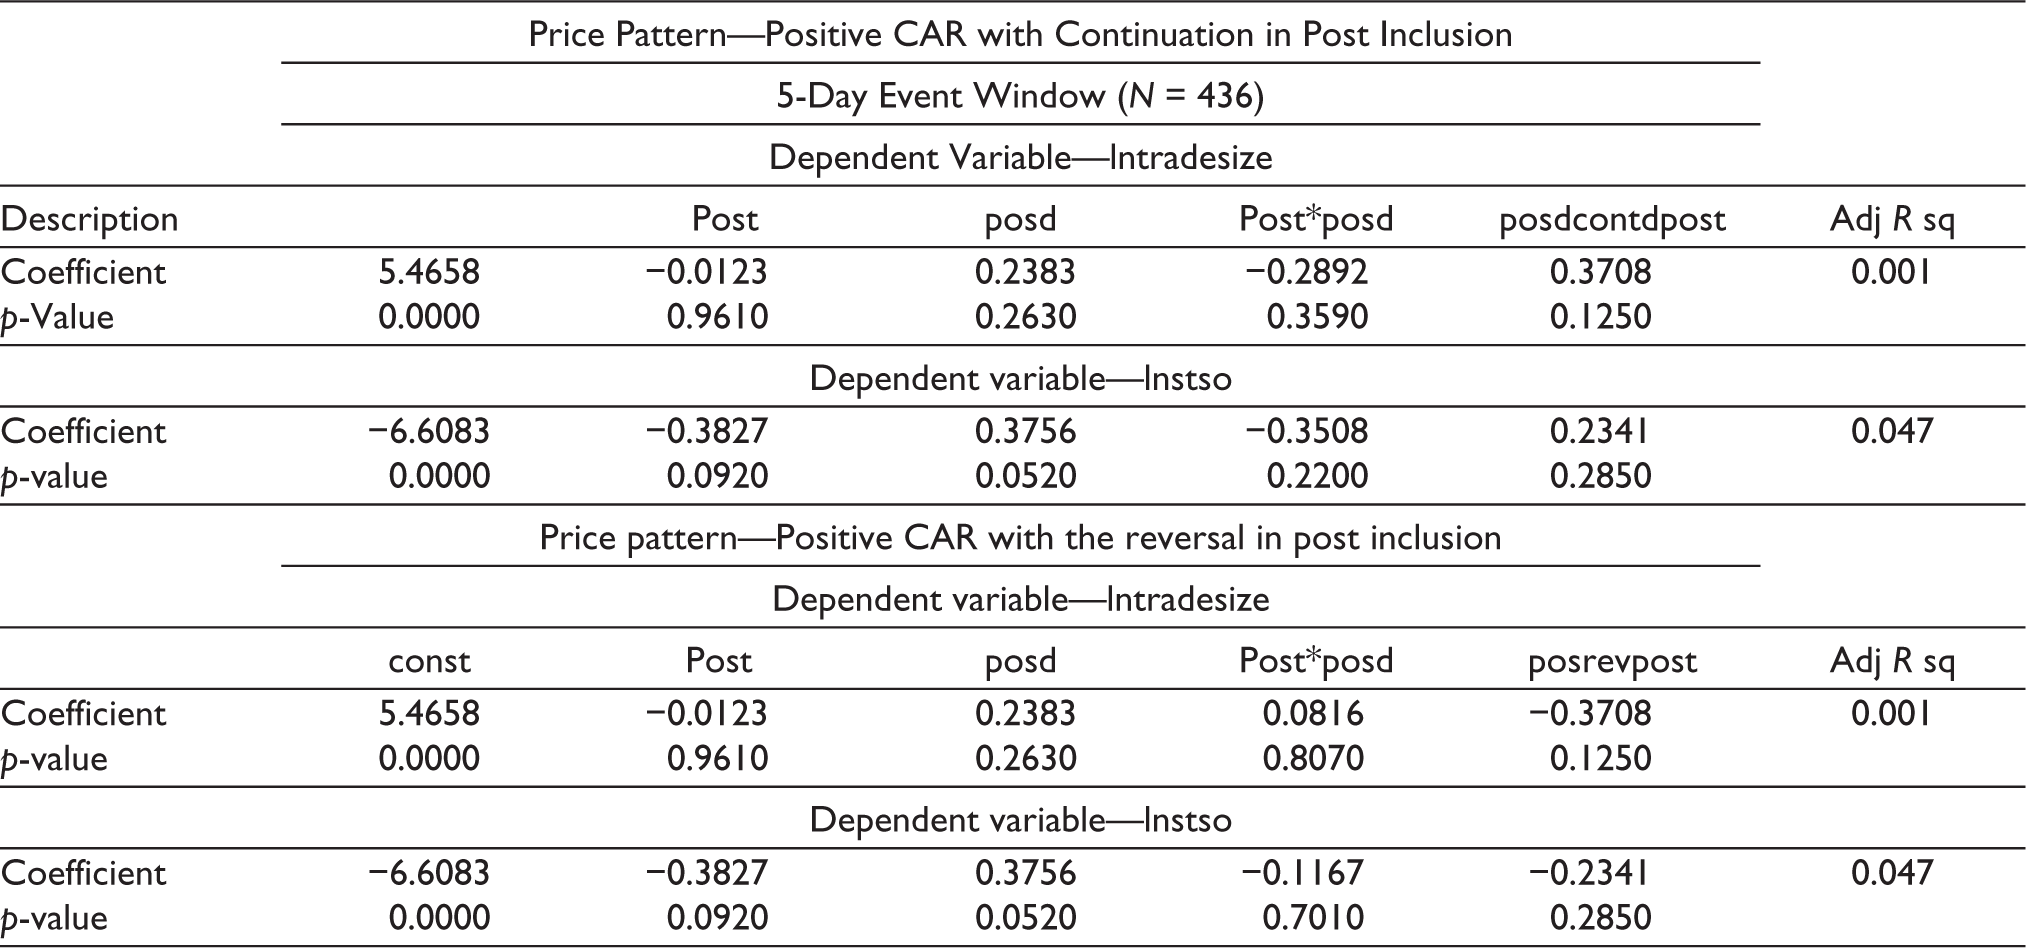
The results show that liquidity as measured by turnover ratio is falling in the post-inclusion period. However for companies that are categorized into STASM with a positive abnormal return on inclusion, the turnover ratio increases. Companies with positive CAR have better liquidity.
From the results in Table 7, it can be inferred that the liquidity measure trade size is found to be insignificant across all categories. The liquidity measure of the turnover ratio is significant and is falling in the post-inclusion period and for stocks with negative CAR.
Liquidity Impact on Stocks with Negative CAR on Inclusion.

Results—Heterogeneity in Speculation Interest Based on Price Patterns
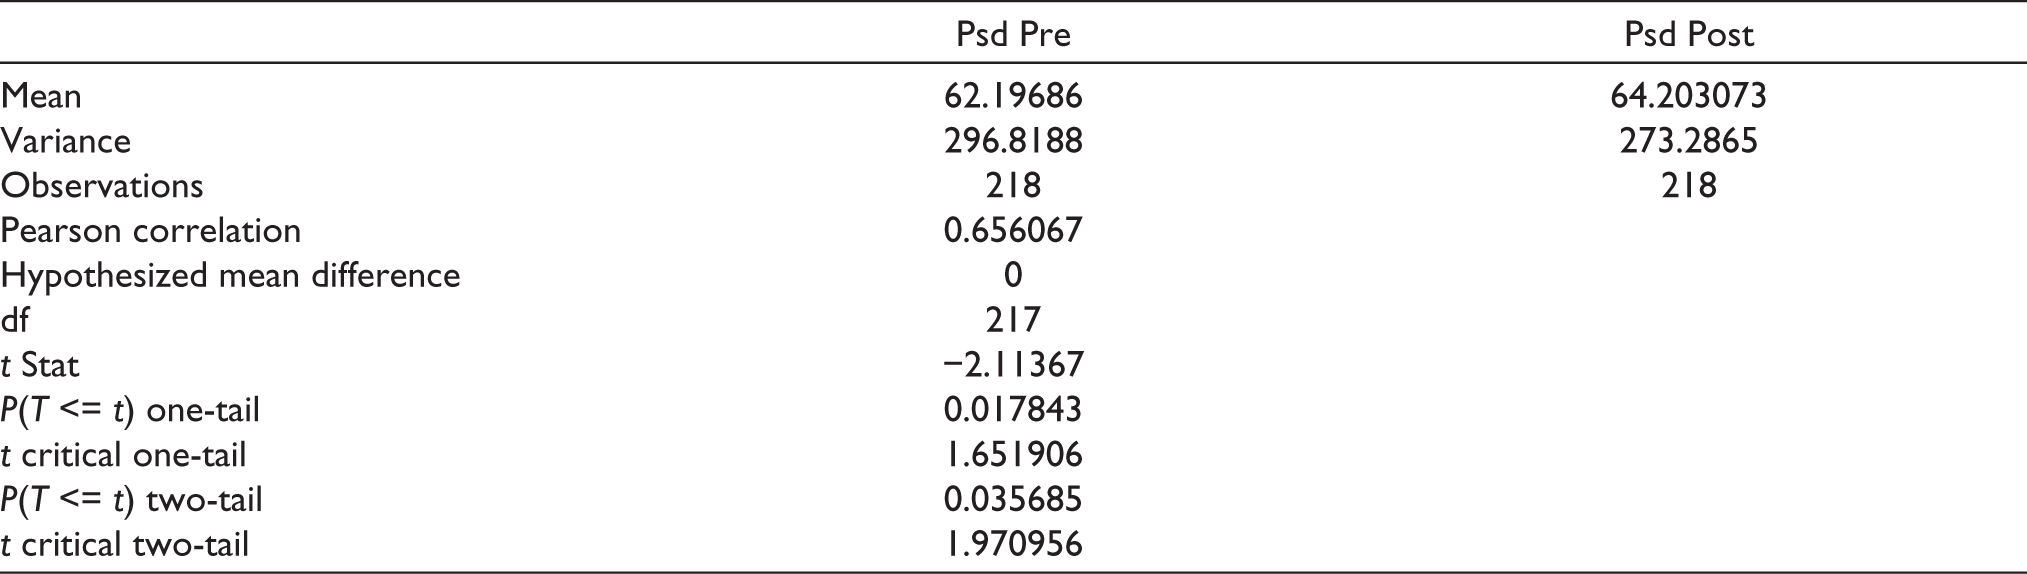
Table 8 presents the results of sample data % shares delivered to total shares traded in the pre and post-inclusion period. As per the results, it is seen that the % shares delivered was low in pre inclusion period as compared to the post-inclusion period. This means before the inclusion of stocks into STASM the intraday speculation was higher and fell after inclusion for the cross-sectional sample. The fall is significant at a 5% level of significance.
Results of t-Test: Paired Two Sample for Means % Shares Delivered to Total Trades.
The question of whether the speculation interest in the stocks surrounding the period of inclusion was the same across all categories and price patterns is examined and presented through dummy variable regressions results which are given in Table 9.
Speculation Interest in Stocks with Differing CAR Patterns.

The % shares delivered to total trades are generally less for shares with positive CAR which implies that stocks with positive CAR have more intra-day trading volumes. Further, in the post-inclusion period stocks that have a continuation of CAR show more delivery trades (which could be booking profits by dominant investors) and stocks that have a reversal CAR pattern show more intra-day volumes.
Post inclusion continuation trend in CAR can provide room for profit booking. In the case of stocks with a reversal of positive CAR patterns, post-inclusion shows a decrease in delivery trades that may signify slow profit booking by the dominant investor. Typical stock price manipulation patterns are of the form where prices are increased first, and then stocks are sold at a profit with abnormal return continuation trends or slow reversal trends. Heterogeneity in the impact of % shares delivered to total shares traded across different price patterns indicates the possibility of trade-based manipulations in the stocks. However, such manipulations cannot be conclusively said in the absence of details of investors and other corroborative evidence.
Results—Heterogeneity Liquidity and Speculation Interest Impact Based on Size
Table 10, Results show that the regression results of speculative interest are not significantly different for stocks with large size as compared to stocks with smaller size. However, trade size is falling for stocks with a large market cap as compared to stocks with a smaller market capitalization.
Results of Companies Sorted on Size Measured Using the Market Cap.
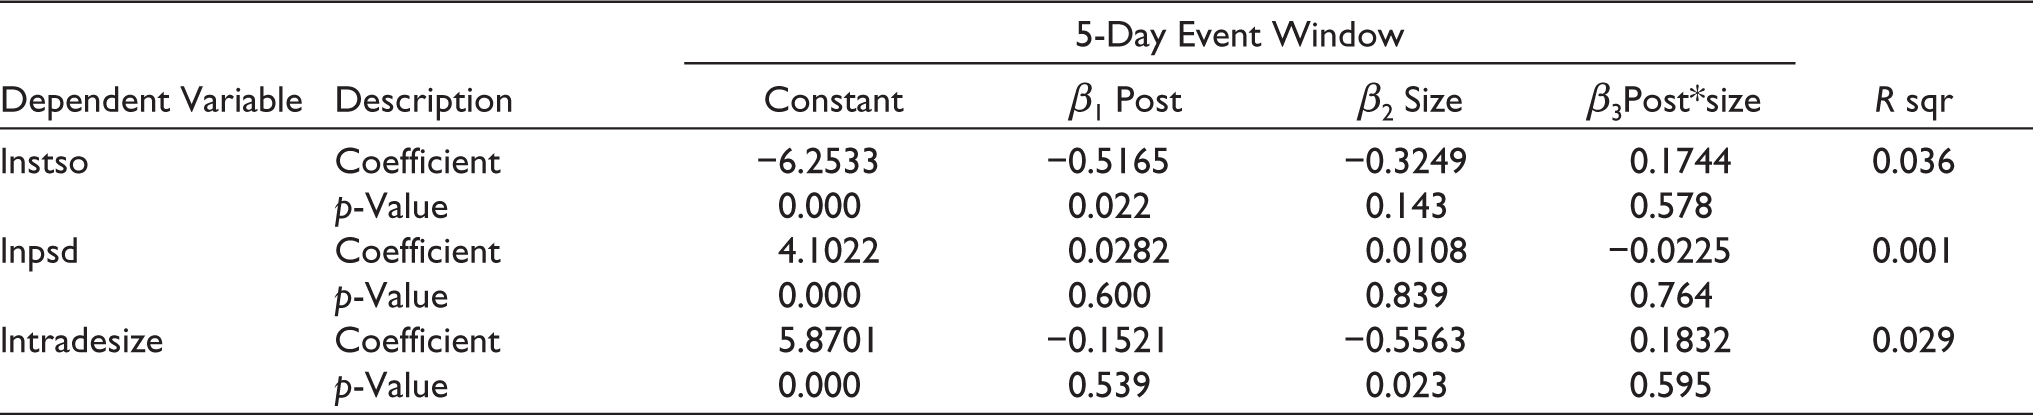
The result of size impact on companies included in STASM is given in Table 7.
The turnover ratio is falling for all companies in the post-inclusion period as already established in earlier regression. Additionally, we can see that the trade size is also smaller for large companies with a beta coefficient of −0.5563 and vice versa. This means for small-cap companies, higher turnover is accompanied by trades with a larger quantity per trade. The interaction variable β3 is not found to be significant for any of the liquidity volume measures or for a percentage of shares delivered.
Conclusion
The regulator categorizes stocks that exhibit trading patterns like unwarranted price movements accompanied by excess liquidity provided by a concentrated group of investors into the STASM category. As these stocks show trading characteristics that are similar to stocks whose prices are manipulated, additional margins are levied on dominating investors and warning is provided through the terminal to the uninformed investor by this categorization. It is felt that such a warning will deter manipulators, and also increase the cost of capital to them, thereby making manipulation less attractive. This study examines the impact of the surveillance action on the liquidity of the stocks, it also analyses the differential impact of STASM on liquidity measures by classifying firms based on size and continuation or reversal price patterns using a regression framework with the incorporation of dummy variables. The daily data of the percentage of shares delivered is used to understand the differences in speculative interest in the stock across different price pattern trends. This study can be extended further by using different parameters of liquidity and shareholding patterns before and after the STASM.
The results and conclusions emerging from the regression analysis are CAR increases are accompanied by an increase in cumulative abnormal volumes and an increase in trade size. Stocks that are included in STASM with positive CAR have better liquidity while those with negative CAR show less liquidity in the post-inclusion period. With respect to extent of speculative activity, the percentage of shares delivered is less for companies with positive CAR and the delivery trades are more for companies with positive CAR and with a continuation pattern in the post-inclusion period. However, for companies with positive CAR and reversal patterns in the post-inclusion period, the delivery trades are lower. Irrespective of whether there is price manipulation or not, the pattern is suggestive of price increases that are supported by large speculative and delivery trades in the pre-inclusion period, which may be followed by profit booking in the post-inclusion period. Differences in the impact of % shares delivered across different price patterns will have to be corroborated with investor identity to explain events better. Currently, the criteria for surveillance do not include the % shares delivered to total trade. Monitoring consistent and continuous changes to the price of stocks accompanied by low or zero % shares delivered may also be a useful criterion in the surveillance of equity cash market trades.
Based on the results of the study, STASM has helped in curtailing abnormal price movements that are not supported by fundamentals. However, the restrictions imposed may have resulted in a fall in liquidity. It is felt that, in an emerging market like India, restrictions imposed by surveillance initiatives like STASM are important and help to preserve market integrity.
Footnotes
Declaration of Conflicting Interests
The authors declared no potential conflicts of interest with respect to the research, authorship and/or publication of this article.
Funding
The authors disclosed receipt of the following financial support for the research, authorship, and/or publication of this article: The research is supported and funded by NSE-NYU Stern research grant.