
Abstract
Abstract
This article has made an attempt to link collaborative research in industry with government initiative and market rate of interests. Two firms involved in Cournot competition in the market decide whether to conduct research to devise a technique for cost reduction. The amount of cost reduction after the research and the initial amount of capital possessed by each firm are private information to each of the firms. In particular, both of them have capacity constraint. The objective of this article has been to figure out the impacts of the lending and borrowing rates of interest on collaborative research. In the process, we have studied the effectiveness of different policies to encourage collaborative research and development (R&D).
Introduction
In oligopolisitic markets, firms conduct research and development (R&D) in order to achieve or maintain their competitive edge over their contenders. But conducting R&D, irrespective of whether it is directed towards product or process innovation, mostly involves huge capital investment. 1
The amount of investment in any R&D activity might vary depending on the maturity time for the concerned activity.
When firms conduct research in collaboration with each other, both the cost of conducting the R&D activity and the risk involved are shared to a certain extent. In fact, collaborative research might enhance the probability of success. The problem of free riding is also reduced in case of collaborative research (Kabiraj & Chattopadhyay, 2014). d’Aspremont and Jacquemin (1988) show that the technological advances are higher under cooperative R&D as compared to competitive R&D. Marjit (1991) establishes that firms cooperate in R&D when the probability of success is either very high or very low. Combs (1992), however, points out that research joint ventures (RJV) occur only for very high probabilities of success. Bayona, Garcia-marco and Huerta (2001) suggest that the complexity of technology and the fact that innovation is costly and uncertain, motivate firms to conduct cooperative R&D. According to Miotti and Sachwald (2003), cooperative R&D efforts are higher for firms from sectors with relatively high R&D intensity and also for firms that draw on scientific resources to innovate compared to firms further away from the technological frontier. As pointed out by Mukherjee and Ray (2009), uncertainty in patent approvals also might induce cooperative R&D. Kabiraj and Chattopadhyay (2014) show that Marjit’s (1991) findings hold under incomplete information framework as well; moreover, the range of probability values of success, for which cooperative R&D occurs, increases.
However, there are certain disincentives for collaborative R&D. When firms collaborate only in the R&D stage, the research outcome is equally shared. If the same firms compete in the aftermarket, then sharing the R&D outcome equally does not provide any competitive edge to any individual firm over its contenders, who are also part of the collaborative R&D team. It happens since each of the firms participating in collaborative R&D enjoys the same level of benefits, for example, same level of cost reduction resulting from the R&D. This scenario is more prevalent for low rates of spillover of the concerned R&D activity and thus private firms prefer cooperative R&D when such spillover rates are high, as noted by Choi (1992).
The benefits of R&D activities do not remain confined in just yielding higher profits to firms who undertake such activities. These activities very often benefit the consumers, for example, in the form of lower prices for the same products, resulting from the lowering of costs of production or better quality products. R&D activities also have crucial implications for the overall development prospects of any economy. For instance, R&D activities leading to generation of new technologies might push out the technological frontier of an economy. Kamien, Muller and Zang (1992) suggest that equilibrium-level technological improve-ments are low and equilibrium prices are high under competitive R&D than under cooperative R&D. Also, R&D resulting in innovation of less polluting techno-logies reduces pollution. Thus, R&D activities potentially possess huge positive externalities.
R&D often remains unfunded by private capital, for example, venture capital since private capital does not have any incentive to internalize positive externalities. This situation is more prevalent in cases where public equity markets are underdeveloped (Hall & Lerner, 2009). Therefore, R&D activities in industries are often consciously promoted by policy makers (governments in most cases). Brocas (2004) mentions that in the context of R&D rivalry, socially optimal outcome might not materialize, and therefore, the policymakers have developed various tools to encourage and promote collaborative R&D to mitigate the inefficiencies generated in the process. As noted by Ghosh and Ghosh (2014), in US the National Cooperative Research Act of 1984 was designed to promote cooperative R&D ventures among firms. The governments can adopt different types of policies for this, for example, allowing for tax credits for research collaboration, provide research funds at cheaper rates of interest or directly share the costs by providing subsidies, etc. Thus for both the situations, mentioned above, the problem of under-investment in R&D can be mitigated to a certain extent, even though not completely eliminated. 2
We need to note here that if firms collaborate at the level of both R&D and production in the aftermarket, the market becomes less competitive leading to loss of consumer surplus. Thus, if any policymaker’s objective is to ensure higher level of social welfare, then incentives for R&D collaboration need to be complemented with strong antitrust laws.
From the above discussion, it emerges that both collaborative research and incentives from governments can enhance the scale of R&D activities in industries. Sakakibara and Cho (2002) show that due to the fact that cooperative R&D had been actively encouraged by the Japanese government, R&D output in Japan was significantly higher as compared to Korea, where the government did not take such initiatives. Thus, empirical evidence also suggests that government support for cooperative R&D indeed results in higher R&D output. The government, however, can offer supports for cooperative R&D in various different ways. For example, in Japan, in case of the very large-scale integrated (VLSI) circuit project, the government used to finance 22 per cent of the R&D budget. Czarnitzki, Ebersberger and Fier (2007) mention that the German Federal Government offers direct subsidies for collaborative research, and the number of such fundings has increased substantially over the years. 3
100 collaborative projects received funding from the German Federal Government in 1980, and this number reached 2,100 in 1990 and more than 7,500 in 2001 (Czarnitzki, Ebersberger & Fier, 2007).
The remaining part of the article is organized as follows: the second section describes the model, the first subsection elaborates the case of non-collaborative research, comparing the profit levels under different possibilities, the second talks about the case of collaborative research and the third discusses the government policy, in terms of offering cheap capital and providing subsidy, and finally the third section concludes the article.
The Model
We begin this section by describing the model’s framework. We assume that there is a market, which we term the aftermarket, where two firms (Firm 1 and Firm 2) are involved in a Cournot-type competition. The market demand function is given by
This means that the demand is ‘sufficiently’ high.
Each firm has Ki amount of capital that it can invest in any R&D activity. Ki is private information to firm i. It is common knowledge to the firms that all Ki-s are independently and identically distributed with distribution function G(.) with corresponding density function g(.) in the domain and have full support. Before entering the market, each of the firms has the option to conduct a cost-reducing R&D activity either single-handedly or collaboratively. If a firm conducts the research single-handedly then following the success of the research, the new cost function of firm i is
There is a bank from which both the firms can borrow. The borrowing rate of interest for the firms is
The sequence of the game is as follows:
Here, we assume that every firm knows whether its rival wants to conduct R&D or not. The action of actually conducting R&D is denoted by S and that of not conducting R&D is denoted by N. When none of the firms is conducting R&D then the profit in the aftermarket is the usual Cournot profit for each firm. This is denoted by
Interestingly, since this is a dynamic game of incomplete as well as imperfect information, none of the firms knows ex-ante any profit levels of the contending firm. Also, except for the case where none of them is performing any research, they do not even know their own profit levels, since own profit level for each firm is dependent on the type of its rival firm.
Non-collaborative Research
In this subsection, we analyze the case of non-collaborative R&D. First, we consider the different profit levels and then compare them.
Characteization of Different Profit Levels
In this subsection, we will derive four different profit levels of a firm. Since the firms are symmetric a priori, therefore, without any loss of generality, we use Firm 1 as the representative firm. The same profit levels for Firm 2 can be derived analogously. Let us denote
Note that all the profit levels are calculated when the firms are at the stage of deciding whether to go for a collaborative research, that is, all the profits are ex-ante profits.
First, we calculate the profit level when no firm undertakes any R&D activity. Cost of production for each firm remains at its original level. In this case, each firm deposits its capital in the bank and thus earns interest. Thus, the total earning of a firm is its profit in the aftermarket and the interest earning from its deposit as established in the following Remark 2.1.

This holds since, if both the firms are not doing research, then the profit they get in the market is the standard Cournot profit plus the interest on their capital.
Next, we calculate the profit level for the other extreme case, where both the firms conduct R&D. Here, both experience some reduction in cost, each firm has to invest its own capital for the R&D and also has to borrow from the bank in order to meet the cost of R&D. So the net earning of every firm equals the difference between the profit it earns in the aftermarket and the sum of its expenditure on capital and the loan repayment amount as shown in Lemma 2.2.

Proof. Note that for Firm 1,

Similarly, for Firm 2,

So the reaction functions are
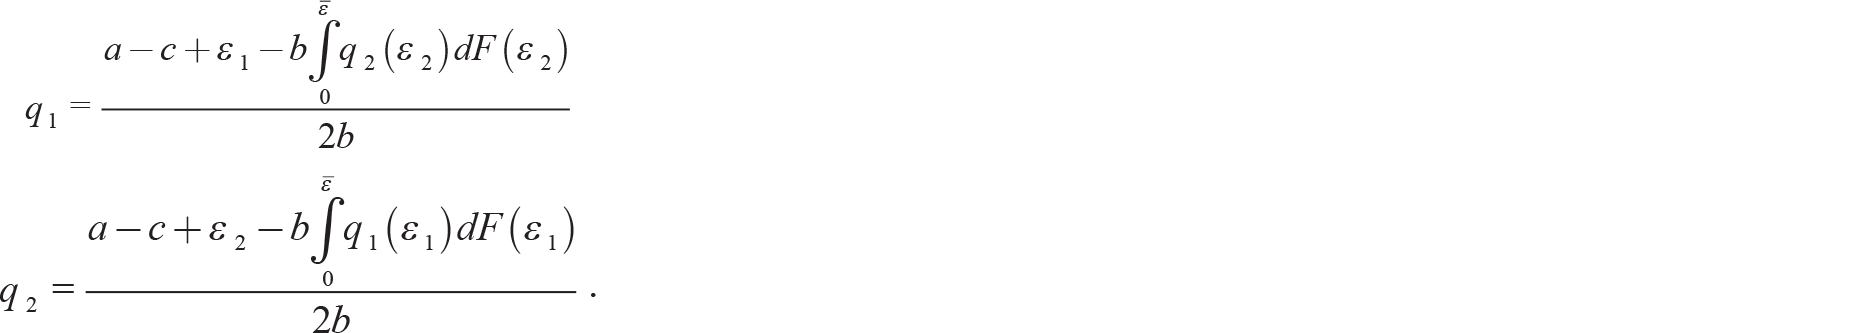
Solving these two reaction functions, we get

And putting
We next proceed to calculate the profit level of Firm 1; first, when it does not conduct R&D while Firm 2 does and second, when just the reverse happens. In the first case, Firm 1 does not experience any cost reduction, while Firm 2 does, but the actual amount of cost reduction is known to Firm 2 alone, so that Firm 1 has to act totally on the basis of expectations about Firm 2’s cost and output. In the reverse case, Firm 2 experiences no reduction in its cost level and Firm 2 has to act on the basis of expectation about Firm 1’s cost and output, for the same reason. The following Lemma 2.3 shows the profit levels of Firm 1 in both these cases.

and

Proof. Consider the situation when Firm 1 conducts the research and Firm 2 does not. Then,

and

So, the reaction functions are

Solving these two reaction functions, we get
Rest of the proof is trivial.
Comparison of Different Profit Levels
Here, we compare the different profit levels derived in the previous subsection.
To start with, we consider the profit levels for Firm 1, when it does not conduct R&D in two situations, first, when Firm 2 also does not conduct R&D as opposed to when Firm 2 conducts R&D. We resort to the following Remark 2.4 for this comparison.

The intuition behind Remark 2.4 is that when Firm 2 is conducting R&D, there is an expected reduction in Firm 2’s cost. So Firm 2 experiences a competitive edge over Firm 1. So the profit of Firm 1 is less when Firm 2 is conducting R&D. We next compare the profit levels of Firm 1 when it undertakes R&D under two situations, first, when Firm 2 also conducts R&D and second, when Firm 2 does not, in the following Remark 2.5.

The intuition behind the result in Remark 2.5 is similar to that behind Remark 2.4. Our next comparison involves the profit levels of Firm 1 when it performs R&D and Firm 2 does not, and when it does not perform R&D and Firm 2 does. The following Lemma 2.6 makes this comparison and we find that the ranking of the above-mentioned profit levels varies depending on the parametric values.

where
Proof. Note that
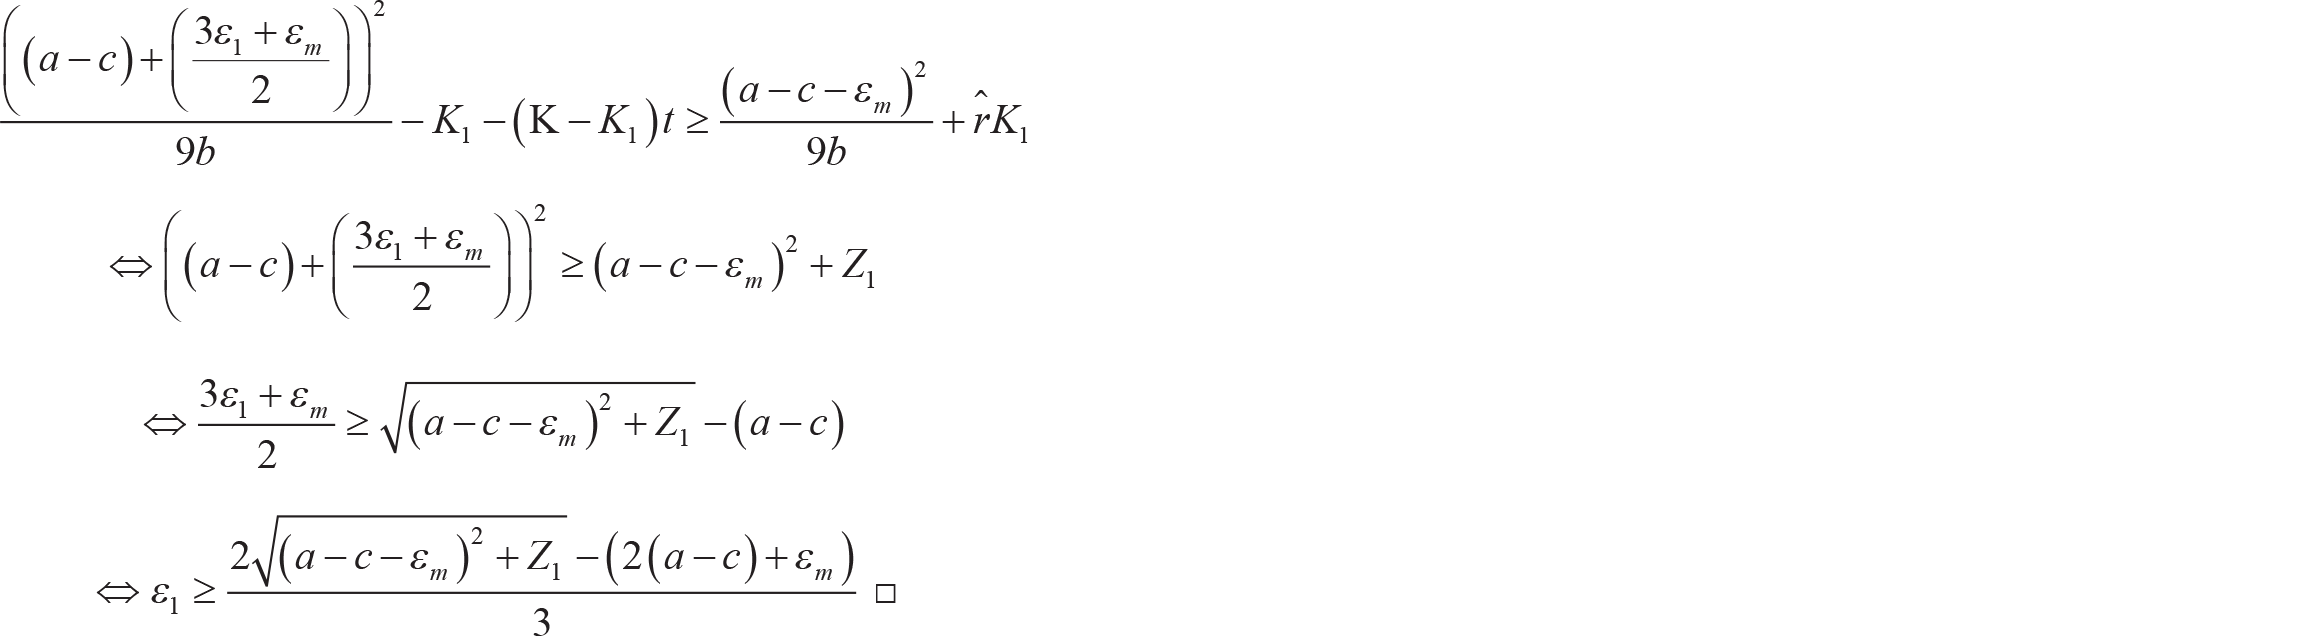
Next, we compare the profit levels of Firm 1 when it performs R&D and Firm 2 does not, and when no firm performs R&D. The following Lemma 2.7 makes this comparison. The result suggests that no a priori ranking is possible as the ranking of the above-mentioned profit levels again varies depending on the parametric values.

where

Proof. Note that
This result can be intuitively explained in terms of the fact that if Firm 1 conducts R&D then it will enjoy lower cost of production. However, in this case it has to forgo the interest earning. Firm 1 will, therefore, conduct R&D only if the increment in her profit by conducting R&D is higher than the foregone interest earning. Therefore, Firm 1 will conduct R&D only when her cost reduction is more than the threshold value as given in the above Lemma 2.7.
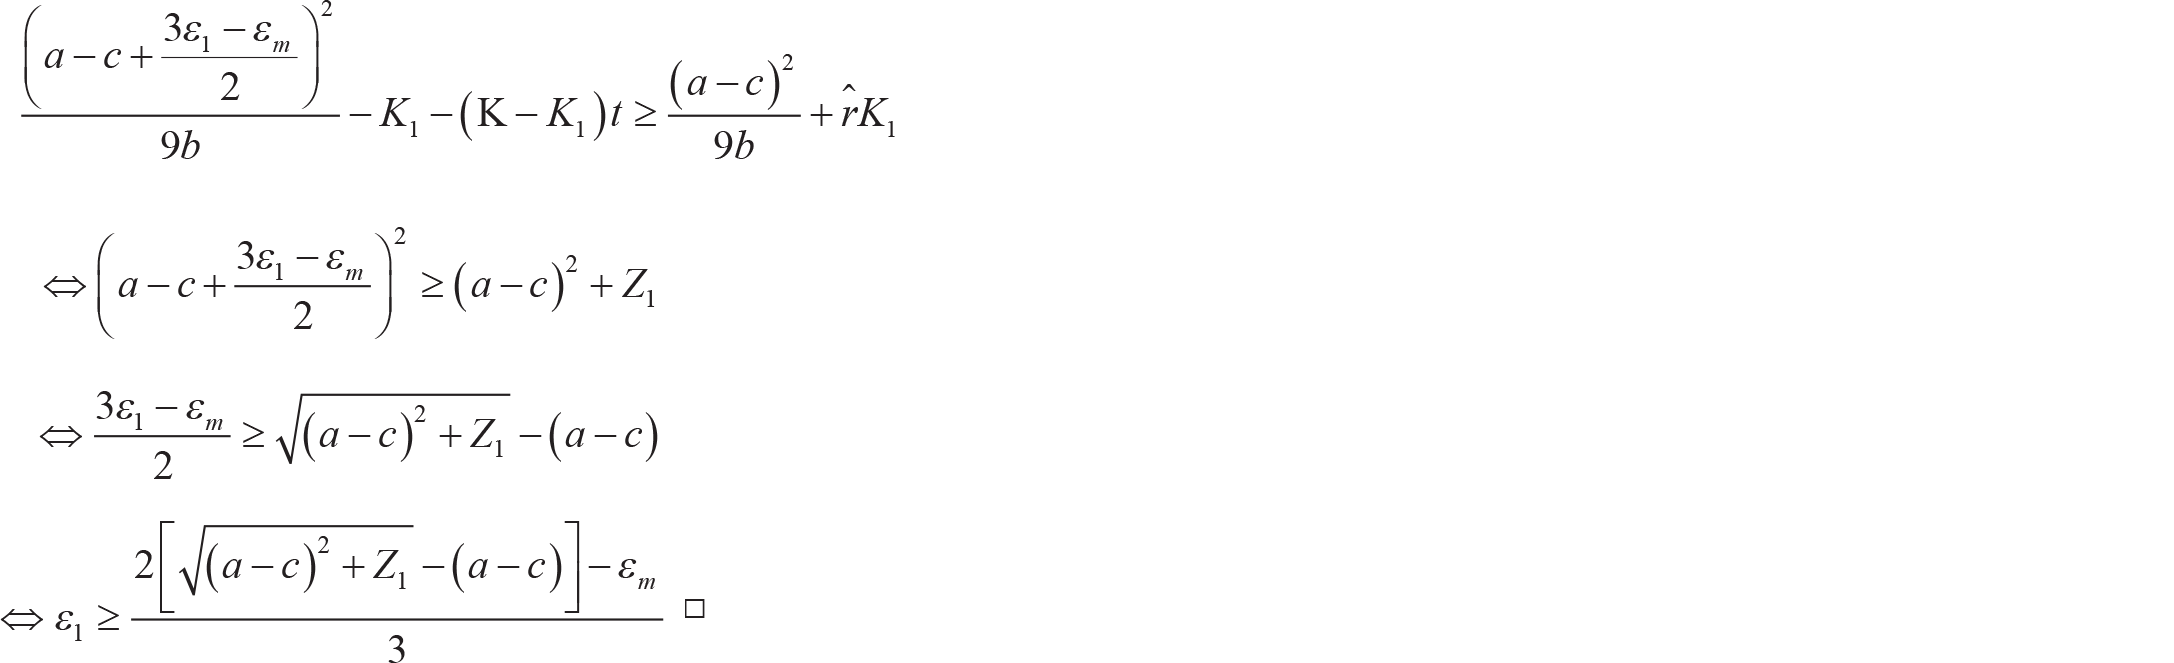
Our next comparison in the following Lemma 2.8 considers the profit levels of Firm 1 when both the firms undertake R&D as opposed to when only Firm 2 undertakes R&D. The ranking of these profit levels also varies depending on parametric values.

where

Proof. Note that
The intuition of the above Lemma 2.8 is similar to that of Lemma 2.7. For deriving the next set of results, it is important to establish the following Lemma 2.9 which makes a comparison between A1 and B1.
Proof. Note that

Next, we consider the four profit levels

Proof. This follows from Lemma 2.9, Lemma 2.7 and Lemma 2.8.
Lemma 2.10 implies that when the rival firm is performing R&D, if a firm is also interested in performing R&D then it will conduct R&D irrespective of whether the other firm is undertaking R&D or not. Note that it also implies that
Comparing the profit levels

After establishing the required relationships in the various Remarks and Lemmas above, we now state the following Proposition 2.12 which establishes the sufficient conditions for Firm 1’s decision about whether to undertake R&D or not.
If If If
Proof. We obtain the proofs of the first two results by combining all the Lemmas stated above.
For the proof of the last result, first note that in this case
Collaborative Research
In this subsection, we consider the case where the firms collaborate in the R&D activity. We can express the expected profit of Firm 1 as in the following Lemma 2.13.

where
Proof. Note
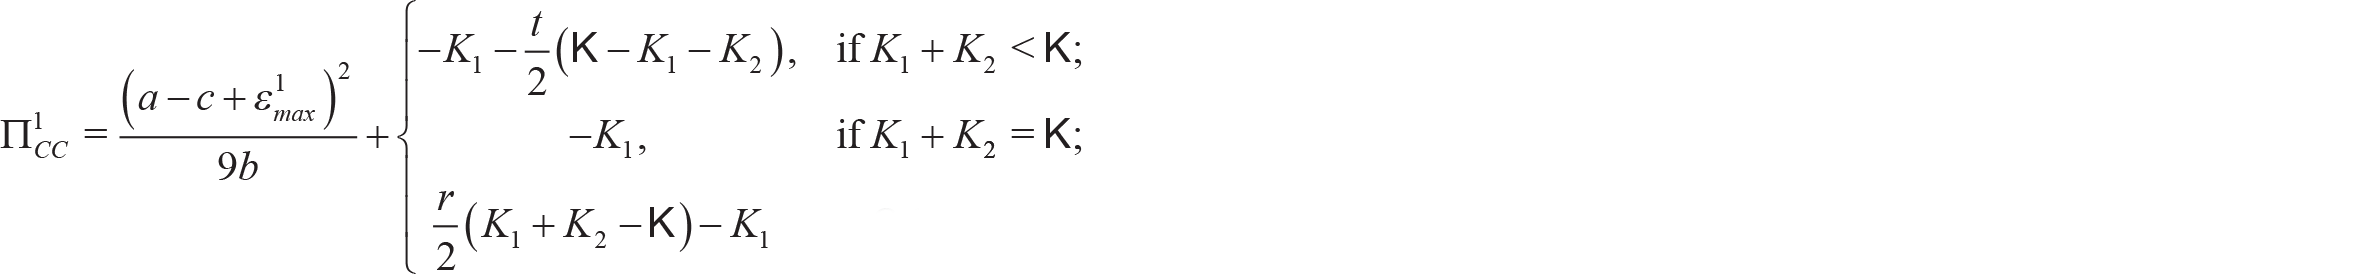
So,
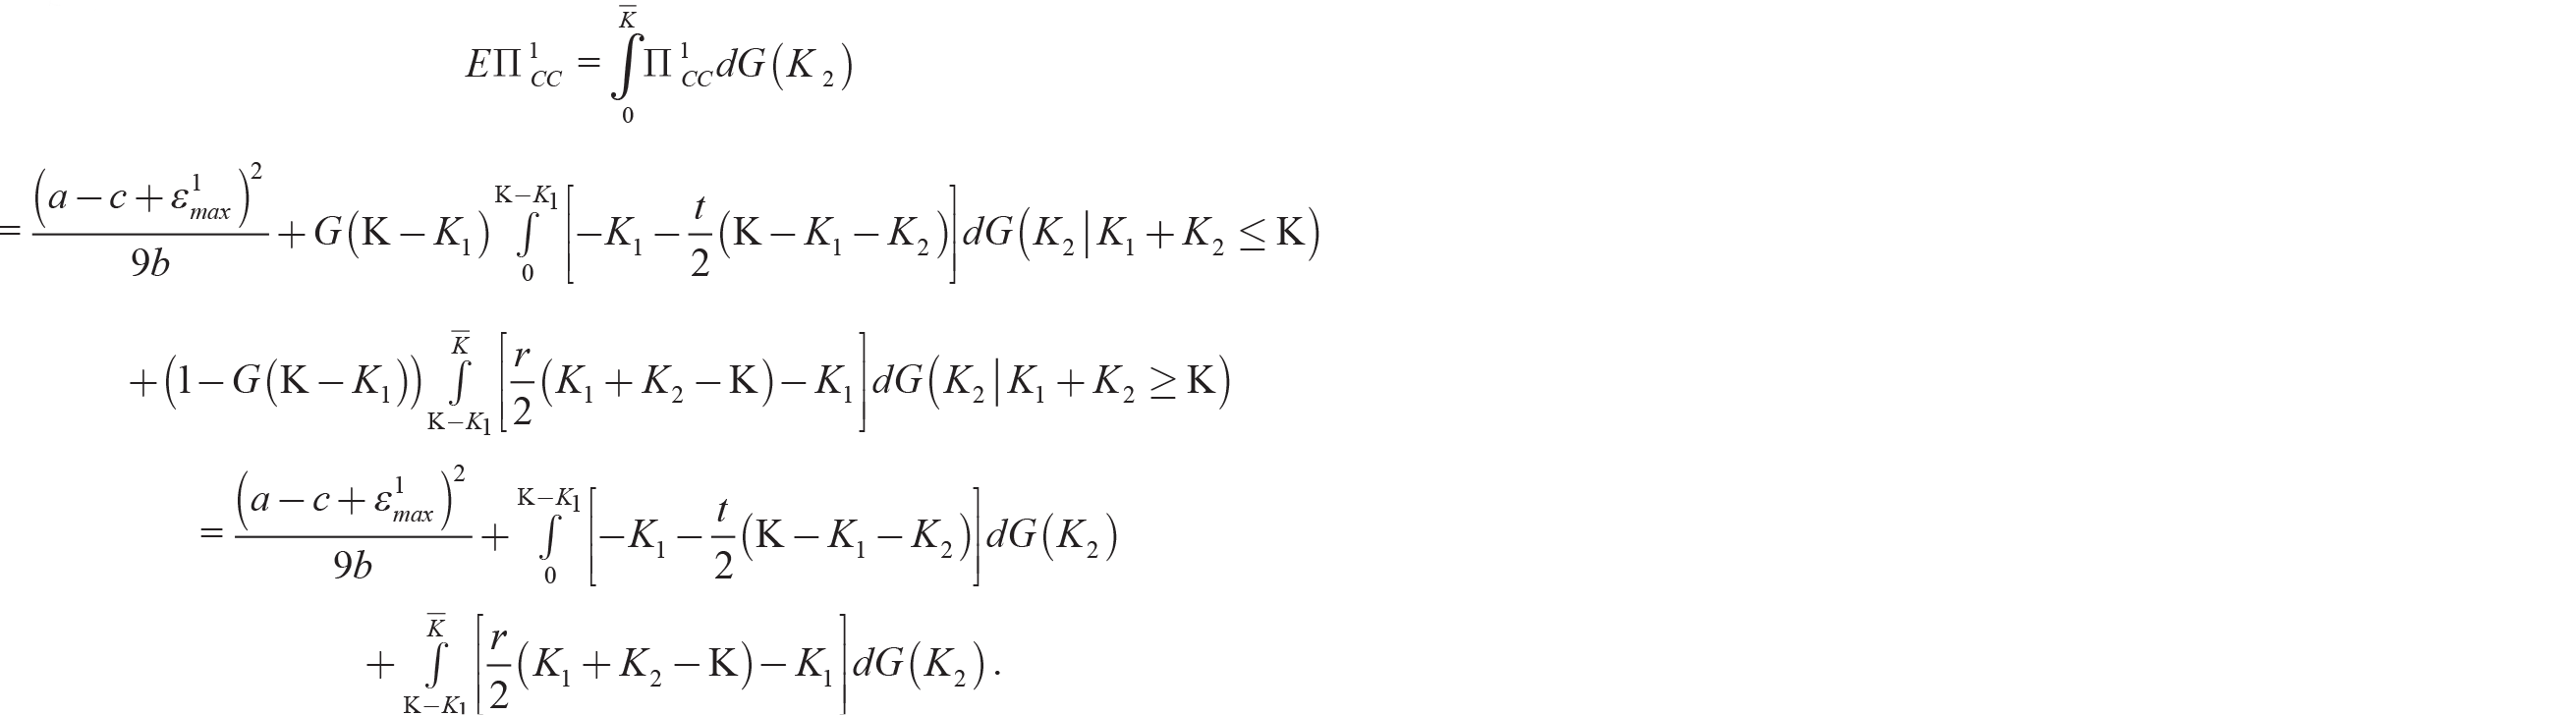
Rest of the proof is trivial.
Here, we again consider Firm 1 only and the strategies of Firm 2 can be deduced routinely in a similar way. Note that the profit of Firm 1 depends on because now the reduction in cost due to conducting of research depends not only on her own type but also on the type of the other firm. We know that

Proof. First note that
Rest of the proof is trivial.
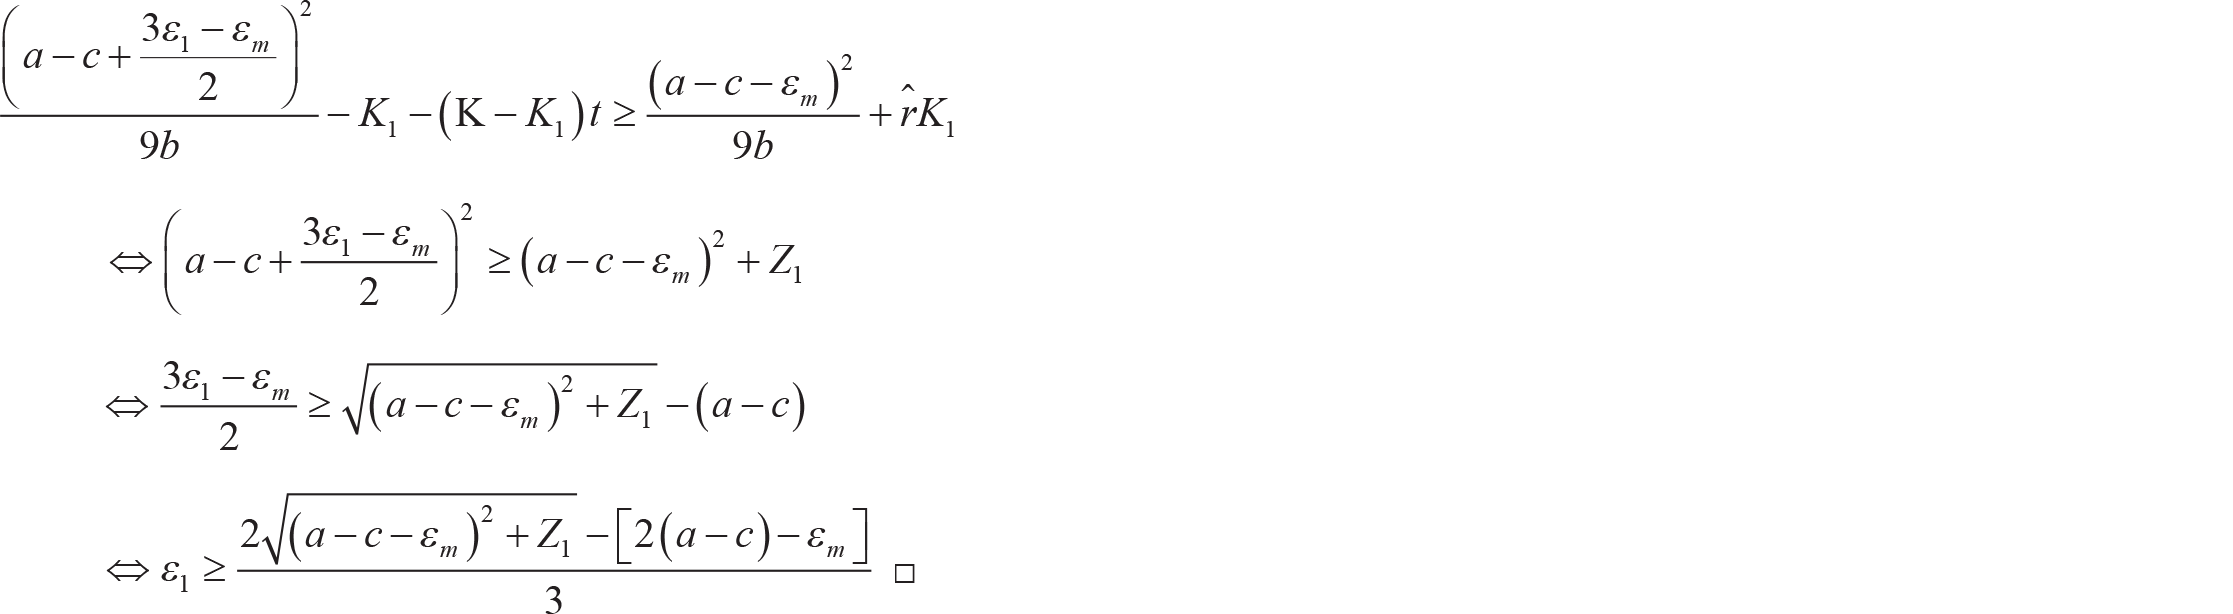
The intuition is that they will perform collaborative R&D only if both of them think that the additional reduction in cost due to collaboration is significant. The next Remark 2.15 compares the profit levels when the firms conduct collaborative R&D as against when they do not perform any R&D at all.

It follows from the fact that
The following Lemma 2.16 ranks expected profit for Firm 1 from collaborative R&D against profit of Firm 1 when only this firm undertakes R&D but Firm 2 does not.

Proof. The proof is similar to the proof of the Lemma 2.14.
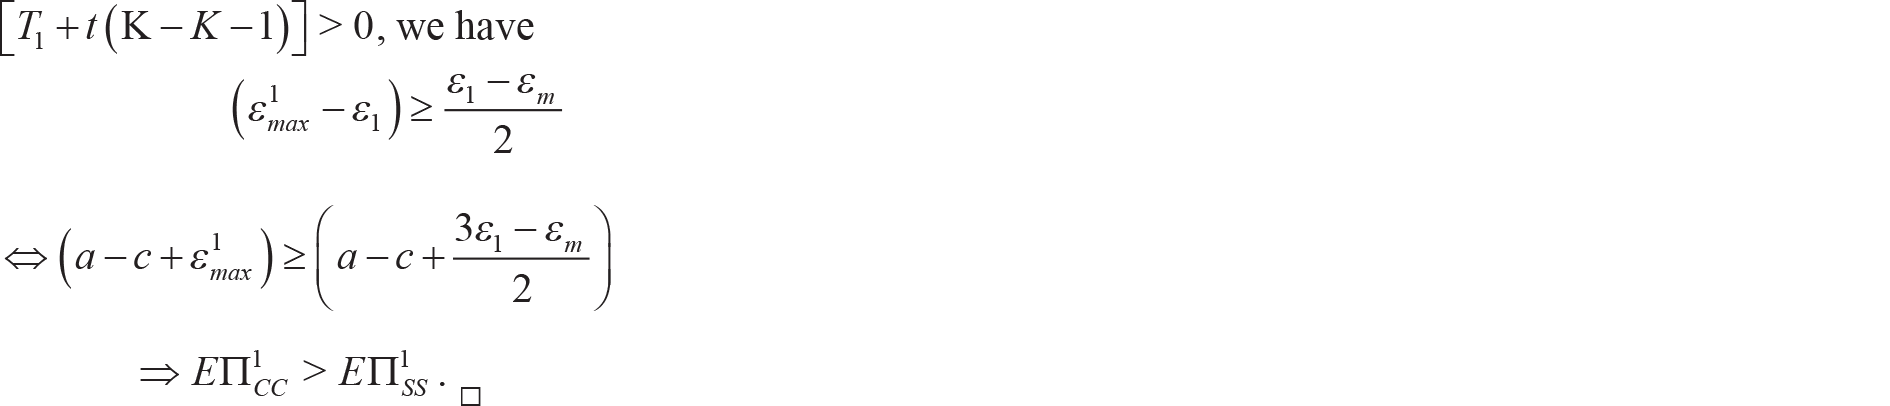
The following Proposition 2.17 establishes the sufficient condition for expected profit from collaborative R&D being higher than that from non-collaborative R&D by both the firms.

Proof. Since
Finally, the following Proposition 2.18 states the sufficient condition for expected profit of Firm 1 from collaborative R&D being higher than that when only Firm 1 undertakes R&D but Firm 2 does not.

Proof. The proof is similar to that of Proposition 2.17.
First, both the firms otherwise interested in conducting research will consider collaborative R&D if Lemma 2.14 holds for both of them. Second, if both the firms otherwise not interested in performing R&D will undertake collaborative R&D if Remark 2.15 holds for both of them. Third, suppose they only want to conduct research if each firm expects its rival not to conduct research, even then rather than doing research alone they will prefer collaborative research if Lemma 2.16 holds for both of them. Finally, in absence of any government intervention, a firm with very high or very low efficency will not go for collaborative research. This particular result marks a departure form Marjit (1991) and Kabiraj and Chattopadhyay (2014). Both these papers suggest that firms engage in collaborative R&D when the probability of success is either very high or very low. We, however, must note that Marjit (1991) deals with complete information framework and two discrete contingencies (e.g., success or failure), whereas Kabiraj and Chattopadhyay (2014) deal with discrete cases of success and failure in R&D in the presence of incomplete information. Our framework involves continuous types and incomplete information. It also entails two separate types about each of which the agents have private information.
Government Policies
Government can try to facilitate cooperative R&D when at least one firm is not conducting R&D or each firm is conducting research single-handedly. In these cases, government can have several possible policies. First, it can provide capital at lower rates of interest as compared to the market rates. Second, it can provide capital and share the profit with the firms. Third, it can provide subsidy for collaborative research. Finally, it can use tax reduction as a policy to encourage collaborative research. We will study the first and the third policies. 5
We did not study tax reduction as a policy because we did not assume that the outputs or the profits of the firms are taxed by the government. Also the analysis of lump sum tax reduction is identical to that of the subsidy, which we study below.
Cheap Capital
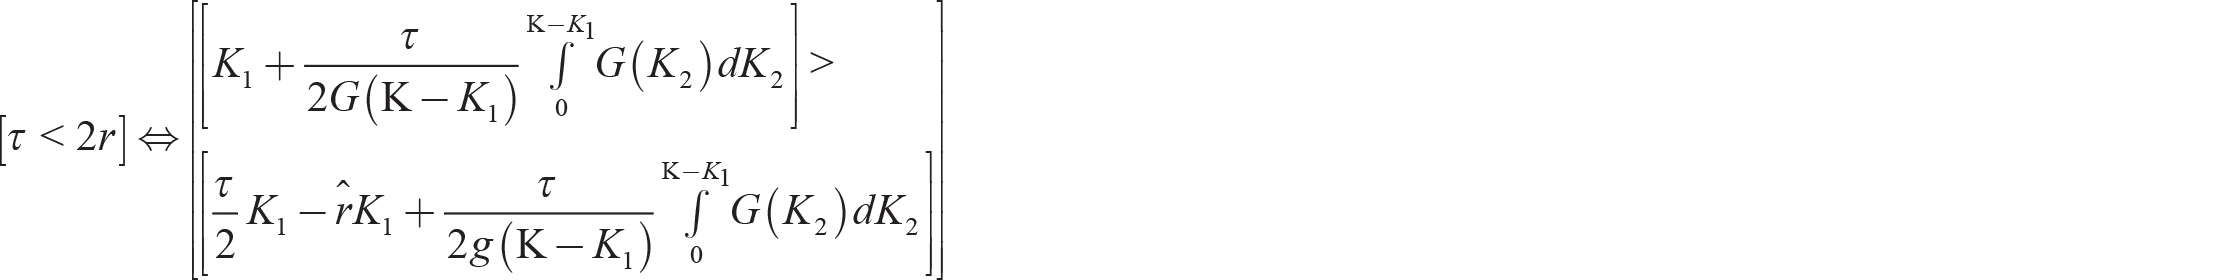
Suppose the government wants to provide capital at lower rates of interest. In this case, as usual, the firms will divide the burden of interest equally. Suppose firms are interested in collaborative research if the government provides them cheap capital. Suppose the government wants to give
Proof. Suppose
Case 1 (
On the other hand, suppose Firm 1 declares that she has zero capital. Then
that is,
Finally,
That is, when
Case 2 (
https://www.sbi.co.in/portal/web/interest-rates/domestic-term-deposits as accessed on 4 February 2015.
https://sbi.co.in/portal/web/interest-rates/loans-against-gold-ornaments-mortgage-of-property as accessed on 4 February 2015.
Subsidy
Now, we study subsidy as a policy for encouraging collaborative research. Assume the government wants to offer S amount of money as subsidy if the firms agree to perform collaborative research. Denote
Case 1 (
Case 2 (
The following Lemma 2.21 gives the expected profit in case of collaboration under subsidy.

Proof. Note that in this case, the expected proof of Firm 1 is given by:
When the amount of cost reduction following R&D single-handedly is higher than a threshold value but not very high, then the firms have incentives to conduct collaborative R&D as opposed to both conducting R&D single-handedly as suggested by the following Remark 2.22.

This holds since

The following Remark 2.24 establishes the necessary and sufficient condition under which the firms always prefer to conduct R&D collaboratively than both not conducting any R&D at all.

This holds since
Comparing Lemma 2.14 and Remark 2.23, we find that since
Conclusion
The benefits of collaborative R&D among firms in industries are widely acknowledged in standard industrial organization literature and the role of governments in encouraging collaborative R&D, thus pushing out the technology frontier, is also supported by theoretical analysis and empirical findings. The governments can resort to various alternative methods of supporting collaborative R&D. This article has made an attempt to compare two alternative policy options in this regard, for example, providing subsidies as opposed to offering funds in the form of loans at cheaper rates of interest. As noted earlier, the results in our model suggest that offering cheap capital by government is not a suitable policy tool since a truthful reporting on the level of capital possessed by firms requires that the government needs to charge an interest rate which is more than twice the deposit rate. But market rates of interest on borrowing are much less than this level. Thus, the government is not left with any scope for providing loans at cheaper rates as compared to the market rates. Thus offering cheaper loans, although a suitable policy option, used in encouraging various industrial activities, for example, used for promoting small-scale industries in India, is not at all an option for encouraging collaborative R&D. On the other hand, provision of subsidy for encouraging R&D appears to be a good policy option as suggested by our results. Subsidy, as noted earlier in the article, is a standard tool for promoting collaborative R&D. All the real-life examples as observed in the cases of Japan, Germany, USA, etc. bear testimony to the success stories of this policy. Provision of subsidy for any project in developing countries where there is scarcity of capital is a widely debated issue. In the presence of capital scarcity in the private sector, subsidy can definitely help growth of the industry. Particularly, promotion of collaborative R&D, given the positive externalizes associated with it, has very important social welfare implications. Also, the range of values of the cost-reduction parameters of the firms for which collaborative R&D occurs under subsidy is wider as compared to the occurrence of any R&D activity, collaborative or non-collaborative. This means to say that subsidy encourages relatively ‘non-efficient’ firms to engage in collaborative research, who otherwise without subsidy will prefer not to invest in R&D. This observation is quite explicit from the results in our model. Thus, subsidy is an appropriate tool for encouraging R&D. We, however, have not studied the impact of tax rebate on a proportional basis as opposed to the standard practice of providing subsidy here, which can be taken up as a further research question in this direction.