
Abstract
This study investigates the total factor productivity (TFP) growth among urban cooperative banks in India during 2014–2020. The measurement of productivity is done using the data envelopment analysis-based Malmquist productivity index. We use two different models, viz., the intermediation approach and the production approach, to see how productivity estimates vary with the change in inputs and outputs. Our results show a large asymmetry in productivity estimates both among banks and over time. TFP estimates were consistently higher under the production approach vis-à-vis the intermediation approach. Further, the empirical results show that productivity gains were mainly determined by technological progress rather than efficiency improvements. Thus, collaborations in technological know-how can be beneficial to productivity growth.
Introduction
Cooperative banks are known to be a valuable instrument for grassroots cooperation that leads to socio-economic development, which is both sustainable and equitable (Nayak, 2012). Cooperative banks not only improve their members’ economic well-being but also serve as a vehicle for enhancing social cohesion in communities plagued by poverty and inequality (Lal, 2018). This is because cooperative banks are owned and operated by the members themselves. The ability of members in a cooperative banking system to work together to solve problems of financial exclusion is made possible by the power of participation. This response to what was viewed as a failure on the part of the conventional banking system to assist vulnerable communities had garnered worldwide prominence. 1 Membership within cooperative banks around the world and total assets are exhibiting a high growth trend, aided by liberalization in some economies (Barra et al., 2013). Studies have highlighted that mergers and acquisitions have become attractive growth methods to support cooperative banks in both transition and developed economies (Coccorese & Ferri, 2020; Hosono et al., 2006). The temptation of banks to reduce operating costs and create competitive advantage has been a primary driver boosting merger activity.
In India’s cooperative banking sector, the organizational structure is quite complicated. Different subsets of the society, defined geographically and by the nature of their credit requirements, are served by distinct subsets of the cooperative banking industry. While urban regions are covered by urban cooperative banks with a unitary structure, rural areas are primarily supported by two sets of institutions that extend both long- and short-term credit. The short-term cooperative financial intermediaries have a multiple structure, with primary agricultural credit societies serving as the primitive level, district central cooperative banks (DCCBs) serving as the middle level and state cooperative banks serving as the apex level. According to the Reserve Bank of India (RBI), cooperative banks provide access to banking services to more than 250 million people across India through the network of 98,545 cooperatives as of March 2020. These cooperatives comprise 1,539 UCBs and 97,006 rural cooperatives. Rural cooperatives make up 65% of the total asset size of all cooperatives taken together, whereas urban cooperatives account for 35% of total assets (RBI, 2021). Despite having a widespread outreach, cooperative banks in India are plagued by a chronic problem of sickness, owing not only to the governance and some operational issues but also to high competitive pressures from commercial and small payment banks. Further, little capital, liquidity issues and insufficient risk management practices are among the major factors that have badly affected the working of these institutions. The recent financial challenges, including episodes of fraud in some cooperative banks such as Punjab and Maharashtra Cooperative (PMC) Bank, have adversely affected cooperative banks’ asset quality and profitability. Also, concerns over the financial soundness of urban cooperative banks (UCBs) have increased in recent years with a large number of UCBs being placed under the supervisory action framework by the RBI. In the aftermath of this crisis, the RBI has set up an umbrella association to ease financing requirements for these banks. Further, a change in the Banking Regulation Act, 1949, has been made to bring cooperative banks under the regulatory framework, a move aimed at strengthening lenders’ oversight, boosting the confidence of depositors and preventing a PMC Bank-like fraud. It is anticipated that the performance of cooperative banks will significantly improve due to these changes.
This study aims to estimate the TFP change of scheduled UCBs 2 in India. In particular, we measure productivity growth using the Malmquist productivity index and then decompose it into technological change, efficiency change and scale change components. Our results indicate a large asymmetry in productivity estimates both among banks and over time. The productivity growth was mainly determined by technological progress rather than efficiency improvements. Our study contributes to the existence of knowledge in multiple ways. To our knowledge, this is the first study that measures the TFP among cooperative banks in India. Given their unique ownership and management structure, the productivity of cooperative banks will help us understand to what extent these institutions are responsible for the efficient allocation of funds to their members/clients for financing their requirements. Analysing the performance of cooperative banks becomes more important, given the recent financial challenges these institutions are facing, including episodes of fraud in some cooperative banks like PMC Bank. Second, we use two different models, viz., the intermediation approach and the production approach, to see how TFP scores vary with the change in inputs and outputs. Third, we use a dynamic non-parametric measure, the Malmquist TFP index, as a measure of performance. Using the TFP growth index, we decompose TFP change into technological change, scale change and technical efficiency change components to determine the source of productivity change. Lastly, this study also helps in finding sources of inefficiencies among cooperative banks, which will allow banks and policymakers to formulate effective methods to remain viable in the banking industry and the existing competitive environment.
The remaining parts of the paper are structured as follows. Section 2 offers a summarized review of the research conducted on the literature regarding overall banking productivity and the productivity in general and that of the cooperative banks in particular. Section 3 describes the dataset and methodology. The empirical findings are presented in Section 4, and Section 5 concludes.
Literature Review
Over the last couple of decades, a growing body of literature has emerged measuring the financial performance of banks using both the non-parametric and parametric approaches. Most of these studies have focused only on the financial institutions of advanced countries with much advanced financial systems (Barros et al., 2010; Berger & Humphrey, 1997; Casu & Girardone, 2006; Fukuyama & Matousek, 2017, 2018; Mukherjee et al., 2001). However, recently, similar studies have increased focus on emerging economies too (Banker et al., 2010; Gilbert & Wilson, 1998; Hsiao et al., 2010; Sufian, 2016). Due to different regulatory measures, including various consolidation and financial liberalization initiatives, most of these studies have produced contradictory results.
Studies on banking performance in India concentrate mostly on commercial banks. Some of the highly explored areas covered by these studies include, among others, ownership and bank performance (Mohan & Ray, 2004; Sarkar et al., 1998; Tzeremes, 2015), financial liberalization and bank performance (Ataullah & Le, 2006; Bhattacharyya et al., 1997; Das & Ghosh, 2009; Zhao et al., 2010), income diversification and performance of banks (Gulati & Kumar, 2011; Ray & Das, 2010; Zaman et al., 2022) and convergence among Indian banks (Casu et al., 2013; Kumar & Gulati, 2009; Zaman & Valiyattoor, 2022; Mallick et al., 2020; Zaman & Bhandari, 2020). The contrary findings in most of these studies ascribe to differences in input–output combinations, methodology used, different sample periods and differences in functional form.
Although a majority of the empirical studies on efficiency and productivity analysis are concentrated to the commercial banking industry, a few cross-country studies have examined the performance cooperative banks in European countries (Barros et al., 2010; Doumpos & Zopounidis, 2013; Kontolaimou & Tsekouras, 2010; Molyneux &Williams, 2005). Apart from cross-country studies, there are also few single-country performance studies on cooperative banks: for instance, Lang and Welzel (1996) for Germany, Pasiouras and Sifodaskalakis (2010) for Greek, Glass et al. (2012) for Japan and Fiordelisi and Mare (2013) for Italy. These studies have found mixed results as far as the performance of cooperative banks is concerned.
In contrast to the developed economies, there is a scarcity of studies on the efficiency of cooperative banks in India. Gaurav and Krishnan (2017) examined the efficiency of DCCBs and recommended that the performance of such institutions could be improved by using better risk management practices. In another study on UCBs, Ghosh and Ansari (2018) investigated the relationship between board characteristics and bank performance and found that board size does not affect the performance of cooperative banks in India. Again, evaluating the efficiency of UCBs in India, Raju (2018) found relatively higher technical efficiency in terms of traditional banking activities compared to non-traditional activities. Zaman et al. (2022) analysed the performance of rural cooperative banks and found a continuous deterioration in the technical efficiency among rural cooperative banks in India. Recently, Zaman and Khan (2023) analysed the productivity growth of cooperative banks in Jammu and Kashmir and found that productivity gains were higher in the income approach than in the intermediation approach. This study supplements the scanty literature on the performance of cooperative banking by examining the TFP of UCBs in India during 2014–2020. In addition, we decompose TFP into three components, namely, pure efficiency change (PECH), technological change (TCH) and the scale change factor (SCH) following the Malmquist productivity index.
Research Design
Data and Specification of Outputs and Inputs
Our sample consists of balanced panel data for 46 UCBs that were operating in India between the years 2014 and 2020. 3 There are currently 54 scheduled UCBs in India; however, due to inconsistencies and discrepancies in data, we removed the remaining banks from our sample. The individual bank-wise data for inputs and outputs were obtained from the RBI.
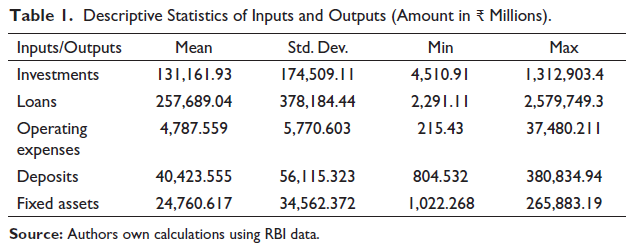
Determining the inputs and outputs in banking is a long-standing debate in empirical banking analysis. In particular, there has been a dispute about whether deposits should be treated as output or input. Bank deposits, for instance, should be considered an output if we perceive banks as providing financial services to their consumers or clients or may be considered as input as their proceeds are used by banks while giving loans to borrowers (Berger & Humphrey, 1997). However, in literature two approaches are dominating in the banking performance literature while selecting inputs and outputs, viz., the intermediation approach and the production approach. This depends on whether banks should be considered as an intermediating agency to channelize funds from savers to borrowers or service-providing bodies to its clients. 4 As banks perform multiple functions simultaneously and to examine the robustness of our TFP scores, the present study uses both intermediation and production approaches. Loans and investments are considered outputs, while deposits and operational expenses constitute inputs in the intermediation approach. To analyse how productivity estimates vary with the changing inputs and output variables, we used the fixed assets and operating expenses as inputs, whereas deposits were considered as output in the production approach. Our selection of variables is well supported in the literature (e.g., Ataullah & Le, 2006; Casu et al., 2013; Das & Ghosh, 2006; Degl’Innocenti et al., 2018; Gaurav & Krishnan, 2017). The summary statistics of variables used in the study are given in Table 1.
Descriptive Statistics of Inputs and Outputs (Amount in ₹ Millions).
Descriptive Statistics of Inputs and Outputs (Amount in ₹ Millions).
Source: Authors own calculations using RBI data.
A majority of the studies on the efficiency and productivity of banks use two methodologies, viz., parametric measures and non-parametric measures. Among parametric measures, stochastic frontier analysis (SFA) has become very popular, while data envelopment analysis (DEA) is widely used among non-parametric measures. We use the Malmquist productivity index-based DEA to measure productivity growth among UCBs in India. From the methodological perspective, we use DEA because of two reasons. First, unlike SFA, the DEA practitioner does not need to specify the functional form of the production technology and at the same time need not assume about the distribution of inefficiency. Second, as compared to other performance techniques, DEA works well with small sizes (Zhao et al., 2008). This is very important in the context of banking datasets where the number of decision-making units (DMUs) is usually small.
5
DEA is a mathematical programming based on a non-parametric approach introduced by Charnes et al. (1978), hereafter the CCR model. The CCR model is based on the assumptions of constant to returns to scale (CRS), free disposability of inputs and outputs and convexity of technology set. The CCR model was further extended to variable returns to scale (VRS) by Banker et al. (1984), hereafter the BCC model. In DEA, a frontier technology is constructed from observed input–output bundles of the DMUs in the sample without mentioning any functional form of the technology. The potential level of performance is given by the frontier, which is formed by connecting the best practice DMUs within the sample. We use an input-oriented efficiency model in our analysis, which aims to reduce the input quantity without compromising the target output. Many practitioners advocate an input-oriented model as bank managers have more control over inputs (operating expenses) compared to outputs (loans) (Casu et al., 2013; Kevork et al., 2018). Further, we employ the BCC model in this study, as various factors such as imperfect competition, managerial breakdown and some regulatory restrictions may not allow a bank to operate on CRS, i.e., the minimum point of the long-run average cost curve. The technical efficiency (input oriented) of the 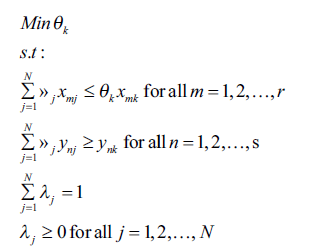
The above equation is solved for each bank. Technical efficiency (input-oriented) of the
The Malmquist TFP index estimates the difference in productivity between two successive periods. For each bank, changes in TFP are calculated independently. The distance from the technology frontier is reciprocal to the input-oriented technical efficiency (input-oriented) obtained in Equation (1). Each bank is identified by the input–output bundles be (xt1, yt1) and (xt2, yt2), superscript indicating two periods t1 and t2.
Assuming CRS, Färe et al. (1992, hereafter FGLR) decompose the MPI as the product of two economically meaningful components, namely, efficiency change and technological change components,
6
as follows:
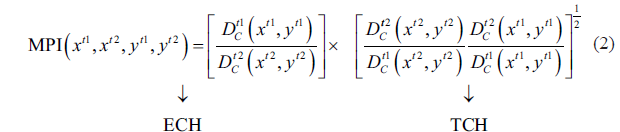
The efficiency change (ECH) component measures the change in the technical efficiency of a bank relative to the best practice bank and, therefore, shows whether the particular bank moves towards or away from the frontier over the period from t1 to t2. The technological change (TCH) estimates the variation of the technology frontier between two periods, and accordingly represents the improvement or deterioration in banks technology from t1 to t2.
With an effort to include VRS technology, Färe et al. (1994, hereafter FGNZ) decompose the efficiency change component of FGLR further into two components: pure efficiency change (PECH), which segregates the catching-up process of banks against the VRS frontier, and scale change (SCH), which captures the movements towards or away from the CRS frontier, i.e. (ECH = PECH 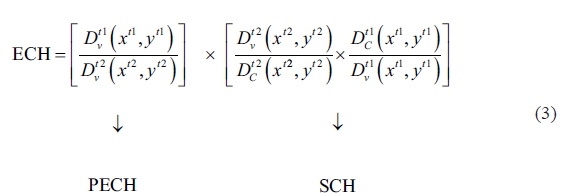
MPI >1 (<1) indicates an improvement (deterioration) in TFP growth from the t1 to t2 period. Likewise, all other individual components may take the value >1, <1 or = 1, indicating the improvement, deterioration or stagnation of the component in question.
Table 2 summarizes the findings of average total factor productivity change (TFPCH) as well as its components, namely, efficiency change (ECH) and technical change (TCH), PECH and scale change (SCH), for UCBs in India during 2014–2020. In order to perform all of our analyses, we rely on the DEAP software version 2.1 (Coelli, 1996). 7 All of these measures are computed relative to the previous year, and, therefore, the figures for 2014 are not obtained. Panel A in Table 2 displays the outcomes of Model I (intermediation approach), while Panel B in Table 2 shows the results of Model II (production approach). Our results also suggest a large asymmetry in TFP and its components over the years. Moreover, Models I and II produced different sets of productivity estimates. The TFP change was relatively higher in the production approach (+1.2% per year) compared to the intermediation approach (−0.2% per year). Of late, UCBs have performed consistently better in boosting their deposit base (output variable) and thereby recorded higher TFP growth under the production approach. Further, looking at the sources of productivity change, we found that TFP growth is dominated by technological change components in both models, although in the intermediation approach, the difference between efficiency and technological change is not that significant. Our findings are contrary to the findings of Zaman and Khan (2023) who found that TFP growth amongst cooperative banks in the state of Jammu and Kashmir (India) was driven by the efficiency change component (7.1%) rather than technology change components. Further, the decomposition of the EFCH into its two components indicates that pure technical efficiency that measures performance only due to managerial activity decreased by 0.9%, whereas scale efficiency increased on average by 0.7% in the case of Model I. In the case of Model II, the changes are equal to +1.6% and −7.7% for PTECH and SECH, respectively. The technological growth in both models can be attributed to substantial efforts made by these banks in improving the quality of these services, through computerization of branches, training of employees and investments made in technology upgradation. Our findings are in line with the findings of Mukherjee et al. (2001), Sturm and Williams (2004) and Zhao et al. (2008), that TFP growth is mainly determined by technological progress.
Total Factor Productivity of UCBs in India (Summary of Annual Means).a,b
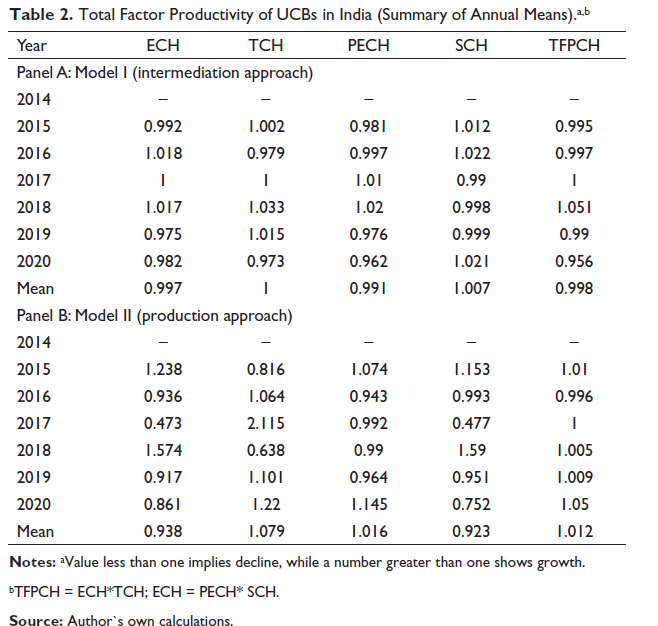
Total Factor Productivity of UCBs in India (Summary of Annual Means).a,b
bTFPCH = ECH*TCH; ECH = PECH* SCH.
Table 3 provides the average individual bank-level TFP estimates of UCBs in India. A closer look at the table indicates an average annual TFP growth of 1.2% in Model II (production approach) whereas an annual TFP deterioration of 0.2% in Model I (intermediation approach). Further, our results indicate that 36.96% of banks experienced productivity growth (TFP > 1), whereas 56.52% of banks experienced productivity deterioration (TFP < 1) in the intermediation approach. Amanath Cooperative Bank Bangalore, Mehsana Urban Cooperative Bank and Rupee Cooperative Bank were the top-performing banks, whereas Janalaxmi Cooperative Bank Nashik, PMC Bank and Shikshak Sahakari Bank Nagpur were the worst-performing banks. However, in the production approach, the percentage of banks with productivity growth increased significantly to 58.70%, and the share of banks that experienced productivity deterioration decreased to 39.13%. Likewise, the top-performing banks here include Abhyudaya Cooperative Bank Mumbai, Amanath Cooperative Bank Bangalore and Cosmos Cooperative Bank, whereas some of the least-performing banks include Gopinath PPJ Sahakari Bank, Nutan Nagarik Sahakari Bank and Rupee Cooperative Bank. Again, the decomposition of our productivity change into various components reveals that productivity growth in UCBs in India was determined by technological progress instead of efficiency improvement. Our results support the findings of some Indian studies such as Gaurav and Krishnan (2017), Ghosh and Ansari (2018) and Raju (2018), supporting the need for innovative approaches and overcoming regulatory challenges and political impediments to enhance the performance of cooperative banks in India.
Bank-wise TFP Change Among UCBs in India.
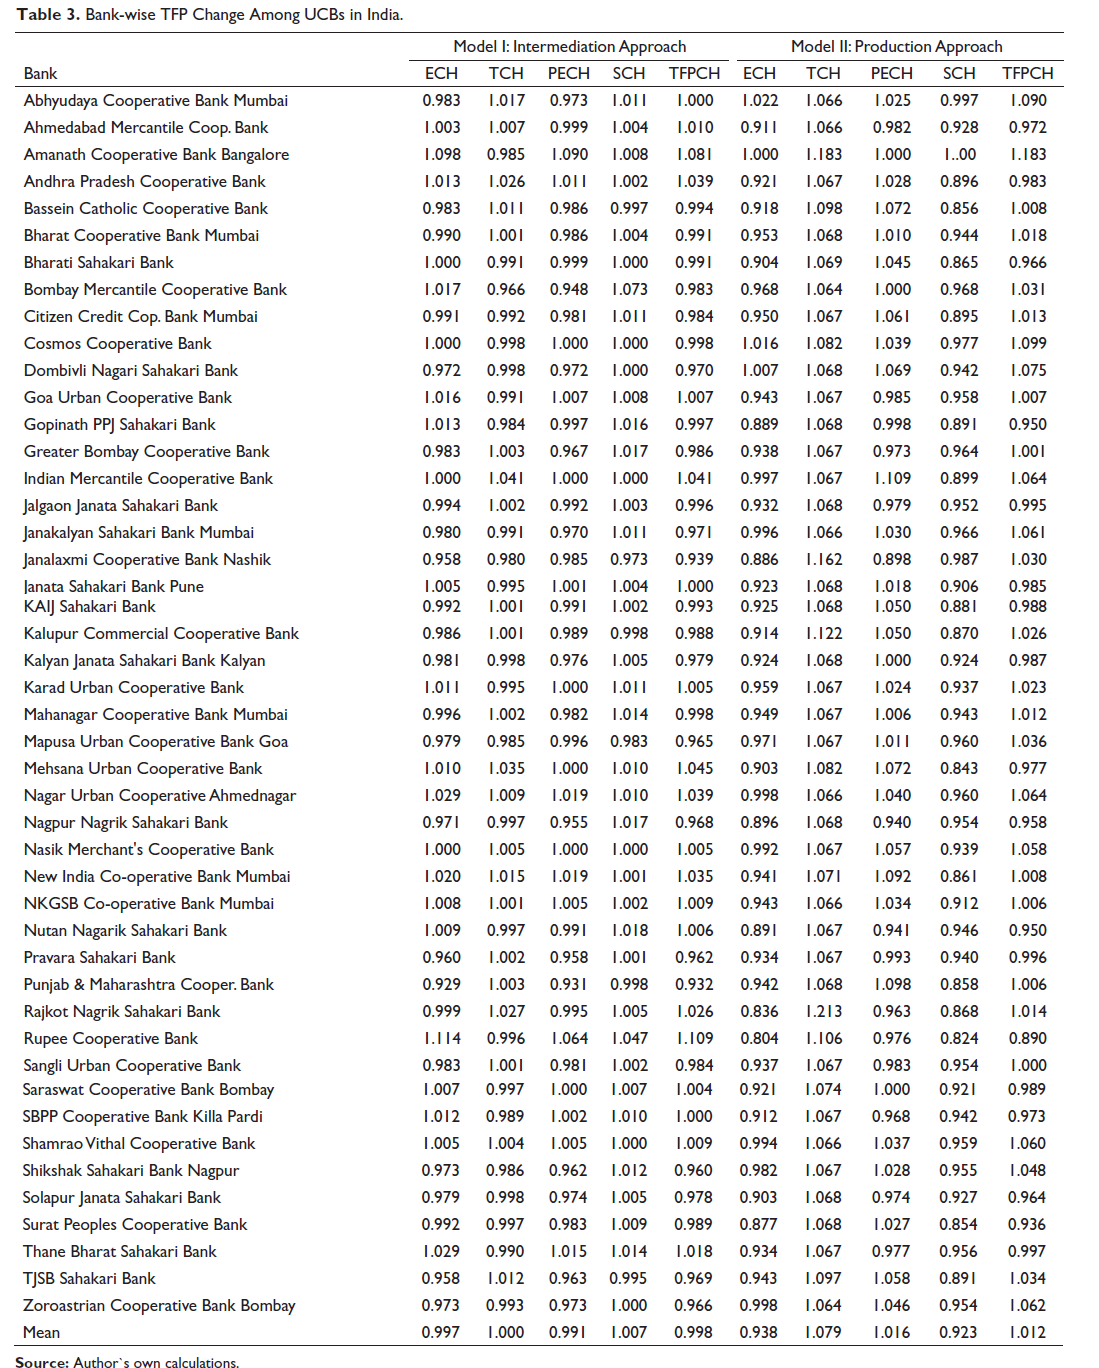
Source: Author`s own calculations.
In India, cooperative banks are crucial for expanding financial inclusion and providing loans to the unbanked populace. Because of their extensive presence in rural, suburban and urban regions, cooperative banks offer low-interest institutional loans and other banking services to economically disadvantaged people. However, the development of cooperative banks has yet to catch up to the overall banking sector’s growth. Unfortunately, difficulties in cooperative banking still exist, indicating the need for the development of such institutions. This paper investigates the productivity changes in the urban cooperative banks in India from 2014 to 2020. The TFP change was disintegrated into efficiency change, technical change and scale change components using DEA-based Malmquist index. Further, we use two alternative approaches for selecting our input and output variables, viz., intermediation approach and income approach, to see how TFP estimates vary when we vary inputs and outputs.
Our results show a significant variation in average TFP estimates among cooperative banks in India over the years. Further, in comparison to the intermediation approach, average TFP scores were found to be higher when the production approach was used for the selection of inputs and outputs. The average TFP estimate in the case of the production approach was +1.2% per year, compared to the intermediation approach −0.2% per year. We contend that the decline in productivity is most likely attributable to the persistent problems that cooperative banks in India face, such as a high proportion of non-performing loans, poor restructuring, discrepancies, an inadequate capital base, limited capability to prevent fraudulent practices and management impediments. Further, the productivity achievements if any were driven mainly by technological change rather than efficiency change components. Thus, collaborations in technological know-how can be beneficial to productivity growth. Technological progress not only can result in the reduction of operational costs in the long run but also facilitates efficient transactions among its customers. Therefore, policymakers and regulators should provide incentives or relax some policies relating to technological innovations. Further, resolving the political and regulatory challenges that have plagued these institutions would enable these banks to improve their performance. This study would help regulators and policymakers to devise the appropriate tools that can spot the inefficiencies and help to shape the cooperative banking structure that will be better equipped to compete in the current economic system. Our investigation of UCBs’ productivity, however, sets the door for future research to examine the impact of monetary policy and bank management on the key elements of productivity change, providing a more detailed view of the factors that drive productivity changes across India.
Footnotes
Acknowledgement
The authors are thankful to the editor and two anonymous reviewers for their constructive suggestions and comments.
Declaration of Conflicting Interests
The authors declared no potential conflicts of interest with respect to the research, authorship and/or publication of this article.
Funding
The authors received no financial support for the research, authorship and/or publication of this article.