
Abstract
Many managers and employees work in multinational organizations, but know little about what constitutes good or bad listening skills from a cross-cultural perspective. Little literature exists concerning the listening behaviors of managers and nonmanagers or the impact of national culture on listening skills. No clear understanding of what constitutes effective and ineffective listening across various cultures and organizational positions is known. Therefore, this study examines the listening skills of both managers and nonmanagers from India, the United States, and Malaysia. A total of 513 managers and nonmanagers from these countries completed a survey measuring self-perceptions of their engagement in four listening behaviors: distracted listening, empathetic listening, judgment rushing, and conclusion jumping. An analysis of variance procedure, with a 2 × 3 factorial design, was used to ascertain whether differences existed when each of the four derived factors was used one at a time as a dependent variable. The two independent variables were managers/nonmanagers and country of residence. The means differed on the main effects of managers/nonmanagers (p < .001) and country of residence (p < .001) and interaction between managers and nonmanagers across the United States, India, and Malaysia (p < .001) on all four factors. Therefore, perceptions of engaging in distracted listening, empathetic listening, judgment rushing, and conclusion jumping are different for managers and nonmanagers living in the United States, India, and Malaysia. This study’s findings will help both managers and nonmanagers from these countries understand the positives and negatives of these four listening practices and the influence of national culture on listening behaviors.
Listening is particularly crucial to relationships within the organization. “Managerial listening . . . [For example,] . . . can promote open communication and result in stronger perceptions of supportiveness, trustworthiness, motivation, increased employee production, and lower absenteeism” (Flynn, Valikoski, & Grau, 2008, p. 144). Therefore, not only listening for what is being told but also paying attention to what someone says will affect the work environment.
For over 50 years, listening has been rated as a highly desirable workplace skill for both managers and nonmanagers (Cooper, 1997; Coopman, 2001, Husband, Cooper, & Monsour, 1988; Nichols & Stevens, 1957; Rogers & Roethlisberger, 1952; Sypher, 1984). Writers and researchers confirm the importance of listening as a key management skill (Abrashoff, 2001; Drucker, 2004; Frey, 1993; Levinson, 1996; Nadler, 2005; Reichheld, 2001; Tagiuri, 1995; Tannen, 1995; Wriston, 1990). Other research has shown that listening has helped coworkers by providing them with recognition and making them feel that they were valued members of the organization (Senecal & Burke, 1992). Listening has also been found to play a pivotal position in perceptions of communication competence in coworkers (Hass & Arnold, 1995).
In her study of 88 managers and 407 nonmanagers, Roebuck (2012) found that listening was the most common form of communication used by those managers and nonmanagers. In a 5-year longitudinal study, which involved 252 target managers, listening was found to play a critical role between managers and employees (Walker & Smither, 1999).
Researchers found that the role of effective listening and its association with leadership emergence in a small group situation was positively related, which suggests that emergent leaders may possess good listening (GL) skills (Johnson & Belcher, 1998). Goman (1991) noted that optimal leader communication activities involve effective listening skills and understanding one’s own communication style. Robbins and Hunsaker (1996) included listening ability and self-awareness among their primary training goals for leader competence.
Walters (2005) studied the impact of listening on organizational cultures. The author noted organizations that emphasized the importance of listening had nonmanagers more likely to align their actions with organizational goals.
Although verbal communication comprises a large portion of managers’ and nonmanagers’ workdays, listening is considered a more important activity. In a study of “managerial effectiveness,” short-term listening skill was demonstrated to be the best discriminator between good and poor branch managers in banks (Alexander, Penley, & Jernigan, 1992). Another study noted that short-term listening was the best single predictor of upward mobility in the organization and concluded, “Listening is related to other communication abilities and to success at work. Better listeners held higher level positions and were promoted more often than those with less developed listening abilities” (Sypher, Bostrom, & Seilbert, 1989, p. 301). In fact, listening has been found to be an important skill regardless of whether those individuals were managers or nonmanagers (Goby & Lewis, 2000; Hass & Arnold, 1995; Helms & Haynes, 1992; Maes, Weldy, & Icenogle, 1997). Furthermore, listening skills are considered important for entry-level jobs (Maes et al., 1997).
Listening has been found to be the critical linkage necessary for managers and nonmanagers to translate information into action plans (Helms & Haynes, 1992). In a research with business students, the result showed that managers ranked listening and following instructions as the top two skills that contribute to managerial success (Maes et al., 1997). Listening more than any other form of communication plays a central role in how coworkers assess one another’s communication effectiveness. Listening accounts for approximately one third of the characteristics that coworkers perceived as being necessary to be a competent communicator (Hass & Arnold, 1995). On average, managers spend 50% of their communication time in listening (Rane, 2011).
A growing body of literature suggests that the “softer” aspects of socioemotional competence, such as empathy and listening skills, play a central role in cognitive processes and behaviors needed for management and leadership (George, 2000; Leung, 2005; Mandell & Pherrani, 2003; Salovey & Mayer, 1990; Sosik & Megerian, 1999). Listening, managing conflict, and leading teams are examples of skills that general managers perceive to be the most essential requirements for individuals desiring to move into the managerial leadership ranks (Brownell, 2003). Moreover, Alexander et al. (1992) found a relationship between listening, interpreting nonverbal messages, and managerial performance. These studies highlight the importance of listening and support the idea that both managers and nonmanagers need effective listening skills to succeed in the workplace.
As more and more organizations expand internationally, managers and nonmanagers may find that listening plays an even more important role in their intercultural interactions. Therefore, individuals may need to understand national culture, as many researchers have found it, influences listening behaviors (Brownell, 2006; Hall, 1976; Purdy, 2000; Wolvin & Coakley, 1996; Zohoori, 2013).
Listening and National Culture
House, Brodbeck, and Chhokar (2007) defined national culture as societal and organizational norms, values, and beliefs of the people being led. Clearly, culture influences communication as it constitutes a frame in which utterances are conveyed and interpreted. Liddicoat (2009) stated that the culturally contexted nature of communication imposes a problem of intertranslatability for actual instances of communication across languages and cultures and necessitates a level of particularity for each actual instance of communication.
Mujtaba and Pohlman (2010) have gone so far as to say that working professionals tend to behave according to how they were socialized within their national cultures. This is called the global culture approach and assumes that individuals conform fully to the culture and practice of their own group (Zaidman, 2001). The global culture approach provides an understanding of broad differences in communication among cultures. Adler (1986) argued that national culture has a greater impact on employees than the culture of their organizations and may also affect listening behaviors.
Further validating the impact of national culture on listening behaviors, the GLOBE’s (Global Leadership and Organizational Behavior Effectiveness) study found that leader effectiveness is contextual (House et al., 2007). To gauge leader effectiveness across cultures, GLOBE empirically established nine cultural dimensions that make it possible to capture the similarities and/or differences in norms, values, beliefs, and practices across countries. They build on the findings of Hofstede (1980), Schwartz (1994), Smith and Peterson (1995), and Inglehart (1997). The nine cultural dimensions include the following:
Power distance: The degree to which members of a collective expect power to be distributed equally.
Uncertainty avoidance: The extent to which a society, organization, or group relies on social norms, rules, and procedures to alleviate unpredictability of future events.
Humane orientation: The degree to which a collective encourages and rewards individuals for being fair, altruistic, generous, caring, and kind to others.
Collectivism I: (Institutional) The degree to which organizational and societal institutional practices encourage and reward collective distribution of resources and collective action.
Collectivism II: (In-group) The degree to which individuals express pride, loyalty, and cohesiveness in their organizations or families.
Assertiveness: The degree to which individuals are assertive, confrontational, and aggressive in their relationships with others.
Gender egalitarianism: The degree to which a collective minimizes gender inequality.
Future orientation: The extent to which individuals engage in future-oriented behaviors such as delaying gratification, planning, and investing in the future.
Performance orientation: The degree to which a collective encourages and rewards group members for performance improvement and excellence. (Hoppe, 2007)
For India and Malaysia, collectivism, humane orientation, and power distance are relatively high (Gupta, Surie, Javidan, & Chhokar, 2002). The family is patriarchal and so are their management or leadership styles. Because of status differences, Indians generally do not use group orientations and therefore most senior managers make all decisions. Within the family setting, elders are revered and taken care of by their children (Chaney & Martin, 2011). In business, building relationships is important. An introduction is necessary and titles convey respect. A listener who is considered less powerful will respect the speaker who is more powerful by listening attentively. These behaviors illustrate the high-power distance dimension of these two countries’ national cultures.
Gender differentiation and assertiveness is high since India and Malaysia are male-dominated societies. Within India and Malaysia, fewer women play roles in decision making and occupations have more sex segregation. In general, women have a lower level of education on average from men (Emrich, Denmark, & Den Hartog, 2004). Indians tend to value tough, dominant, and assertive behaviors (Den Hartog, 2004). However, with Malaysia being a high-context culture, Malaysians prefer indirect, nonassertive communication.
Both of these Asian countries appear to have a high tolerance for uncertainty, thus have low values of uncertainty avoidance. However, they do have a high-future orientation. Together, high tolerance for uncertainty and high-future orientation favor a general long-term or “hereafter” approach.
Performance orientation is more moderate and may be influenced by the teachings of what has been called “the most famous ethical text of ancient India, the Bhagvad Gita” The essence of the teachings is summed up in the maxim “that your business is with the deed and not the result.”
Because the major purpose of the House et al.’s (2007) study was to gauge leadership effectiveness across cultures, the researchers took 21 leadership scales and statistically and conceptually reduced them to six leadership styles. The first two leadership styles listed below, charismatic/value-based and team-oriented style, contributed to outstanding leadership across all cultures. However, for the other four styles, cultural variation was noted. In some cultures, these styles were seen as good and effective, while in some other cultures, they were viewed as a hindrance for outstanding leadership. The six styles are given below in the order of least cultural variation to most cultural variation (Den Hartog, House, Hanges, Ruiz-Quintanilla, & Dorfman, 1999). The average value for each of the three countries that participated in this study is listed below each description. As can be noted below, the United States had the highest averages for the charismatic/value-based style, team-oriented style, and participative style. Malaysia had the highest average for the autonomous style, and India had the highest average for self- or group-protective style and the humane style.
1. The charismatic/value-based style (4.5-6.5) stresses high standards, decisiveness, and innovation; seeks to inspire people around a vision; creates a passion among them to perform; and does so by firmly holding on to core values. This includes the facets of visionary, inspirational, self-sacrificial, integrity, decisive, and performance oriented.
United States 6.12, Malaysia 5.89, India 5.85
2. The team-oriented style (4.7-6.2) instills pride, loyalty, and collaboration among organizational members and highly values team cohesiveness and a common purpose or goals. This style includes the facets of collaborative team orientation, team integrator, diplomatic, (reverse scored) malevolent, and administratively competent.
United States 5.80, Malaysia 5.80, India 5.72
3. The participative style (4.5-6.1) encourages input from others in decision making and implementation and emphasizes delegation and equality. This style includes the facets of (reverse scored) autocratic and (reverse scored) nonparticipative.
United States 5.93, Malaysia 5.12, India 4.99
4. The humane style (3.8-5.6) stresses compassion and generosity; and it is patient, supportive, and concerned with the well-being of others. This style includes the facets of modesty and humane oriented.
United States 5.21, Malaysia 5.24, India 5.26
5. The self-protective (2.5-4.6) style emphasizes procedural, status-conscious, and “face-saving” behaviors and focuses on the safety and security of the individual and the group. This style includes the facets of self-centered, status conscious, conflict inducer, face saver, and procedural.
United States 3.16, Malaysia 3.50, India 3.78
6. The autonomous style (2.3-4.7) includes only one facet concerned with autonomy. It is characterized by an independent, individualistic, and self-centric approach to leadership (Den Hartog et al., 1999)
United States 3.75, Malaysia 4.03, India 3.85
Leadership characteristics such as ambitious, enthusiastic, formal, logical, or risk taker are valued very differently around the world. For example, on GLOBE’s 7-point scale that measures a society’s view of these leader traits, the culture means for “risk taker” ranged from 2 to 6. This demonstrates the extent to which countries tolerate uncertainty, as measured by GLOBE’s uncertainty avoidance dimension and shows how cultural values and people’s ideas of good leadership are an integrated system.
Some leader characteristics were universally endorsed across all the societies in the GLOBE study. For example, people want their leaders to be trustworthy, just, honest, and decisive, but how these traits are expressed and shown in the work place may be different from country to country. For example, a U.S. leader is described as decisive and is expected to make quick decisions. In contrast, Indian organizations are divided into two types, which affects how they make decisions and how flexible they may be in their strategies. The first organizational type is referred to as “traditional Indian,” which would be older organizations who have strict hierarchical leadership structures where leaders make the decisions. The second organizational type is called “modern Indian” which has more flexible management practices, which differ from the “traditional Indian” practices (Strohschneider, 2002). Ramanujan (1989) observed, “When Indians learn, quite expertly, modern science, business, or technology, they compartmentalize these interests . . . the new ways of thought and behavior do not replace, but live along with the old religious ways. . . . ” So Indians are bicultural people who may adapt or switch frames as the situation demands.
As stated above, national culture influences listening. Therefore, individuals from different countries may perceive listening behaviors differently, approach listening in different ways, and display specific listening styles (Kiewitz, Weaver, Brosius, & Weimann, 1997; Lewis, 1999).
Rationale for the Study
Much of the relevant academic research in the field is aging, while the importance of the role of listening in the workplace is being increasingly acknowledged (Flynn et al., 2008). Researchers further state that the primary issue currently facing researchers on workplace listening is the lack of empirical research in the area. Little empirical evidence supports the broad assertions or backs up much of the qualitative research in the field. Empirical research into listening as an organizational variable appears to be almost nonexistent in the scholarly business and management literature. Much of the literature on listening in the business context is prescriptive or descriptive in nature and not based on results from inferential statistics.
A majority of the listening research is based on intuitive, largely anecdotal data (Flynn & Bodie, 2007). Ascribing to the linguistic test of affirming a proposition as “I know it when I see it” might be a faulty way of knowing GL from bad listening (BL), or if this dichotomy even exists. It is certainly not a scientific statement. While Brownell (1990) explores how hospitality managers perceived themselves and how they were perceived by their subordinates, that study is now more than 20 years old and only considered one industry. Little literature exists concerning the listening behaviors of managers and nonmanagers.
Brownell (2006) believed that “listeners often look to the context of the situation for additional cues to make sense of what they hear” (p. 48). On this basis, it would seem that managers and nonmanagers of high-context cultures such as Malaysia and India might perceive and process listening differently than do managers and nonmanagers of low-context cultures such as the United States. Hall (1976) stated that members of high-context cultures consider the listener responsible for the effective outcomes of communication due to their sensitivity to nonverbal cues in the communication environment, whereas members of low-context cultures hold the speaker accountable for effective outcomes due to their dependence on verbal cues. Rogers and Farson (1986) stated that listening in a high-context culture requires an active listener who “does not passively absorb the words which are spoken, but [who] actively tries to grasp the facts and feelings in what he hears, to help the speaker work out his own problems”(p. 149).
Learning about the listening behaviors of actual managers and nonmanagers from the countries of India, Malaysia, and the United States could provide an understanding of where managers and nonmanagers excel and where they may need to improve in their listening skills. This study can shed additional light into the influence of national culture on listening behaviors. Finally, this study can provide insight into the listening skills of manager and nonmanagers within the three countries of India, Malaysia, and the United States as no study could be found that compared and contrasted the listening behaviors of these three countries.
Research Questions
Because the literature is scarce concerning listening competencies of managers and nonmanagers who live in India, Malaysia, and the United States, the following two research questions were used to guide this exploratory study.
Methodology
The Listening Self-Inventory by Glenn and Pood (1989) was chosen for this research study as it was designed to help individuals identify barriers influencing their individual listening performance. However, the original version of the Glenn and Pood (1989) inventory restricts survey respondents to yes or no choices. Therefore, the researchers decided to use an edited version located in Robbins’s (1999) Self-Assessment Library, which used a 5-point Likert-type scale of definitely yes, probably yes, maybe, probably not, or definitely not, which provided a wider range of responses. The details on implementing this survey, identifying the participants, and analyzing the data are given below.
Survey and Data Collection
The researchers distributed the survey in their respective countries to working professionals in 13 industries. All survey respondents were asked to: Please answer each question honestly and truthfully as they relate to your listening behavior at work. The survey should take no more than 10 to 15 minutes of your time to complete. Thank you.
The 15 Likert-type scale items measured a respondent’s perception of the magnitude of his or her own engagement in GL behaviors and BL behaviors. Frequency and percentages, as well as a chi-square comparison of gender * country are shown in Table 1 in the appendix. The chi-square showed a significant Pearson (p = .000) on males being more frequent for India, whereas females tended to be more frequent for the U.S. and Malaysian frequencies. All GL and BL items are shown in Table 2 in the appendix, along with the mean and standard deviation for each item.
Sample and Participants
A total of 513 surveys were returned out of which 429 (84%) were useable. Males and females represented 301 and 203 of the responses, respectively, with 9 not responding on what their genders were. The 13 industries were 444 of the responses, with 69 people not responding to the industry item; additional percentages are shown in Table 1. Of these useable surveys, respondents comprised 199 managers and 230 nonmanagers.
Respondents Proficiency in English
The researchers are confident respondents understood the questions. The English-language literacy in Malaysia is similar with India in that English is not the first language. However, it is used in nursery, preschool, primary school, and throughout the educational system. The respondents in Malaysia had no problem in understanding and participating in the survey as they had sufficient knowledge in reading, writing, and understanding English. Malaysian nonmanagers in the business sector are fluent in the English language (Lim, 2001). Using an English-language version follows the preference of other researchers who also used English-language questionnaire instead of other local languages (Bochner, 1994; Furnham & Muhiudeen, 1984; Schumaker & Barraclough, 1989).
As far as Indian respondents are concerned, English-language literacy is the medium of instruction at primary, secondary, and the higher education level. All nonmanagers in India, including those who worked at lower rungs of the hierarchy, can claim to have the basic knowledge of reading, writing, and understanding English.
All countries were thus determined to have no inherent bias as far as language barriers are concerned. A respondent would not lack understanding or misinterpret the question.
Items Reliability
The 15 Likert-type scale items were tested for reliability in SPSS 19.0 using a Cronbach’s (1984) alpha to ascertain whether or not there was unidimensionality in the scale. The scale reliability was .597, standardized .592, which did not exceed the commonly reported Nunnally (1978) criteria of .70 for an acceptable alpha. A lower alpha is often affected by the number of items, vis-à-vis fewer items often result in lower alphas (Cortina, 1993). Although some researchers believe the true reliability minimum for Nunnally’s recommended reliability standard is .80 (Lance, Butts, & Michels, 2006) an alpha of .70 is normally acceptable for exploratory research, and in many cases alphas much lower than .70 have been used in published exploratory research (Devellis, 1991). Cortina (1993) warns against misinterpreting high alphas: The problem with interpretation arises when a large alpha is taken to mean that the test is unidimensional. One solution to such problems with the statistic is to use one of the many factor-analytic techniques currently available to make sure that there are no large departures from unidimensionality. This provides information similar to that provided by the estimate of precision. If this analysis suggests the existence of only one factor, then the alpha can be used to conclude that the set of items is unidimensional. (p. 103)
Factor Analysis
Based on the current literature (Imhof, 2004; Imhof & Janusik, 2006; Worthington & Bodie, 2008), 15 variables represented the listening behaviors of managers and nonmanagers in the workplace: [BL1], [BL3], [BL5], [BL6], [BL9], [BL10], [BL11], [BL14], [GL2], [GL4], [GL7], [GL8], [GL12], [GL13], and [GL15]. Theory suggests that listening variables BL1, BL3, BL5, BL6, BL9, BL10, BL11, and BL14 should represent one factor (bad listening) and variables GL2, GL4, GL7, GL8, GL12, GL13, and GL15 should represent the other factor (good listening).
Responses to the 15 items measuring listening engagement with a Likert-type scale were subjected to an unrotated principal component factor analysis, with a scree plot (in IBM’s SPSS 18.0). The scree plot suggested five factors. An unrotated initial solution also suggested five factors with an eigenvalue of 1 criterion. Those five factors explained 52.444% of variance. To gauge for sampling adequacy, the Kaiser–Meyer–Olkin measure of sampling adequacy test was 0.709 and the Bartlett’s test of sphericity was 735.543 with degrees of freedom at 105, with p = .000. Therefore, the sample size was good. The average communalities were .524, which is below the rule of thumb of .600 for samples smaller than 300, nevertheless, our sample of 429 was much larger than the 300 sample size minimum. See Table 3 in the appendix item–total statistics, and Kaiser–Meyer–Olkin and Bartlett’s test, and communalities.
Nevertheless, a four-factor solution was more parsimonious than a five-factor solution because two of five factors only had one component loading with a cutoff of .40. Four factors, therefore, were found more appropriate in further analysis. A variable was said to load on a factor if it had a component loading of .40 or higher on that factor and less than .40 on any other factors (Devellis, 1991; Hatcher, 1994; Kachigan, 1991). The derived factors were indicative of the listening construct that was being measured. Principal axis factoring with promax rotation was used to extract the four factors, which converged in five iterations, as shown in Table 4 in the appendix.
The components that loaded onto each factor were used to label that factor. There were four names that captured the true nature of the semantics represented by the items that loaded onto each factor. Items BL14, GL2, and GL7 did not survive the rotation and therefore were not considered when naming the factors. Based on interpretation of language contained in the components loadings, the four factors were named. Naming the factors helped explain the factor loadings. For example, the language found in the five components that loaded on Factor 1, combined seemed to represent a “Distracted Listener.” The names captured the meaning of the items loading on each of the factors. Factor 1 was named Distracted Listener because items BL1, BL3, BL6, and BL11 loading on it combined are a semantic approximation of a distracted listener. Hence, Factor 2 was named Empathetic Listener, (GL13, GL15, and GL12). Factor 3 was named Judgment Rusher, (BL10, GL8, and BL9). In addition, Factor 4 was named Conclusion Jumper (GL4 and BL5): Rotation sums of squared loadings were 1.502, 1.276, 1.295, and 1.133, respectively.
In SPSS, the command function for running a factor analysis is called data reduction. This is exactly what factor analysis does, as it is a mathematical technique used to reduce the number of items to fewer items, thus simplifying data analysis and interpretation for researchers. When factors are correlated, sums of squared loadings cannot be added to obtain a total variance. Nevertheless, the items accounted for more than half of the scale variance. In this study, 15 Likert-type scale items were reduced to four factors. In SPSS 19.0, each of the 429 respondents was assigned a regression score, so that the derived factors could be used as dependent variables for means testing. This reduction thus makes analysis of variance (ANOVA) an appropriate test for such hypotheses (ANOVA requires dependent variables to be data at least on an interval or ratio scale).
Hypotheses Testing
Hypotheses were drawn from the review of the listening literature, which highlighted that listening is an important workplace skill for both managers and nonmanagers and is an important variable for further research. The three hypotheses follow:
Factorial ANOVA Results
ANOVA procedure, with a 2 × 3 factorial design, was used to ascertain whether differences existed between managers, nonmanagers, and their home countries of residence on each of the four derived factors, used as a dependent variable one at a time. The two independent variables were managers versus nonmanagers and home countries of residence: India, Malaysia, and United States. Tests were undertaken for main effects and interaction effects. The ANOVA was used to determine if differences existed between managers and nonmanagers (main effect), if differences existed among persons from India, Malaysia, and United States (main effect), and if the magnitude of perceptions between managers and nonmanagers regarding their listening behaviors regardless of their home country differed on any factor (interaction effect).
Hypotheses 1, 2, and 3 were rejected on the derived factor Distracted Listener. Means among professionals from India, Malaysia, and the United States differed on the derived factor Distracted Listener, with F(2, 392), 8.901, p = .000. Managers and nonmanagers differed on the Distracted Listener factor, with F(1, 392), 5.243, p = .023. This is an indication that the magnitude of perceived listening behaviors between managers and nonmanagers is dependent on the country because the two-way interaction was significant with F(2, 392), 7.038, p = .001. A summary of India, Malaysia, and the U.S.* management position on Distracted Listener was F(2, 392). The ANOVA tests and between-subjects effects are shown in Table 5 in the appendix.
On Distracted Listener, means for the United States, India, and Malaysia were .162, −.119, and −.226, respectively. The least significant difference (LSD) pairwise comparison showed a mean difference of −.388 when Malaysia was compared with the United States, with p = .000. The LSD pairwise comparison showed a mean difference of −.281 when India was compared with the United States, with p = .013. These differences indicate the working professionals in the United States perceive they engage in this type of listening significantly more than the working professionals in India and Malaysia, who did not differ. On Distracted Listener, means for managers and nonmanagers are −.163 and .040, respectively. The mean difference was −.203, which indicated nonmanagers perceive they engage in this type of listening significantly less than managers do.
Hypotheses 1, 2, and 3 were rejected on the derived factor Empathetic Listener. Means among professionals from the India, Malaysia, and United States differed on the derived factor Empathetic Listener, with F(2, 392), 18.523, p = .000. Means between managers and nonmanagers differed on the derived factor Empathetic Listener, with F(1, 392), 6.334, p = .012. There was a significant interaction effect: difference in the magnitude of perceived listening behaviors between managers and nonmanagers from Malaysia, India, and the United States existed on the derived factor Empathetic Listener, with F(2, 392), 4.596, p = .011. A summary of the ANOVA tests and between-subjects effects are shown in Table 6 in the appendix.
On Empathetic Listener, means for the United States, India, and Malaysia were −.282, .131, and .235, respectively. The LSD pairwise comparisons showed mean differences of −.413 when the United States was compared with the India, with p = .000. The LSD pairwise comparison showed a mean difference of −.516 when the United States was compared with the Malaysia, with p = .000. These differences indicated the professionals in the United States perceive they engage in this type of listening significantly less often than professionals in India and Malaysia, who did not differ. On Empathetic Listener, means for managers and nonmanagers were −.077 and .133, respectively. The mean difference was −.210, which indicated nonmanagers perceive they engage empathetic listening significantly more than managers do.
Hypotheses 1, 2, and 3 were rejected on the derived factor Judgment Rusher. Means among professionals from India, Malaysia, and the United States differed on the derived factor Judgment Rusher with F(2, 392), 5.938, p = .003. Means between managers and nonmanagers differed on the derived factor Judgment Rusher, with F(1, 392), 10.779, p = .001. There was a significant interaction effect: difference in the magnitude of perceived listening behaviors between managers and nonmanagers from India, Malaysia, and the United States existed on the derived factor Judgment Rusher, with F(2, 392), 14.276, p = .000. A summary of the ANOVA tests and between-subjects effects are shown in Table 7 in the appendix.
On Judgment Rusher, means for the United States, India, and Malaysia were −.177, .151, and .049, respectively. The LSD pairwise comparison showed a mean difference of −.328 when the United States was compared with India, with p = .002. The LSD pairwise comparison showed a mean difference of −.226 when the United States was compared with the Malaysia, with p = .011. These differences indicated the professionals in the United States perceive they engage in this type of listening significantly less often than working professionals in India and Malaysia, who did not differ. On Judgment Rusher, means for managers and nonmanagers were −.128 and .144, respectively. The mean difference was −.272, which indicated nonmanagers perceive they engage in this type of listening significantly more often than managers do.
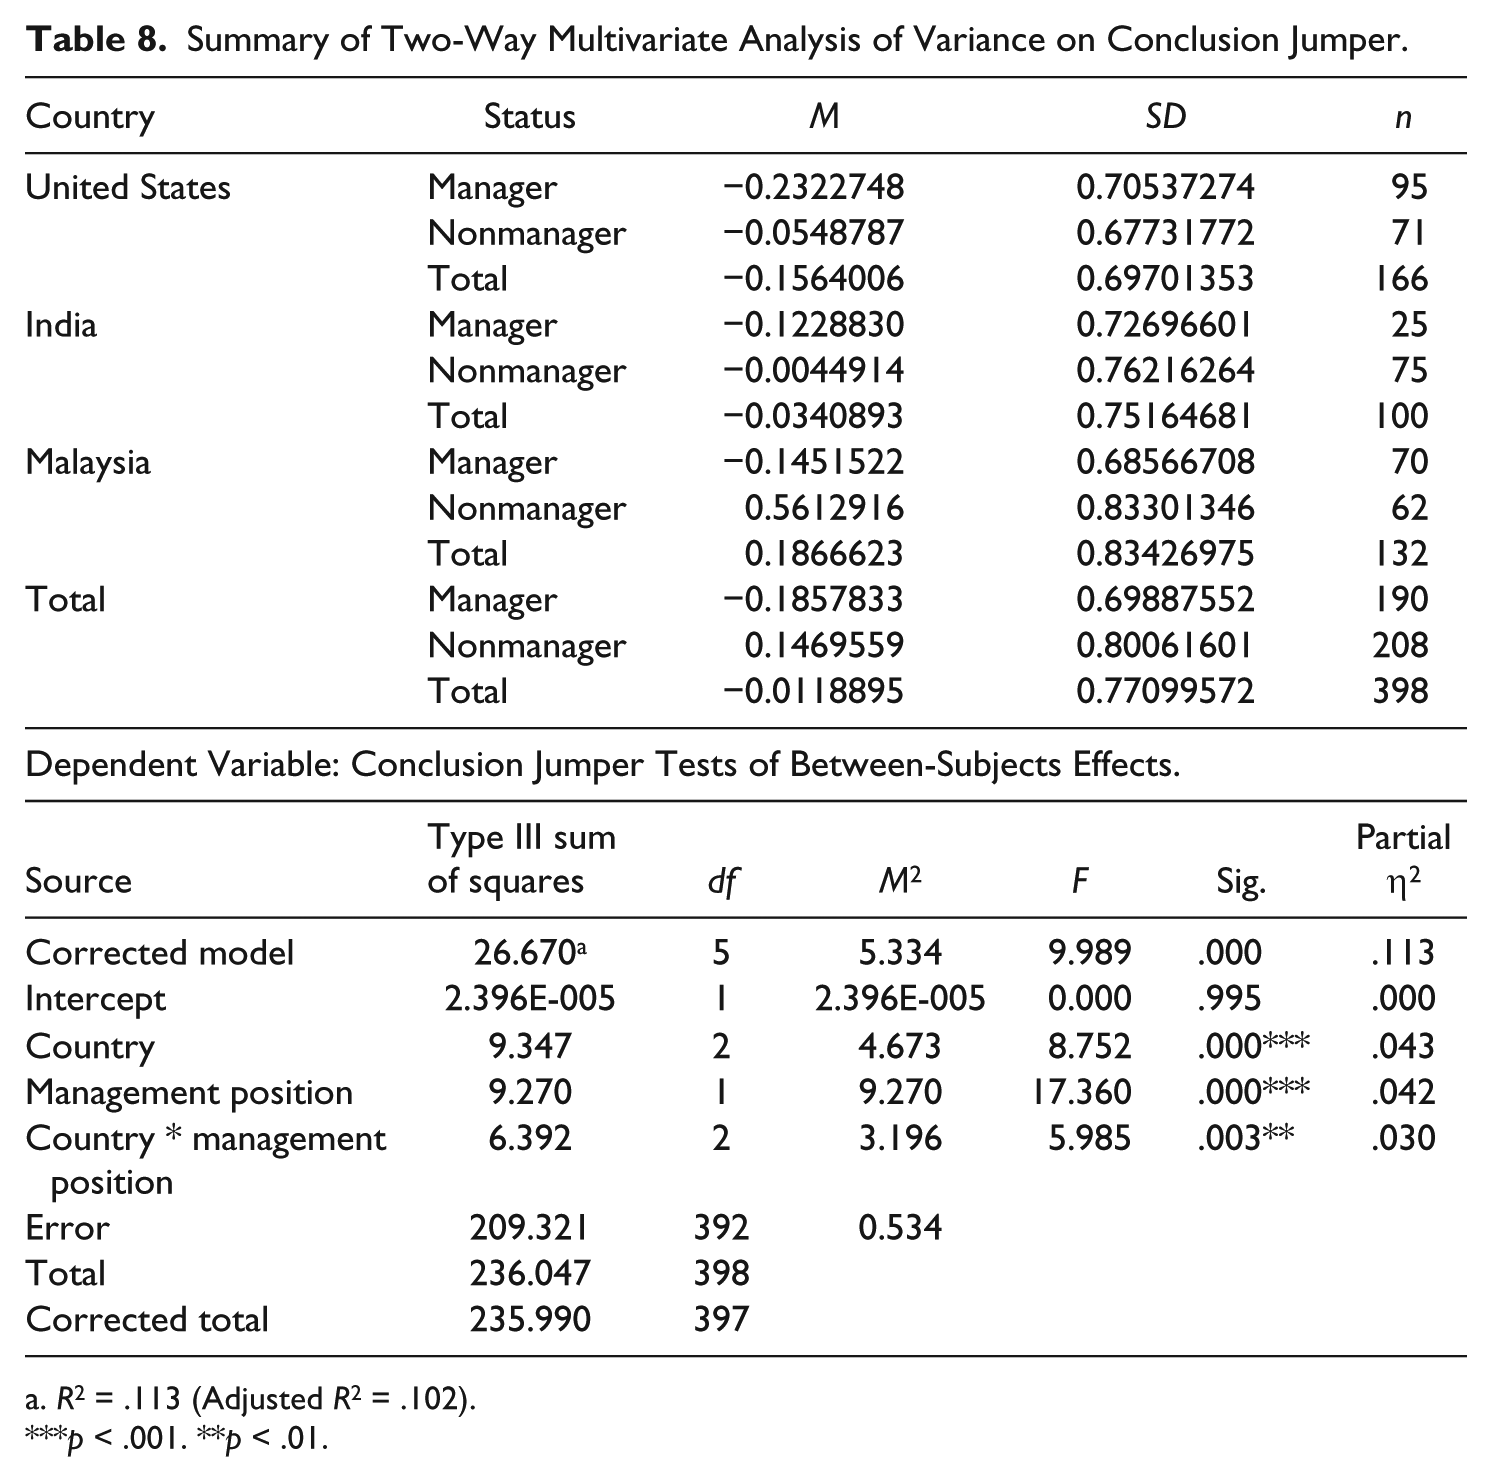
Hypotheses 1, 2, and 3 were rejected on the derived factor Conclusion Jumper. Means among professionals from India, Malaysia, and the United States differed on the derived factor Conclusion Jumper, with F(2, 392), 8.752, p = .000. Means between managers and nonmanagers differed on the derived factor Conclusion Jumper, with F(1, 392), 17.360, p = .000. There is a significant interaction effect: difference in the magnitude of perceived listening behaviors between managers and nonmanagers from India, Malaysia, and the United States existed on the derived factor Conclusion Jumper, with F(2, 392), 5.985, p = .003. A summary of the ANOVA tests and between-subjects effects are shown in Table 8 in the appendix.
On Conclusion Jumper, means for the United States, India, and Malaysia were −.144, −.064, and .208, respectively. The LSD pairwise comparison showed a mean difference of −.352 when the United States was compared with Malaysia, with p = .000. The LSD pairwise comparison showed a mean difference of −.272 when India was compared with the Malaysia, with p = .011. These differences indicated the working professionals in Malaysia perceive they engage in this type of listening significantly more often than working professionals in India and the United States who do not differ. On Conclusion Jumper, means for managers and nonmanagers were −.167 and .167, respectively. The mean difference was −.334, which indicated nonmanagers perceive they engage in this type of listening significantly more often than managers do.
Discussion
The results of this research study, which included 429 managers and nonmanagers working in a wide range of industries in the countries of India, Malaysia, and the United States, indicate the answers to Research Question 1 (Does the position held in an organization (management or nonmanagement) make a difference in the magnitude of his or her self-perception in the engagement of GL and BL behaviors?) and Research Question 2 (Do listening competencies of managers and nonmanagers differ between India, Malaysia, and the United States?) are clearly “yes.”
The four factors (Distracted Listener, Empathetic Listener, Judgment Rusher, and Conclusion Jumper) were used as dependent variables one at time. On the survey, individuals identified their home country and whether they were a manager or employee/nonmanager. Home country and position were used as independent variables in the ANOVA tests. With so many significant differences between managers and nonmanagers on the home country variable, the best way to understand the interaction effects was to plot the estimated marginal means for managers and nonmanagers across the respective home countries. The plots indicated a range of −1.0 to +1.0 because the factor analysis produced regressions score for each of the 429 survey respondents. Managers and nonmanagers were plotted on the separate lines, and home country was plotted on the horizontal line, while a factor is the dependent variable in the plot. Four plots included each factor where managers and nonmanagers were compared across three countries.
The Distracted Listener
Figure 1 shows a plot of the estimated marginal means on distracted listener. The plot is a clear indication as to why the two-way interaction was significant to such a high degree (p = .001). The plot shows country (1 = United States, 2 = India, 3 = Malaysia) and position (1 = managers, 2 = nonmanagers). It can be noted that managers in the United States engage significantly more than nonmanagers in this behavior, while the converse is true of Indian and Malaysian managers who perceive they engage significantly less in this type of behavior than nonmanagers do. The plot indicates the U.S. managers are more prone to become distracted when they are listening than Indian and Malaysian managers. Given that India and Malaysia are collective cultures and score higher on the power distance dimension of Hofstede’s (1980) cultural dimensions, individuals are taught from a young age to respect those in power positions. In this context, a speaker is more powerful than a listener, and it would be considered rude not to listen attentively. Indian and Malaysian employees and managers would not pretend to listen or indulge in tactics to divert attention from the speaker. They would not be distracted because of the respect for power they are taught. In contrast, the United States, as suggested by Hofstede (1980) is a highly individualistic culture with a low score on power distance. Individuals are more concerned about themselves and less concerned about others and thus can become distracted when listening. In addition, communication in Western cultures, such as the Unites States, is typically direct and explicit (Brett, Behfar, & Kern, 2006). In general, the meaning is on the surface, and a listener does not have to know much about the context or the speaker to interpret it. This is not true in many other cultures such as India and Malaysia where the meaning is embedded in the way the message is presented. In cross-cultural negotiations, the Indian or Malaysian can understand the direct communications of the U.S. individual, but the U.S. individual may have difficulty understanding the indirect communications of the Indian or Malaysian and thus become distracted in his or her listening.
Conversely, nonmanagers in all three countries are less likely to be distracted listeners than their managers are. Research has shown that college students spend 55% of their time listening while they are in school (Emanuel et al., 2008) and that percentage rises as these college students enter the workforce as employees (Wolvin & Coakley, 1992, 1996). So for employees, the expectation is that they must listen to learn. A study found that nonsupervisory employees tended to possess better listening abilities than supervisors (Sypher et al., 1989).While another study revealed that when the employees were not listening to their managers, they would act as if they were (Hunsaker & Alessandra, 1980). The plot for the estimated marginal means for managers and nonmanagers on country of residence is shown in Figure 1 in the appendix.
The Empathetic Listener
Figure 2 shows a plot of the estimated marginal means on empathetic listener. The plot is a clear indication as to why the two-way interaction was significant (p = .011). The plot shows country (1 = United States, 2 = India, 3 = Malaysia) and position (1 = managers, 2 = nonmanagers). Notice that managers in Malaysia engage significantly less than nonmanagers in Empathetic Listening and seem to be pulling in opposite directions on the factor. The plot clearly indicates Malaysian managers are prone to empathize less with the speaker, while Malaysian nonmanagers are more likely to be Empathetic Listeners. Once again, given that nonmanagers typically hold a lower position of power, the Malaysian nonmanagers may feel the need to show respect to the manager and empathize with him or her. The plot for the estimated marginal means for managers or nonmanagers on country of residence is shown in Figure 2 in the appendix. This was a somewhat surprising finding given that both Malaysia and India are collective cultures as shown by the GLOBE study, and thus typically show concern for others when engaged in the listening process. It could be attributed to the fact that the Malaysian managers are more autonomous leaders than their nonmanager Malaysian counterparts. According to Den Hartog et al. (1999), Malaysia had the highest average score for autonomous style.
It was expected because of the individualistic culture orientation for the United States, India and Malaysia would have higher scores on this listening behavior. Given that, the United States did have the highest score on participative leadership in the GLOBE study, the U.S. managers may have learned the importance of listening to the ideas of others (House et al., 2007).
The Judgment Rusher
Figure 3 shows a plot of the estimated marginal means on judgment rusher. The plot is a clear indication as to why the two-way interaction was significant to such a high degree (p = .000). The plot shows country (1 = United States, 2 = India, 3 = Malaysia) and position (1= managers, 2= nonmanagers). Results suggest that Malaysian managers and non-managers differ significantly on this factor, whereas managers and nonmanagers based in the United States and India do not. This finding contradicts that of Goyal (2012), who suggests that people in India tend to cut into a discussion or start talking before the other person has finished, and perhaps get impatient to answer because they perceive they know the answer.
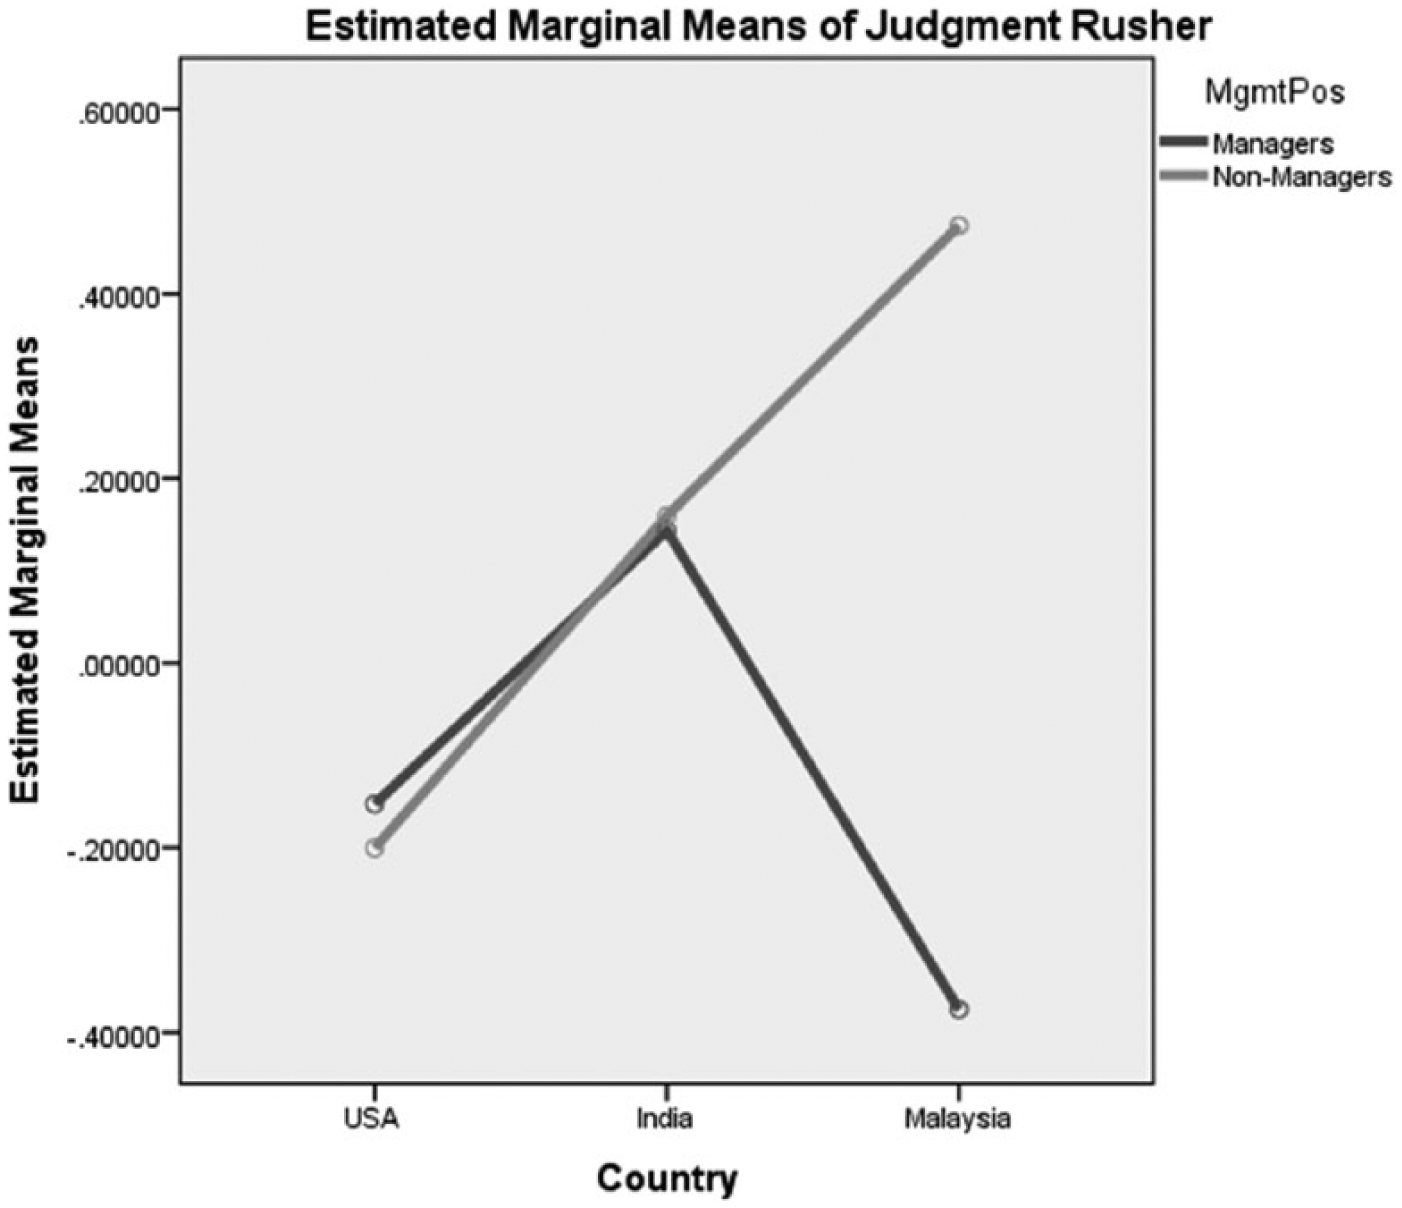
Plot for estimated marginal means of managers/nonmanagers on judgment rusher.
Malaysian managers with extensive work experience and maturity may be less prone to being evaluative or judgmental as compared with nonmanagers who are younger in age and have less work experience. It is likely they may have a shorter attention spans (Rahman, & Azhar, 2011) and rush to make judgment before the speaker ends the conversation.
It was interesting to note that the U.S. managers were less prone to rush to judgment than their Indian and Malaysian counterparts. Although the results of the current study reveal the U.S. managers as more distracted and less empathetic in their listening behaviors, we found U.S. managers to be less judgmental than their counterparts in India and Malaysia. Sypher et al.’s (1989) survey of employees at a large insurance company headquarters in the United States found that better listeners held positions that are more senior and were promoted more frequently than those who were perceived as poor listeners. They, as well as Waner (1995), reported that business professionals viewed listening as one of the most important communication competencies for success. How one perceives another’s listening ability is the window through which all of his or her other communication abilities were evaluated.
The Conclusion Jumper
Figure 4 shows a plot of the estimated marginal means on conclusion jumper. The plot is a clear indication as to why the two-way interaction was significant to such a high degree (p = .003). The plot shows country (1 = United States, 2 = India, 3 = Malaysia) and position (1 = managers, 2 = nonmanagers). Results suggest that the means for managers and nonmanagers in Malaysia differed with nonmanagers in jumping to conclusions. Malaysian nonmanagers engaged significantly more often than Malaysian managers in jumping to conclusions, while Indian and the U.S. managers were similar to nonmanagers on this factor. Malaysian nonmanagers are more prone to jump to conclusions than their managers. Perhaps, those Malaysian managers with extensive work experience and maturity have learned not to jump to conclusions when listening.

Plot for estimated marginal means of managers/nonmanagers on conclusion jumper.
In summary, this study shows the Indian and Malaysian managers are more disciplined listeners and are less distracted than United States managers. This study seems to contradict the findings of Nayar (2013) and Rajadhyaksha (2002) who found young managers in India lack GL skills.
It seems the U.S. managers may need to be more aware of how their employees perceive their listening skills and the impact of those listening skills on their success as a manager. Several prior research studies confirm the impact listening has on employees. Fenniman’s (2010) study of 119 employees of a leading Internet-based research company headquartered in the northeastern United States suggests a significant relationship existed between the perception of listening by the supervisor and the perception of self and other psychological safety from the perspective of the subordinate. In another study, subordinates perceived that managers were committed to their success when the managers demonstrated listening skills with them (Ellinger, Ellinger, & Keller, 2003). When managers listened, the subordinates perceived that their supervisors were acting in their best interest and not just in their own self-interests. In a survey of 278 employees of a technical unit at a large utility company in the southwestern United States, the study found that the better the supervisor was perceived at listening, the more responsive subordinates perceived them to be (Lobdell, Sonoda, & Arnold, 1993). This study also found a positive association between a perception of good supervisor listening behaviors and how the subordinate perceived the openness of the organization as a whole. There appeared to be a positive association between a supervisor’s GL behaviors and the subordinate’s individual sense of control and empowerment. Last, the study showed a moderately positive association between perceived supervisor’s listening and the employees’ sense of commitment. It would seem likely the U.S. respondents may have learned through their education and life experiences the importance of developing their listening skills.
Finally, national culture is a primary determinant of all communication behaviors, including listening. One’s culture essentially serves to define who one is and how one will communicate through one’s perceptual filter. As Wolvin and Coakley (1996) stated, people must recognize that what is considered “effective listening” in one culture may be very inappropriate in another culture. For example, in high-context culture such as India and Malaysia, words mean very different things depending on the context, while in low-context cultures, such as the United States, the meaning of a message is contained more directly in the words. Listeners from high-context cultures, such as India and Malaysia, have been socialized to attend to implicit meanings in messages and carefully observe nonverbal behavior. They are more likely to respond to their gut-level reaction to what they hear rather than to the facts or statistics presented in the message. People from low-context cultures such as the United States are likely to spell things out with explicit, verbal communication, something that could be considered inappropriate and even insulting in a high-context culture (Hall, 1976).
While not all answers can be generalized to all industries or countries, we made an effort to include a range of participants from different organizations within the three countries. However, data collected did not include the country of birth. If these data had been collected, it would have given the researchers a better picture of perceptions about listening competencies in all three countries.
Finally, cross-cultural management researchers should take care when interpreting these results as diversity exists within any nation. As countries continue to become more multicultural, the assumption of national homogeneity when conducting cross-border studies might be incorrect (Ramasamy, Ling, & Ting, 2007).
Conclusion
The present study further reinforces the differences in the listening skills of managers and nonmanagers from India, Malaysia, and the United States. Regardless of workplace location, the managerial burden is increasingly stretched as managers are expected to increase results using limited resources. They face competing demands for their time, while managing an extensive set of responsibilities and tasks. While managers, who focus on achieving goals and delivering results as efficiently as possible, may not be as effective if they view listening as time wasting. In such cases, managers need to be aware of the important role that listening plays in employee engagement. Clearly, it is in the interests of managers to understand and appreciate the role of listening. When listening to others, managers need to be less distracted, more empathetic, and less prone to rushing to judgment or jumping to conclusions. Additionally, managers play an important role in modeling appropriate behaviors for nonmanagers who provide the pool of potential managers.
Managers who listen effectively benefit not only employees but all stakeholders within and without an organization. As organizational structures become flatter, managerial roles will focus more on coaching and collaboration, activities in which listening skills will be essential to achieving individual, team, and organizational goals.
Future Research
This study is the first exploratory research on the listening preferences of managers and nonmanagers within the India, Malaysia, and the United States. Since there is limited cross-cultural research on listening behaviors of managers and nonmanagers, it contributes to the field.
Instead of only comparing managers with nonmanagers across three countries, a more targeted study might be to look at nonmanagers and managers at different levels in one organization in each country. The more in-depth study could analyze the listening skills of managers and nonmanagers in different departments to determine the role listening plays and the impact it might have on the communication of the organization.
Additional studies should be undertaken to understand why some individuals are more confident in their listening styles than others. A question to ask would be “How would individuals’ self-reports of listening skills compare to others’ assessment of their listening skills [e.g., coworkers, managers, and peers]?” According to Johnson, Pearce, Tuten, and Sinclair (2003), several research studies have shown that managers rated their own listening competencies higher than their subordinates (Husband et al., 1988), coworkers (Cooper & Husband, 1993), and supervisors (Huegli & Tschirgi, 1974). However, these studies are older, so newer research studies are needed to show if managers still rate their own listening competencies higher than others.
Last, researchers could conduct a qualitative study to understand why the respondents agreed or disagreed with the GL and BL items.
Footnotes
Appendix
Summary of Two-Way Multivariate Analysis of Variance on Conclusion Jumper.
| Country | Status | M | SD | n | ||
|---|---|---|---|---|---|---|
| United States | Manager | −0.2322748 | 0.70537274 | 95 | ||
| Nonmanager | −0.0548787 | 0.67731772 | 71 | |||
| Total | −0.1564006 | 0.69701353 | 166 | |||
| India | Manager | −0.1228830 | 0.72696601 | 25 | ||
| Nonmanager | −0.0044914 | 0.76216264 | 75 | |||
| Total | −0.0340893 | 0.75164681 | 100 | |||
| Malaysia | Manager | −0.1451522 | 0.68566708 | 70 | ||
| Nonmanager | 0.5612916 | 0.83301346 | 62 | |||
| Total | 0.1866623 | 0.83426975 | 132 | |||
| Total | Manager | −0.1857833 | 0.69887552 | 190 | ||
| Nonmanager | 0.1469559 | 0.80061601 | 208 | |||
| Total | −0.0118895 | 0.77099572 | 398 | |||
| Dependent Variable: Conclusion Jumper Tests of Between-Subjects Effects. |
||||||
| Source | Type III sum of squares | df | M 2 | F | Sig. | Partial η2 |
| Corrected model | 26.670 a | 5 | 5.334 | 9.989 | .000 | .113 |
| Intercept | 2.396E-005 | 1 | 2.396E-005 | 0.000 | .995 | .000 |
| Country | 9.347 | 2 | 4.673 | 8.752 | .000*** | .043 |
| Management position | 9.270 | 1 | 9.270 | 17.360 | .000*** | .042 |
| Country * management position | 6.392 | 2 | 3.196 | 5.985 | .003** | .030 |
| Error | 209.321 | 392 | 0.534 | |||
| Total | 236.047 | 398 | ||||
| Corrected total | 235.990 | 397 | ||||
R2 = .113 (Adjusted R2 = .102).
p < .001. **p < .01.
Declaration of Conflicting Interests
The author(s) declared no potential conflicts of interest with respect to the research, authorship, and/or publication of this article.
Funding
The author(s) received no financial support for the research, authorship, and/or publication of this article.