
Abstract
This article deals with the question of how agreement or disagreement in the perception of leadership communication from the perspective of both leader and subordinate is related to subordinates’ job satisfaction. Employees of a department in a large, globally operating insurance company and their managers (N = 110) completed questionnaires including instruments to assess leadership communication from the perspective of the managers and their respective employees as well as employees’ job satisfaction. Results from polynomial regression with response surface modeling suggest that there is a positive linear relationship between self- and other ratings of leadership communication and subordinates’ job satisfaction, in which the highest scores of job satisfaction are related to high in-agreement ratings of leadership communication. In addition, discrepancies in perceptions of leadership communication decrease job satisfaction, particularly when leaders are overestimators.
Keywords
Leaders are communicators: Most of the time, they spend with talking to their employees (e.g., Neuberger, 2002; Tourish & Hargie, 2009). However, not every leader seems to be a competent communicator—at least, leaders’ and followers’ perspectives might differ. Given the assumption that communication plays a central role in leadership (e.g., de Vries, Bakker-Pieper, & Oostenveld, 2010; Hertzsch, 2012, in press) such divergent views should affect important communicative outcomes like job satisfaction (Judge, Thoresen, Bono, & Patton, 2001; Schneider & Retzbach, 2012). Thus, drawing from traditional research on self-other agreement (SOA) in leadership (e.g., Atwater & Yammarino, 1992, 1997; for an overview, see Fleenor, Smither, Atwater, Braddy, & Sturm, 2010), the present study aims at delineating the positive and negative effects of discrepancies or correspondences in leadership communication on job satisfaction. Although SOA has been investigated with regard to a wide range of organizational behaviors, for example, empowering leadership (Amundsen & Martinsen, 2014), job performance (Heidemeier & Moser, 2009), leader self-awareness (Atwater & Yammarino, 1992), and especially leader-member exchange (LMX; Cogliser, Schriesheim, Scandura, & Gardner, 2009; Sin, Nahrgang, & Morgeson, 2009; Zhou & Schriesheim, 2009, 2010), none of the studies—to our best knowledge—have addressed the question how SOA in leadership communication is related to job satisfaction.
Theoretical Foundations
Leadership Communication
Previous studies have examined the relationship between leadership communication and various outcomes such as job satisfaction and commitment (e.g., Baird & Diebolt, 1976; Mayfield, Mayfield, & Kopf, 1998; Schweiger & DeNisi, 1991) and subordinates’ job performance (e.g., Clampitt & Downs, 1993; O’Reilly & Anderson, 1980; Snyder & Morris, 1984; Tsai, Chuang, & Hsieh, 2009). However, there has been no consistent operationalization of leadership communication in previous research (cf. Hertzsch, 2012, in press). Some examples of operationalization are the satisfaction with a superior’s communication (Clampitt & Downs, 1993; Tsai et al., 2009), the use of motivating language (Mayfield et al., 1998), and the frequency of performance evaluations (O’Reilly & Anderson, 1980).
Few studies have examined the relationships between leadership styles, leadership communication, and various outcomes. de Vries et al. (2010) found that the style of communication appears to be the main ingredient in charismatic and employee-oriented leadership styles. Waldherr (2008) also found high correlations between leadership communication style and the quality of LMX as well as satisfaction with leadership communication. A small number of studies examine the relationship between communication competence and leadership theories (Flauto, 1999; Macik-Frey, 2007; Madlock, 2008b). For instance, Flauto (1999) found that the quality of the leader-member dyad accounted for most of the variance in perceived leadership communication competence as compared with transformational leadership or transactional leadership (Bass, 1998). Furthermore, subordinates in leader-subordinate dyads with high quality rated their leaders as highly competent communicators. Madlock (2008b) found that employee-oriented leadership accounted for considerably more variance in perceived leadership communication as compared with task-oriented leadership. There is also evidence that leaders’ communication competence can predict subordinates’ satisfaction with their leader (Macik-Frey, 2007) as well as general job satisfaction and satisfaction with communication (Madlock, 2008b). Although previous research has provided evidence for the connection between communication, leadership, and important organizational outcomes, this has not been explicated in original leadership theory. Furthermore, the operationalization of the construct leadership communication is still at an early stage.
Schneider and Retzbach (2012) noted that most studies in the field of leadership and communication are based on correlative designs. This leads to the problem that the direction of the relationship between leadership communication quality and LMX quality has yet to be determined. It appears plausible that communication quality is a result of LMX quality (e.g., Mueller & Lee, 2002). But it is also arguable that LMX quality is influenced by communication quality. This issue will remain unresolved until it is addressed by experimental designs or longitudinal studies. As Schneider and Retzbach (2012) pointed out, it is also possible that leadership and leadership communication are not different constructs after all (cf. de Vries et al., 2010; Waldherr, 2008).
Nevertheless, it is evident that LMX theory is suitable for applying a communication approach to leadership (Hertzsch, Schneider, & Maier, 2012). According to LMX, leadership behavior cannot be generalized for all members of an organizational unit that report to the same superior (Graen & Uhl-Bien, 1995). Instead, LMX focuses on the unique dyadic relationship between the superior and an individual subordinate. The exchange that takes place within this relationship defines leadership behavior. A considerable body of research supports these assumptions (e.g., Gerstner & Day, 1997; Liden & Maslyn, 1998). Hertzsch et al. (2012) point out that the LMX approach understands leadership as an interactional process between leaders and subordinates. Instead of focusing on the leader alone, it considers the evaluations by both dyad partners, thus including the subordinates’ perception. Building on this approach to leadership, the dyadic structure between a superior and one subordinate is the focal unit of analysis in the research methodology described in this article.
In the following section, we briefly review the construct of job satisfaction with respect to its suitability as an organizational outcome variable for this present research.
Job Satisfaction
According to Rafferty and Griffin (2009), “job satisfaction is one of the most frequently studied aspects of organizational life in the psychological sciences” (p. 196). An enormous number of studies have been published in the area, but it is noteworthy that relatively few studies have focused on the job satisfaction construct itself (Rafferty & Griffin, 2009). Psychologists have argued that how an individual feels about work and the meaning of work are crucial elements of the overall employment experience (e.g., Judge, Parker, Colbert, Heller, & Ilies, 2001; Tait, Padgett, & Baldwin, 1989). In the course of the ongoing popularity of the construct, the definition of job satisfaction has been intensively debated. Nevertheless, most authors agree that positive attitudes or frustration and discontent with the job result from the degree of fulfillment or satisfaction of wishes and needs regarding the job (Six & Felfe, 2004).
There is considerable evidence that it is necessary to distinguish between measures of overall job satisfaction and measures of facets of job satisfaction (cf. Rafferty & Griffin, 2009). While measures of overall job satisfaction ask an individual to evaluate his or her job as a whole, facet measures are evaluations of specific aspects of the work environment (Weiss, 2002). Empirical studies have provided evidence that global measures of job satisfaction and facet measures are only weakly to moderately related (e.g., Aldag & Brief, 1978). Scarpello and Campbell (1983) argue that global measures of job satisfaction also appear to capture information relating to satisfaction with occupational choice and life off the job and are therefore more complex than job satisfaction facets or even the sum of job satisfaction facets.
The relationship between job satisfaction and outcomes has received a great deal of attention (Madlock, 2008a). There have been controversial discussions of the relationship between job satisfaction and job performance concerning the question whether employees with high job satisfaction also perform better (cf. Six & Felfe, 2004). While earlier research has challenged this notion (cf. Iaffaldano & Muchinsky, 1985), a more recent meta-analysis by Judge, Thoresen, et al. (2001) revealed methodological deficiencies in earlier research and confirmed an average correlation of .30 between general job satisfaction and performance. Current research considers these findings as evidence for a meaningful relationship between job satisfaction and performance (cf. Schmidt, 2006). Job satisfaction has also been positively associated with organizational commitment (Mowday, Porter, & Steers, 1982), organizational citizenship (Hulin & Judge, 2003), and loyalty (Trombetta & Rogers, 1988). It has also been negatively related to absenteeism (Sagie, 1998), tardiness (Iverson & Deery, 2001), and employee turnover (Johns, 2002). Considering the findings of Judge, Thoresen, et al. (2001), these results strongly encouraged the use of job satisfaction as an outcome variable in this present research.
As noted above, several studies have investigated the relationship between different operationalizations of leadership communication and job satisfaction as an outcome variable (e.g., Baird & Diebolt, 1976; Czech & Forward, 2013; Fix & Sias, 2006; Hatfield & Huseman, 1982; Mayfield et al., 1998; Wulandari & Burgess, 2010) and provided evidence that the relationship between the constructs is indeed meaningful. A study by Madlock (2008b) found a significant moderate correlation between leader communication competence and subordinates’ job satisfaction.
To understand how congruence or incongruence of self-ratings and other ratings relate to job satisfaction and other organizational outcomes, we consider findings from SOA research in leadership.
Self-Other Rating Agreement in Leadership
Leadership research typically defines SOA as the degree of agreement or congruence between a leader’s self-rating and the ratings of others, usually supervisors, peers, or subordinates (Atwater, Wang, Smither, & Fleenor, 2009; Fleenor et al., 2010; Fleenor, McCauley, & Brutus, 1996; Ostroff, Atwater, & Feinberg, 2004; Yammarino & Atwater, 1993).
Previous research has provided evidence that a gap or discrepancy exists between self- and other ratings on the same constructs or dimensions of multisource feedback instruments (e.g., Amundsen & Martinsen, 2014; Brutus, Fleenor, & McCauley, 1999; Morgeson, Mumford, & Campion, 2005; Moser & Heidemeier, 2011; Ostroff et al., 2004). While differences between rating sources have traditionally been thought of as measurement error, in multisource ratings the lack of agreement between different sources in itself is of major interest (Fleenor et al., 2010). A number of studies have suggested that individuals inflate their own ratings relative to their raters due to self-enhancement tendencies (Halverson, Tonidandel, Barlow, & Dipboye, 2005; Heidemeier & Moser, 2009; Hough, Keyes, & Dunnette, 1983; Mabe & West, 1982; Podsakoff & Organ, 1986). Other researchers have found that self-ratings are unreliable, invalid, and inaccurate when compared with the ratings of others or objective criteria (Ashford, Cummings, & Staw, 1989; Harris & Schaubroeck, 1988; Mabe & West, 1982; Yammarino & Atwater, 1993). Despite this notion, research has suggested that there are not only individuals who overrate themselves but also individuals who provide self-ratings that agree with others’ ratings, and even self-raters who provide ratings that are lower than others’ ratings (Atwater & Yammarino, 1992; Fleenor et al., 1996; Van Velsor, Taylor, & Leslie, 1993).
According to Eckert, Ekelund, Gentry, and Dawson (2010), current research predominantly posits SOA as an indicator of self-awareness. Rating discrepancies are therefore assumed to be an expression of low self-awareness. In their meta-analytic study, Mabe and West (1982) found that raters who give more accurate ratings tend to score higher on intelligence, achievement status, and internal locus of control.
Nevertheless, Harris and Schaubroeck (1988) have proposed that a manager who overrates herself or himself might not only be the result of an inflated self-view or self-enhancement bias but that aspects like organizational level could also lead to rating discrepancies because rater groups on different hierarchical levels might have a different understanding of what good leadership is. Furthermore, different rater groups may have different opportunities to observe the target individual and thus form different perceptions of him or her. Eckert et al. (2010) also found that cultural factors play a role in predicting rating discrepancy.
Previous work has underlined the central importance of SOA by suggesting that the degree and direction of SOA have an impact on various outcome measures (Atwater, Roush, & Fischthal, 1995; Atwater & Yammarino, 1992; Van Velsor et al., 1993). In their review, Fleenor et al. (2010) provide a comprehensive overview of the correlates of SOA.
Drawing on several studies that were designed to further the knowledge of SOA, Yammarino and Atwater (1993) developed an early conceptual model of self-perception accuracy. They posit that individual and organizational outcomes are enhanced when self-perception is accurate, diminished when self-perception is inflated (overestimators), and mixed when self-perception is deflated (underestimators). Evidently, underestimators affect some organizational outcomes favorably and others less favorably. For instance, they may have more interest in self-development but less interest in promotions (Yammarino & Atwater, 1993).
In a later review of the model, Atwater and Yammarino (1997) gave a more elaborated explanation for the case of accurate self-perception. They posit that leaders whose self-ratings agree with others’ ratings and relate to high values of the predictor variable, meaning that they are good performers and have views of themselves that are similar to those of others, are more likely to be linked to positive individual and organizational outcomes. However, leaders who agree with others about low values of the predictor variable are more likely to be linked to negative outcomes. They may be poor performers who recognize their weakness but are unwilling or unable to change (cf. Atwater, Ostroff, Yammarino, & Fleenor, 1998). The model also makes important predictions regarding the cases that are connected with negative organizational outcomes. According to the model, while the in-agreement poor case is more likely to be linked to negative outcomes, the overestimator case is more likely to be linked to very negative outcomes. Atwater and Yammarino (1997) also include explanations of why self-ratings often differ from others’ ratings. Following Ashford et al. (1989), they propose that factors such as cognitive processes, job experience, biographical information, personality characteristics, and contextual factors affect self-perception, and therefore self-rating. In addition, factors such as tenure and emotional stability may be affecting others’ ratings. Fleenor et al. (2010) also confirm these findings in their review and discuss them in great detail.
While the majority of previous research on SOA in leadership focuses on outcomes that predominantly affect the leader and that are relevant to multisource feedback and leadership development scenarios, such as leader performance (Atwater et al., 1998; Atwater, Waldman, Ostroff, Robie, & Johnson, 2005; Atwater & Yammarino, 1992; Bass & Yammarino, 1991; Ostroff et al., 2004; Van Velsor et al., 1993) or likelihood for promotion recommendations (Atwater & Yammarino, 1992; Bass & Yammarino, 1991; Halverson et al., 2005), there has also been evidence for the impact of SOA (or disagreement) on subordinates. The findings of Szell and Henderson (1997) suggest that SOA is related to subordinates’ job satisfaction, specifically satisfaction with supervision, social aspects, and growth aspects of the job, and therefore they encourage using subordinates’ job satisfaction as a meaningful outcome variable for studying the effects of SOA of perceived leadership communication quality. Based on the model of SOA by Atwater and Yammarino (1997), the hypotheses in this article regarding how SOA of perceived leadership communication relates to subordinates’ job satisfaction were posited as follows:
Method
Sample and Procedure
We distributed a survey to the employees and managers of one specific department in a large, globally operating insurance company in Germany. The department consists of six divisions that are composed of several subdivisions, each led by one manager. In the following, the terms “leader” and “supervisor” are used synonymously to describe the subdivision managers that participated in the survey.
Of 161 respondents, 24% were female, 76% were male, and 14% of the participants occupied a leadership position. The survey was conducted online. Focal management distributed invitations to the survey via an e-mail, which directed leaders and subordinates to separate version of the survey. The leader version of the survey included a self-rating scale assessing perceived leadership communication. The subordinate version included the other-rating form of the scale to assess perceived leadership communication of the respective supervisor and three distinct scales measuring job satisfaction. As an incentive for participation, there was a chance to win a €100 voucher for a local theater. Respondents were guaranteed anonymity. Confidentiality was assured by informing the participants that results would be reported only in the form of aggregated data on the division level. However, we ensured the ability to match the data sets of leaders and their respective subordinates by assigning a special code to the leader-subordinates unit (see below).
The participation rate of the leaders in the department was 85%. The number of total employees in the department was kept under disclosure, so no information on the participation rate among employees can be reported. The average number of completed subordinate surveys per leader was 5.3. The number of surveys per leader ranged from 1 to 12. The percentage of leaders who received only one survey from a subordinate was 0.7%.
The company’s works committee restricted the collection of certain data, such as certain sociodemographic items and items concerning work situation (e.g., age, duration of employment, size of the subdivision), to ensure employees’ anonymity. Thus, we assessed age as a categorical variable. The sample of n = 22 leaders consisted of 14% females and 86% males, and the modal age group was 45 to 49 years (41%). The sample of subordinates consisted of 26% females and 74% males. The modal age group was 50 to 54 years (30%).
Measures
Perceived Leadership Communication Questionnaire
To measure perceived leadership communication from the perspective of the leaders themselves as well as from the perspective of their subordinates, we used the German Perceived Leadership Communication Questionnaire (PLCQ; Schneider, Maier, Lovrekovic, & Retzbach, 2015). The PLCQ measures six different facets of leadership communication (i.e., communication skills, communicative motivation, communication quality, reduction of uncertainty, shared meaning, and openness of communication). It is a short, reliable, and valid instrument consisting of six items that are worded in two versions, namely for self-rating of perceived leadership communication (PLCQ-SR; e.g., “My subordinates and I can speak openly with one another”) and for other rating of perceived leadership communication by subordinates (PLCQ-OR; e.g., “My supervisor and I can speak openly with each other”). Response scales range from 0 (completely disagree) to 4 (completely agree).
Thus, the PLCQ presented itself as the first choice for exploring the effect of SOA on organizational outcomes. Furthermore, the fact that the PLCQ is quite short increased the efficiency of the survey. Because some participants were leaders in management positions with tight schedules, this was essential to minimize dropout rates. While Schneider et al. (2015) found the PLCQ-OR and subordinates’ job satisfaction moderately positively correlated, the question of how the combination of PLCQ-SR and PLCQ-OR relates to subordinates’ job satisfaction has not yet been investigated. Prior research found the PLCQ to have a reliability of .80 on average (Schneider et al., 2015). In the present study, internal consistencies were .84 and .91 for the PLCQ-SR and the PLCQ-OR, respectively.
Job Satisfaction
Job satisfaction of the subordinates was measured with the three most general items from three short instruments—SAZ-K, the short version of the German “Skala zur Messung von Arbeitszufriedenheit [scale for measuring job satisfaction]” developed by Fischer and Lück (1972), a subscale of the German version of the Job Diagnostic Survey (Hackman & Oldham, 1975) published by Schmidt, Kleinbeck, Ottmann, and Seidel (1985), and the faces scale (Kunin, 1955). The reasons for focusing on general job satisfaction were that it was economical and because results from meta-analysis suggest that measures for general job satisfaction are more strongly related to performance indicators than facet measures of job satisfaction (Judge, Thoresen, et al., 2001).
Specifically, we used one item of the SAZ-K (I really enjoy my work) with answers on a 5-point scale ranging from 1 (false) to 5 (true), one item from the Job Diagnostic Survey (Generally speaking, I am very much satisfied with my job) with a 5-point Likert-type response scale ranging from 1 (does not apply at all) to 5 (does fully apply). Finally, we added the faces scales (Kunin, 1955) because it offers an approach to the assessment of job satisfaction that differs substantially from the other methods described above and has shown to be especially sensitive to the emotional component of job satisfaction (Kaplan, Warren, Barsky, & Thoresen, 2009). In addition, schematic faces as response options have the advantage that they are easily understood and are not dependent on language skills of the respondents (Smith, Kendall, & Hulin, 1969). In the present study, we used seven faces from an experiment by Elfering and Grebner (2010). Cronbach’s alpha of the scale was .87.
Data Analytic Procedure
We conducted polynomial regression with response surface analysis to test the hypotheses described above. This technique allows for an examination of the extent to which two predictor variables (e.g., self-rating and other rating) relate to an outcome variable if the discrepancy between the predictor variables is a central consideration (Shanock, Baran, Gentry, Pattison, & Heggestad, 2010). As the quadratic regression equations with these three variables imply a three-dimensional surface representing the relationship between them, response surface methodology provides means for estimating and interpreting its direction and shape, especially when the relationship between the variables is curvilinear (Edwards, 2002). Polynomial regression has been recommended by Edwards (1993, 1994, 2002), and Edwards and Parry (1993) as an alternative to difference scores because it enables researchers to keep component measures such as self- and other ratings separate and incorporates higher order terms such as squared self- and other ratings. Polynomial regression can therefore offer a foundation to appropriately examine the relationship between self- and other ratings and outcomes in three dimensions (Fleenor et al., 2010). In contrast, difference scores cannot tell us the extent to which each of the component measures contributes to the outcome variable. Furthermore, they cannot be interpreted unambiguously, and they reduce three-dimensional relationships among component measures and outcome to two dimensions.
Polynomial regression has been strongly advocated as an emerging technique in the study of congruence because it has more explanatory potential than difference scores or traditional moderated regression analyses (e.g., Atwater et al., 1998; Cohen, Nahum-Shani, & Doveh, 2010; Edwards, 2002; Shanock et al., 2010). Authors note that many research questions in the organizational sciences could benefit from an application of polynomial regression with response surface analysis (e.g., Shanock et al., 2010); however, research has mainly applied the methodology to the study of outcomes of self-observer rating discrepancies in multisource feedback instruments up to date (e.g., Atwater et al., 1998; Gentry, Hannum, Ekelund, & de Jong, 2007; Ostroff et al., 2004). Cohen et al. (2010) noted that one of the main arguments against using polynomial regression is that its complexity relative to other methods for assessing congruence may lead to difficulties with interpretation and inference (cf. Tisak & Smith, 1994a, 1994b).
For a better understanding of results from polynomial regression, response surface analysis is used to provide a nuanced view of relationships between combinations of two predictor variables and an outcome variable by graphing the results of polynomial regression analysis in a three-dimensional space (e.g., Edwards, 1994; Harris, Anseel, & Lievens, 2008; Shanock et al., 2010). This involves analyzing key features such as the slope and curvature of the axes that comprise the shape of the surfaces (cf. Edwards, 2002) as described in more detail in the results section below.
In conclusion, the method is suitable for the present research and offers a number of advantages over alternative methods of analysis. Shanock et al. (2010) have explained the procedure of applying polynomial regression with response surface analysis as outlined by Atwater et al. (2005) in great detail.
For the analysis of the supervisors’ PLCQ-SR scores in relation to the PLCQ-OR scores provided by the subordinates, we matched the supervisors’ self-rating scores to the data set of their respective subordinates, thereby creating a dyadic data structure. A special code was assigned to the leaders-subordinates unit to ensure the correct assignment of the data sets of leaders and their respective subordinates. Unfortunately, we could not match every subordinate data set with a supervisor PLCQ-SR score due to missing supervisor survey responses. This resulted in a sample size of N = 110 dyadic subordinate-leader data pairs for final analysis.
Results
Descriptive statistics and correlation coefficients between PLCQ-SR, PLCQ-OR, and subordinates’ job satisfaction are presented in Table 1. The mean of PLCQ-SR was slightly higher than the mean of PLCQ-OR, suggesting differences in perception. The correlation between PLCQ-SR and PLCQ-OR was only moderate. This is in line with previous research by Schneider, Maier, Lovrekovic, and Retzbach (2012), which also found a moderate correlation (r = .17, p < .05) between PLCQ-SR and PLCQ-OR. Correlations between PLCQ-OR and subordinates’ job satisfaction were higher than correlations between PLCQ-SR and job satisfaction.
Descriptive Statistics, Correlations, and Internal Consistencies of Leaders’ Self-Rating of Perceived Leadership Communication (PLCQ-SR), Subordinates’ Other Rating (PLCQ-OR), and Job Satisfaction (JS) of Subordinates.

Note. N = 110. Cronbach’s alphas are in italics along the diagonal. *p < .05: We used an alpha level of .05 for all statistical tests.
A procedure recommended by Fleenor et al. (1996) was conducted to investigate the discrepancies between leaders’ self-ratings and their subordinates’ ratings. For this purpose, we standardized scores for the predictor variables—PLCQ-SR and PLCQ-OR. Every case with a standardized score on one predictor that is half a standard deviation above or below the standardized score on the other predictor variable is considered to have discrepant values. Results are presented in Table 2. Over two thirds of the cases have PLCQ-SR and PLCQ-OR scores that are different from each other in one direction or the other. Based on these data, we can conclude that exploring how discrepancies between self-ratings and other ratings relate to job satisfaction of subordinates has practical value.
Frequencies and Mean Ratings of PLCQ-SR Levels Over, Under, and In-Agreement With PLCQ-OR Levels.
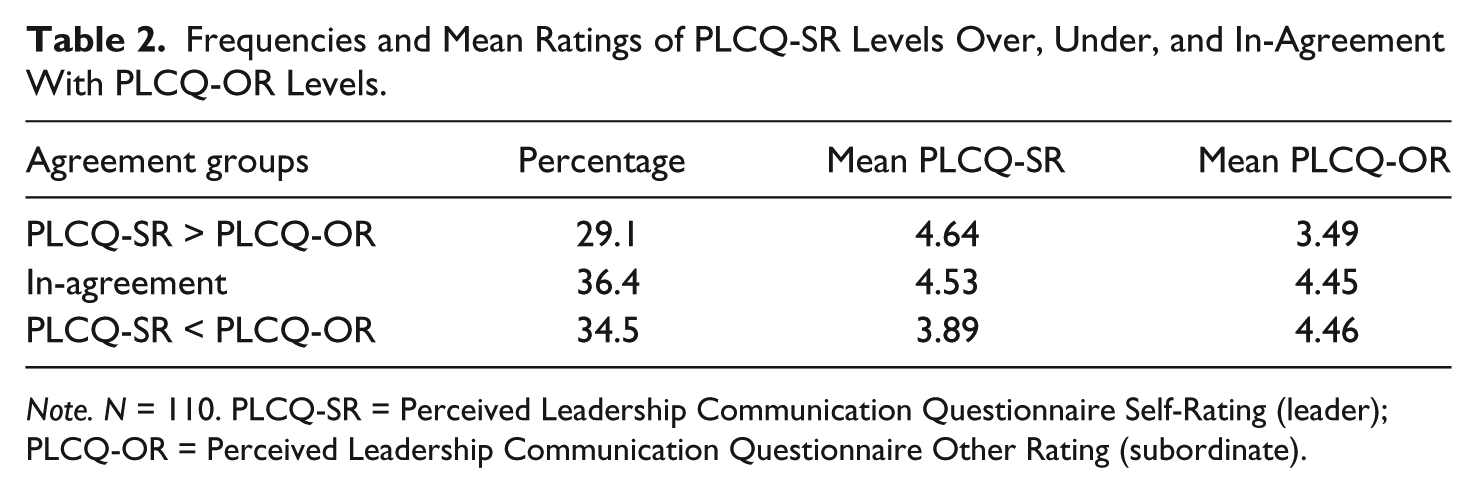
Note. N = 110. PLCQ-SR = Perceived Leadership Communication Questionnaire Self-Rating (leader); PLCQ-OR = Perceived Leadership Communication Questionnaire Other Rating (subordinate).
To determine whether the difference between PLCQ-OR and PLCQ-SR reaches statistical significance, we conducted a paired t test. The test showed a significant difference between PLCQ-OR and PLCQ-SR, t(109) = −2.18, p = .032 (two-tailed), thus indicating the presence of differences in perception between subordinates and leaders. The mean decrease in scores from PLCQ-OR to PLCQ-SR was −0.17, 95% confidence interval [−0.32, −0.02]. The eta-squared statistic (.04) indicated a rather small effect size. The results are similar to previous findings that also report significant differences between PLCQ-SR and PLCQ-OR (Schneider et al., 2012), t(91) = −5.14, p < .001.
To analyze the effect of agreement or disagreement of PLCQ-SR and PLCQ-OR on subordinates’ job satisfaction and investigate the functional form of the relationship between the variables, we conducted polynomial regression following the procedure outlined by Atwater et al. (2005).
Following recommendations by Edwards (1994), PLCQ-SR and PLCQ-OR were centered on the midpoint of the scale. Centering the predictors does not only aid interpretation, it also reduces the potential for multicollinearity (Aiken & West, 1991). Next, hierarchical regressions were computed in which subordinates’ job satisfaction was regressed on PLCQ-SR and PLCQ-OR in the first step (Model 1), and the cross product of PLCQ-SR and PLCQ-OR, the square of PLCQ-SR, and the square of PLCQ-OR were added in the second step (Model 2). The results are presented in Table 3.
Regressions of Subordinates’ Job Satisfaction on PLCQ-SR and PLCQ-OR Ratings.
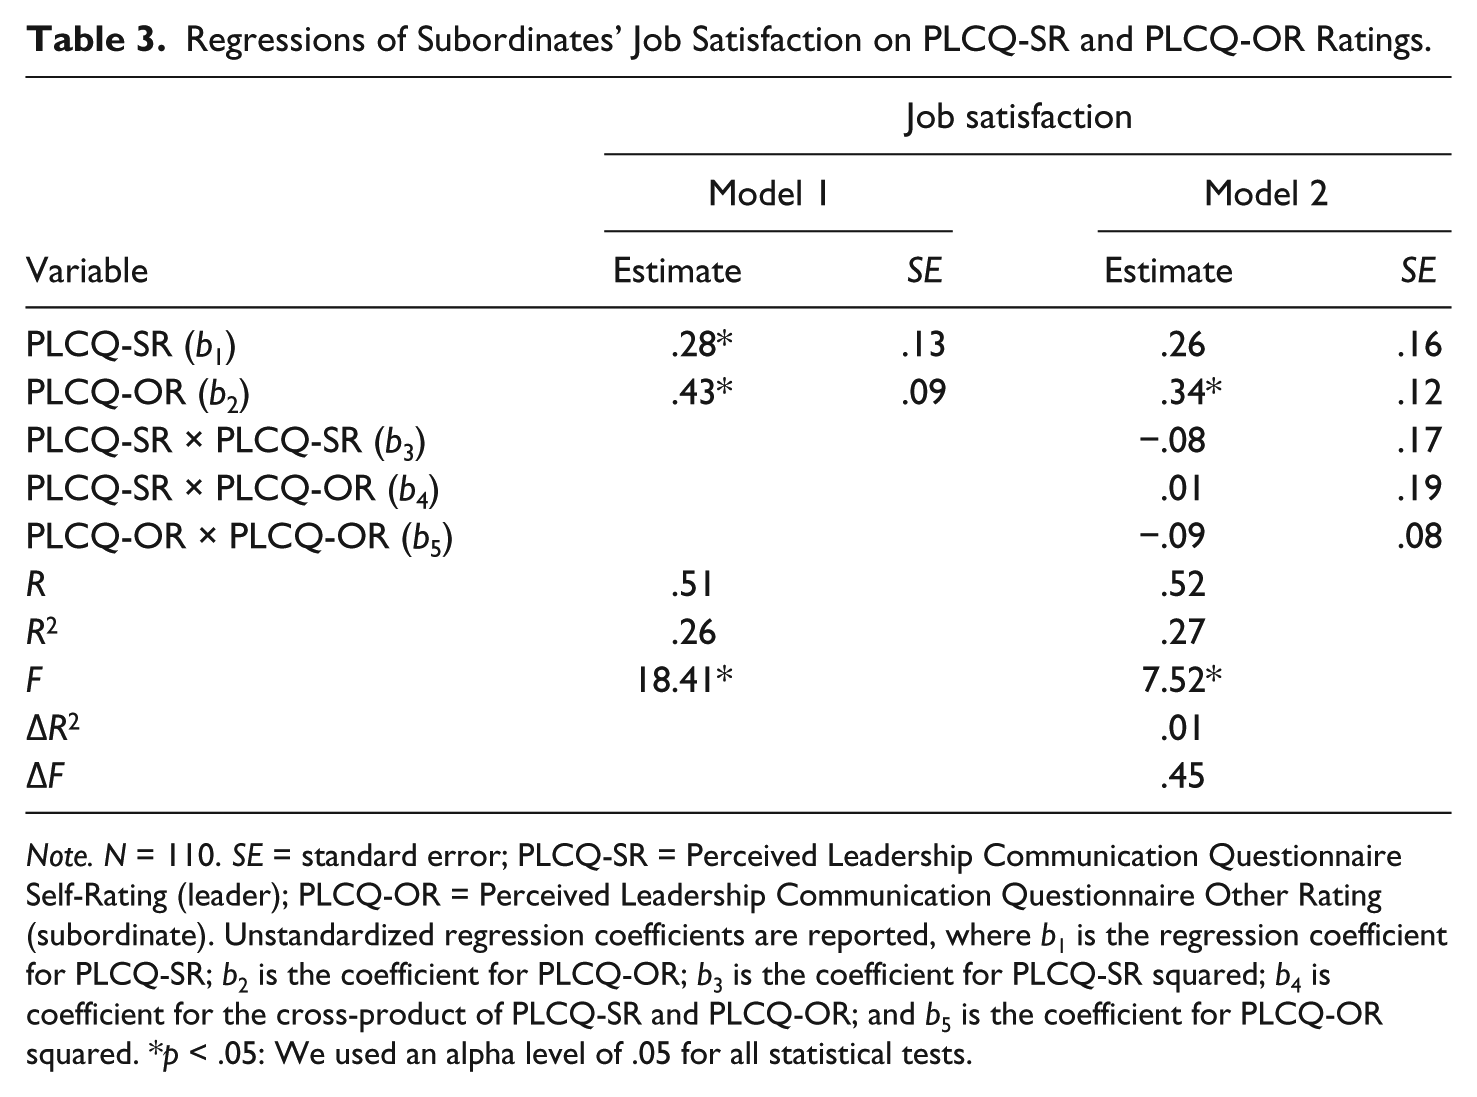
Note. N = 110. SE = standard error; PLCQ-SR = Perceived Leadership Communication Questionnaire Self-Rating (leader); PLCQ-OR = Perceived Leadership Communication Questionnaire Other Rating (subordinate). Unstandardized regression coefficients are reported, where b1 is the regression coefficient for PLCQ-SR; b2 is the coefficient for PLCQ-OR; b3 is the coefficient for PLCQ-SR squared; b4 is coefficient for the cross-product of PLCQ-SR and PLCQ-OR; and b5 is the coefficient for PLCQ-OR squared. *p < .05: We used an alpha level of .05 for all statistical tests.
Although both models were significant, adding second-order components (Model 2) did not significantly increase R2, therefore indicating that the higher order terms did not significantly account for additional variance in subordinates’ job satisfaction. Instead of a nonlinear relationship between subordinates’ job satisfaction and PLCQ-SR and PLCQ-OR, the present results indicate a linear relationship. Results for the first-order model (Model 1) displayed significant regression weights for both PLCQ-SR and PLCQ-OR.
Rather than directly interpreting the results from the regression analysis, we used the coefficients from the analysis to examine the surface, which corresponds to the regression equations (Edwards, 1993, 1994) to test the hypotheses of this article.
According to Edwards and his colleagues (Edwards & Parry, 1993; Edwards & Van Harrison, 1993), the surface can be described by the following features. The slope of the line of perfect agreement (PLCQ-SR = PLCQ-OR) as related to subordinates’ job satisfaction is given by a1 = (b1 + b2), where b1 is the unstandardized regression coefficient for the centered PLCQ-SR variable and b2 is the unstandardized regression coefficient for the centered PLCQ-OR variable. The curvature of the line of perfect agreement as related to subordinates’ job satisfaction is given by calculating a2 = (b3 + b4 + b5), where b3 is the unstandardized regression coefficient for the centered PLCQ-SR squared, b4 is the unstandardized regression coefficient for the cross product of the centered PLCQ-SR and PLCQ-OR, and b5 is the unstandardized regression coefficient for the centered PLCQ-OR squared. If a1 significantly differs from zero and is positive, then there is a linear slope along the line of perfect agreement (PLCQ-SR = PLCQ-OR) along which subordinates’ job satisfaction increases as PLCQ-SR and PLCQ-OR increase. Furthermore, if a2 significantly differs from zero and is positive, then this surface is curved upward or is convex along the line of perfect agreement. The slope for the line of incongruence (PLCQ-SR = −PLCQ-OR) as related to subordinates’ job satisfaction, indicating the direction of the discrepancy, is assessed by calculating a3 = (b1 − b2). The curvature of the line of incongruence as related to subordinates’ job satisfaction, indicating the degree of discrepancy between PLCQ-SR, PLCQ-OR, and subordinates’ job satisfaction is given by a4 = (b3 − b4 + b5).
In the following, we report the results for the slope of the linear surface model (first-order model) and slope and curvature of the nonlinear surface model (second-order model) and interpret them with regard to the hypotheses. The comparison of the first- and second-order models in the hierarchical regression analysis suggested a linear relationship. Thus, we expected no significant curvature for the surface pattern. See Figure 1 for plots of the estimated response surface patterns.

Surfaces of subordinates’ job satisfaction (JS) as it relates to PLCQ-SR and PLCQ-OR ratings.
In the first-order model (Figure 1.1), we observed a significant slope for the line of perfect agreement (a1 = .71, p < .001), indicating that subordinates’ job satisfaction scores increase as PLCQ-SR and PLCQ-OR increase. The slope for the line of incongruence did not yield significant values (a3 = −.15, p = .380), thus not providing evidence of how the direction of the discrepancy between PLCQ-SR and PLCQ-OR relates to higher or lower job satisfaction scores. The second-order model (Figure 1.2) yielded a significant slope along the line of perfect agreement with no significant curvature (a1 = .60, p = .001; a2 = −.15, p = .470). There was no significant slope or curvature found for the line of incongruence (a3 = −.09, p = .693; a4 = −.18, p = .565).
The results yielding significant positive slopes along the line of perfect agreement support Hypothesis 1a and Hypothesis 1b that state when PLCQ-SR and PLCQ-OR are both high, they relate to high job satisfaction scores of subordinates, and when PLCQ-SR and PLCQ-OR are both low, they relate to low job satisfaction scores of subordinates.
The findings do not, however, offer sufficient evidence to support or reject Hypothesis 2 and answer our Research Question how perceived leadership communication scores relate to subordinates’ job satisfaction when leaders are underestimators. The line of incongruence does not display a significant slope in either of the two models. Thus, it does not justify further examining if subordinates’ job satisfaction is lowest when leaders are overestimators. Although the surface patterns suggest that Hypothesis 2 might be rejected because the estimated surfaces display the lowest scores for subordinates’ job satisfaction when PLCQ-SR and PLCQ-OR are both low, it is not appropriate to compare it with the case when leaders are overestimators (PLCQ-SR is higher than PLCQ-OR).
The research question was posed to examine how PLCQ-SR and PLCQ-OR scores relate to subordinates’ job satisfaction when leaders are underestimators. The absence of a significant slope for the line of incongruence could in part indicate that when PLCQ-SR scores are lower than PLCQ-OR scores, they do not significantly relate to subordinates’ job satisfaction. If this is the case, it presents us with the problem that it is not possible to test Hypothesis 2, which depends on the slope of the same line of incongruence. In conclusion, to clarify how the direction of the discrepancy between PLCQ-SR and PLCQ-OR relates to the outcome, further analysis was necessary.
For this purpose, categories of agreement were analyzed. This method for the analysis of SOA data was recommended by Atwater and Yammarino (1992, 1997) and proposes using a four-group categorization model including overestimators (i.e., PLCQ-SR > PLCQ-OR), underestimators (i.e., PLCQ-SR < PLCQ-OR), in-agreement/good raters (i.e., PLCQ-SR and PLCQ-OR are both high) and in-agreement/poor raters (i.e., PLCQ-SR and PLCQ-OR are both low). The approach using agreement categories inherits the problems associated with difference scores and artificially categorizes continuous ratings but can be considered useful as a secondary method of analysis (cf. Fleenor et al., 2010).
Following the procedure recommended by Fleenor et al. (1996) and Atwater and Yammarino (1997) as described above, we formed the categories for analysis. In-agreement cases were divided into two additional categories. In-agreement/good cases have PLCQ-OR ratings that are above the mean and in-agreement/poor cases have PLCQ-OR ratings that are below the mean. Table 4 displays the frequencies and average ratings of the resulting agreement groups.
Frequencies and Average Ratings of PLCQ-SR Levels Over, Under, In-Agreement/Good, and In-Agreement/Poor With PLCQ-OR Levels.
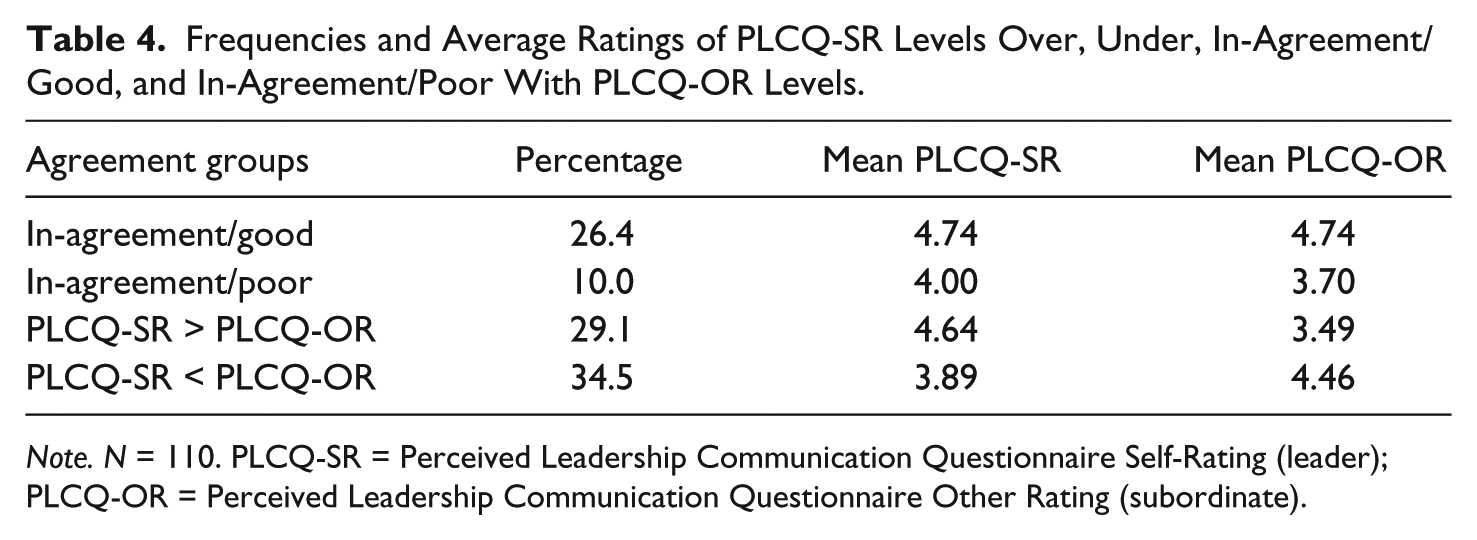
Note. N = 110. PLCQ-SR = Perceived Leadership Communication Questionnaire Self-Rating (leader); PLCQ-OR = Perceived Leadership Communication Questionnaire Other Rating (subordinate).
Univariate analysis of variance (ANOVA) was used to test for differences in subordinates’ job satisfaction between the agreement groups. Univariate F values were computed, and post hoc comparisons of the job satisfaction scores were made using the Tukey’s HSD method. This method controls the Type I familywise error rate and is applicable when cell sizes and variances are unequal (Hays, 1988).
There was a statistically significant difference in subordinates’ job satisfaction scores between all four groups: F(3, 106) = 6.14, p < .001. The effect size, calculated using eta squared, was large (.15), therefore supporting the assumption that the agreement category does indeed have a substantial impact on subordinates’ ratings of job satisfaction. Means, standard deviations, and post hoc significance tests for the four agreement groups are shown in Table 5. The results support Hypothesis 2, stating that subordinates’ job satisfaction is lowest when PLCQ-SR scores are higher than PLCQ-OR scores (i.e., leaders are overestimators). Furthermore, the results indicate that when PLCQ-SR scores are lower than PLCQ-OR scores (i.e., leaders are underestimators), they relate to ratings of subordinates’ job satisfaction that are higher than scores in the overestimator group but lower than scores in the in-agreement/good group.
Means, Standard Deviations, and Post Hoc Significance Tests for the Four Agreement Groups.
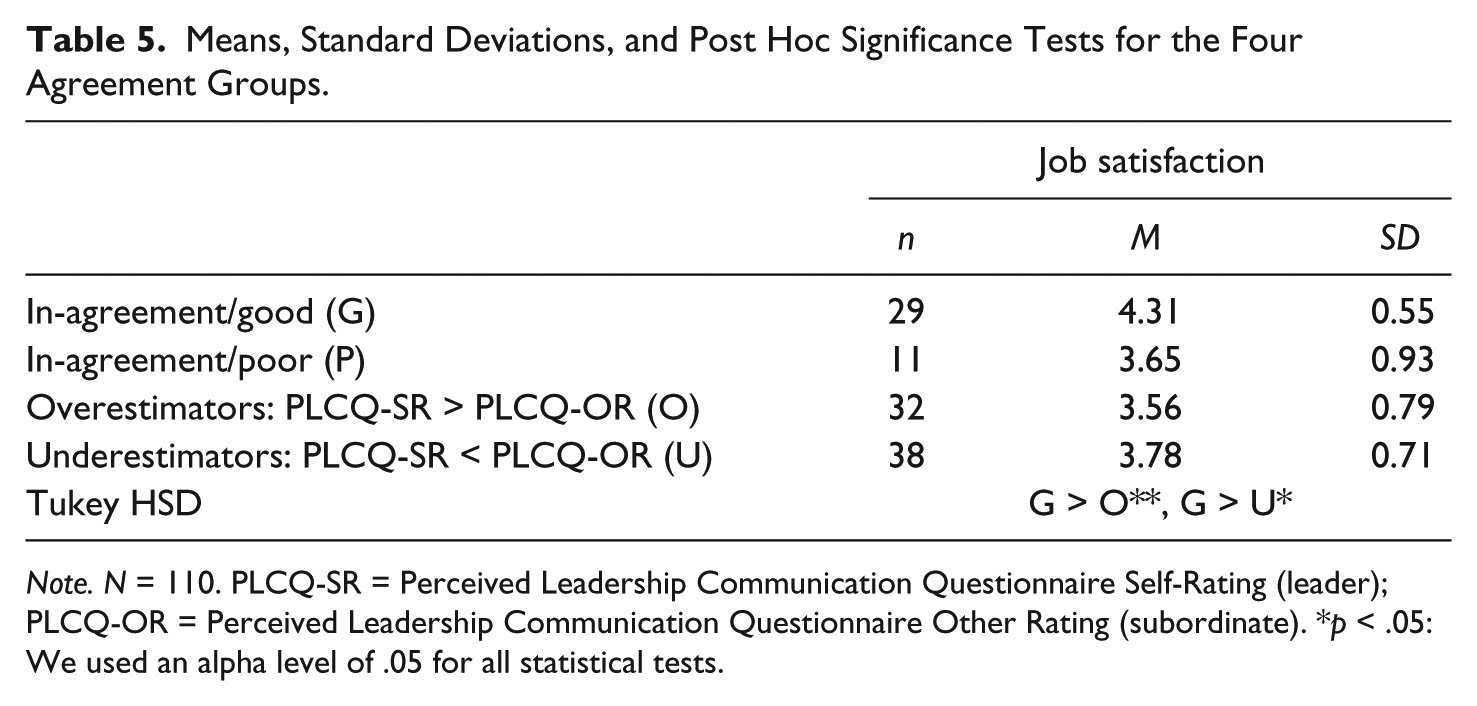
Note. N = 110. PLCQ-SR = Perceived Leadership Communication Questionnaire Self-Rating (leader); PLCQ-OR = Perceived Leadership Communication Questionnaire Other Rating (subordinate). *p < .05: We used an alpha level of .05 for all statistical tests.
Post hoc comparisons using the Tukey’s HSD test indicated that the group with in-agreement/good ratings (PLCQ-SR and PLCQ-OR both high) showed significantly higher job satisfaction scores than the other groups. Furthermore, the in-agreement/good group and the in-agreement/poor group did not significantly differ in their job satisfaction scores (G > P, p = .053). The post hoc comparisons showed no further significant differences between the groups.
Discussion and Directions for Future Research
The findings in this study underline the importance of assessing leadership communication from a perspective that combines the perceptions of both leader and subordinate, as they may in fact differ. Results provide evidence that in-agreement/good ratings of leadership communication relate to high job satisfaction ratings. There is also evidence that disagreement as well as in-agreement/poor ratings are associated with low job satisfaction of subordinates. This is in accordance with previous findings regarding leader-subordinate perceptions of other aspects of communication, such as frequency of communication (e.g., Schnake, Dumler, Cochran, & Barnett, 1990; White, Crino, & Hatfield, 1985).
Although the results presented above deepen the understanding of how SOA in leadership communication may relate to job satisfaction, there are several limitations to this present study that require consideration. In the initial phase of this current research, no assumptions regarding the functional form of the relationship between PLCQ-SR, PLCQ-OR, and subordinates’ job satisfaction were posited. Nevertheless, polynomial regression made it possible to test for the presence of nonlinear relationships. However, because there was no significant increase in R2 when testing the second-order model, there is no evidence for the presence of a nonlinear relationship between the variables. The question whether the relationship between PLCQ-SR, PLCQ-OR, and subordinates’ job satisfaction is indeed linear, requires further research.
Nevertheless, analysis of the form of the relationship between PLCQ-SR, PLCQ-OR, and subordinates’ job satisfaction with polynomial regression and response surface modeling displayed a significantly positive line of perfect agreement for both models (linear and nonlinear). This finding presents conclusive support for Hypothesis 1a and Hypothesis 1b. However, we did not find a significant slope for the line of incongruence. This may be due to lack of distinctness in ratings of job satisfaction for the case when PLCQ-SR scores are higher than PLCQ-OR scores (leaders are overestimators) and the case when PLCQ-SR scores are lower than PLCQ-OR scores (leaders are underestimators). An indication that may support this notion is provided by the subsequent analysis with ANOVA, in which post hoc tests did not find significant differences between the group in which the leader can be considered an overestimator and the group in which the leader can be considered an underestimator. It is, however, too early to conclude that the direction of the discrepancy does not matter when investigating the relationship of PLCQ-SR, PLCQ-OR, and job satisfaction. In polynomial regression with response surface analysis, both forms are assessed with the aid of the same line of incongruence. However, Yammarino and Atwater (1993) suggested that outcomes may be mixed when self-perception is deflated (underestimators). This means that for underestimators, there might be a relationship to positive outcomes as well as to negative outcomes. It is conceivable that some leaders could be underestimators due to constructive self-criticism, which could facilitate positive outcomes, while others could be underestimators due to a lack of self-confidence and insecurity, which in turn could facilitate negative outcomes. Consequently, both opposite processes might suppress each other, therefore explaining why the line of incongruence did not display significant results. Further analysis with agreement groups made it possible to consider each form of disagreement separately.
The results from ANOVA indicated significant group differences and yielded a satisfactory effect size. Also, post hoc analysis provided support for Hypothesis 2, which stated that the overestimator group would have lower job satisfaction scores than the other agreement groups. This is in line with the findings of Atwater and Yammarino (1997), who suggest that overestimators are more likely to be linked to the lowest individual and organizational outcomes. For instance, overestimators may be more likely to ignore criticism (cf. Atwater et al., 1998). It could be an objective of further research to investigate alternative explanations, such as whether a leader who is an overestimator may be more likely to lack employee orientation (cf. Madlock, 2008b) or whether the management style Luthans, Hodgetts, and Rosenkrantz (1988) describe as success management (leaders spend considerable amount of time socializing and networking externally for the sake of their own career) is more often practiced by overestimators.
As noted before, cases in which leaders can be considered underestimators have been posited to relate to mixed outcomes (cf. Yammarino & Atwater, 1993); this leads to an open research question in the case where PLCQ-SR scores are lower than PLCQ-OR scores and how this relates to subordinates’ job satisfaction. The data revealed significant differences between the group in which leaders were considered underestimators and the in-agreement/good group, with the in-agreement/good group displaying the higher mean job satisfaction score. Although not significant, the observation that the mean score for the group in which leaders were underestimators was slightly higher than the mean score for the remaining groups (overestimators and in-agreement/poor) may indicate that leaders who underestimate their leadership communication are preferable to leaders who overestimate their leadership communication or leaders who agree with subordinates about poor leadership communication. As noted above, underestimators may not necessarily be bad leaders. They underestimate their strengths and overestimate their weaknesses but may possibly work harder to compensate their perceived shortcomings (cf. Atwater et al., 1998).
Limitations
Group sizes were rather small, especially the group with in-agreement/poor ratings (n = 11). A larger sample might uncover the smaller differences in job satisfaction between all of the agreement groups. Additionally, alternative samples in different organizational settings could address the shortcomings with regard to the specific structure of the present sample (e.g., the lack of younger employees and the underrepresentation of female employees) and the specifics of the department in which the study was conducted. In particular, future research should also consider settings with more female leaders, because employees may have different expectations regarding aspects of a leaders’ communication competence depending on if the leader is male or female (Mohr & Wolfram, 2008). Furthermore, male and female leaders may differ in the degree of their knowledge of self and willingness to improve (Van Velsor et al., 1993). Moreover, the measures used in the survey displayed relatively high mean values and the range indicated that some participants reached the maximum possible score on all measures. This may indicate a sample-specific ceiling effect. Reduced variance results in reduced sensitivity of the ANOVA. Future research should carefully explore issues related to range in different samples, possibly by expanding the rating scale (e.g., using a 7-point scale instead of a 5-point scale). Overall, results from ANOVA and post hoc analysis need to be interpreted with caution, as all significant differences between the groups emanate from the group with in-agreement/good ratings.
A limitation in the methodology used in the current study may be the fact that leaders’ self-rating scores were distributed across the considerably larger sample of subordinate scores in order to create data pairs that represent the leader-subordinate dyad. This approach was based on insights from LMX theory (Graen & Uhl-Bien, 1995). However, the bulk of research using polynomial regression with response surface modeling follows the procedure of aggregating subordinate ratings into one single score, which is then paired with the self-rating score of the leader (e.g., Atwater et al., 1998; Ostroff et al., 2004). Due to the small sample size of leaders, this approach was not viable in the current study. Disaggregating the leader score down to the subordinate level resulted in multilevel (nested) data, and because of the given nonindependence of the data, it may be arguable that this exceeds the limits of polynomial regression. An attempt to run a polynomial regression model as a multilevel one, in which leaders’ scores are modeled as level-two variables, has to deal with the question of what to do with the cross-product of self-ratings and other ratings (xy term; L. R. Shanock, personal communication, November 18, 2013). Although there is a lack of references on this issue, it is noteworthy that most SOA research uses 360° feedback as data (cf. Shanock et al., 2010), and it is sometimes an open question how many of the same raters are providing multiple ratings of others and how many subordinates are providing ratings of the same leader. Nevertheless, future research should also consider alternative methods of analysis that incorporate multilevel approaches that are appropriate for analyzing nonindependent data structure (cf. Kashy & Donnellan, 2012).
Conclusion
Research on self-perception and others’ perception of leadership communication offers a broad range of questions for further research. For instance, it would be interesting to look at how higher level leaders define “good leadership” (Harris & Schaubroeck, 1988) and investigate the effects of possible disagreements in perceived leadership communication. Finally, Atwater et al.’s (1998) conclusion that “we should continue to investigate just what being an overestimator or underestimator means” (p. 595) still particularly rings true for the field of leadership communication. An unanswered question is what reasons there are for over- or underestimating leadership communication. Is it low self-awareness, as posited by the bulk of SOA research (cf. Eckert et al., 2010)? Or may there be other reasons? Another question is whether feedback can alter SOA, if we observe the development of SOA over time.
The findings in this article deepen the understanding of how the complex processes of communication in a leader-subordinate dyad affect subordinates’ job satisfaction. The results particularly point out the desirability of congruent positive perceptions of leadership communication as a clear indicator of high job satisfaction of subordinates. This has practical implications for the teaching and training of leadership communication. Organizations may want to develop supervisory training programs that enhance the communicative behaviors of leaders and also sensitize leaders for the perceptions of their subordinates.
Footnotes
Declaration of Conflicting Interests
The author(s) declared no potential conflicts of interest with respect to the research, authorship, and/or publication of this article.
Funding
The author(s) received no financial support for the research, authorship, and/or publication of this article.