
Abstract
The goal of the present research is to determine the degree of correspondence between the observed behavior in an experiment and the attitudes expressed in a questionnaire administered after an experiment. To do so, we replicate Driskell and Mullen’s study using more data from multiple experiments and conduct more sophisticated analyses. The attitudinal measures are questionnaire items regarding study participants’ views of themselves, a partner, and their task performance, measured after interaction. The behavioral measure records the participants’ resistance to influence from their partners and is thought to reflect underlying expectations for competence. Using confirmatory factor analysis, we find that there is a strong relationship between attitude and behavior, such that they appear to represent a single construct. Implications of this finding for experimental methodology are discussed in support of more concise approaches.
Introduction
There is a long history of studies comparing individuals’ attitudes and their behaviors. Psychologists, sociologists, public opinion researchers, and political scientists have all addressed this issue in various ways (see Schuman [1994] for a thorough review of attitude and behavior research). In this article, we examine the relationship between attitudes and behaviors in a particular setting: the sociological experiment. One benefit often touted regarding experiments is the ability to observe behavior and not to have to rely on self-reports, such as attitude measurements. The question then becomes, what is the relationship between the observed behaviors and self-reported attitudes? Given that it is not always possible to measure behavior, the goal of this article is to answer the question of how attitude and behavior measures of the same concept correspond, extending previous work by Driskell and Mullen (1988).
Researchers have argued that the process of measurement affects the observed correlations between attitudes, behaviors, intentions, and beliefs (Feldman and Lynch 1988; March 1956). For example, researchers can create attitudes that did not previously exist in participants just by merely asking questions about the attitudes (Fazio, Zanna, and Cooper 1978). These newly formed attitudes can in turn change future behavior of participants. More specifically, Kalkhoff and Thye (2006) found in their meta-analysis of research related to expectation states theory that protocol variations can significantly change the results of a sociological experiment. As these variations can affect the results, it is crucial that researchers are aware of them.
The purpose of this article is to show that, for practical reasons, researchers should consider carefully what they are measuring and how they measure it when conducting experiments. For example, we believe that prior to conducting experiments, it is important to consider the nature of the outcome (i.e., attitude, behavior, intention) and its relationship with the nature of the predictors. Per Saylor’s (2013) suggestion, we would like to begin this dialogue to create measurement norms within our discipline. We focus on one particular (though common) type of sociological experiment—the standard setting for tests of expectation states theory.
Past Research on Attitudes and Behaviors
In a sociological experiment, a behavior or set of behaviors is often the primary measure of the dependent variable(s). In fact, the experimental design was intended to measure behavior. However, attitudinal measures are frequently collected during experiments as well. As Driskell and Mullen (1988) rightly point out, attitudes is a very broad term as it is used in social scientific research. Here, we will use “attitudes” to mean self-reported beliefs about self and others. Numerous studies have found that there is a high correlation between such attitudes and behaviors in these settings (e.g., Leone, Perugini, and Ercolani 1999; Wallace et al. 2005). Kim and Hunter (1993) calculated in their meta-analysis a strong overall correlation between attitudes and behaviors (r = 0.79). The correspondence is described by Ajzen and Fishbein (1977) through the evaluation of the target, action, context, and time elements of the entities denoted by the attitudes and the behaviors. Ajzen and Fishbein (1977) have added that whenever attitudes and behaviors do not correspond to one another, the results of the study do not add much to our understanding of social phenomena. More specifically, attitudes that have a low correspondence to the target behavior have a lowered utility because they do not make a significant contribution to the prediction of that behavior.
Ajzen and Fishbein (1977) went so far as to suggest that attitudes do not add much to our understanding of social phenomena even if they are measured in a sophisticated manner. Supporters of this view contend that attitudes are not stable and participants can change their attitudes mid-experiment to complement their behavior (Wilson and Hodges 1992). Therefore, the argument goes, attitudes should never replace behaviors in sociological experiments because attitudes are not synonymous with behaviors (Kraus 1995), and if researchers only wanted to use one of them, rather than only using the attitude, it is better instead to only use the behavior.
Recently, there has been a call-to-action in the literature to focus more on the dimensions and complexity of the behaviors that we are studying rather than the attitudes that correspond to them (Johnson and Boynton 2010; Wallace et al. 2005). This call-to-action extends to all behavioral sciences as Baumeister, Vohs, and Funder (2007) suggest that researchers should “try to put a bit more behavior back into the science of behavior” (p. 401). Due to the response error of self-reports (Wyner 1980), researchers have suggested to validate self-reports by either collecting data from multiple informants (Crandall 1976) or by directly observing the behavior (Armitage and Conner 2001). Numerous studies across varying disciplines have found that there is a discrepancy between self-reports of behavior and observed accounts of how people actually behave (Connelly, Khalil, and Liu 2007; Corral-Verdugo 1997; Jenner et al. 2006; Lichtman et al. 1992). We echo these concerns and suggest that we draw more attention to observed behaviors in sociological experiments, with the confidence that the focal observed behavior assesses the same underlying construct in question.
We would like to briefly mention that historically experiments have been criticized for being too artificial and lacking naturalism; results from experimental studies tend to have questionable generalizations because their findings do not truly reflect how people act in the “real world.” However, we believe that the behaviors we observe in the laboratory are real in the sense that real people are behaving in a real manner and even if they are in highly controlled conditions, we still can gather meaningful theoretical knowledge from laboratory experiments (Falk and Heckman 2009; Mook 1983). We therefore strongly believe that sociological experiments are an appropriate and satisfactory method for this field of research.
Attitudes and Behaviors in Expectation States Theory Research
Driskell and Mullen (1988) were concerned that other researchers had underestimated the relationship between attitudes and behaviors by ignoring the situational factors that may mediate the likelihood that attitudes may predict behaviors (or vice versa). They were interested in examining how self-reported (attitude) measures related to behavioral measures of expectations in the experimental setting. Driskell and Mullen conducted an analysis of eight experimental studies that contained both behavioral and attitudinal measures of an individual’s expectations for competence within a small group. The behavioral measure in most of the studies was the proportion of disagreements resolved in favor of self (P(s)). One study used allocation of task responsibility rather than P(s). The attitude measures varied, but often included measures about self and partner on ability on “most tasks” or similar items. They found that self-reported expectations did correlate with behavior significantly and with a moderately sized effect.
One important point that Driskell and Mullen (1988) made is that often attitudes are measured after behavior in experiments. This could indicate that a cognitive process of consistency is what is actually determining the attitudes (i.e., the participant thinks, “I recently behaved in X way, therefore I must believe X,” rather than “I believe X, therefore I will behave in X way”). However, in one study included in their analysis (Driskell 1982), the attitudes measured were completed before the task on which behaviors were observed. They found that the relationship between attitudes and behaviors did not differ in this situation, when attitudes were measured first rather than last.
Driskell and Mullen’s (1988) analysis was limited by its necessary reliance on the very few attitude measures collected in the studies they analyzed. As those measures were not the focus of those studies, they were not given much attention. Our research adds a novel contribution by examining a long list of attitudinal measures of various kinds, including ones pertaining to status, expectations, affect or sentiment, and satisfaction. Although we are most interested in the items intended to measure expectations, we include all attitudinal measures for a stronger test. In addition, we use data from three more recent experiments and conduct more sophisticated analyses.
The Current Study
We report findings resulting from a comparison of attitudinal questionnaire measures with a behavioral measure in a small group setting. We are interested in measuring the underlying expectations that people hold that lead to some individuals having more influence in a small group than others. Subjects participated in dyads in a study on disagreement resolution on a binary choice task. The behavioral measure, P(s), is the proportion of disagreement trials in which the participant resolved the disagreement in favor of self (resistance to influence) rather than in favor of the partner. This resolution process is believed to be a behavior that reflects underlying expectations for competence.
After completing the behavioral portion of the study, participants complete a postexperiment questionnaire assessing their perceptions, attitudes, and feelings. The questionnaire asks each participant about his or her own and the partner’s perceived ability, measures a series of affective responses, assesses the participant’s strategies, and measures attitudes toward the task. Combinations of these measures allow us to assess the participant’s attitudes about who was competent and influential.
Methods and Measures
Study participants worked with a partner to solve problems on a binary task. When disagreements occurred, participants could resolve the disagreement either in favor of self (i.e., stick to one’s own initial answer) or in favor of the partner (i.e., change to the partner’s answer). Our behavioral measure, also called the proportion of stay response or P(s), captures the resolution of disagreements in favor of self, or resistance to influence. The inverse, resolution of disagreements in favor of partner, could also have been used. We chose to use the measure that is generally reported in studies of this kind for the sake of familiarity. Hence, P(s) is a behavioral measure of the resistance of social influence. In a dyad, it is therefore also a measure of one’s own social influence, and social influence is an instantiation of one’s power and prestige order, as predicted by the theory. If participants have high performance expectations from partners who are believed to be competent, then participants are more likely to be influenced by their partners’ responses and favor the other over the self when resolving disagreements. Participants also completed a questionnaire with attitudinal and affective measures related to their expectations about their own and their partners’ performance after they completed the interaction portion of the study.
For the experiments used here, we adapted a laboratory experimental design used in more than 250 studies of status. Our data are taken from the control or baseline conditions of three studies. Each of the three studies had two control conditions with matched pairs of individuals, one high status and one low status working together. Study participants were 174 college students (male = 51.7%) aged 18 to 22.
Each participant entered the laboratory individually and was escorted to a small room containing a television, video camera, computer with mouse, and monitor. After the participant completed the consent form and a short sign-in form on the computer, the experimenters introduced themselves on the television. The participants were asked to introduce themselves, and the monitor showed the purported partner as if he or she were seated in another small room in the laboratory. In reality, the purported partner was on videotape. The purported partner claimed to be a student at the same university. The television then showed the participant live as he or she introduced himself or herself. Instructions, including independent variables and the theory’s scope and initial conditions, also come from videotape shown on the television. These secondary data were collected to test ideas from status characteristics theory as part of primary projects (Walker 2014; Walker, Webster, and Bianchi 2011; Webster, Whitmeyer, and Rashotte 2004).
The experimenters explain in detail the task on which the participants will work. The participants work on a judgment task, called contrast sensitivity, which involves a series of binary choices. Each trial presents participants with a slide consisting of two complex black and white checkerboard patterns, and they are asked to choose the pattern containing more white area. In reality, the patterns both contain the same amount of white area, making this task highly ambiguous. After each person registers an “initial choice,” that information is exchanged and, after further study, each person makes a “final decision.” Final decisions are not exchanged.
Because communication is controlled and the partner is simulated, most of the trials tell participants that their partners disagreed on initial choices. Each participant works on 23 slide trials; for 20 trials, a disagreement on initial choices is presented. Each person thus is faced with resolving disagreements in favor of self or other when making a final decision. The proportion of disagreements resolved in favor of self, P(s), is a generally accepted measure of a person’s relative performance expectations or influence. The higher a person’s expectations for self in comparison with expectations for other, the higher will be the P(s) that person displays and the less influential the partner is seen to be. We will be using P(s) as our behavioral measure of expectations.
After completing the slides, each participant filled out a questionnaire asking for general impressions and feelings (see the specific wording of items in the online appendix). This questionnaire was completed on the computer. Each question was presented individually on the screen. Participants were told to take as much time as they needed to answer each question. The measures on this questionnaire fell into several basic categories: factors that affected their decisions, their attitude about their partners, their attitude about their task performance, and their overall satisfaction with their partners and the task. Thus, we are adding to what Driskell and Mullen (1988) did, as they only examined expectations as their attitudinal measures.
The first five questions (1–5) asked participants about how important various factors were to them as they were making final decisions: his or her own initial choice, the partner’s initial choice, getting the right answer, sticking with his or her own initial choice, and changing to agree with the partner’s initial choice. The first two questions asked directly about the importance of the participant’s own initial choice and the importance of the partner’s initial choice, respectively. The items were rated on a 7-point scale with 1 being marked extremely important and 7 being marked extremely unimportant.
The next five questions (6–10) were about impressions of the partner. Participants were asked to rate the partner in terms of how sure of himself or herself one was, assertiveness, likeability, fairness, and reasonableness. These measures were all affective in nature. Of course, the partners were controlled; all participants in a given condition saw the same purported partner. These items were also rated on a 7-point scale with 1 representing the extreme high positive end (e.g., extremely likeable) and 7 representing the extreme low negative end (e.g., extremely unlikable).
Questions 11 to 12 measured the participants’ impressions of the task they had just worked on, contrast sensitivity. Questions 16 and 19 also addressed satisfaction, with what the participant and partner accomplished and with overall participation, respectively. Once again, these items were rated on a 7-point scale with 1 representing the extreme high end and 7 representing the extreme low end.
In Questions 13 to 15, each participant was asked to rate the performance of the team on contrast sensitivity. In Questions 13 and 14, the participant assessed his or her own and the partner’s ability on a 7-point good-to-poor scale, respectively. For Question 15, the participant was asked to compare his or her own ability with the partner’s, with a score of 1 representing the extreme of I have more ability than my partner.
Questions 17 and 18 also related to ability. Here, participants were asked to think about what would happen if they and the partner worked on the task again, individually this time. Responses took the form of predictions about how many correct answers each person would get on 20 trials.
At the end of each group, we interviewed each subject separately. The interview has three purposes: (1) to ascertain that the experiment successfully realized all crucial conditions, (2) to explain fully all aspects of the design and reasons for them, and (3) to answer any questions a participant may have about participation. Finally, participants were thanked and paid for their time.
Conceptual Models
We test three conceptual models. In the first model, shown in Figure 1, the behavior and all of the attitude items capture the same underlying construct. This model contains only one underlying concept: performance expectations that can be measured by both the participant’s enacted behavior as well as the participant’s postexperiment attitudes. This model is of particular importance because it demonstrates attitudes and behaviors loading on the same factor and is therefore measuring the same underlying construct.
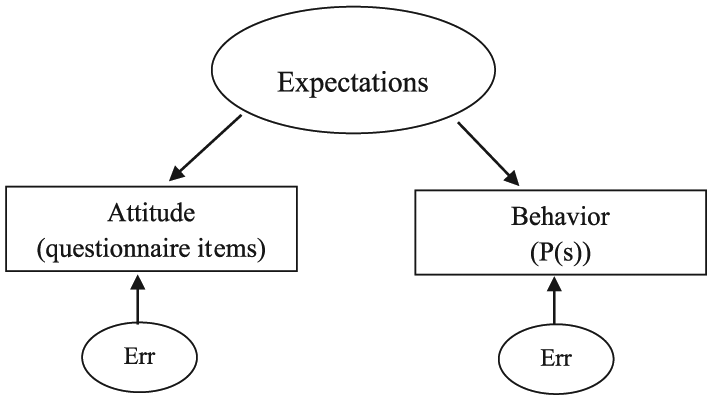
One-factor model.
In contrast, Figure 2 shows a model where the two measurements capture different underlying constructs. In this model, the enacted behavior captures the participant’s underlying expectations, but unlike the first model, the attitudes capture some other experiential outcome that has to do more with the study design and less with theory testing. This model reinforces past research practices that suggest both behavioral and attitudinal measurements as it demonstrates that they are both measuring different constructs.
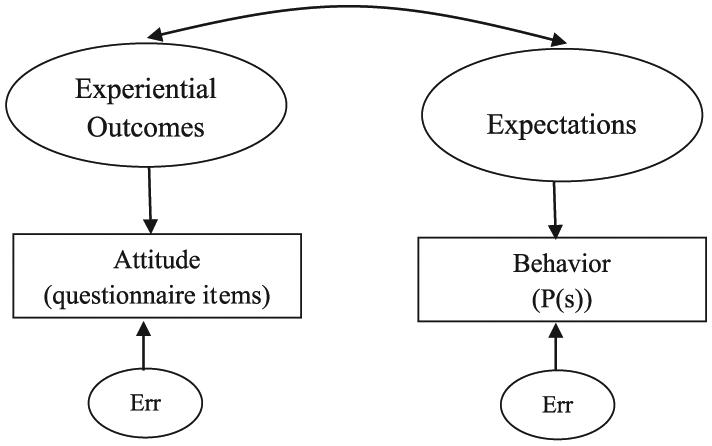
Two-factor model.
Our third and final model, shown in Figure 3, captures three different underlying constructs. The enacted behavior is still capturing expectations, but the attitude items are now divided into socioemotional and performance outcomes. This model further emphasizes the importance of retaining all types of questionnaire items because each one is providing us with unique, task-specific information.
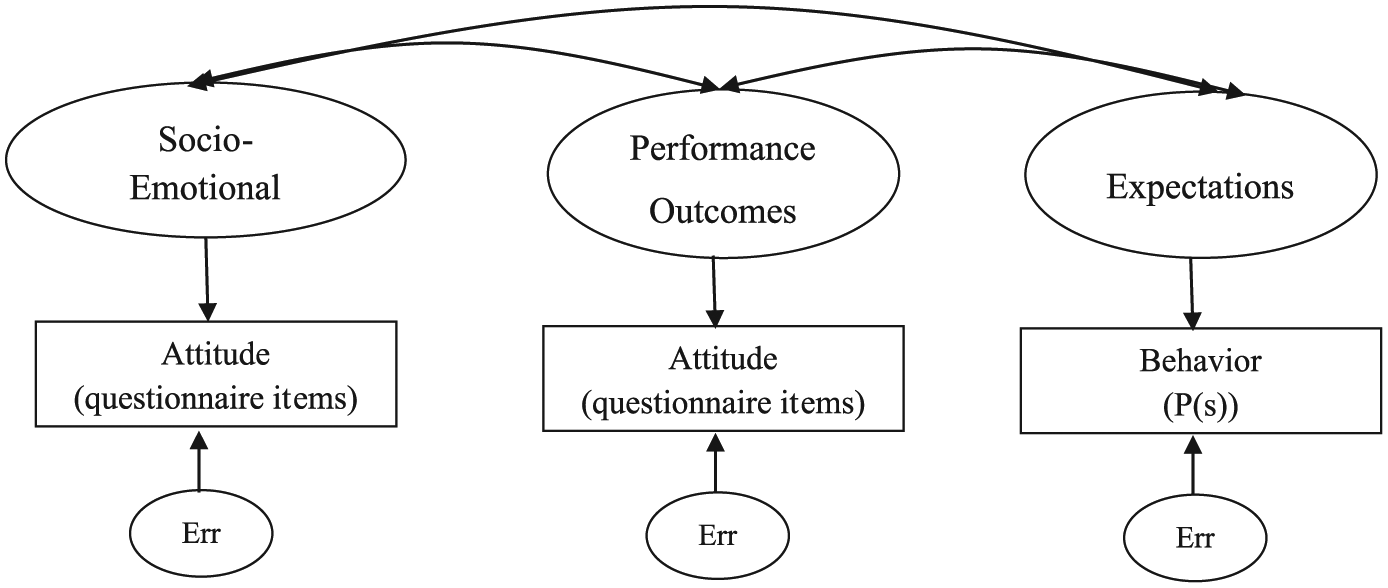
Task-specific model.
Data Analysis Plan
We will first conduct an exploratory factor analysis to discover which one of our three conceptual models best fits the data. Then, through a confirmatory factor analysis, we will examine whether the observed behavior (proportion of stay response) will load on the same factor as its related attitudes to test the correspondence with the attitude items.
Analysis and Results
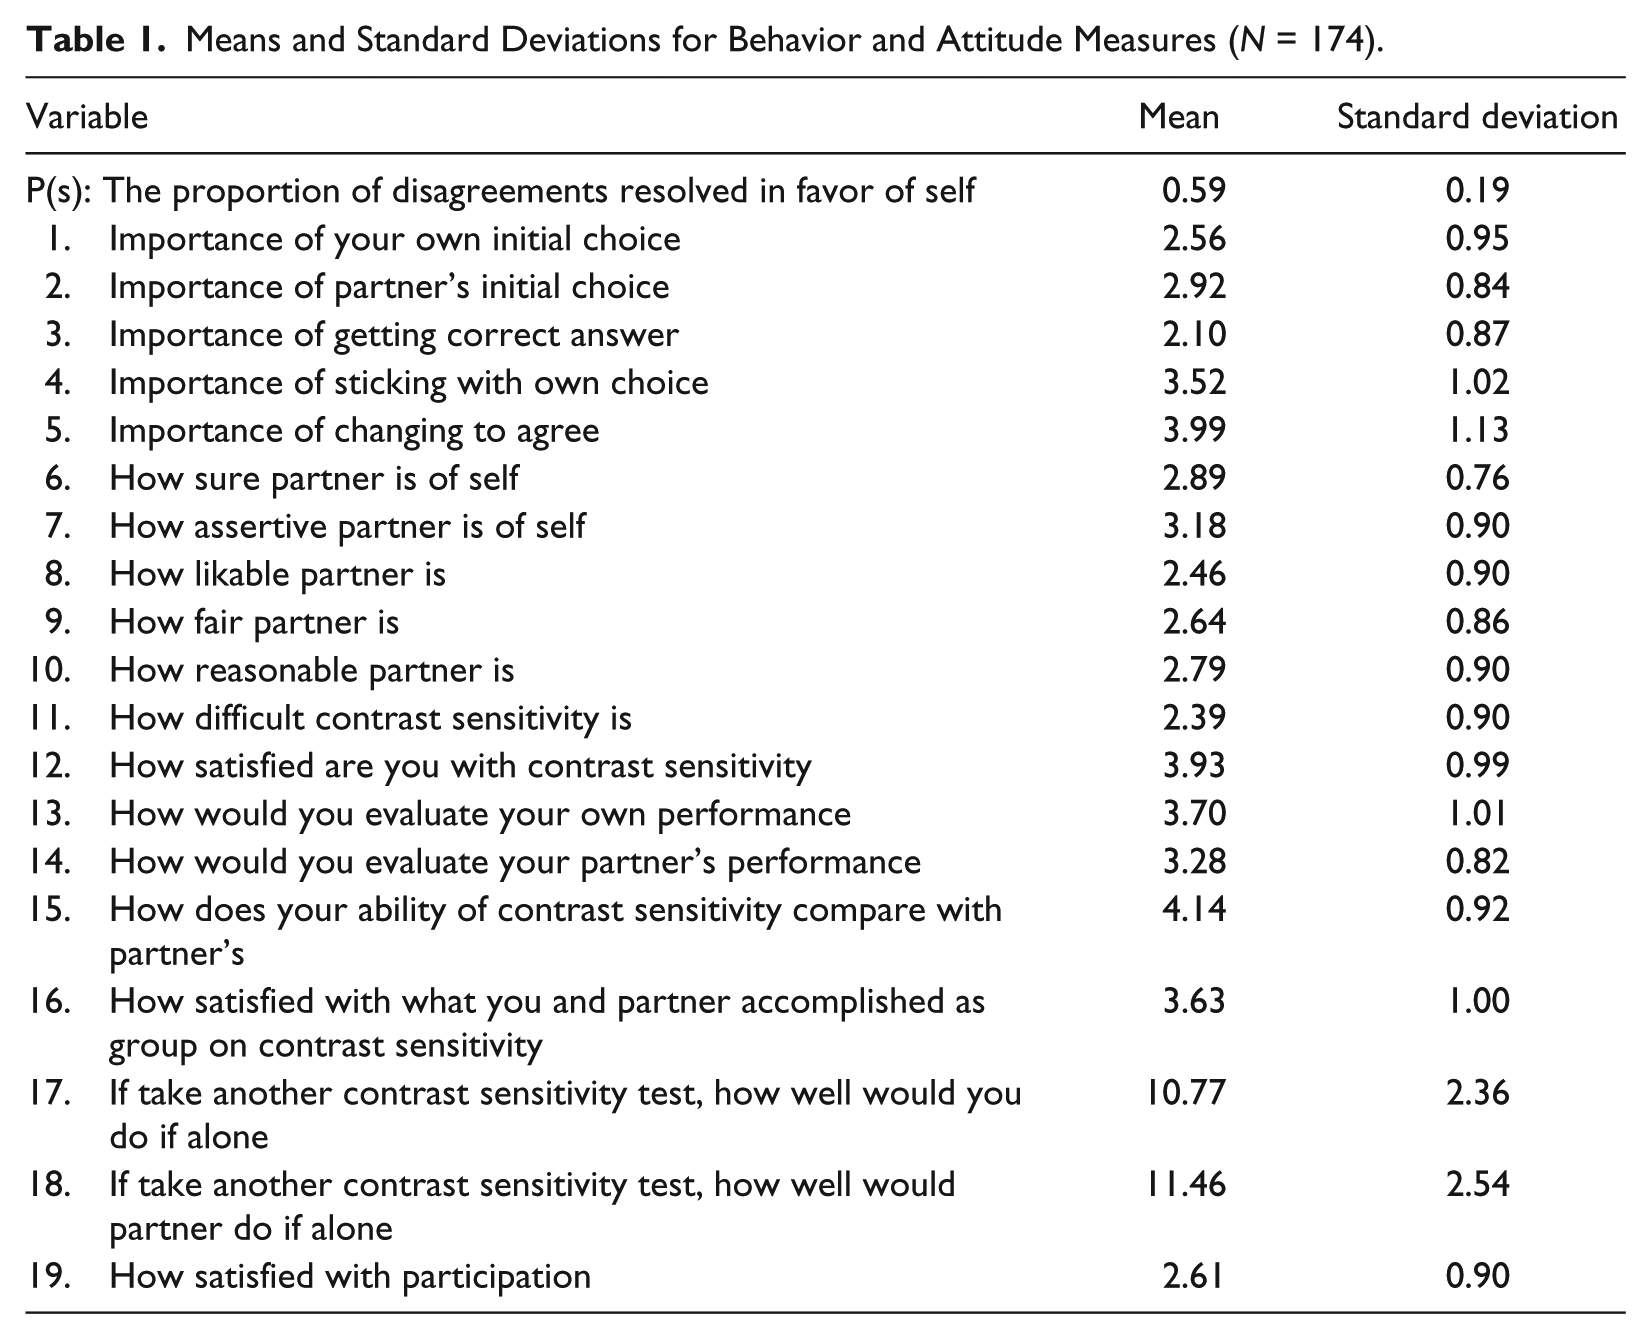
The means and standard deviations for both types of measurements are presented in Table 1. On average, participants stayed with their original response after a disagreement 59 percent of the time. Participants tended to evaluate their own performance (3.70, SD = 1.01) higher than the evaluation of their partners’ performance (3.28, SD = 0.82).
Means and Standard Deviations for Behavior and Attitude Measures (N = 174).
Because our main interest in these data is determining whether the observed behavior and the attitude items capture the same underlying construct, we begin with a traditional principal components analysis (Figure 4). Using the traditional scree criteria, this solution indicates that there are six underlying factors across all study variables. The first eigenvalue, 4.67, is clearly greater than the rest, suggesting that the first component is more pronounced than the others. In addition, the second and third components seem to be more pronounced than the remaining components. Based on this principal components analysis, we would conclude that the variables would best fit in a three-factor model.
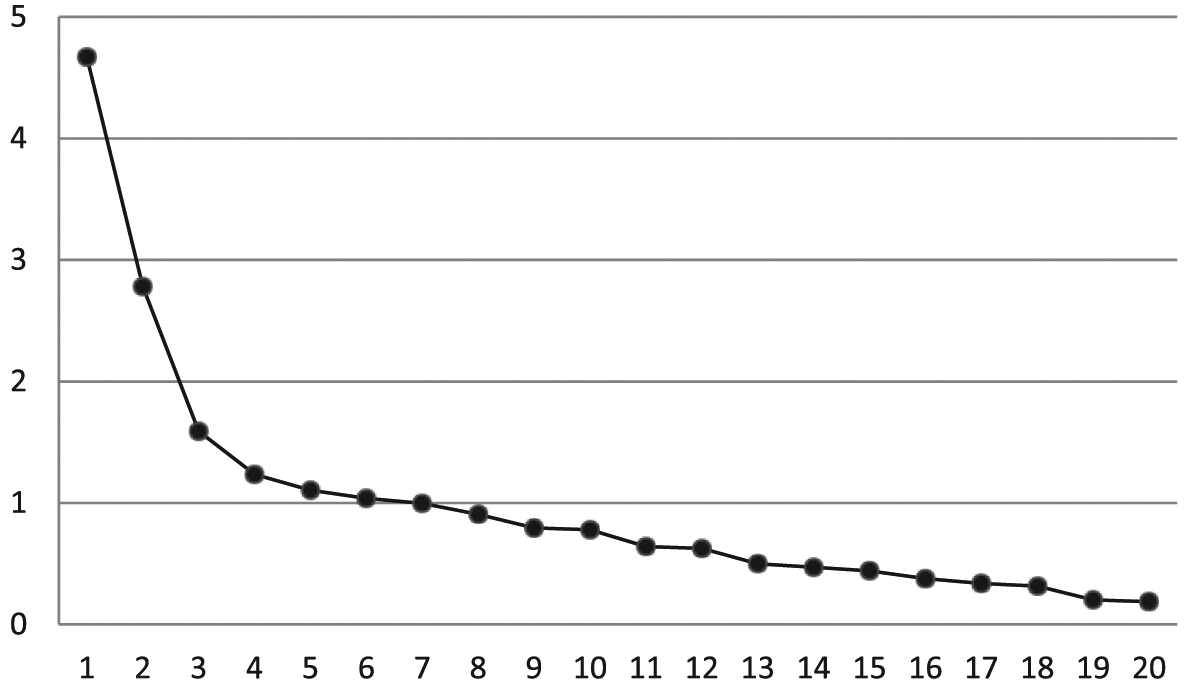
Eigenvalues for principal components analysis of all study variables.
We then performed a series of confirmatory factor analyses to test our three conceptual models. Tables 2, 3, and 4 present the factor loadings from the confirmatory factor analyses using one, two, and three factors. When examining these results, we paid close attention to the placement of the behavioral measure, P(s), to gain a better understanding of how it relates to the attitudinal measures in the study.
Factor Scores from One-factor Confirmatory Factor Analysis (NFI = 0.47).
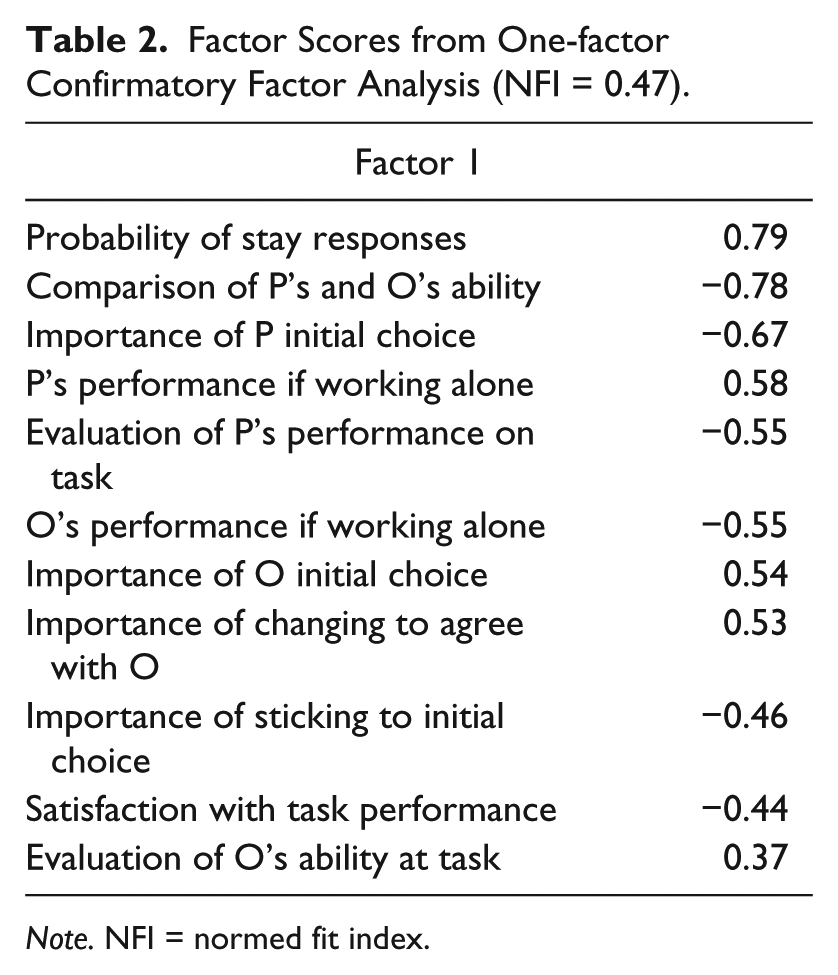
Note. NFI = normed fit index.
Factor Scores from Two-factor Confirmatory Factor Analysis (NFI = 0.68).
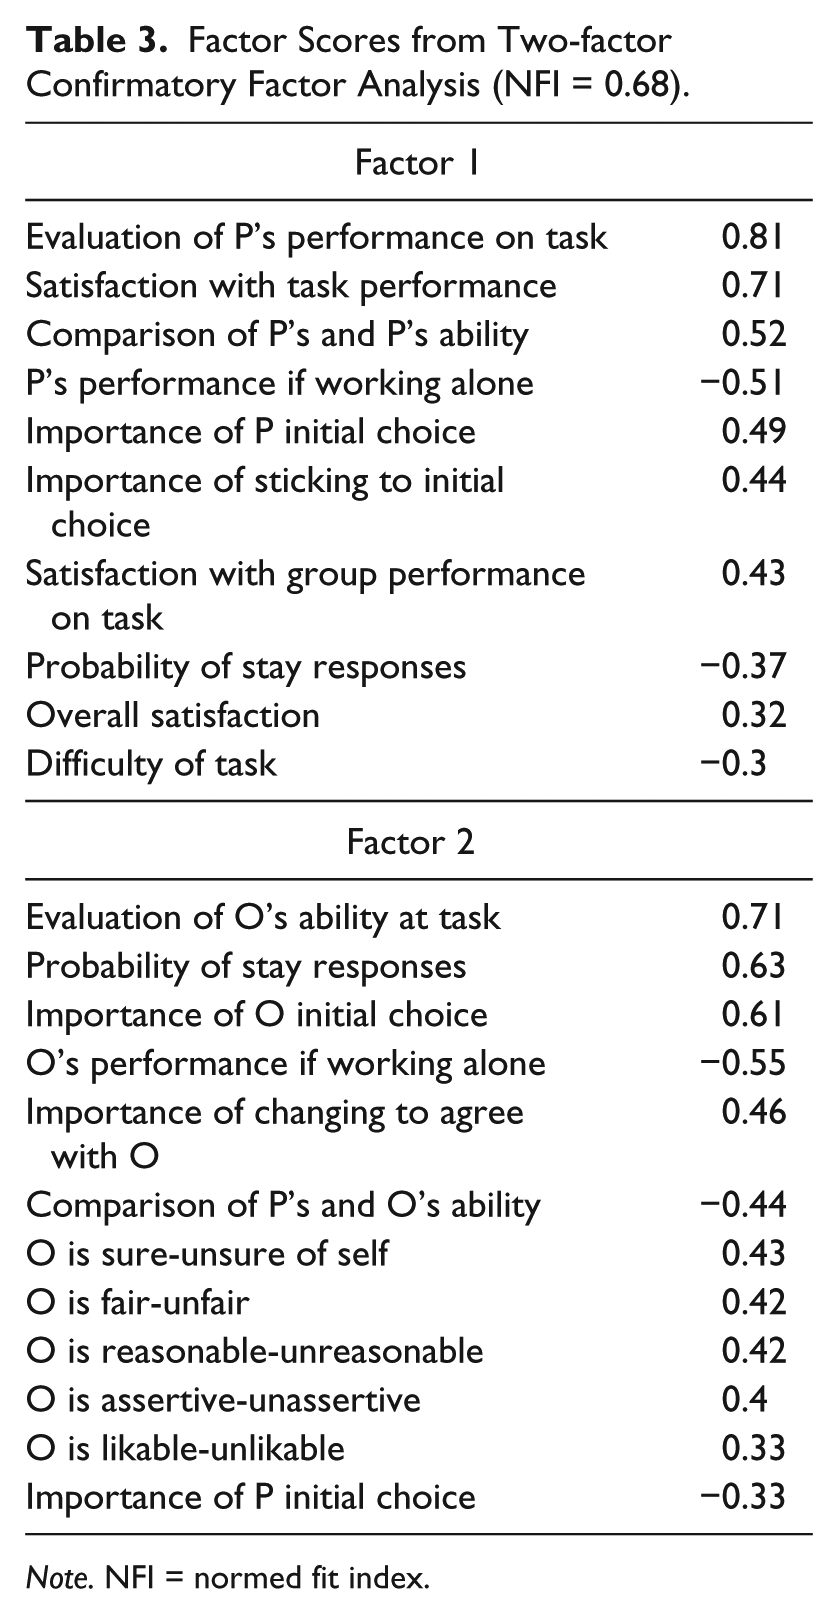
Note. NFI = normed fit index.
Factor Scores from Three-factor Confirmatory Factor Analysis (NFI = 0.79).
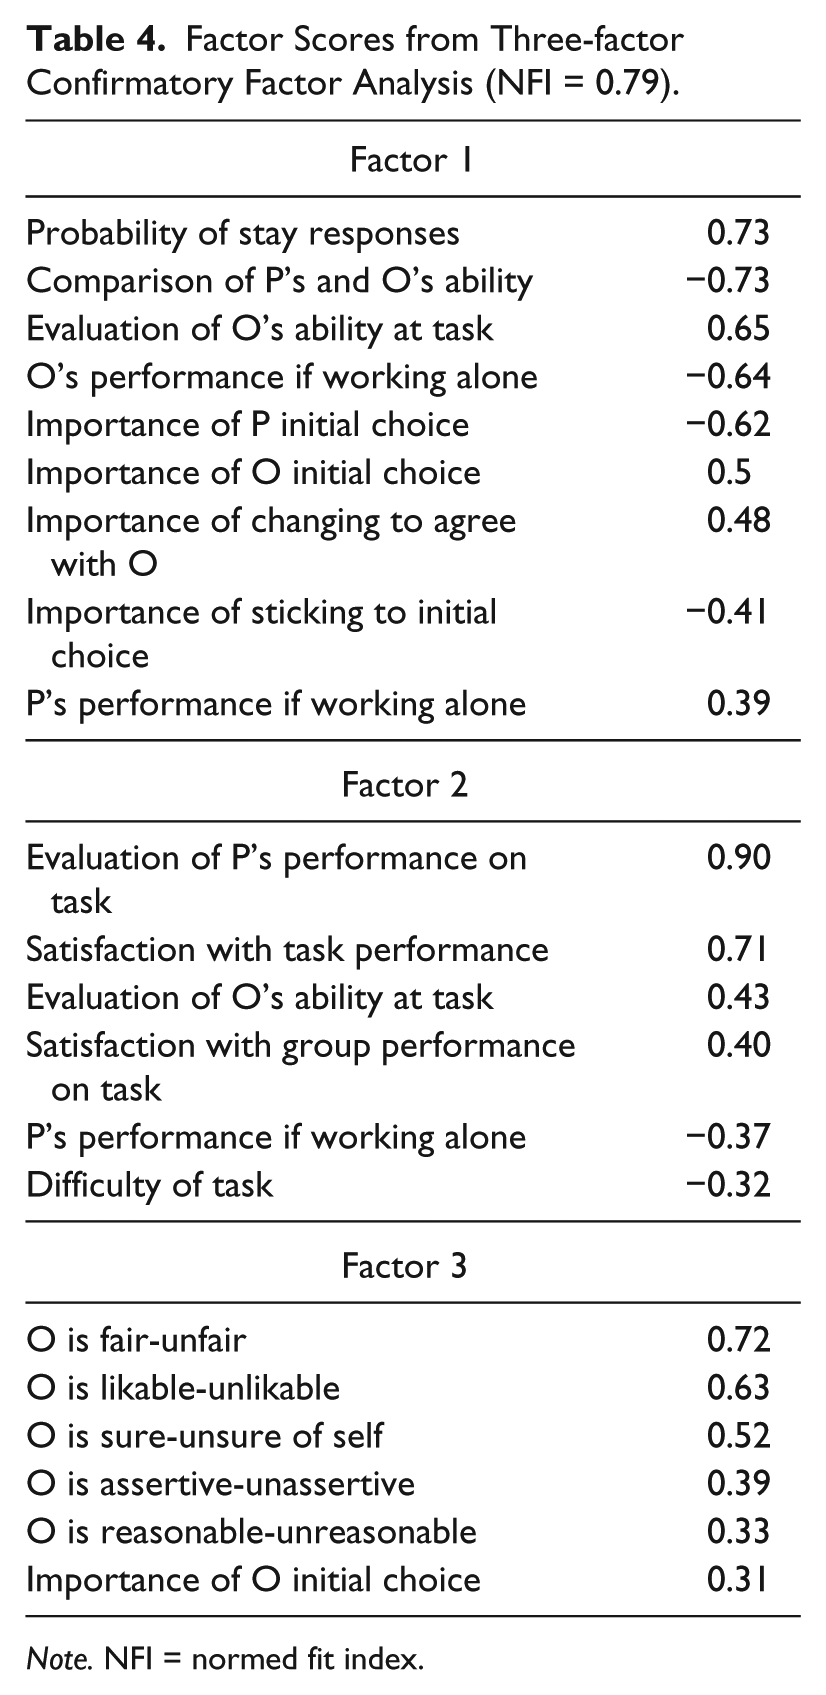
Note. NFI = normed fit index.
Table 2 shows that 11 out of the 20 study variables load on one factor. This model had a chi-square value of 1,061.86 and a normed fit index (NFI) value of 0.47. In our conceptual model (Figure 1), we expected that this factor is the participants’ underlying expectations of their partners’ performance. On close examination of the 11 variables that load on this factor, we believe that this conceptual model fits the data.
Our two-factor confirmatory analysis in Table 3 (χ2 = 392.65, NFI = 0.68) shows how more variables load on the second factor than the first factor. Of particular importance to us is the loading of P(s); it loads on the second factor along with variables that are conceptually related to it, such as the evaluation of partner’s ability on the task and the importance of partner’s initial choice. The first factor derived from this analysis seems to be measuring the overall experience with the task, which is not conceptually related to the expectations construct.
Last, Table 4 provides good support of the third conceptual model as it shows that the second factor consists of variables related to the task performance while the third factor consists of variables related to socioemotional outcomes. The first factor relates to the participants’ underlying expectations, as it contains both the behavioral measure and the conceptually related attitudinal measures. This third model had a chi-square value of 218.52 and an NFI value of 0.79, which is the best fit of the three models.
In sum, Tables 2, 3, and 4 all show that P(s), which is our behavioral measure, has one of the highest loading scores in every confirmatory analysis. It is clearly and consistently grouped with the attitude measures that conceptually are most closely related to expectations and influence. All three conceptual models receive some support.
Conclusion
Our goal was to determine if there is a correspondence in the measures of attitudes and behaviors in the experimental setting. Instead of only focusing on expectations as the attitudinal measure that corresponds to the target behavior, we expanded on Driskell and Mullen’s research by including at a broader range of attitudes. We also used updated data and more sophisticated analytical techniques.
However, our results do not present a single, clear-cut answer to our question. We used confirmatory factor analyses to attempt to support our belief that similar attitudes and behaviors load on the same factor, and thus measure and load on the same construct. All three of our conceptual models received some support from the factor analyses, indicating that there could be nuanced differences between behavioral and attitudinal data in experiments that should be measured separately.
As the theory we used does not currently predict socioemotional attitudes, we believe that this difference can be explored empirically in future research. The single-factor model is the closest to what the theory currently predicts, but receives the least support. However, the items that load most strongly in that model, and which hang together as a factor in the other models, are the items we would expect from the theory.
One possible implication of our findings is that it may be possible to remove some, or possibly all, attitude items from these types of experimental protocols that include a measure of behavior. Researchers can save the participants’ time and reduce fatigue by not asking them to stay longer than needed for scientific purposes. This implication echoes the calls discussed above for more of a focus on behavioral measures, and it may only be generalizable to experiments in the status realm.
However, another implication of these findings is support for the validity of attitude measures. Although the behavioral measure loaded most strongly in two of the three models, and second highest in the other model, many of the attitudinal measures also loaded strongly on the expectations factors. In cases where a behavioral measure is not practicable, similar attitudes measures may provide important data regarding certain concepts.
Footnotes
Declaration of Conflicting Interests
The author(s) declared no potential conflicts of interest with respect to the research, authorship, and/or publication of this article.
Funding
The author(s) disclosed receipt of the following financial support for the research, authorship, and/or publication of this article: Support for this research was provided by National Science Foundation grants SES 9911135, SES 0317985, and SES 0718293.