
Abstract
Why do I work? Despite instructors’ best efforts, students struggle to understand how different people answer this question differently. This exercise enables students to explore what motivates them in comparison to their peers and previous generations while reinforcing the distinction between intrinsic and extrinsic motivation. Students prioritize job reward factors, share their rankings to appreciate that people are motivated differently, and are given archival data to appreciate changes in workplace dynamics. This simple but thought-provoking exercise fosters rich discussions of intrinsic and extrinsic motivation, self- and other-awareness, changes to the nature of the workplace, and differences in demographics, including generational age cohort, gender, and job level. This exercise is suitable for management or organizational behavior courses at both the undergraduate and graduate levels, using face-to-face and online formats, and synchronous and asynchronous modalities.
Understanding how employees are motivated by different factors has been a topic that we have struggled to make concrete for students. To help facilitate student learning, we developed an exercise asking students to take and reflect upon a data collected in survey that has been used since the 1940s (Kovach, 1995) in which they rank job reward factors, share and justify their rankings with their peers, and then compare their rankings to archival data. The exercise can be used as a basis for informed discussions of motivation differences between employees, over time, and across generations. It is applicable to courses on Principles of Management, Organizational Behavior, Managing Diversity, Human Resource Management, and Careers covering topics, such as extrinsic and intrinsic motivation, self- and other-awareness, changes in the nature of work, and demographic differences. The exercise is zero-cost and easy to facilitate. The debrief can be conducted during live instruction, whether face-to-face or online, or via asynchronous discussion boards.
Theoretical Foundation and Teaching Implications
Motivation is one of the oldest concepts in management studies because it addresses the fundamental question of why people work from the perspective of both employers and employees (e.g., Kanfer et al., 2017). One of the key distinctions in motivation theory is between intrinsic and extrinsic motivation, which students tend to grasp on a surface level but struggle to apply (Blair & Shaver, 2019). Employees’ reasons for working are varied, including both extrinsic factors like earning a paycheck and having the opportunity to move up a career ladder, and intrinsic factors, such as a source of identity and purpose (Wrzesniewski et al., 1997). One way to help students understand the distinction between intrinsic and extrinsic rewards is to make this information personally relevant to them (Anderson, 2007). When students rank-order different reward factors, they are able to learn more about their own personal motivations.
Giving students the opportunity to reflect on what motivates them and then compare their answers to others’ answers can help them better understand how people are motivated so differently. This insight is helpful for instructors because, based on our experience, it is difficult to make this point salient for students, and such data are rare. In addition, having students think through different reward factors and categorize them as intrinsic or extrinsic deepens their understanding of these concepts.
Adding demographic differences into students’ understanding of motivation further enriches their comprehension. People are motivated by different factors at different life stages. Older workers are not more or less motivated than younger workers; they are just motivated differently. Research has shown that extrinsic rewards are negatively related to age as older workers find intrinsic rewards more motivating than younger workers (Inceoglu et al., 2012; Kooij et al., 2011). In terms of gender, women place a greater value on having supportive colleagues and supervisors as well as working with and helping others (Warr, 2008). Women also value intrinsic rewards including prosocial and interpersonal aspects, and work-life balance, whereas men tend to value extrinsic rewards like higher wages, power, achievement, and career opportunities (Lechner et al., 2018).
Job level can also be a differentiator. Research finds that lower-level employees have higher extrinsic motivation and lower intrinsic motivation than higher-level employees (Deal et al., 2013). This discussion of demographics is particularly important because, as we have seen in our own classes, students often have an oversimplified and potentially stereotypical understanding of the impact of demographics. Showing real data in class allows for a more informed discussion.
Finally, changes to the world of work affect employee motivation. Recent changes include more technology, telecommuting, and remote work; contracting and outsourcing; flatter organizations; and more diverse and inclusive workforces (see Cappelli & Keller, 2013; Spreitzer et al., 2017 for reviews). Given the scale of the COVID-19 pandemic and its effect on workers worldwide, students may reasonably expect even more shifts going forward. While it is reasonable to expect those entering the workforce under present conditions to have very different perspectives than those who entered in another time period, it is particularly important for students to reflect on changes across generations.
Learning Objectives
After completing the exercise and discussion, students will be able to:
Delineate the difference between intrinsic and extrinsic motivation by properly categorizing job reward factors.
Recognize the extent to which their own preferred reward factors differ from those of others.
Describe how demographic differences like age, gender, and job level affect the prioritization of the rewards (the rankings).
Compare and contrast their own and their peers’ rankings of the reward factors with those of previous generations.
Overview
This exercise can be completed in a single class session as it can range anywhere from 50 to 100 minutes (see Table 1). We have successfully administered this exercise in both in-person and online synchronous environments. The impact of the exercise comes from the live instructor-led debrief, ideally conducted synchronously; however, instructors could also use asynchronous discussion boards. If short on time, we recommend prioritizing the first two learning objectives, potentially postponing the discussion of demographic and generational differences for a later class period.
Step-by-Step Summary.

Step-by-Step Instructions
Step 1: Survey
This exercise begins by administering a brief survey (Appendix A, which is also available as Supplemental Material) either before or during class. We selected the survey (Kovach, 1995) because it has been used since the 1940s and allows students to compare their answers with those of previous generations.
Ask students to rank-order 10 job reward factors on their own without any influence from their peers. Completing the rankings on their own is important because peer influence will take place after they complete their individual rankings. Frame the assignment as a self-assessment for students to learn more about themselves. We recommend pairing this exercise with a pre-class reading covering basic motivation theory, particularly intrinsic and extrinsic motivation. However, do not discuss these concepts prior to students’ taking the survey so as not to bias their responses. Table 2 illustrates different ways the survey can be administered and the pedagogical advantages of each approach.
Survey Administration Options.

Step 2: Initial Discussion
To reinforce the first learning objective to help students understand and categorize the difference between intrinsic and extrinsic motivation, initiate a discussion. This discussion could involve the full class or, if time allows, have students “pair-and-share” to discuss their rankings in groups of two to three prior to a class-wide debrief. A provocative way to start the debrief is to first ask, “Do you feel more intrinsically or extrinsically motivated? Why?” In a recent online class, we asked students to respond by putting their responses in the chat. A polling feature could also be used effectively here. We find in our own class discussions that students often overwhelmingly believe that they are more intrinsically motivated. Only after further discussion do they admit that extrinsic factors really are driving their motivation. This pattern could be attributable to social desirability bias, as students believe it is “better” to be intrinsically motivated than to care about material rewards. Their true feelings will emerge when sharing their survey responses.
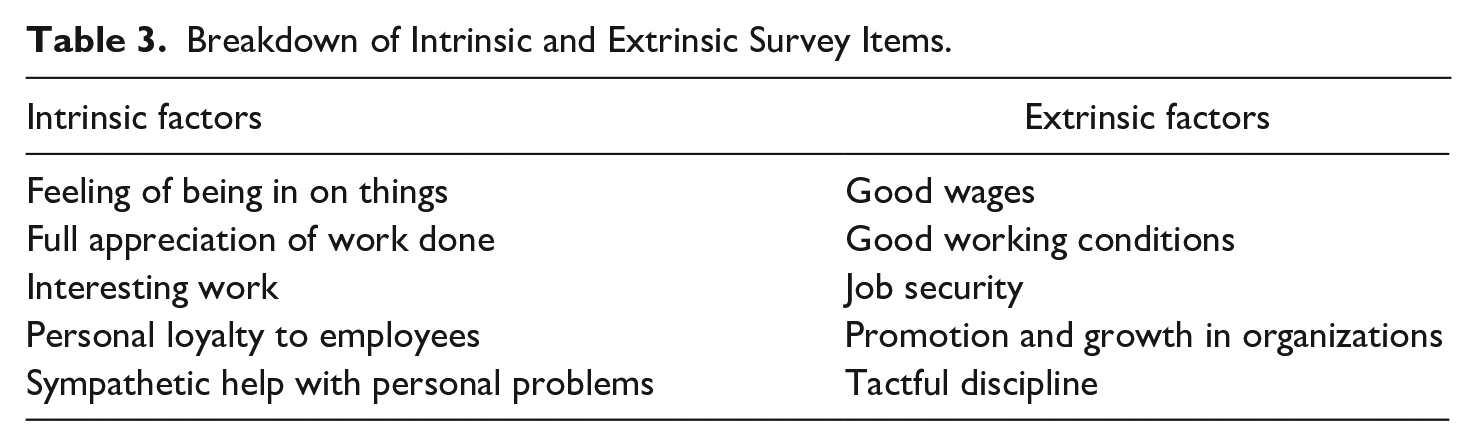
Highlight which survey items are intrinsic and extrinsic (Table 3). Sometimes, it is helpful to proceed item by item and have students indicate which items they think are intrinsic or extrinsic before revealing the correct answer. This revelation can cause an “Aha!” moment from students if they notice inconsistencies between what they said they valued and how they actually ranked the items. Probe for such inconsistencies by asking whether students’ ranking categories differed from how they responded earlier. Ask students for their own ideas about why this might be the case, and then introduce them to the concept of social desirability. Figure 1 provides a sample slide for use in class, which is also available as Supplemental Material. For a richer discussion, see Appendix B for additional debrief questions and typical student answers.
Breakdown of Intrinsic and Extrinsic Survey Items.
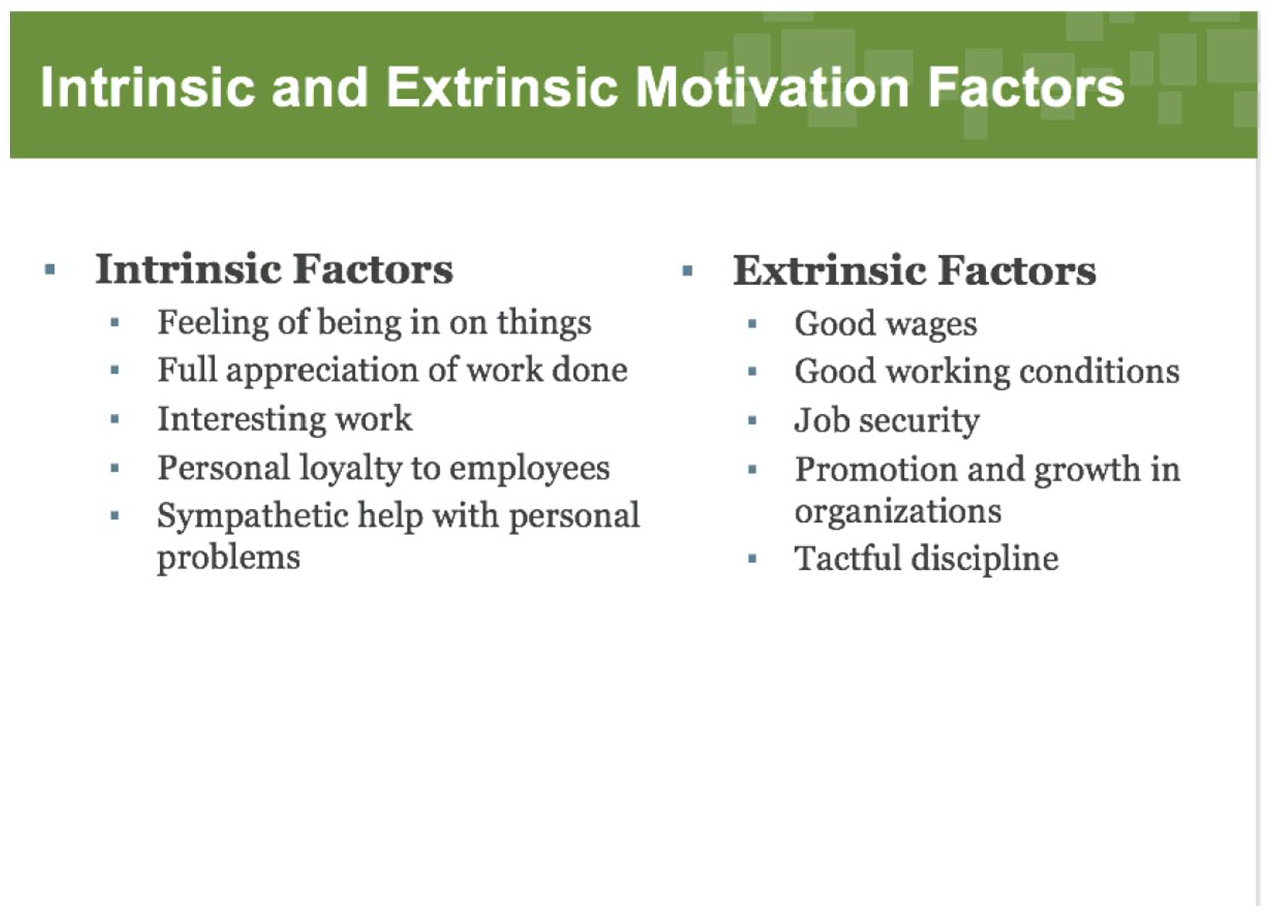
Sample slide for use in class.
Step 3: Demographic Differences Discussion
After completing a discussion of their own results, provide students with the first data report, which includes a comparison of survey responses broken out by demographics. We have compiled these data in both table format (Tables 4 and 5) and as a graph (Figure 2); both are also available as Supplemental Material. This report, which can be shared as a physical handout, slide, or shared online document, helps emphasize the second and third learning objectives for students to understand how their responses differ from others’ based on demographics.
Comparison of Rankings by Year.
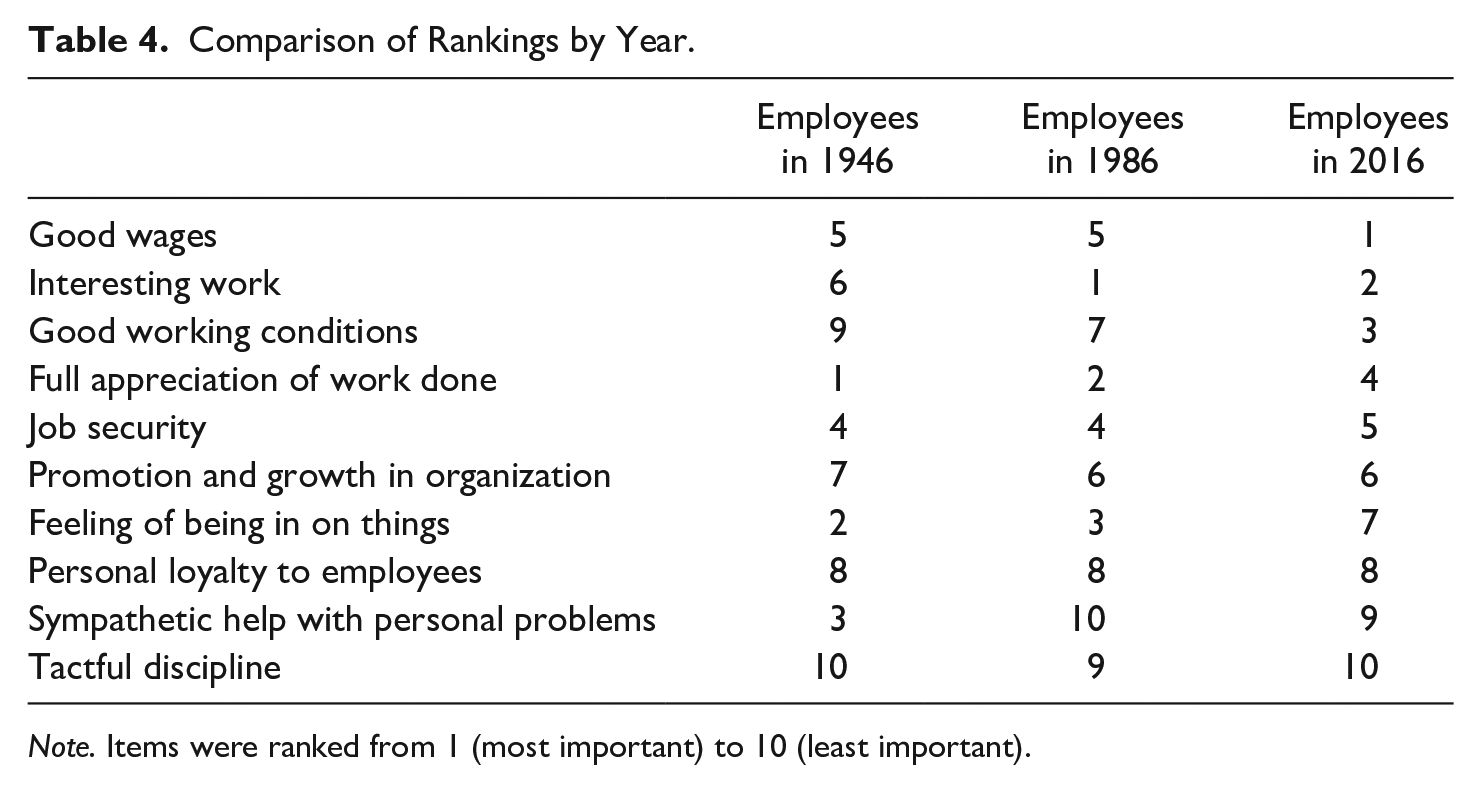
Note. Items were ranked from 1 (most important) to 10 (least important).
2016 Data by Demographic Groups.
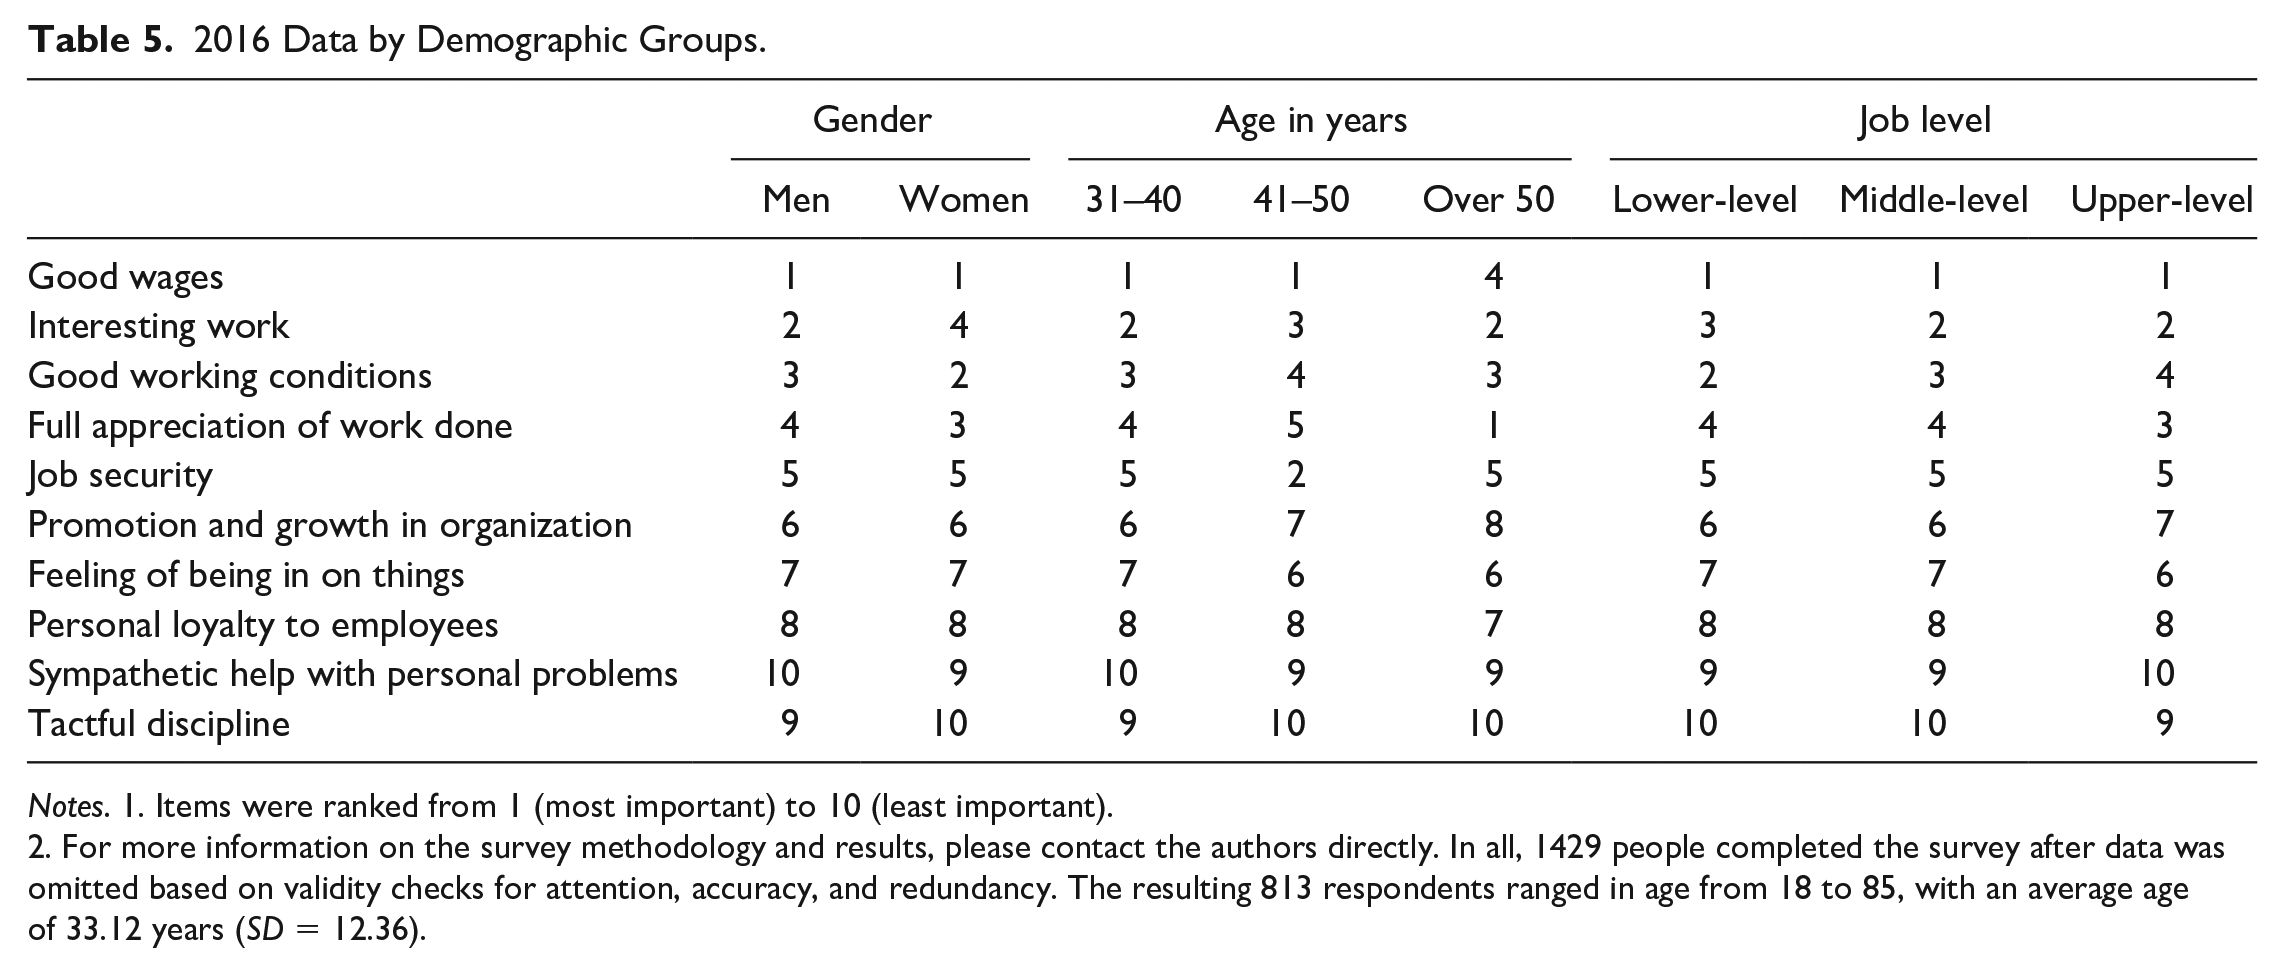
Notes. 1. Items were ranked from 1 (most important) to 10 (least important). 2. For more information on the survey methodology and results, please contact the authors directly. In all, 1429 people completed the survey after data was omitted based on validity checks for attention, accuracy, and redundancy. The resulting 813 respondents ranged in age from 18 to 85, with an average age of 33.12 years (SD = 12.36).

Comparison of three time periods by item.
The first data report is derived from two sources. First, it contains archival data from a study published over 25 years ago in which the author administered the motivation survey in 1995 and compared it to results from the same survey conducted in 1946 and 1981 (Kovach, 1995). To update that data, we administered an online survey in 2016 that replicated the questions and demographic categories used in the 1995 study. 1
Share with students that the reason the survey had some unfamiliar terms was to be able to compare their results with those from prior time periods. This is why, for example, obscure terms like “tactful discipline” and “sympathetic help with personal problems” are listed (both factors have been low-ranked, historically and in our personal experience). Then, walk students through the data asking questions to guide the discussion. Additional debrief questions and typical student answers are provided in Appendix C.
Step 4: Generational Differences Discussion
To support the fourth learning objective of how generational differences affect the motivation rankings, provide additional data (Table 6, also available in Supplemental Material). We recommend doing this as a separate step from Step 3 so that students do not become overwhelmed with the information and can focus on each learning objective separately.
Comparison of Rankings by Generational Cohorts.
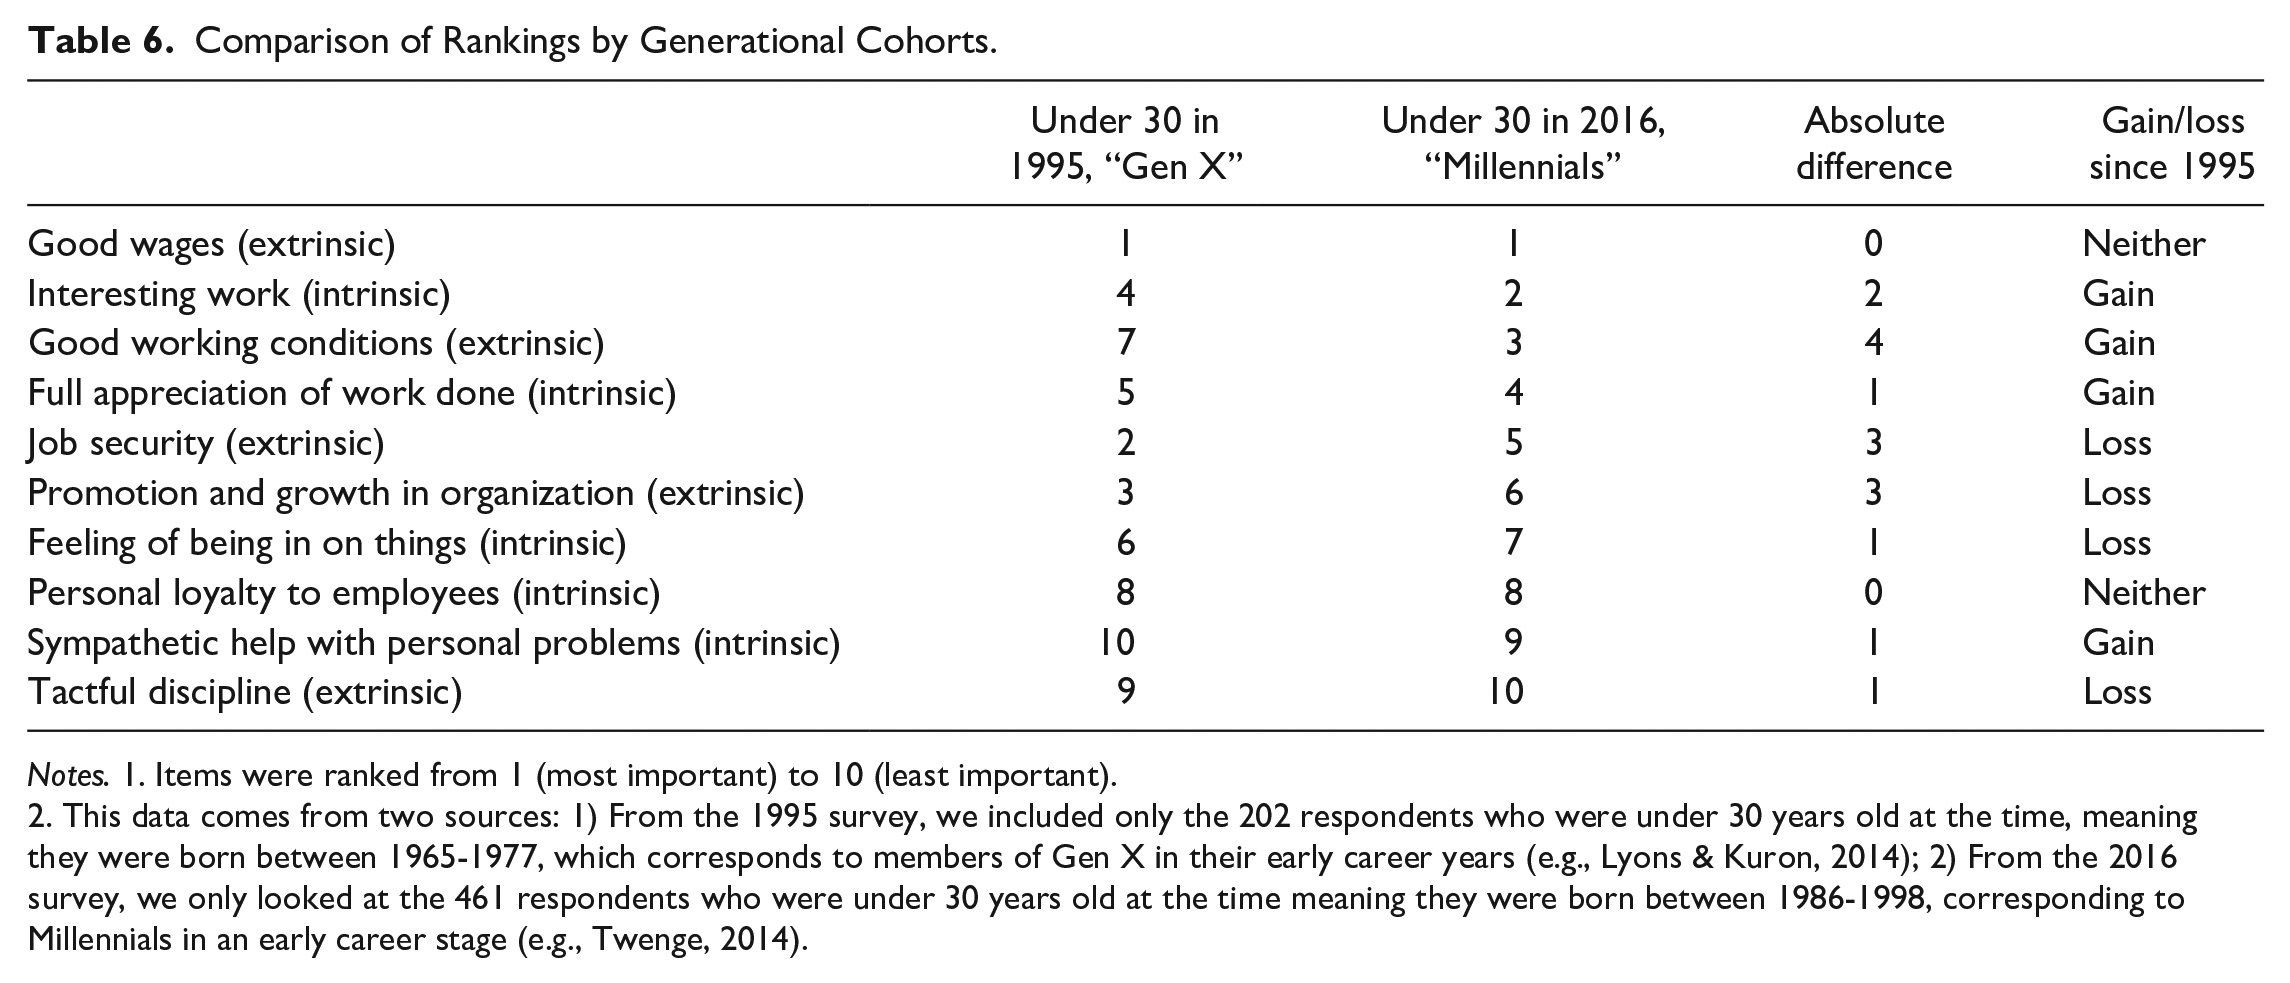
Notes. 1. Items were ranked from 1 (most important) to 10 (least important). 2. This data comes from two sources: 1) From the 1995 survey, we included only the 202 respondents who were under 30 years old at the time, meaning they were born between 1965-1977, which corresponds to members of Gen X in their early career years (e.g., Lyons & Kuron, 2014); 2) From the 2016 survey, we only looked at the 461 respondents who were under 30 years old at the time meaning they were born between 1986-1998, corresponding to Millennials in an early career stage (e.g., Twenge, 2014).
The second report provides a different perspective on the data as it looks at the comparison between two generations from surveys conducted in 1995 and 2016, corresponding to Generation X and Millennials, respectively. The traditional 18- to 22-year-old undergraduate college student today falls into the subsequent Generation Z, so Gen X and Millennials are the two main cohorts they will interact with in the current workplace. Additional debrief questions and typical student answers are provided in Appendix D.
Conclusion
This exercise challenges students’ assumptions of what they think motivates them and others. Having students conduct their initial rankings before seeing the data gives them a chance to articulate what they value without becoming biased by others. One of the key takeaways of this exercise is the complexity of human motivation: students not only increase their self-awareness of what motivates them but also have an increased awareness of how others are motivated differently. Eventually, when the students become managers, they will have the ability to design reward systems, and these systems need to account for the various factors that motivate people differently. Similarly, this exercise might be beneficial in a corporate environment. While employers seem to emphasize fun and freedom in the workplace (Lamm & Meeks, 2009), “Good Wages” has a firm grasp on the #1 ranking, indicating workplaces may not be aligned with what apparently really motivates workers.
Supplemental Material
sj-docx-1-mtr-10.1177_23792981211041005 – Supplemental material for What Really Motivates You? A Data-Driven Exercise and Discussion
Supplemental material, sj-docx-1-mtr-10.1177_23792981211041005 for What Really Motivates You? A Data-Driven Exercise and Discussion by Jennifer Tosti-Kharas and Eric Lamm in Management Teaching Review
Footnotes
Appendix A
Appendix B
Appendix C
Appendix D
Acknowledgements
We thank Roger Lamm, Jane Schmidt-Wilk, Joe Seltzer, and two anonymous reviewers for their helpful comments on earlier drafts of this work, which greatly contributed to the final product. Our students in Foundations of Management & Entrepreneurship (Fall 2020 and Spring 2021) and Developing Management Skills (Summer 2020 and Spring 2021) also contributed valuable insights and “Aha! moments” for which we are grateful. We dedicate this article to the memory of Kenneth A. Kovach, whose legacy of repeated measures data collection this paper commemorates and extends.
Declaration of Conflicting Interests
The author(s) declared no potential conflicts of interest with respect to the research, authorship, and/or publication of this article.
Funding
The author(s) received no financial support for the research, authorship, and/or publication of this article.
Notes
References
Supplementary Material
Please find the following supplemental material available below.
For Open Access articles published under a Creative Commons License, all supplemental material carries the same license as the article it is associated with.
For non-Open Access articles published, all supplemental material carries a non-exclusive license, and permission requests for re-use of supplemental material or any part of supplemental material shall be sent directly to the copyright owner as specified in the copyright notice associated with the article.