



Abstract
An invaluable feature of the approach developed by AT&T to providing superior value to their customers has been the best-practice process that drove the cycle of continuous improvement, based on the concept of a value tree. This process has since lent itself readily to the task of creating superior value for other stakeholders. Culture and its various categories such as safety culture or risk culture are key drivers of value for several different stakeholder groups. The purpose of this article is to show how the same stakeholder value management process, with a judicious adaptation of a value tree, works well when applied to the task of managing culture, and so opens up new pathways for managers to explore in the endless pursuit of business improvement. A comparative analysis demonstrates how it improves on other current methods in widespread use, in particular avoiding a shortcoming in the wide range of methods deriving from the Safety Awareness Questionnaire.
Introduction
A well-run enterprise is in endless pursuit of creating competitive value for its diverse stakeholders. 1 Stakeholder value manifests itself in a variety of ways—Worthwhile Investment for owners, Worth What Paid For for customers, Worth Working Here for people, Worthwhile Partnership for suppliers and collaborators, Worthwhile Presence for the wider community and so on. The factors that drive value creation are themselves diverse and, in some cases, somewhat nebulous. A notable example is culture (e.g., Holbeche, 2019).
Culture, with its more specific sub-domains such as safety culture and risk culture, has received a great deal of attention in both the academic literature and in the consulting area, in terms of attempting to measure it. However, there has been little attention paid to how to manage a process of improvement in culture. This may start to change, as the importance of enterprise culture has been highlighted by a recent flood of public scandals. Whether it be sexual harassment in various areas of the entertainment industry (spawning the #metoo movement), how banks treated anyone except their shareholders,2, 3 a win-at-all-costs mentality in professional sports, 4 or the behaviour of high-profile politicians, a toxic underlying culture is regarded by many as a significant—if not the significant—root cause of behaviours that are at best unethical and in some cases unlawful. As such, these behaviours may be detrimental to stakeholder value.
Safety culture has been a matter of considerable focus in high-risk industries such as the operation of nuclear reactors, where the Chernobyl disaster brought the issue into sharp relief (INSAG-7, 1992). Since then, almost every formal inquiry into serious safety incidents concludes that organizational culture is significant to major causal factor. Safety culture also receives attention in the airline industry, particularly in the context of commercial aviation. 5
In seeking to manage culture for improvement, it is of interest to study successful processes for managing relationships. Customer value management (CVM) provides a canonical example. CVM was devised by AT&T in the mid-1980s in response to a business crisis (Kordupleski, 2003). Its important properties include:
A means of linking its overall customer metric to higher-level business drivers (market share, return on investment, customer loyalty). Actionable board and senior leadership reports providing clear guidance about how to select priorities for improvement. Assurance that no significant factor contributing to the overall customer metric has been overlooked. Providing an ongoing dialog between the enterprise and the market about how things are going, what needs to be improved and in what order.
Since then, CVM has been successfully adapted to the other main groups of stakeholders for an enterprise, owners, people, partners, and the wider community (Fisher, 2013). The generic improvement process is termed stakeholder value management (SVM). The purpose of this article is to show that SVM provides a sound basis for managing culture for improvement.
The article is laid out as follows. Following a brief literature review 6 of measurement aspects of culture and safety culture, we introduce an analogue of the customer value approach to measuring each, and use a case study to exemplify how this can be used to manage safety culture for improvement. We then compare this with other current approaches. In particular, we examine in detail a popular and very widely adapted methodology and use another case study to reveal a major pitfall of this methodology when viewed through the lens of our approach. In Section 6, we explore the ways in which our approach to improving culture and its sub-domains can open up a variety of ways for leadership and management to improve their businesses.
Defining Culture and Safety Culture
In surveying the literature on culture, Smit et al. (2012) observed that:
As can be expected definitions of organization culture abound. Already in the 1950s Kroeber and Kluckhon (1952) commented on the big number of definitions and models. Some years later Ogbonna & Wilkinson (1990) suggested that there are ‘as many definitions of culture as there are so-called experts on the subject’.
Chatman and O’Reilly (2016) published a major review of the areas of qualitative and quantitative aspects of organizational culture in which they commented:
In spite of the importance of organizational culture, scholarly advances in our understanding of the construct appear to have stagnated. We … argue that the ongoing academic debates about what culture is and how to study it have resulted in a lack of unity and precision in defining and measuring culture. This ambiguity has constrained progress in both developing a coherent theory of organizational culture and accreting replicable and valid findings.
Their article serves to point up the existence of at least three somewhat disjoint groups interested in the subject of culture: The academic community, management consultancies and people in organizations trying to make things better. The disjunction is evidenced by the lack of cross-referencing of their respective literatures. A plausible reason for this can be inferred from Chatman and O’Reilly’s discussion of the difference between culture and climate: they regard the two as quite distinct and, in their concluding remarks, observe that there is no agreed definition of culture, at least for the research community. However, in our view, the distinction in the real world of organizations and management is now so blurred as to be ignorable; indeed, the two terms are often used interchangeably (cf. the comment in Cox and Flin (1998) in the context of safety culture). Further, the meaning of the term Climate survey is itself fuzzy, given that Climate is sometimes meant in the Chatman and O’Reilly sense of practices, procedures and perceptions, and at other times relates to some sort of all-encompassing staff survey that also includes motivations, norms and values. The fact is that the practical matter of improving organizational culture cannot wait for resolution of this academic debate. As Louis Gerstner Jr. commented after his experience as CEO at IBM (Gerstner, 2002):
Until I came to IBM, I probably would have told you that culture was just one among several important elements in any organization’s makeup and success — along with vision, strategy, marketing, financials, and the like ... I came to see, in my time at IBM, that culture isn’t just one aspect of the game – it is the game. In the end, an organization is nothing more than the collective capacity of its people to create value.
And indeed Chatman and O’Reilly agree with this:
As Schein (2010, p. 2) observed in the beginning of his seminal 1985 book, the management of culture is ‘the only thing of real importance that leaders do’.
So, we shall use a definition based on the concept of Technical ophelimity, or functional fitness for use (Wolnizer, 1987, p. 50) which carries with it the notion that the properties of fitness for use must be empirically demonstrable. Technical ophelimity can then be based on the following informal, widespread definition of organizational culture as The way we do things around here, which has been in use for decades (e.g., Bower, 1966, p. 22). Analogously to Wolnizer in his context, we complete the definition of culture by Explication (in the sense of Rudolf Carnap)7, 8 by elaborating our explicandum in terms of specific, measurable elements, the drivers and attributes of a culture tree. And this should suffice. As Handy comments:
A culture cannot be rigorously defined, for it is something that is perceived, something felt. (Handy, 1976, p. 185).
This provides, a fortiori, what Chatman and O’Reilly characterize as ‘construct validity’. And it is, in fact, exactly how CVM evolved.
The case with safety culture is similar: there is no agreed definition. However, in light of the foregoing discussion, we will simply define safety culture normatively, as The way we work safely around here, consistent with usage in other industries (Antonsen, 2009).
Approaches to Measuring and Managing Various Forms of Culture
There is a very active industry devoted to measuring and managing various forms of culture. The Supplementary Material contains a brief overview of some of the main methods for culture, safety culture and risk culture. Many of these derive from the so-called Safety Awareness Questionnaire (SAQ), which is discussed in detail in Section 5.1. Section 5.2 provides a comparative evaluation of these methods with a new method introduced in the next section.
A New Approach to Measuring and Managing Culture
Aims and Key Design Criteria
In advocating the process described below, we have three specific goals in mind:
helping managers to provide a healthy culture within which people carry out their work; providing metrics to enable boards to exercise due diligence in relation to all aspects of culture, for example, workplace safety in the case of safety culture, and helping executive leadership to identify what needs to be fixed and in what order; and thereby enabling continuous improvement of business outcomes.
Key Criteria for a Culture or Safety Culture Improvement Process and the Implications for Process Design

The Improvement Cycle
Generally speaking, to introduce a value management process, managers must develop and deploy a structured measurement instrument (namely, a survey) and embed it in an improvement cycle. The improvement cycle is effectively the same from application to application; the critical point of difference with the present approach is the structure of the survey instrument.
In summary, the improvement process consists of the following steps:
Step 1. Design survey instrument in consultation with internal experts and focus groups of people from the target population. Step 2. Survey a random sample from the target population and validate the instrument (using statistical analysis to confirm that no factor that significantly affects the overall goal has been overlooked). Step 3. Analyse data, prepare report and workshop materials. Step 4. Conduct a workshop with leaders to identify priorities. Step 5. Communicate proposed responses and carry out improvements. Step 6. Communicate that improvements have been made, and re-survey.
This process provides an ongoing dialog between the leadership and the stakeholder group about what needs to be fixed next, and checks on how well the interventions have succeeded in effecting improvement.
Structured Measurement of Culture and Safety Culture
At the core of the customer value process is the customer value tree, which provides an elaboration of the overall goal (delivering Value to customers, where Value is a trade-off between satisfaction with the Quality of a product or service received, balanced against satisfaction with the Price paid) in terms of its drivers, quality and price, and their branches and attributes.
Here, our overall goal with the culture process is a good corporate culture, and similarly for safety culture. Figures 1(a) and 1(b) show tree-structured representations of this goal for culture and safety culture, respectively, in terms of some key drivers, and their lower-level branches and attributes. In each case, the upper branches of the tree constitute our basic model, and the attributes are determined from focus groups involving people in the enterprise, thereby providing a bespoke survey instrument.
Data are captured by asking a random sample of respondents to rate the performance of the enterprise on each branch in the tree. 9 This structured data set can then be modelled by standard statistical procedures (Fisher, 2013, 2019; Kordupleski, 2003) to produce a set of mean ratings for each driver, branch and attribute, together with an estimate of the relative impact of each of these in driving overall satisfaction with culture. This is exemplified in a safety culture case study below.
Ensuring Business Impact by Connecting to Higher-Level Value Drivers
The top-level metrics from a culture survey should be lead indicators of future business success. As with CVM, this is achieved in part by capturing respondent data on higher-level value drivers.
For culture, two appropriate metrics would relate to Willingness to recommend the enterprise as a good place to work, and Rating the enterprise on your ability to do your best work. Then the survey data will provide a means of establishing a Culture – Business impact 10 graph of the type shown in Figure 2 in our first case study (§4.5). Correspondingly, an important high-level safety culture request would relate to Willingness to recommend this company as a safe place to work. More detailed discussion is provided in Section 6, in the context of how the whole approach can drive business improvements.
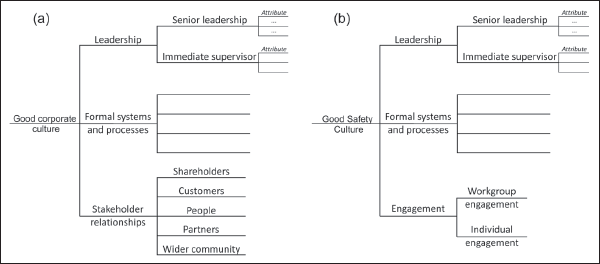
In (a), the overall goal of a good corporate culture is represented in terms of three principal drivers, leadership, formal systems and processes, and stakeholder relationships. In turn, each of these will have sub-drivers, and each sub-driver will have a number of attributes that are identified after input from internal experts and then focus groups with people working in the enterprise. This instrument forms the basis for a survey instrument, in which respondents are asked to rate the performance of the enterprise on each branch in the tree, starting with the attributes (e.g., on a scale of 1 to 10, where 1 is poor and 10 is excellent, please rate the Senior Leadership on its ongoing visible commitment to improving Culture) and similarly for safety culture.
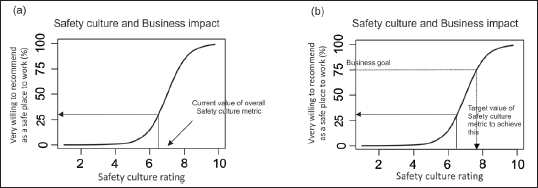
(a) The current value 6.3 for the culture metric GCC corresponds to about 23% of people being very willing to recommend your organization as a place to work (= rating Willingness to recommend 8, 9 or 10). (b) If the business goal is to increase from very willing to recommend 37% to 50%, this means that the culture metric will need to increase to about 7.0.
(a) Initial Top-Level Profile for Good Safety Culture and Its Drivers.
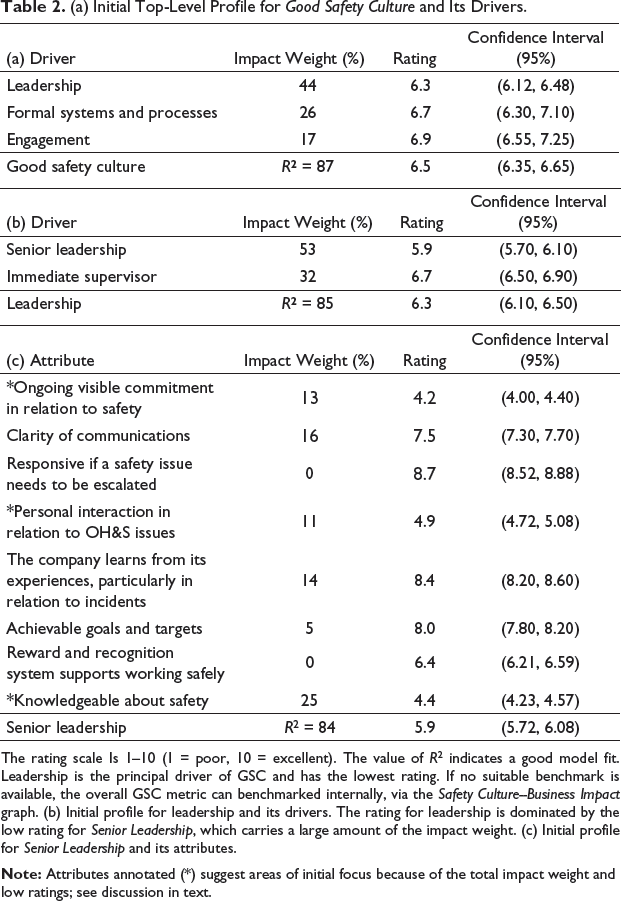
The rating scale Is 1–10 (1 = poor, 10 = excellent). The value of R2 indicates a good model fit. Leadership is the principal driver of GSC and has the lowest rating. If no suitable benchmark is available, the overall GSC metric can benchmarked internally, via the Safety Culture–Business Impact graph. (b) Initial profile for leadership and its drivers. The rating for leadership is dominated by the low rating for Senior Leadership, which carries a large amount of the impact weight. (c) Initial profile for Senior Leadership and its attributes.
Case Study for Safety Culture Process
The process was introduced into a mining operation with a workforce of some 330 people. The site was an open-cut thermal coal mine in New South Wales with a workforce engaged in mobile plant operations, coal washing and blending, and loading rail cars. (The quantitative results reported below have been modified for reasons of confidentiality.) An initial representative sample survey provided 89 complete responses.
The top-level profile for Good Safety Culture (GSC) and its three drivers is shown in Table 2a. The Impact weight column shows the relative importance of each driver in terms of influencing GSC. The Ratings column (and, if benchmarking data in the form of competitive data or targets were available, a Relative ratings column) shows how well or poorly the company is perceived, in terms of its culture. The high value of the multiple correlation coefficient (R2 = 87%) suggests that no important factor has been overlooked in explaining the overall rating of safety culture.
We can now embark on the improvement process. Even in the absence of benchmark data, the overall GSC metric can be linked to higher-level business drivers using supplementary requests in the survey (cf. §4.4). For example, Figure 2(a) relates GSC to the loyalty driver Willingness to recommend as a safe place to work. The current overall value of GSC corresponds to just 30% of respondents being very willing to recommend this company to others as a safe place to work.
The approach gives clear guidance about why improvements are needed and where to look for improvement priorities (Fisher, 2013; Kordupleski, 2003). Figure 2(b) suggests that to achieve a target of say 75% of people being very willing to recommend this company as a safe place to work, the overall value of GSC (currently 6.5) needs to reach about 7.6. Suppose a provisional 12-month improvement target of 7.1 in the overall safety culture metric is chosen, an increase in GSC of 0.7. We see from Table 2a that the biggest gain is likely to come by improving the rating for Leadership. A stretch goal would be to boost GSC by 0.8, from 6.3 to 7.1, over this period. A more modest increase of 0.4 in each of Formal Systems & Processes and Engagement might also be sought. The predicted increase in GSC is then 0.44 × 0.8 + 0.26 × 0.4 + 0.17 × 0.4 = 0.52, which would satisfy the 12-month target.
To identify more specific improvements, we move to the lower-level tables to identify attributes with high impact weights and low ratings, and then proceed to apply the usual tools of quality improvement (identify systemic issues, root cause analysis). Table 2b suggests an initial focus on Senior Leadership, and the starred items in Table 2c imply that the senior leaders are not perceived as aware of or caring about safety. An appropriate intervention might include training and a programme of positive actions to demonstrate commitment.
Comparing Several Approaches to Managing Culture and Safety Culture
Many methods have been proposed for quantifying culture, and safety culture. The Supplementary Material provides brief descriptions of those in widespread current practice, so we shall evaluate how these methods perform by applying the criteria in Table 1.
First, however, we highlight one particular approach that has since been adapted for a wide variety of purposes and is in very widespread use; it is based on the SAQ.
The Safety Awareness Questionnaire: A Case Study
The origins of the SAQ are described in Supplementary Material §2A. The following case study derives from one of a number of surveys conducted on different area health services. This particular service had over 5,000 full-time equivalent staff and 3 health care centres, providing a range of specialist and community-based services to several hundred thousand people. As will become clear, the SAQ process failed most of the criteria in Table 1. We can reveal the underlying causes for this using a value tree perspective.
An initial SAQ for patient safety at one centre had been run two years previously. We undertook a follow-up survey, with the proviso that we be permitted to make a few additions to the survey instrument.
The basic SAQ survey comprised 60 basic items. However, only 30 of the 60 items in earlier SAQ studies had significant factor loadings, so that reported scores for each overall factor used only these items.
The re-designed survey was developed with two design goals:
To allow comparison with the previous SAQ results, which required retaining the 30 core items (albeit with some rewording). To enable better-informed decision-making, by reorganizing the survey in tree-structured fashion so that the results might be actionable (as in the first case study §4.5).
The second goal had several implications:
A 10-point rating scale was used to improve discrimination between the responses, replacing the 5-point Likert scale used in the previous SAQ survey; see Appendix for more detailed comment. The survey was re-structured using a hierarchical model, as shown in Figure 3. Questions were grouped together under their related safety culture factors. Additional questions were included. This was a critical step. The designers of the SAQ had used the following process: Step 1. Assemble a set of items that seem sensible, based on earlier research. Step 2. Conduct a statistical analysis (in their case, a factor analysis) to identify factors appearing to underpin the data. Step 3. Identify the subset of items that contribute materially to these factors, and focus reporting on this subset.
The standard psychometric process would stop at this point and focus on just the 30 items. However, there is a natural question to ask at this stage: If these 6 factors are important, are there some other items not included in the original 60 that might have significant factor loadings? For this reason, we added another process step:
Step 4. Conduct focus groups to identify other possibly interesting items in relation to each of the six factors.
Consequently, several more items were included in the modified SAQ instrument, and an overall item relating to each factor was added if not already present. Further, respondents were asked for the main reason that they had assigned each overall rating.
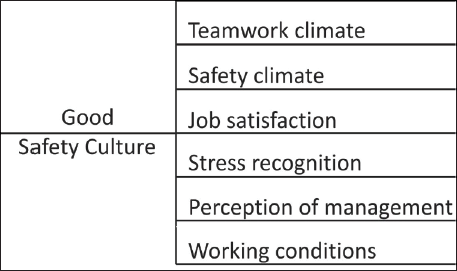
The Overall Goal, ‘Good Safety Culture’, is Represented in Terms of Its Principal Drivers as Determined by the SAQ.
These changes provided some new important capabilities:
A way to check whether an important item was missing. A means of estimating the relative importance of each factor in explaining the overall rating of the desired outcome (GSC), which helped to identify where to focus improvement priorities (factors and items with high weights and low ratings). A link between overall survey results and higher-level business indicators, such as Willingness to recommend the organization to others as a safe place to be treated.
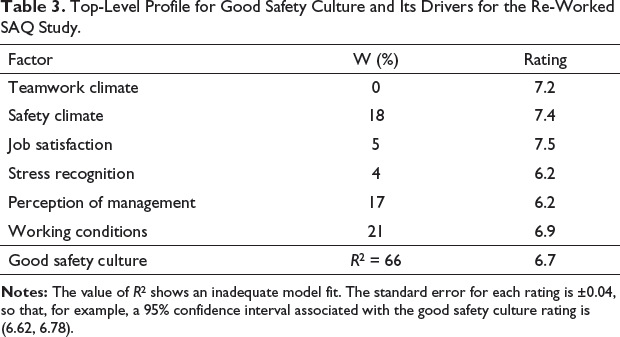
Thus, the survey instrument comprised the core set of 30 items needed for comparison with the earlier survey, plus supplementary requests to enable hierarchical modelling. Usable responses to the survey were received from 2,751 people, a response rate close to 60%, and analysed as for value survey data. The top-level profile is shown in Table 3.
From this table, we can draw two inferences:
The value of R2 (66%) indicates that there is an inadequate overall model fit: at least one significant factor affecting the overall perception of safety culture appears to be missing. The most important factors driving GSC appear to be Safety Climate (18% impact), Perception of Management (17% impact) and Working Conditions (21% impact).
Top-Level Profile for Good Safety Culture and Its Drivers for the Re-Worked SAQ Study.
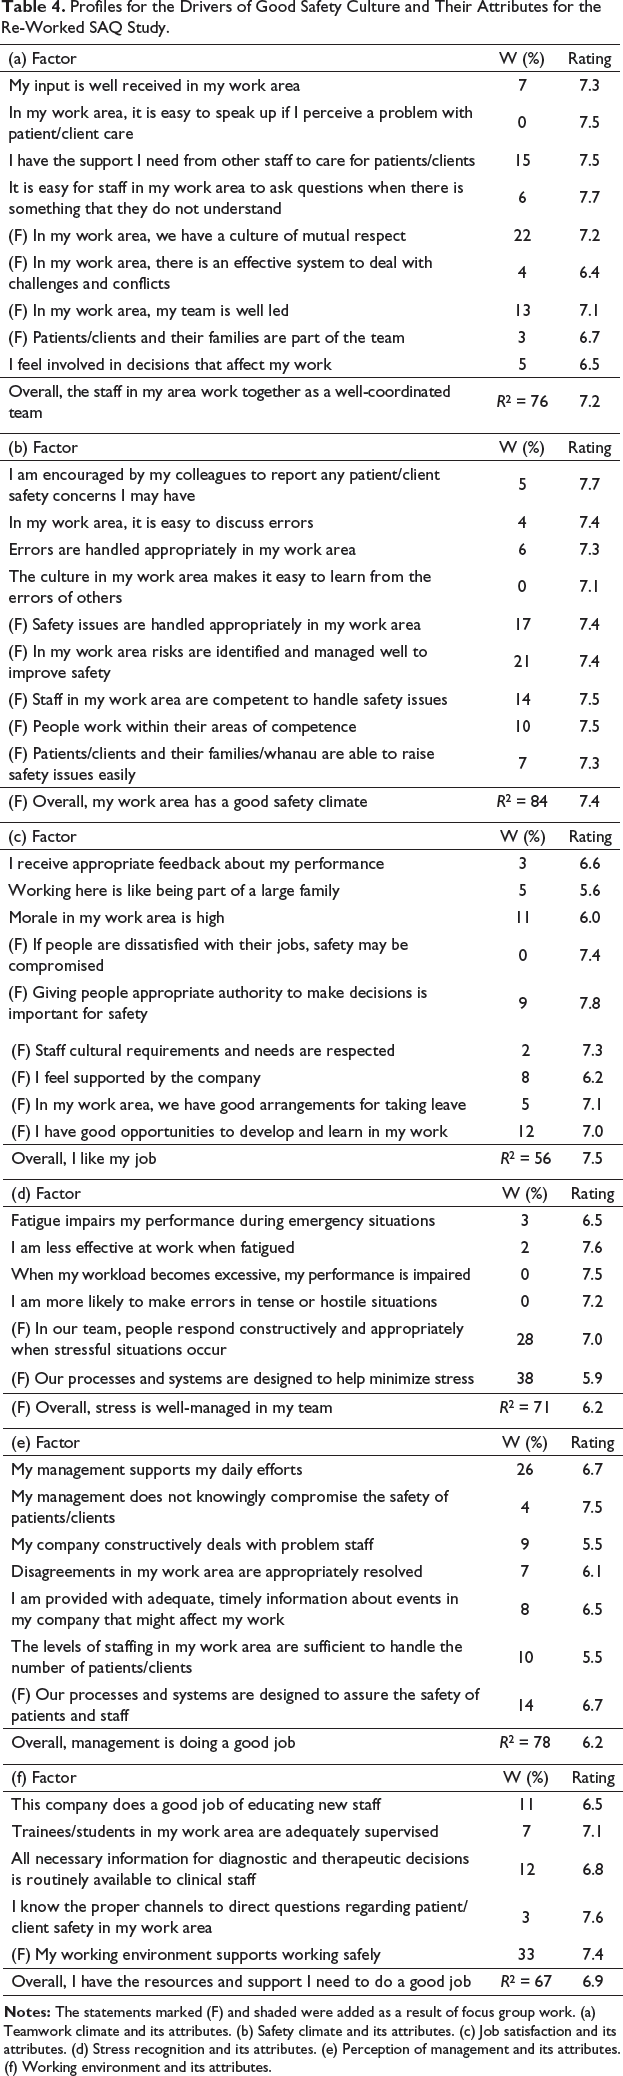
Profiles for the Drivers of Good Safety Culture and Their Attributes for the Re-Worked SAQ Study.
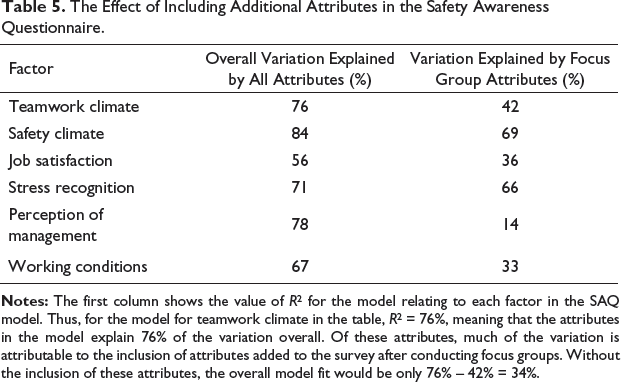
The Effect of Including Additional Attributes in the Safety Awareness Questionnaire.
Items marked (F) were added after conducting the focus groups. Again, there are some points to note:
The models for Teamwork climate, Safety climate, Stress recognition and Perception of management each explain a reasonable amount of variation (R2 ranges from 71% to 90%). However, the models for Working environment (R2 = 67%) and for Job satisfaction (R2 = 56%) are unsatisfactory, suggesting that there are important aspects of each factor, particularly for Job Satisfaction, not covered by the set of items in current use. It may also help explain the low impact of Job Satisfaction on the perception of an overall GSC in Table 2. (For example, a Job Satisfaction survey may well include survey items relating to Remuneration, or to the Image of the organization.) For three factors, the additional focus group-generated items contributed far more impact than the original items in driving overall perception of Patient Safety and contributed materially to the other two, as shown in Table 5.
If we now revisit the criteria in Table 1, it is evident that most of the desiderata (A)–(F) are not met:
(A) The results are neither timely nor actionable. All one can do after two years is to lament failing to act earlier. And since a typical SAQ analysis provides no indication of the relative importance of various factors, no guidance is available about what to fix and in what order. (B) and (C) There is no sound basis for selecting improvement priorities. Indeed, since it transpires that some of the most important factors haven’t been measured at all, it is quite unsound. (E) The possibilities for useful benchmarking are very limited, as the basic SAQ summary metrics are not capturing sufficient information. (F) Because of the failings listed above, the six basic SAQ metrics do not provide confidence that directors and other officers can act with due diligence in relation to safety.
Comparison of Approaches
Table 6 compares a number of methods for assessing some form of culture, including the one described above.
In making these evaluations, it is important to note that not all the approaches are designed to be formal improvement processes. Nonetheless, to the extent that they are intended to capture some overall concept of culture and so provide a basis for action, it appears appropriate to assess them against all the criteria listed in Table 1.
Some of the methods evaluated in Table 6 do not purport to be part of a process, and some do not claim to be complete in their assessment of culture. Nonetheless, the time has surely come to address the issue of improving culture in a systemic fashion, in which case we claim that our criteria are appropriate.
Board members must exercise due diligence. For this, they need regular, sound, quantitative reports in order to ask meaningful questions about how things are now, where they are heading, what specific improvements are proposed and why; and so manage risks to the enterprise. The currently available methods do not appear to assist this statutory aspect of their work. CEOs need a way to establish improvement priorities in relation to culture, and cannot be confident that they are making sound decisions if some important factors are missing from the data. It is possible to improve substantially on current approaches in this regard, and also in terms of the quality of data captured. The whole raison d’être for managing culture is to anticipate and avoid problems in the workplace. A large annual survey does not provide the basis for timely action. Our approach aims instead for a process of continuous improvement. This requires capturing various sorts of data with reasonable frequency—minimally twice a year, perhaps three or four times a year, or even continuously (e.g., Fisher, 2013, pp. 70–74):
(a) Survey data to provide the lead indicators of what is likely to happen. Because our approach is based on taking samples rather than conducting censuses, the problem of over-surveying people can be avoided. (b) Downstream data on unwanted workplace occurrences (safety incidents, regulatory non-compliances, unethical or illegal activity) and higher-level business outputs and outcomes (unplanned staff turnover, cost of claims, cost of insurance) with their associated dates. These data captured to support statistical analysis and charting that can provide evidence that managing culture for improvement (fewer incidents, non-compliances, instances of unwanted behaviour, reduction in unplanned staff turnover and cost of claims, reduced insurance premiums) leads to better business outcomes. The culture literature makes some mention of assessing possible links to organizational effectiveness. For example, Table 8 in Denison et al. (2014) presents evidence of correlation of various DOCS indices with a range of business drivers and outcomes. However, correlation between an index and an outcome says little about the actual strength of the association let alone—importantly—any causal association that might exist so that the culture metrics become predictors, of likely impact. Longitudinal studies are needed to confirm such relationships. There is a much evidence from value management studies that the overall metric from value surveys is such a lead indicator, and so the culture processes advocated here afford such a prospect for the overall metrics GCC and GSC and business outcomes. The management process we have described has been proven to be effective in many and varied stakeholder management studies and, in testing to date, has performed similarly. One critical aspect that needs emphasis relates to benchmarking. Much current culture and safety culture survey activity is generated by some form of regulatory compliance, which in turn calls for benchmarking both internally (against previous survey results in the same enterprise) and externally (against similar entities in the same sector). However, that does not remove the obligation to benchmark meaningful metrics! Whilst our approach provides a form of internal benchmarking, external benchmarking using the summary metrics from the upper branches in the culture and safety culture trees should be done if at all possible. We have yet to carry out longitudinal studies across industry sectors to explore how well the process works in practice.
Comparison of a Number of Methods for Assessing Some Form of Culture.

Using the Culture Management Processes to Drive Business Improvements
Once managers obtain results from ongoing surveys, the path is open to explore a variety of ways to improve the business. In this regard, continuous monitoring surveys (Fisher et al., 2005) can be invaluable in providing a stream of data needed to establish lead-lag relationships.
Such a data streams allow the enterprise to establish the top-level culture metric as a lead indicator of important board metrics such as the number of statutory non-compliances or other serious incidents. It can be linked to any overall stakeholder value metric for which culture is an explicit driver. Additionally, it can be linked to some of the owner value metrics that we mention below in the context of safety culture would be relevant here.
Improving safety culture should help drive improvement in the business in many ways, most importantly through its likely impact downstream in the workplace by making the enterprise a safer place to work. Workplace safety is usually monitored through safety statistics such as Number of deaths, Number of major incidents, Total Recordable Injury Frequency Rate and Damage to equipment for a construction site, or Overexertion, Numbers of slips, trips and falls, and Exposure to substances in a health care environment. The relationship between the overall safety culture metric and these consequent workplace statistics can be established through simple graphs. As in quality control, it is vastly cheaper to work on preventative measures by improving safety culture than it is to cope with workplace incidents after they have occurred, which is what these traditional safety statistics are tracking. Of particular importance is that the methodology here described identifies what improvement opportunity should be worked on first. This allows senior management to ensure the most efficient and productive use of resources, including managerial time, and to apply project management disciplines to the improvement process. Improving these statistics will directly result in improving factors that directly affect the business bottom line, such as Cost of Claims, Insurance rates, Penalties for breaches of statutory safety regulations and so on.
Final Comments
SVM offers an appealing way to tackle seemingly nebulous problems such as managing enterprise culture and its variants.
Especially in the area of safety culture, there is the prospect of carrying out transformational work not just in an enterprise but across an industry sector, because of the meaningful high-level benchmarking metrics associated with the higher-level branches in the safety culture tree.
It would also be of great interest to study the customization of the approach to managing financial risk, and to carry out longitudinal studies to confirm the value of lead-lag relationships.
Appendix
A Comment on the Likert Approach to Surveys
Likert (1932) introduced an approach to survey design based on posing respondent in terms of the respondent’s strength of agreement/disagreement with statements. It requests is in very widespread use, particularly in perception surveys such as the SAQ.
The style of survey requests is an important consideration in perception surveys. A careful evaluation of a variety of approaches is provided in Kordupleski (2003) with the observation that:
In my experience, you get the most useful and accurate responses for the purposes of customer value analysis when you stick to asking people: ‘How would you rate … from Poor to Excellent?’
This conclusion has been borne out in a variety of other contexts studied by the authors.
Kordupleski’s evaluation took account of a variety of issues, including form of request posed, range and number of points of the rating scale, and labels and definitions, and concluded that a 10-point scale labelled at each end as described above works well. In particular, the author made the following comment about the Likert scale:
The problem with this scale is that it measures agreement, not performance level, and is likely to lead you into some difficulties with logic. I saw one employee survey that asked the question, ‘Do you get regular performance appraisals from your manager?’ What can you do with a neither disagree nor agree response to such a question? It has no meaning. [Author comment: And, of course, the response says nothing about the quality of the performance review.]
Likert scales are typically 3–7 points (e.g., the NOSACQ-50 instrument, Kines et al., 2011, which is similar in style to SAQ and uses just 4 points), resulting in lower precision in the results and creating other difficulties by requiring statistical methods for discrete data. These are generally much less flexible than the vast array available for continuous data. (In a major customer value study by Clark et al. (1999), the authors confirmed that a 10-point scale suffices to allow continuous methods to be used.)
Footnotes
Acknowledgements
We are very grateful to late Dr Daniel Lunn for his input to discussions about rating methods. Dan believed in applying rigorous yet practical statistical thinking to many aspects of life, and this article aims to be true to that legacy. We also thank Dr Peter Wolnizer for drawing our attention to the notion of technical ophelimity. Constructive feedback from the editor and reviewer resulted in material improvements to the presentation.
Declaration of Conflicting Interests
Funding
The authors received no financial support for the research, authorship and/or publication of this article.