
Abstract
This paper uses building footprint data in a shrinking city, Baltimore, MD, in 1972 and 2010 to achieve two primary research objectives. The first is to understand the historical patterns of housing construction and demolition in selected row house neighborhoods in Baltimore between 1972 and 2010. The second is to understand changes in housing footprints, and associations between these changes and physical and socio-economic characteristics in selected neighborhoods. We find that housing losses and associated changes in building footprints have shown substantial variation across our study area and exhibit clustering within our study area. Moreover, while housing loss is strongly associated with certain physical factors, there is a weaker association between housing loss and changes in certain socio-economic neighborhood characteristics between 1970 and 2010. Our research findings provide support for targeted, evidence-based neighborhood-based strategies that encompass traditional as well as novel approaches to vacant land management.
Introduction
In many nations around the world, cities are losing population and housing stock (Martinez-Fernandez et al., 2012). During the latter half of the 20th-century, 370 cities worldwide with more than 100,000 residents have seen a population decline of at least 10% (Hollander et al., 2009). Shrinking cities also face challenges of abandoned housing, vacant lots, depressed markets and deteriorating infrastructure (Hollander, 2010; Schetke and Haase, 2008). Many planning scholars and practitioners address how re-use of abandoned housing and vacant properties in shrinking cities can enable such cities to decline in a way that preserves quality of life or alternatively pursue revitalization strategies (Großmann et al., 2013). Our focus in this paper is, instead, identifying relationships between demographic, social, economic and built-environmental factors and trends in neighborhood decline within shrinking cities. This knowledge can help planners to predict, plan for and respond to phenomena associated with urban shrinkage.
We address these issues using the case of Baltimore, MD, which has lost 32.2% of its population between 1970 and 2016 (U.S. Census Bureau, 2017a). Pagano and Bowman (2000) estimate an abandonment rate of about 22.2 abandoned structures per 1000 residents. Sustained economic and social decline has resulted in continued outmigration, increased housing vacancies, multiple waves of building demolitions and poor-quality infrastructure (Cohen, 2001).
Central to this paper is the theory of urban morphology, or the study of city forms and their transformation over time. Our interest in urban morphology relates to the special status of row homes, which comprise a substantial portion of Baltimore’s housing stock (58% in 2000, according to Zielenbach, 2008) and which are central to the architectural style and neighborhood density of the city (Hayward and Belfoure, 1999). Built to house the industrial working class and middle class, they have been the focus of sophisticated efforts at renovation and redesign for economically and environmentally sustainable urban neighborhoods (Husain, 2008).
The planning context for this paper is ‘smart shrinkage’, a strategy to accommodate population loss in a way that focuses on quality of life improvements in a neighborhood (Popper and Popper, 2002). Smart shrinkage necessarily results in substantial changes to the physical and social fabric of declining neighborhoods. These changes can consist of decreased levels of traditional investments, paired with increased investments in nontraditional land uses such as urban farming, recreation, public art and environmental remediation. This new development paradigm has been the subject of extensive scholarly inquiry from the perspective of urban planning (e.g. Hollander and Németh, 2011; Popper and Popper, 2002; Wiechmann, 2008) and decision modeling (Johnson et al., 2014, 2015).
We focus on five distressed row house neighborhoods in Baltimore to investigate characteristics and correlates of changes in urban morphology between 1970 and 2010. We address the following research questions: (1) How have spatial configurations of residential housing in select row-home neighborhoods in Baltimore changed over the past 40 years? Do observed housing losses demonstrate spatial clustering? (2) How is housing loss associated with physical configurations of target neighborhoods? (3) How is housing loss associated with changes in socio-economic characteristics of target neighborhoods? We address these questions through spatial analysis of building footprint data and of Census neighborhood data. We provide recommendations regarding further analysis and neighborhood-level interventions to reduce the risk of increased housing vacancy and property abandonment.
The remainder of the paper is organized as follows. Section ‘Literature review’ reviews the literature on urban shrinkage, vacancy and abandonment in the city of Baltimore, and connections between physical and social factors and urban housing change. Section ‘Research design’ describes our research design, encompassing descriptive and exploratory analysis. The following section introduces our data sources. Our empirical analysis of the study area comprises Sections ‘Descriptive analysis’, and Section ‘Exploratory analysis’. Section ‘Discussion’ discusses and contextualizes our findings, and contains policy and planning recommendations. Section ‘Conclusion’ concludes.
Literature review
Urban shrinkage
The Shrinking Cities International Research Network (SCIRN) defines a shrinking city as ‘a densely populated urban area with a minimum population of 10,000 residents that has faced population losses in large parts for more than two years and is undergoing economic transformations with some symptoms of a structural crisis’ (Hollander et al., 2009; Wiechmann, 2008). Even before the Great Recession, 25% of all cities with more than 100,000 were in decline (Oswalt and Rienitz, 2006). Though shrinkage occurs for different reasons in different places, typical causes include a combination of deindustrialization, suburbanization, and/or demographic shifts. Other causes may include population decline, housing vacancy, employment loss or neighborhood quality decrease (Hollander et al., 2009; Martinez-Fernandez et al., 2012).
The city of Baltimore, the focus of this paper, has seen its population consistently decrease, from about 906,000 in 1970 to about 615,000 in 2016, though moderating slightly in recent years (Figure 1). In contrast, the population of Baltimore County has consistently increased over time at a rate and magnitude roughly similar to the city’s decline. Moreover, the population of the Baltimore metropolitan area has increased from about 2.07 million people in 1970 to about 2.8 million in 2016.
Census population of Baltimore from 1970 to 2010.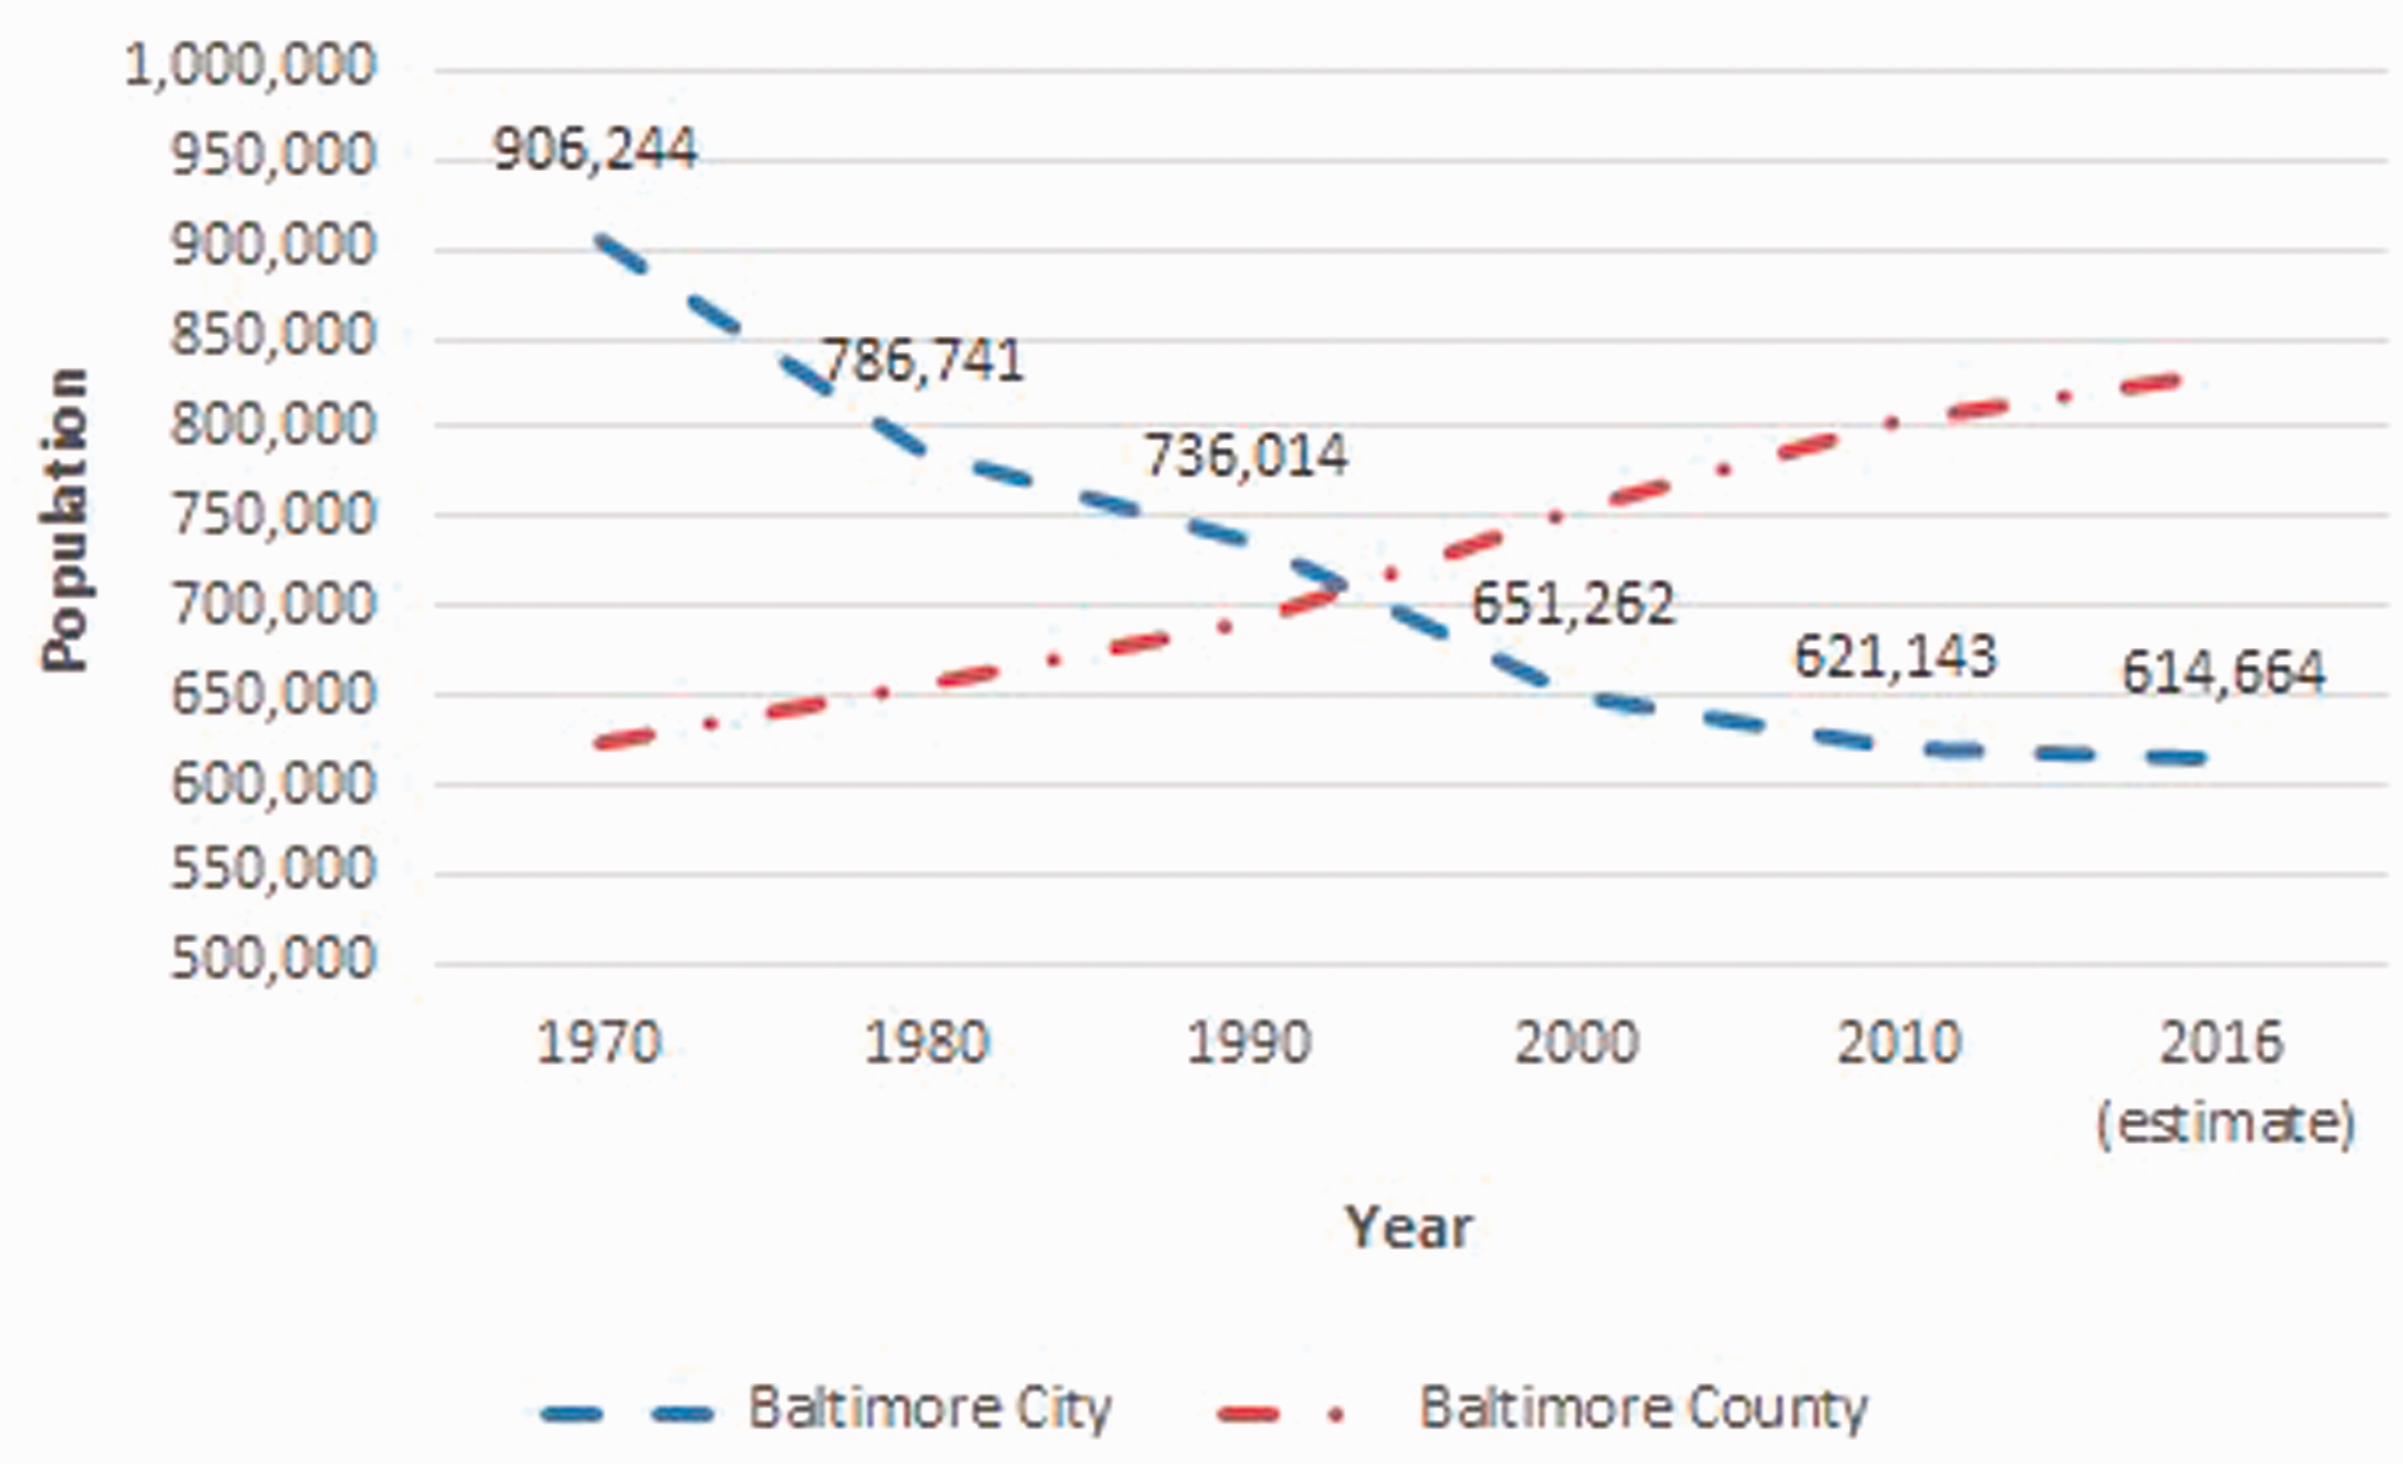
Shrinkage may be measured on the basis of population loss, change in housing stock, house abandonment or housing vacancy. These metrics, and the data used to quantify them, have various advantages and drawbacks. Housing vacancy is usually measured using data from the U.S. Census, which has the advantage of being easily available and nationally applicable. However, these data do not account for demolished houses, which can strongly influence the quality of the built environment, and are aggregate, making unit-level analysis impossible. Measures of shrinkage based on housing demolition are also popular. Lists of demolished housing structures are often available through local planning departments and are easily geocoded.
Other shrinkage measures are defined based on specific study needs and data, such as research interests, data accessibility and subjective assessments of the condition of study areas (Morckel, 2013). Our focus in this paper is on the dynamics of housing demolition rather than housing vacancy and abandonment because capturing historical changes in housing vacancy is not possible with the data and methods available to us at this time. Therefore, we treat demolition as a proxy for vacant and abandoned buildings reaching a critical stage of decay.
City of Baltimore and row house neighborhoods
For more than 150 years, row houses were the dominant house type in the city of Baltimore. Between the Civil War and the World War I, Baltimore went through rapid industrialization. Speculatively built row houses provided shelter that modestly-paid workers could afford, and symbolized homeownership and stability for the city’s working and middle classes (Hayward and Belfoure, 1999). Those row house neighborhoods were within the walking distance to local employment and amenities (Figure 2).
Historical photo of Baltimore Row House in 1874.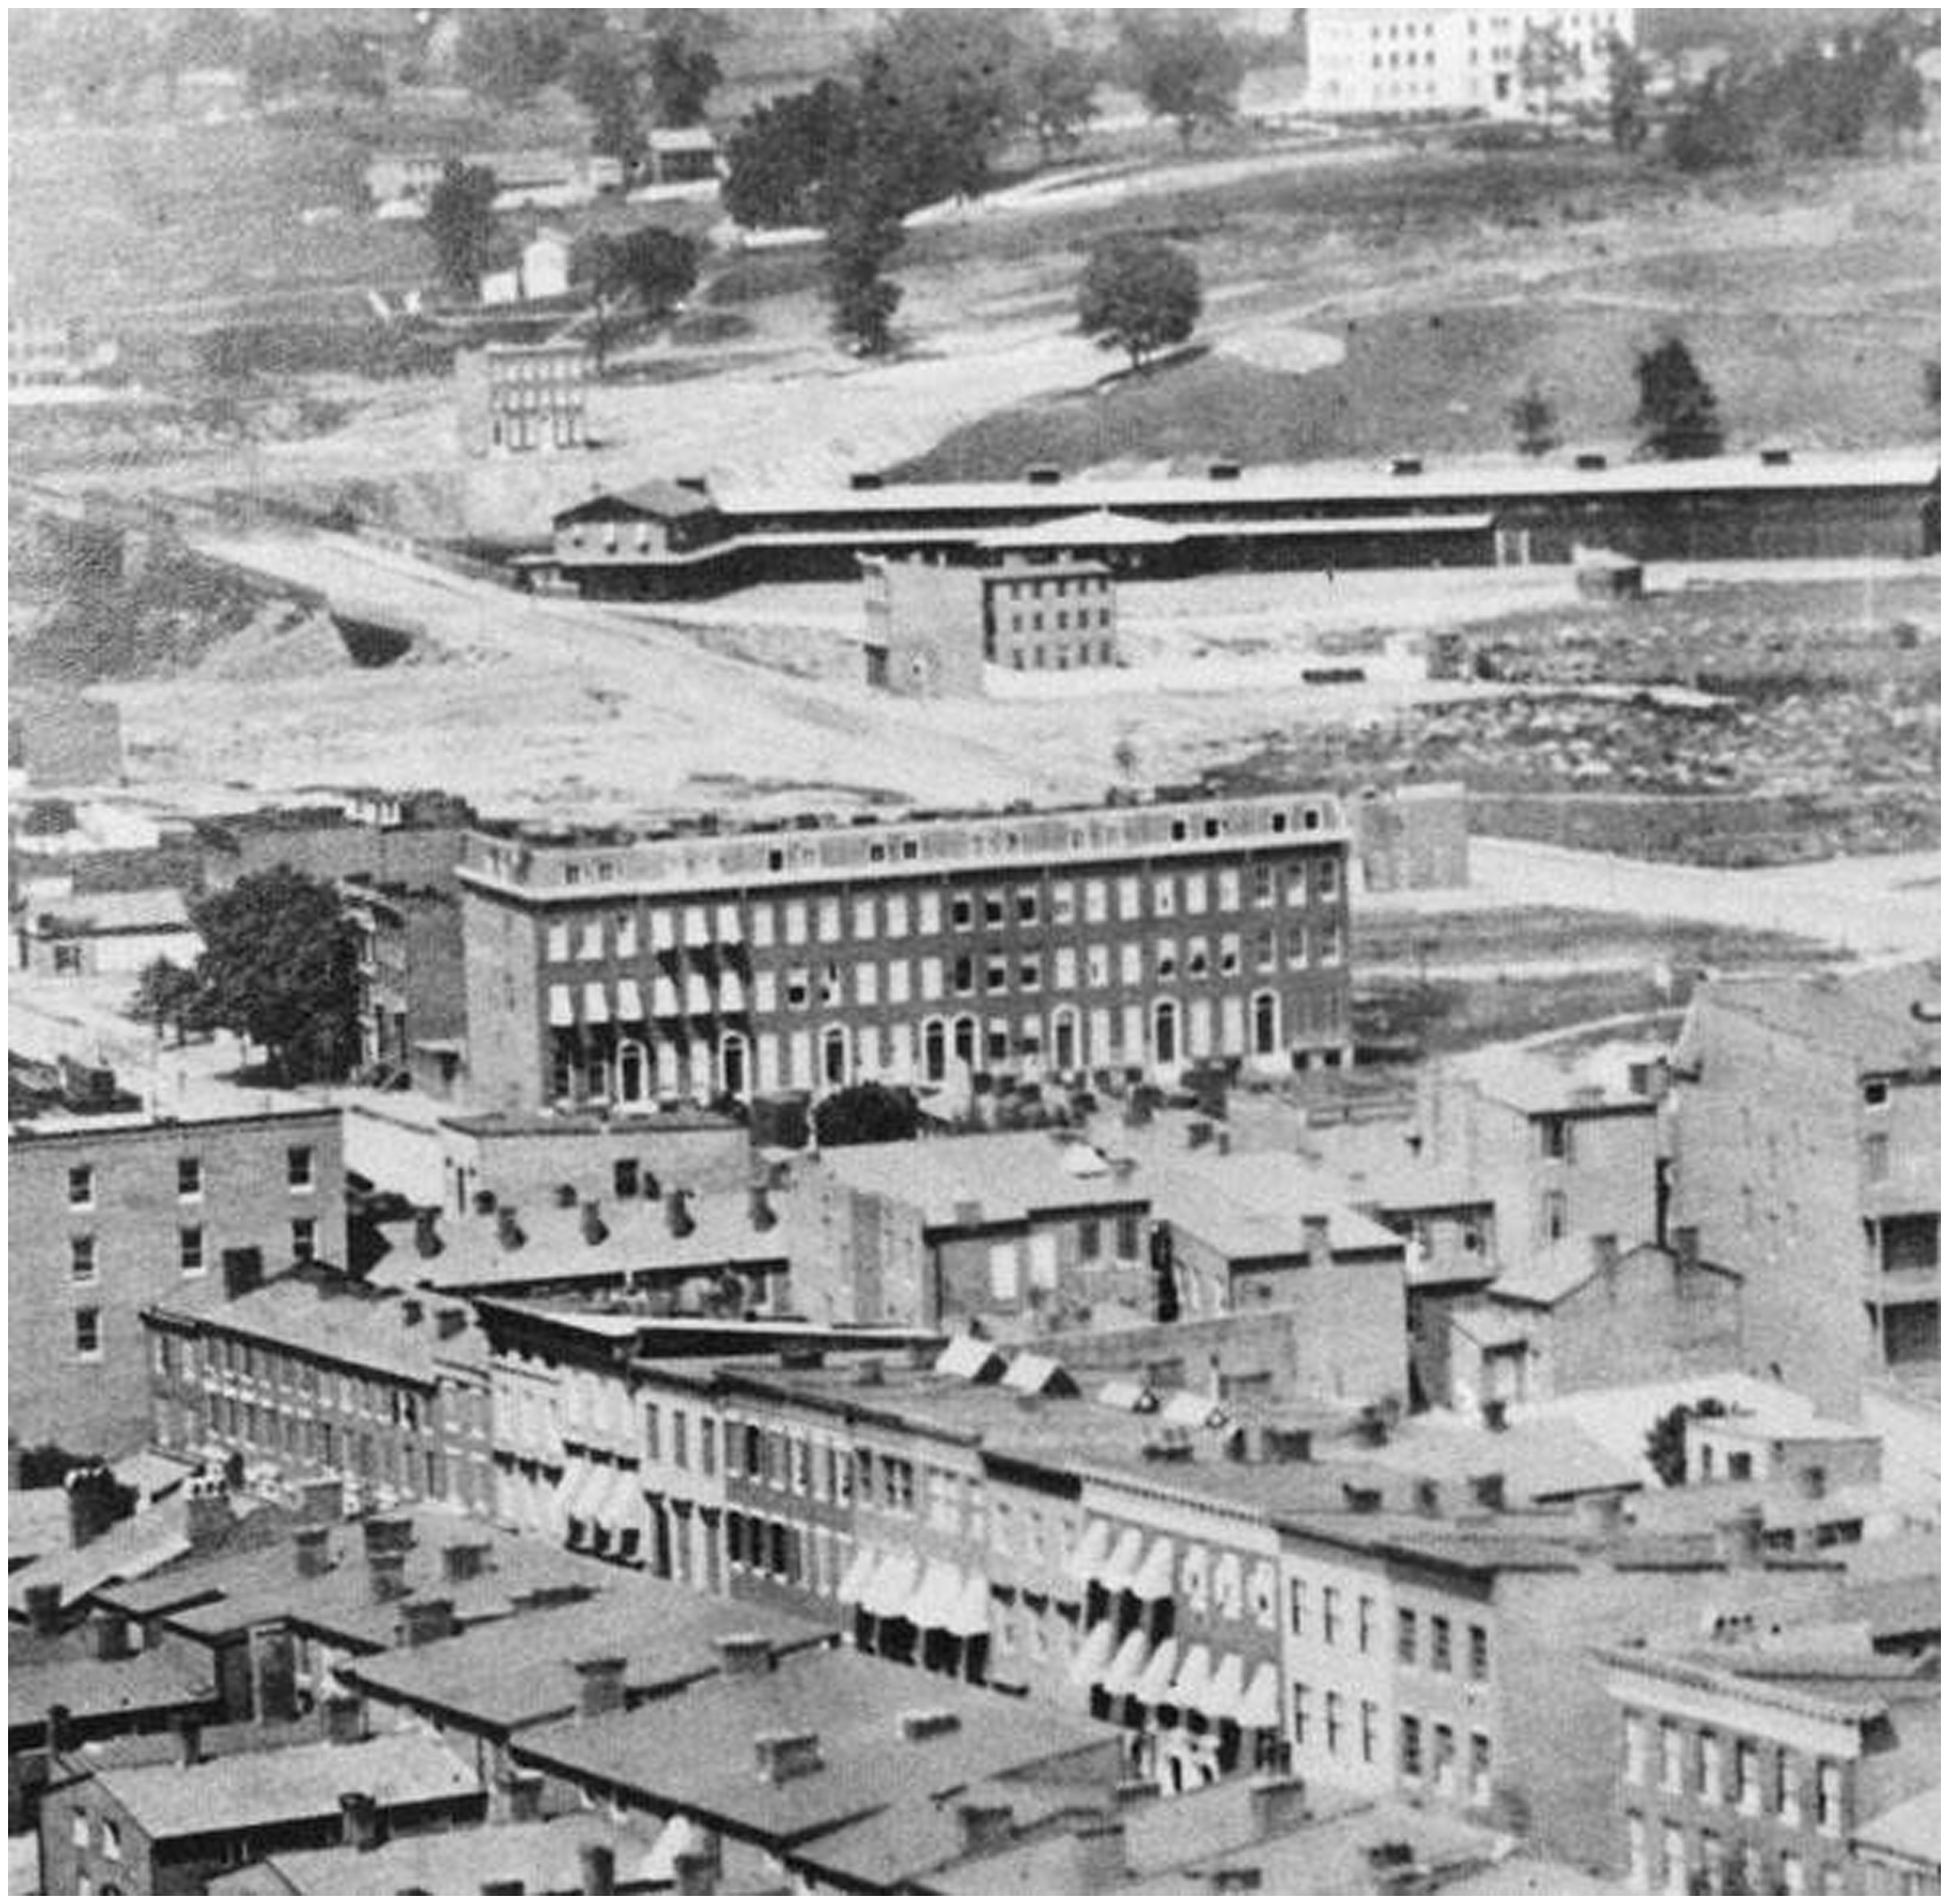
In the 19th-century, more affluent families tended to live in high-ceilinged, three-story row houses, which were often built along main streets or looking onto parks. Poorer families inhabited smaller, lower-ceilinged, two-story row houses (Hayward and Belfoure, 1999).
After World War II, the intimate relationship between workplaces and housing frayed (Hayward and Belfoure, 1999). The decline in urban manufacturing, especially along the Baltimore waterfront, was associated with a deterioration of nearby residential areas. Residents increasingly relocated from high-density and walkable row house neighborhoods to job-rich suburbs designed for vehicle transport and dominated by tract houses (Hayward and Belfoure, 1999). As more residents moved out, neighborhoods became poorer and crime-ridden; many houses were sold to absentee landlords or deteriorated after their elderly owners died. Derelict houses have given their neighborhoods a shabby appearance, exacerbating the sense of decline (Langdon, 2001).
Urban physical characteristics and housing abandonment, vacancy and demolition
There is an extensive literature on demographic, social and economic elements related to housing abandonment. Abandoned properties are generally understood to lower property values and increase crime rates (Keenan et al., 1999). Cohen (2001) examines policy, planning and community development explanations for and responses to abandoned housing in Baltimore. Our focus, however, is on the relationship between the built environment and housing abandonment and demolition. Here, the literature is less well-developed.
Urban density is a useful tool for planners to control land use, urban form and community development (Mills, 1970). With more than four decades of sprawling of American cities, the high density urban form is drawing more attention since it is firmly related to many planning strategies like transit oriented development, mixed use development and green development (Steemers, 2003). Many studies have identified a positive association between high density and neighborhood redevelopment (Ryan, 2012).
It is useful to examine the literature on urban morphology, which helps to understand the physical form of the city and the way that this form reflects ideas, uses and policies (Gauthier and Gilliland, 2006). Urban morphology can be studied using observations of block size and properties, building footprints, and street network properties. Physical characteristics that provide insight into urban morphology include, for example, the orthogonal grid street structures typical of North American industrial towns (Rohloff, 2013) or redeveloped waterfronts intended to support downtown revitalization in cities such as Cleveland or Baltimore (Coppola, 2014).
Mallach (2011) provides a detailed history of the physical characteristics of shrinking cities in the U.S. His analysis makes reference to causes, impacts, classification of urban spaces within shrinking cities and planning responses to morphological changes. Hollander (2013) observed the changing footprints of buildings in New Bedford, MA during that city’s depopulation using Sanborn Fire Insurance Maps, tracking the demolition and reclamation of vacant land. Rohloff (2013) examines the morphological implications of efforts to revitalize the former mill town of Holyoke, MA. In another example, the Stadtumbau Ost program (Urban Restructuring in Eastern Germany) provided funding to support widespread demolition to support the reuse of land for lower intensity uses (Oswalt and Rienitz, 2006). The Mallach, Rohloff, and Hollander studies are indicative of a growing body of knowledge related to how the physical form of shrinking cities has evolved in response to depopulation and deindustrialization. These studies also provide support for innovative strategies for land re-use that generate new morphologies better aligned with new population levels, new products and services and an improved quality of life.
Building footprints and urban studies
Maps and sketches of building footprints have long provided useful information for architecture and planning (Laycock et al., 2011). Footprint data can support study on interactions between urban construction and urban ecosystems and the relationship between building scale and energy efficiency as well as green building and neighborhood design (Wang et al., 2006).
Developments in computer science and picture processing have enabled advanced use of building footprint data. Ellis et al. (2006) have interpreted high-resolution images from remote sensing data and aerial photos into different land types, then analyzing the data change in each pixel by overlaying multiple layers. Historical data can be transformed into high-resolution data for GIS analysis to better understand urban spatial characteristics.
Building footprint data can demonstrate changes in towns and cities over time as well as the impact of human-dominated processes on biodiversity and ecosystem processes (Laycock et al., 2011). However, building footprint data have been used less often to examine urban shrinkage.
Research design
The conceptual framework for our study is based on possible connections between changes in urban housing footprints in selected neighborhoods in Baltimore and neighborhood physical and social characteristics. These proposed connections reflect current planning knowledge regarding factors associated with urban shrinkage (Newman et al., 2016a, 2016b; Ryan, 2012).
Our study focuses on five row house neighborhoods in East Baltimore: Better Waverly, Broadway East, Coldstream Homestead Montebello, East Baltimore Midway and Oliver (see Figure 3).
East Baltimore neighborhoods study area.
We have used data from these neighborhoods for a previous study on alternative uses for collections of parcels containing vacant, abandoned and demolished housing structures (Johnson et al., 2015). These neighborhoods were chosen in collaboration with Baltimore planners who identified them as among the most distressed in the city and worthy of detailed analysis.
We first perform a descriptive analysis, consisting of definitions and observations of the study area and spatial characteristics of building footprint changes between 1972 and 2010. We then perform an exploratory analysis, in which we examine the clustering characteristics of building footprint changes between 1972 and 2010 and associations between building footprint changes and neighborhood physical and socio-economic characteristics. We test the following hypotheses: H1: There is a statistically significant level of clustering of housing losses. H2: There is a statistically significant association between building footprint changes in the study neighborhoods and selected physical characteristics of housing units and the surrounding neighborhood. H3: There is a statistically significant association between building footprint changes and changes in selected neighborhood-level socio-economic characteristics.
Results from our descriptive and exploratory analyses provide the foundation for policy and planning prescriptions and suggestions for further analysis.
Data acquisition
Building footprint data: 1972 and 2010
In this study, we use building footprint data derived from historical image data of Baltimore from 1972 as well as vector data from 2010. The 1972 data are based on high-resolution aerial photographic maps of the city of Baltimore produced for the Baltimore City Planning Department. These photos were scanned by Johns Hopkins University and converted to publicly-available image files in 2011 (JScholarship, 2017). 2010 building footprint data for our study area were derived from citywide building footprint data published by the city of Baltimore in 2008 (OpenBaltimore, 2008a), augmented by Google Earth images downloaded in 2010.
We have chosen baseline data from 1972 for two reasons. First, the 1972 maps are the best-quality historical data available to us: the plotting scale is as high as 1:4800, and it covers all of our study area. In addition, 1972 represents an era in which Baltimore neighborhoods, though facing economic decline as described previously, maintained the physical integrity of its physical structures.
Spatial data preparation and analysis were done using ArcMap 10.0 (ESRI, 2016). The JPEG file of the 1972 map was first assigned with a reference system and then georeferenced to the building footprint layer. After overlaying the two data layers, we compared the building footprints of the two time points and recorded the change data into a new point data layer with an indicator taking on ternary values distinguishing between a housing loss, i.e. that a building footprint that existed in 1972 has disappeared as of 2010; a standing structure, i.e. that a building footprint that existed in 1972 and remains as of 2010, and a housing increase, i.e. that a new building footprint as of 2010 has no corresponding footprint in 1972. Since there were no instances of housing increases in our study area, our primary dependent variable, Building Footprint Change, is treated as a binary variable. Figure 4 shows this extraction process for a four-block pilot area.
Example of building footprint change analysis.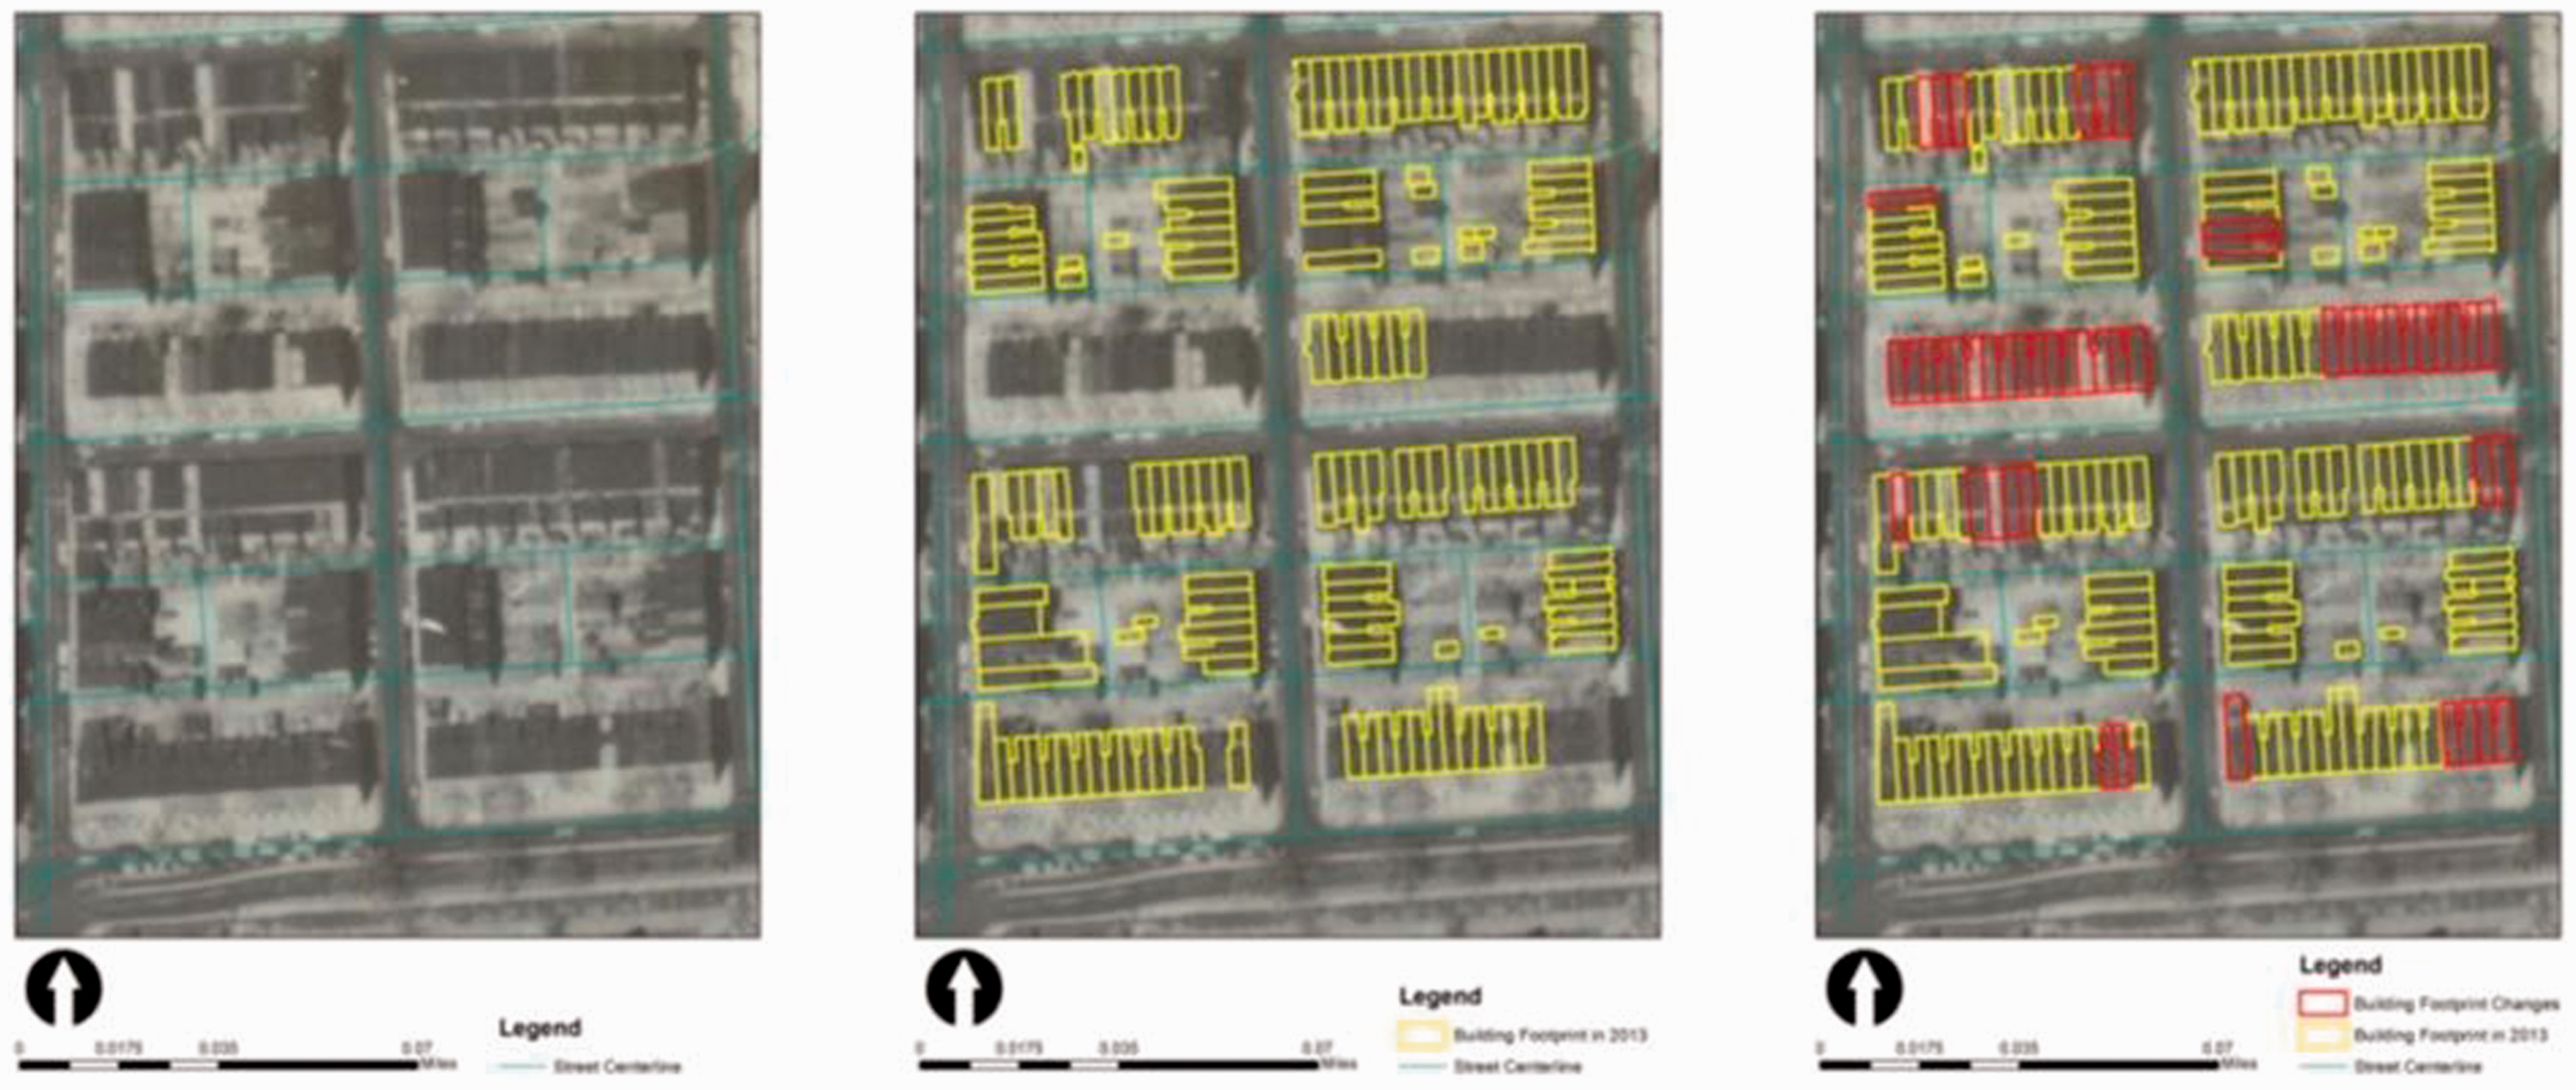
Physical neighborhood characteristics: 2010
Scholars such as Morckel (2013) and Fol (2012) have demonstrated that a wide range of variables are associated with property vacancy and abandonment. We adapt this work to define two sets of relevant factors: physical neighborhood characteristics and socio-demographic neighborhood characteristics. Based on these studies, we present five physical factors of our study area by which to determine impacts associated with building footprint change: density of surrounding area (Density); housing change in the surrounding area (Housing Change); green space accessibility (Green Space); location in the body of a row of housing units as opposed to a corner (Location), and location facing an alley as opposed to a street (Alley). The unit of analysis for each variable is the building parcel. Density is measured for each building footprint as number of housing units per acre, using 1972 data, within a 150-foot buffer (see Figure 5).
Calculation of housing density of surrounding area.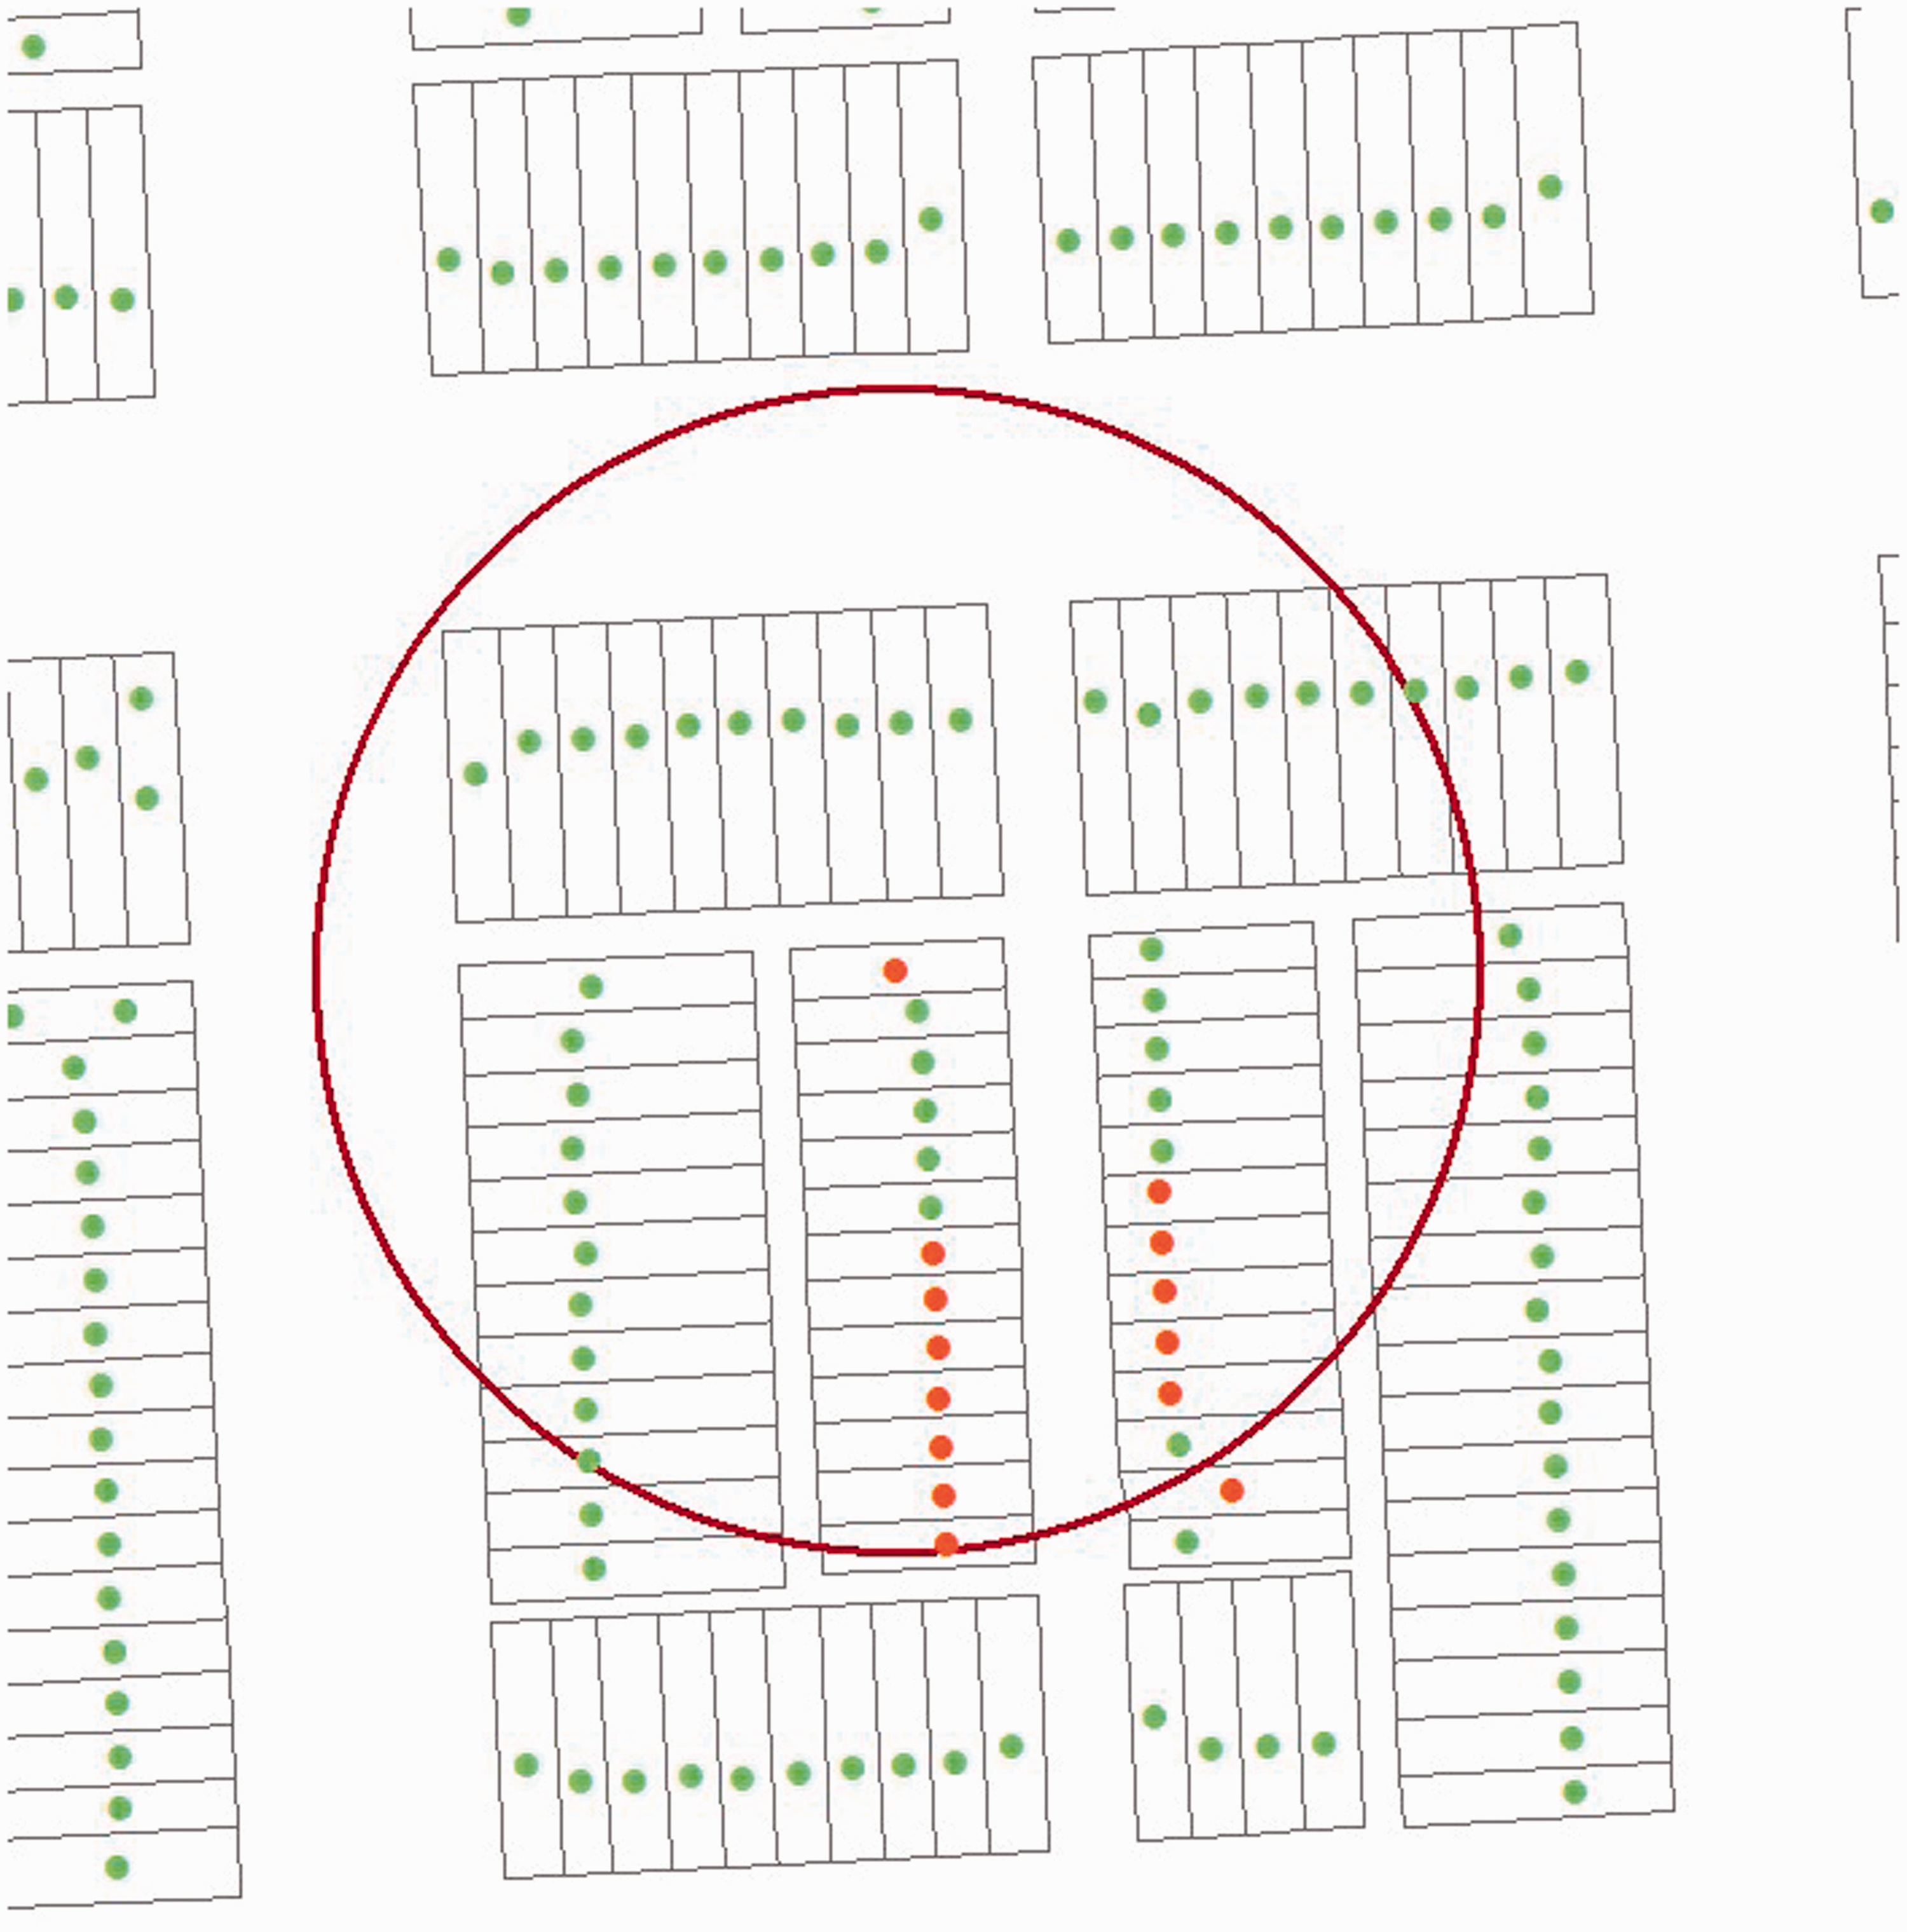
Housing Change is measured for each building footprint as the number of housing units lost between 1972 and 2010 within a 150-foot buffer. Green Space is measured as the time in minutes required to walk from each house to the nearest green space, according to land use and road centerline data provided by the City of Baltimore’s OpenBaltimore portal (OpenBaltimore, 2008b, 2008c). Location is represented by an index measuring whether a house is at the two ends of the row. If the house at the end of the row, the building footprint index is set to one, otherwise to zero. Alley is represented by an index measuring if a row house is of regular size and located along neighborhood streets roads (index set to zero), or, alternatively, if it is narrower, of smaller size and facing an alley (index set to one).
Socio-economic neighborhood characteristics: 1970 and 2010
We measure the strength of association between building footprint changes in our study area and changes in the values of select socio-economic indicators. We focus on four variables consistently employed in similar empirical studies such as Morckel (2013) and Fol (2012): the change in population density between 1970 and 2010 (Population Density); percentage change in African-American population between 1970 and 2010 (African-American); change in unemployment rate between 1970 and 2010 (Unemployment), and percentage change in family poverty rate between 1970 and 2010 (Poverty). We will use Census data from 1970 and 2010 as sources for these variables.
Dependent and independent variables.
We augmented our analysis of secondary physical and socio-economic data for our study area with in-person observations of portions of the study area in 2013.
Descriptive analysis
Current physical appearance and land-use characteristics
The five-neighborhood study area is a high-density, residential-dominant, multi-use region. More than half of the land uses in the study area as of 2008 are devoted to residential housing (Figure 6).
Land uses in the study area.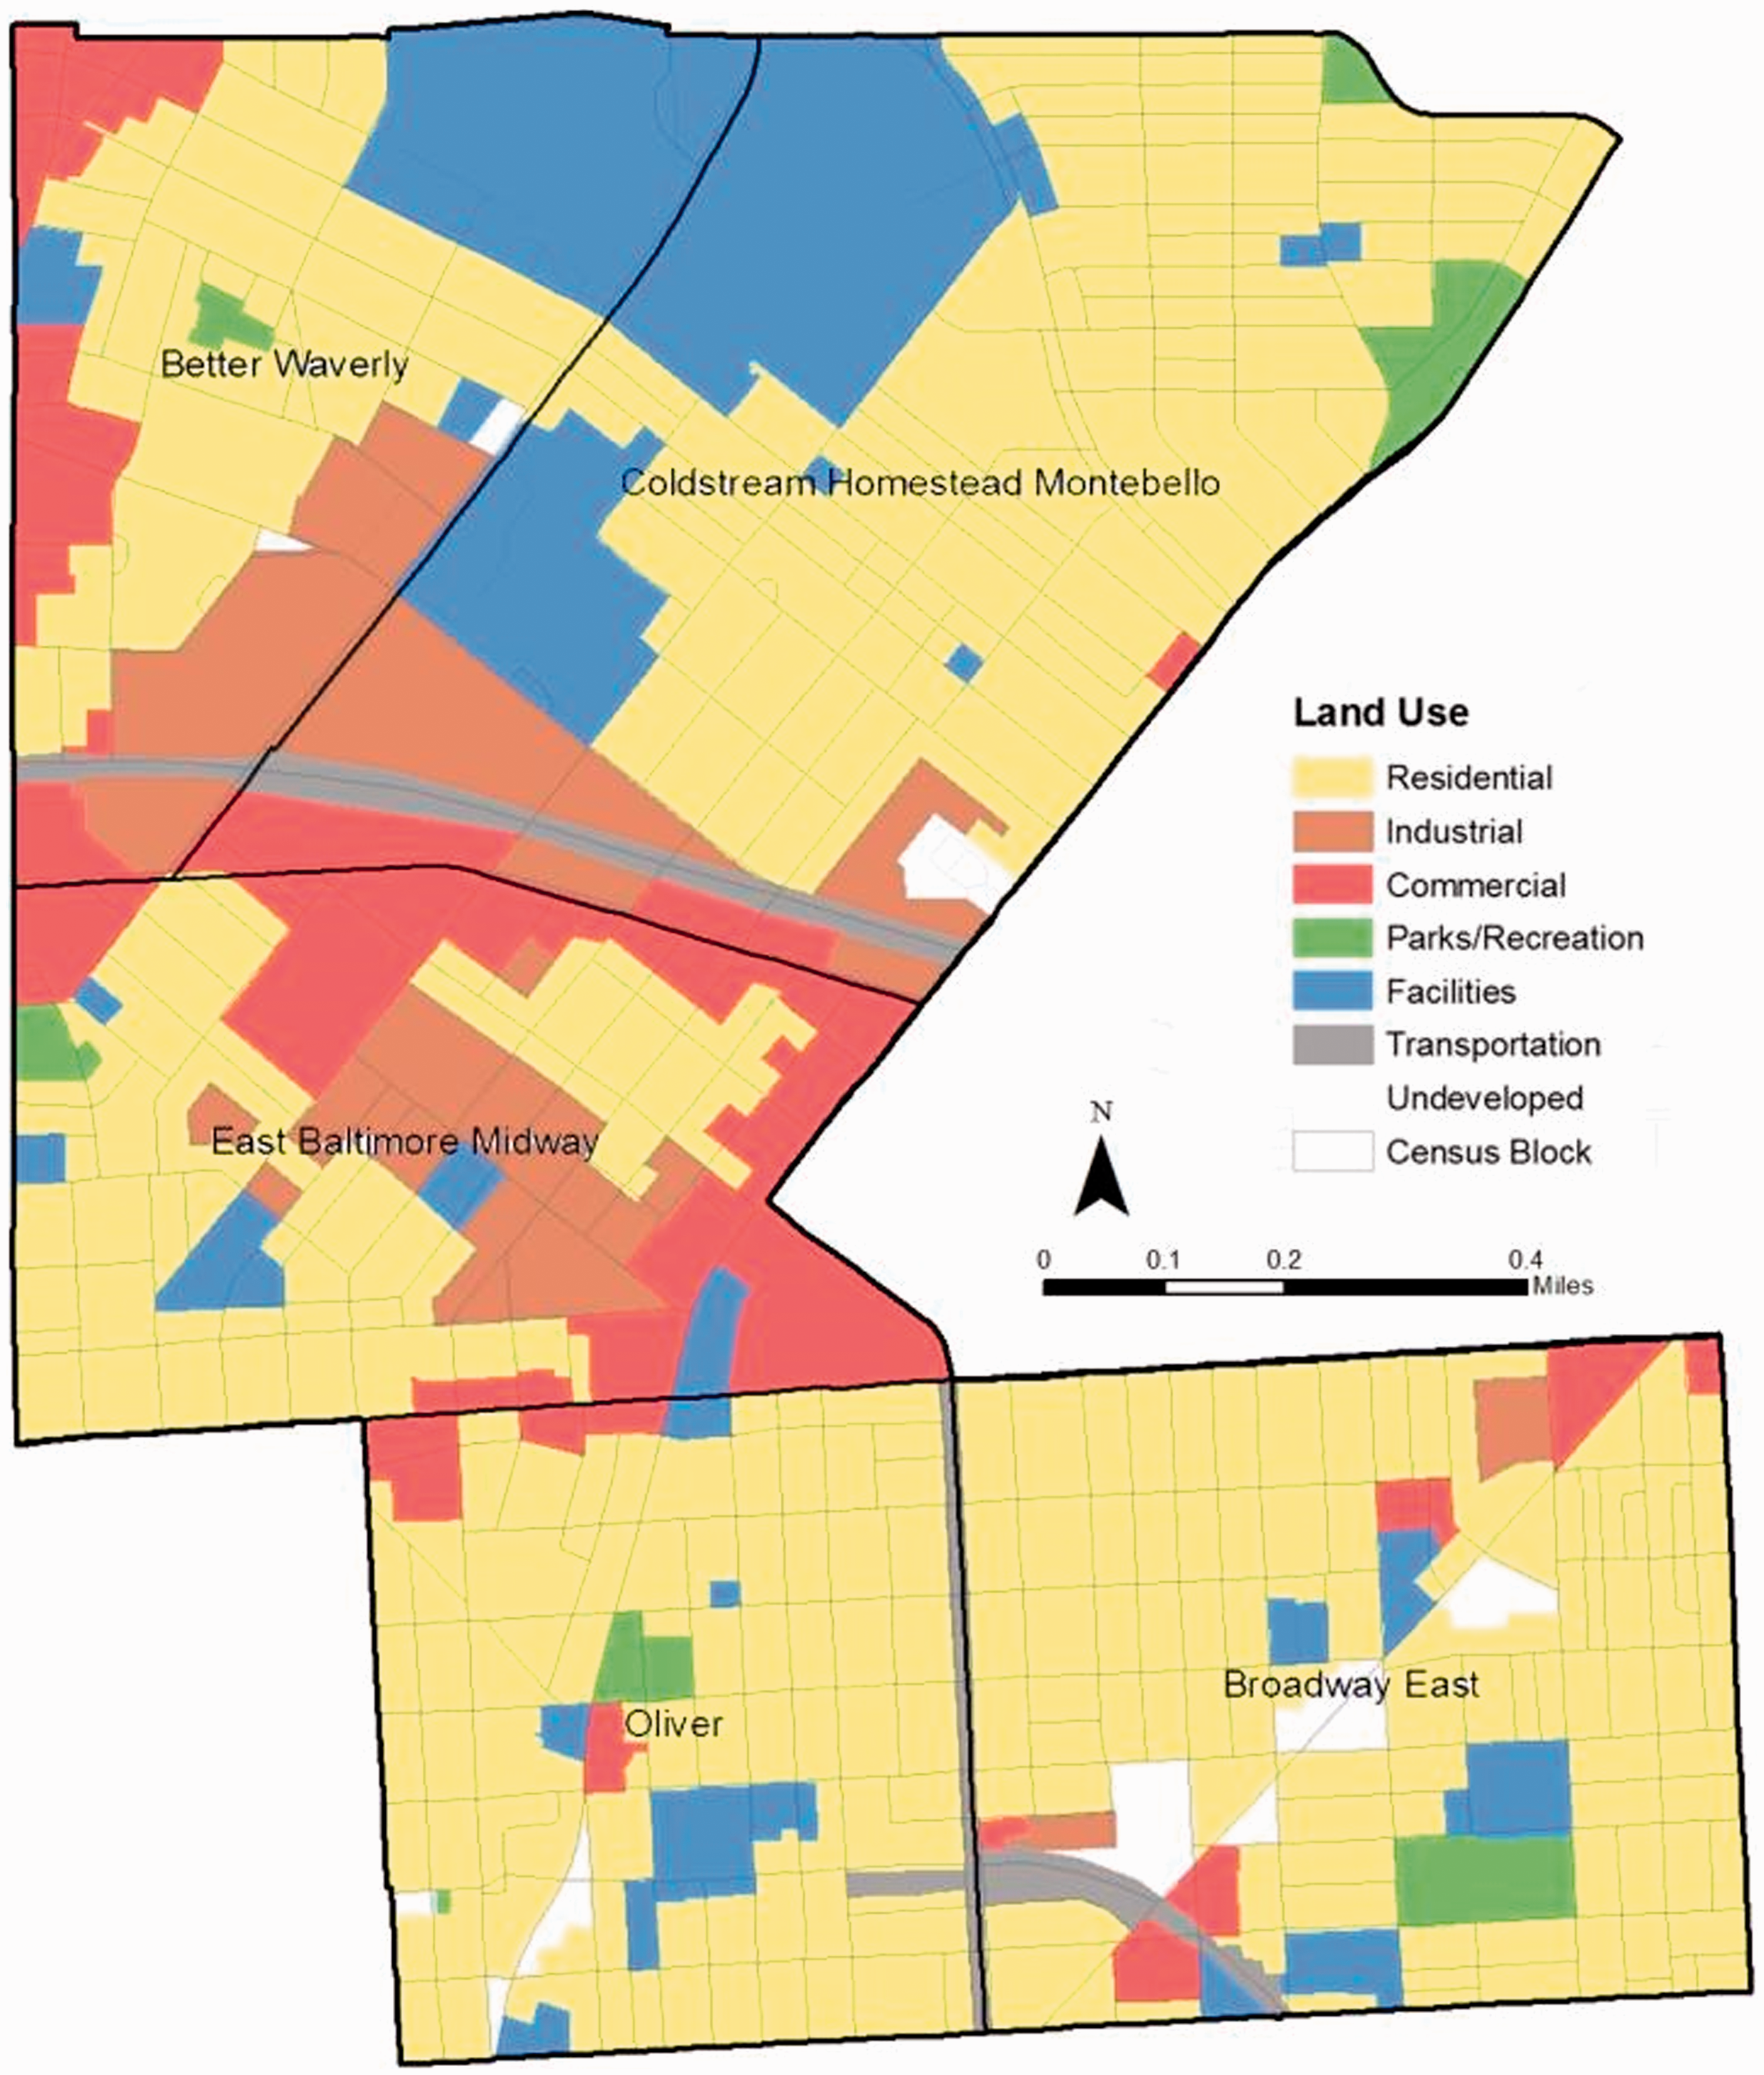
Baltimore City College and Johns Hopkins University Emerging Technologies Center are located in the northern part as the facilities land use area. Commercial land is clustered with industrial land along railroad tracks, the remaining urban patterns of a once-booming industrial city. Though these neighborhoods were designed as park-centered (Cohen, 2001; Hayward and Belfoure, 1999), total green space appears to be quite limited. Streetscapes in the study area are dominated by two- or three-story brick row houses; many unoccupied row houses have their doors and windows covered by plywood, chipboard or sheet metal, or left open to the elements.
Current building footprints
Examination of building footprints as represented in GIS yields insights not immediately apparent either in aerial photos or street-level view. Figure 7 shows a collection of row-house blocks in the Oliver neighborhood, similar to many in the Broadway East and East Baltimore Midway neighborhoods and the densest arrangement of housing units across the five study neighborhoods. Four columns form the outline of a square housing group. The houses in each column are of two types. Those on the outer left and right columns as well as those at the top and bottom of the two interior columns top and bottom, face sidewalks and neighborhood streets and do not have front yards. Those in the interior of the block face an alley. The street-facing row houses are typically 15 feet wide by 75 feet long, while the alley row houses are 10.5 feet wide by 50 feet long. The alleys that provide access to these smaller units are as narrow as 10 feet across, poorly paved, and often a dumping ground for rubbish and a source of criminal activity.
Oliver neighborhood: building footprints and bird’s-eye view.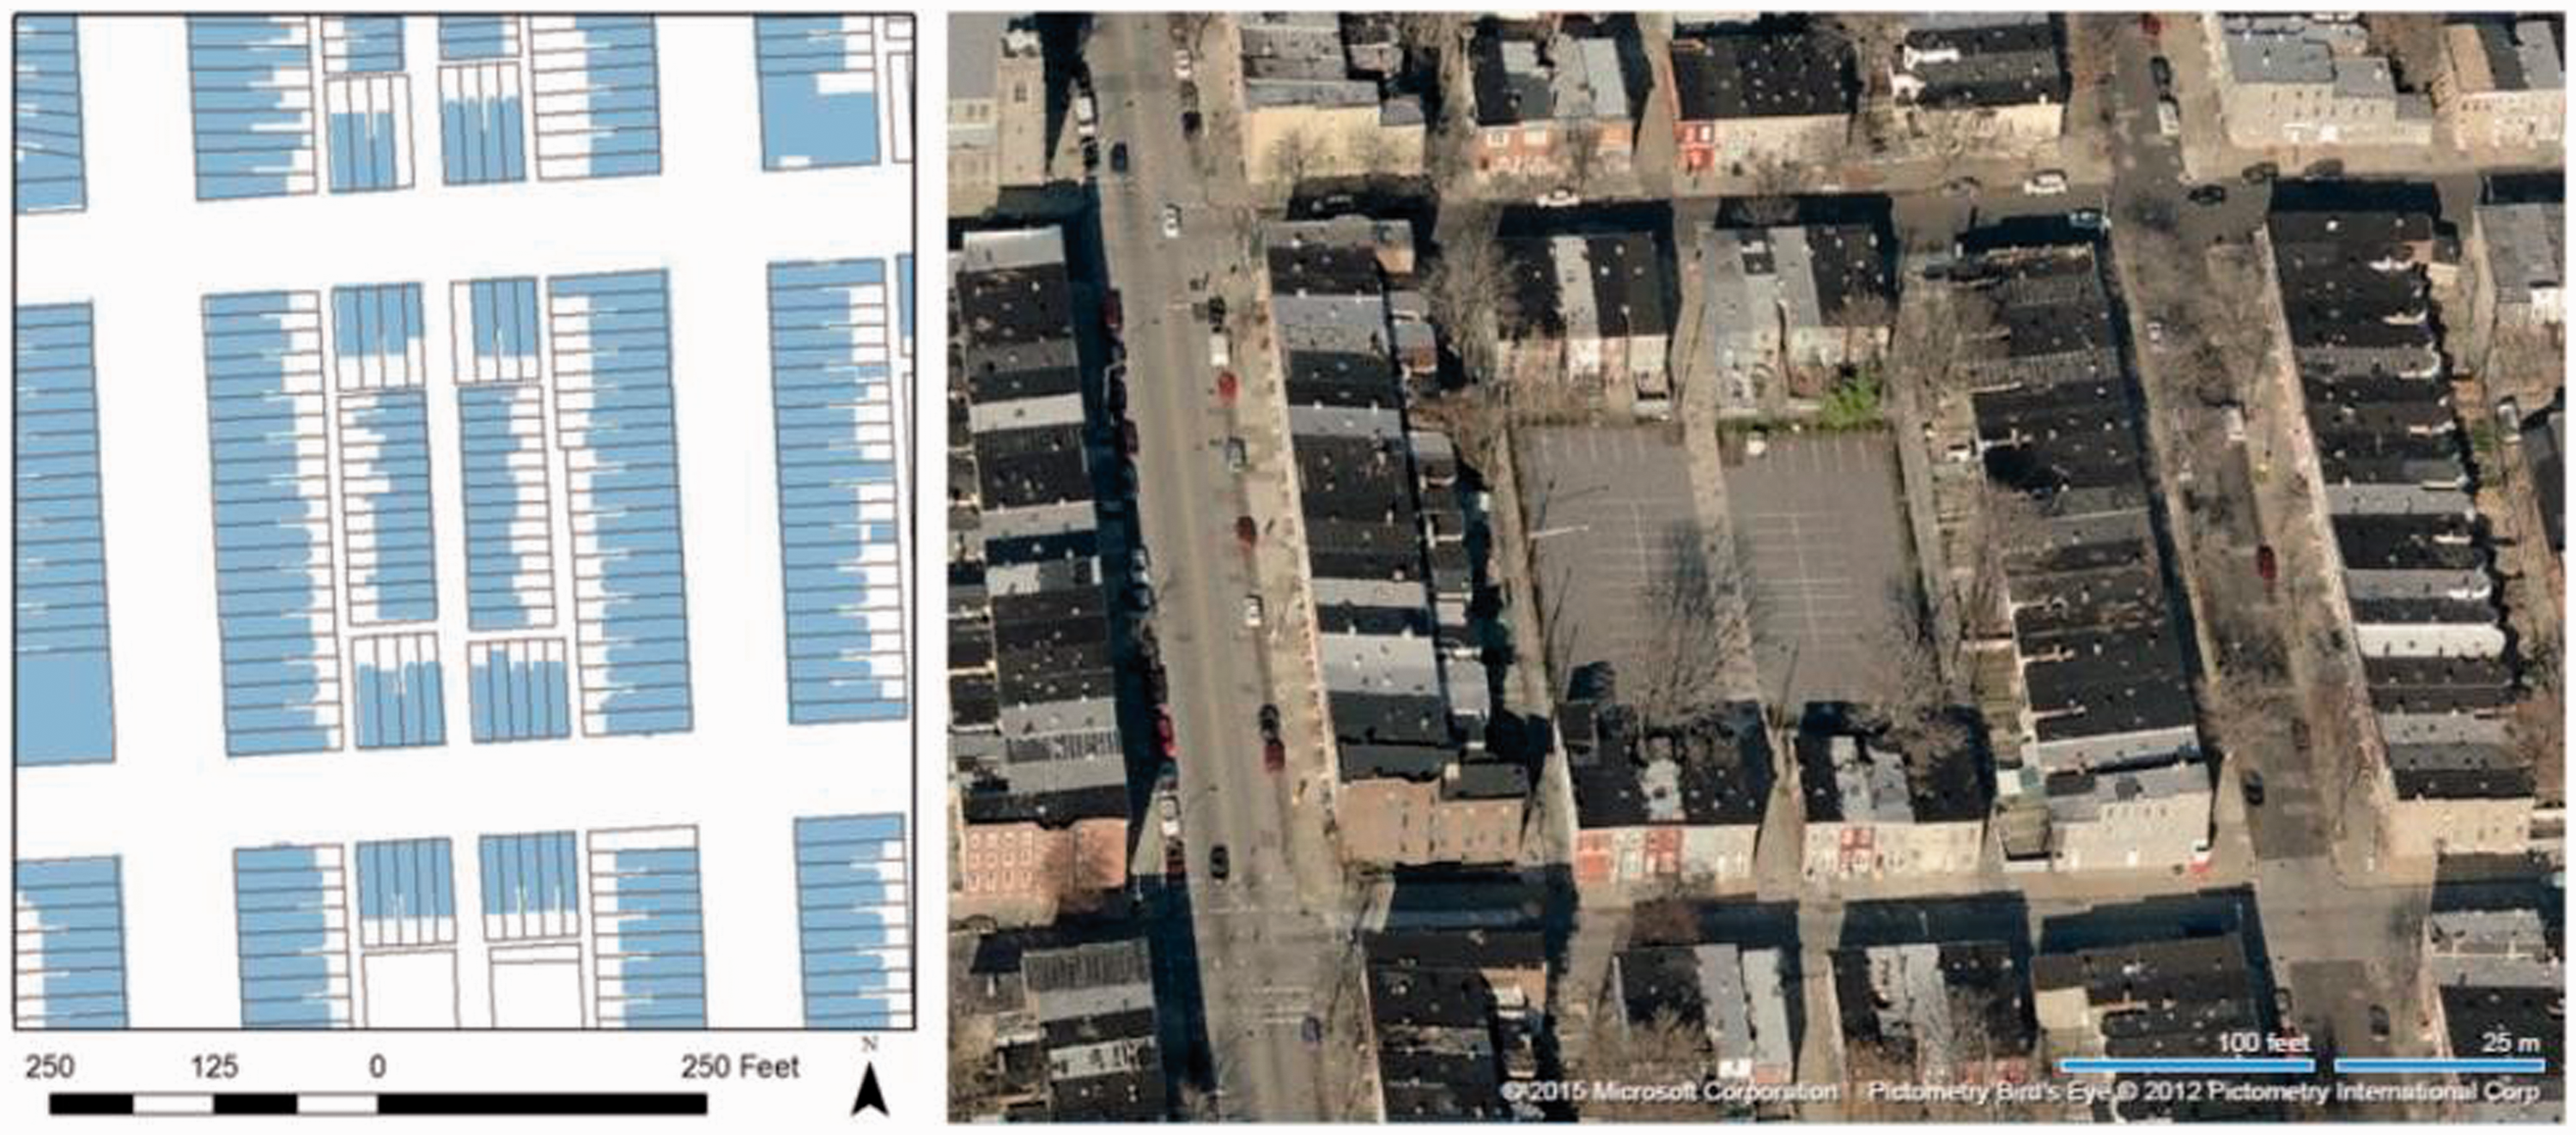
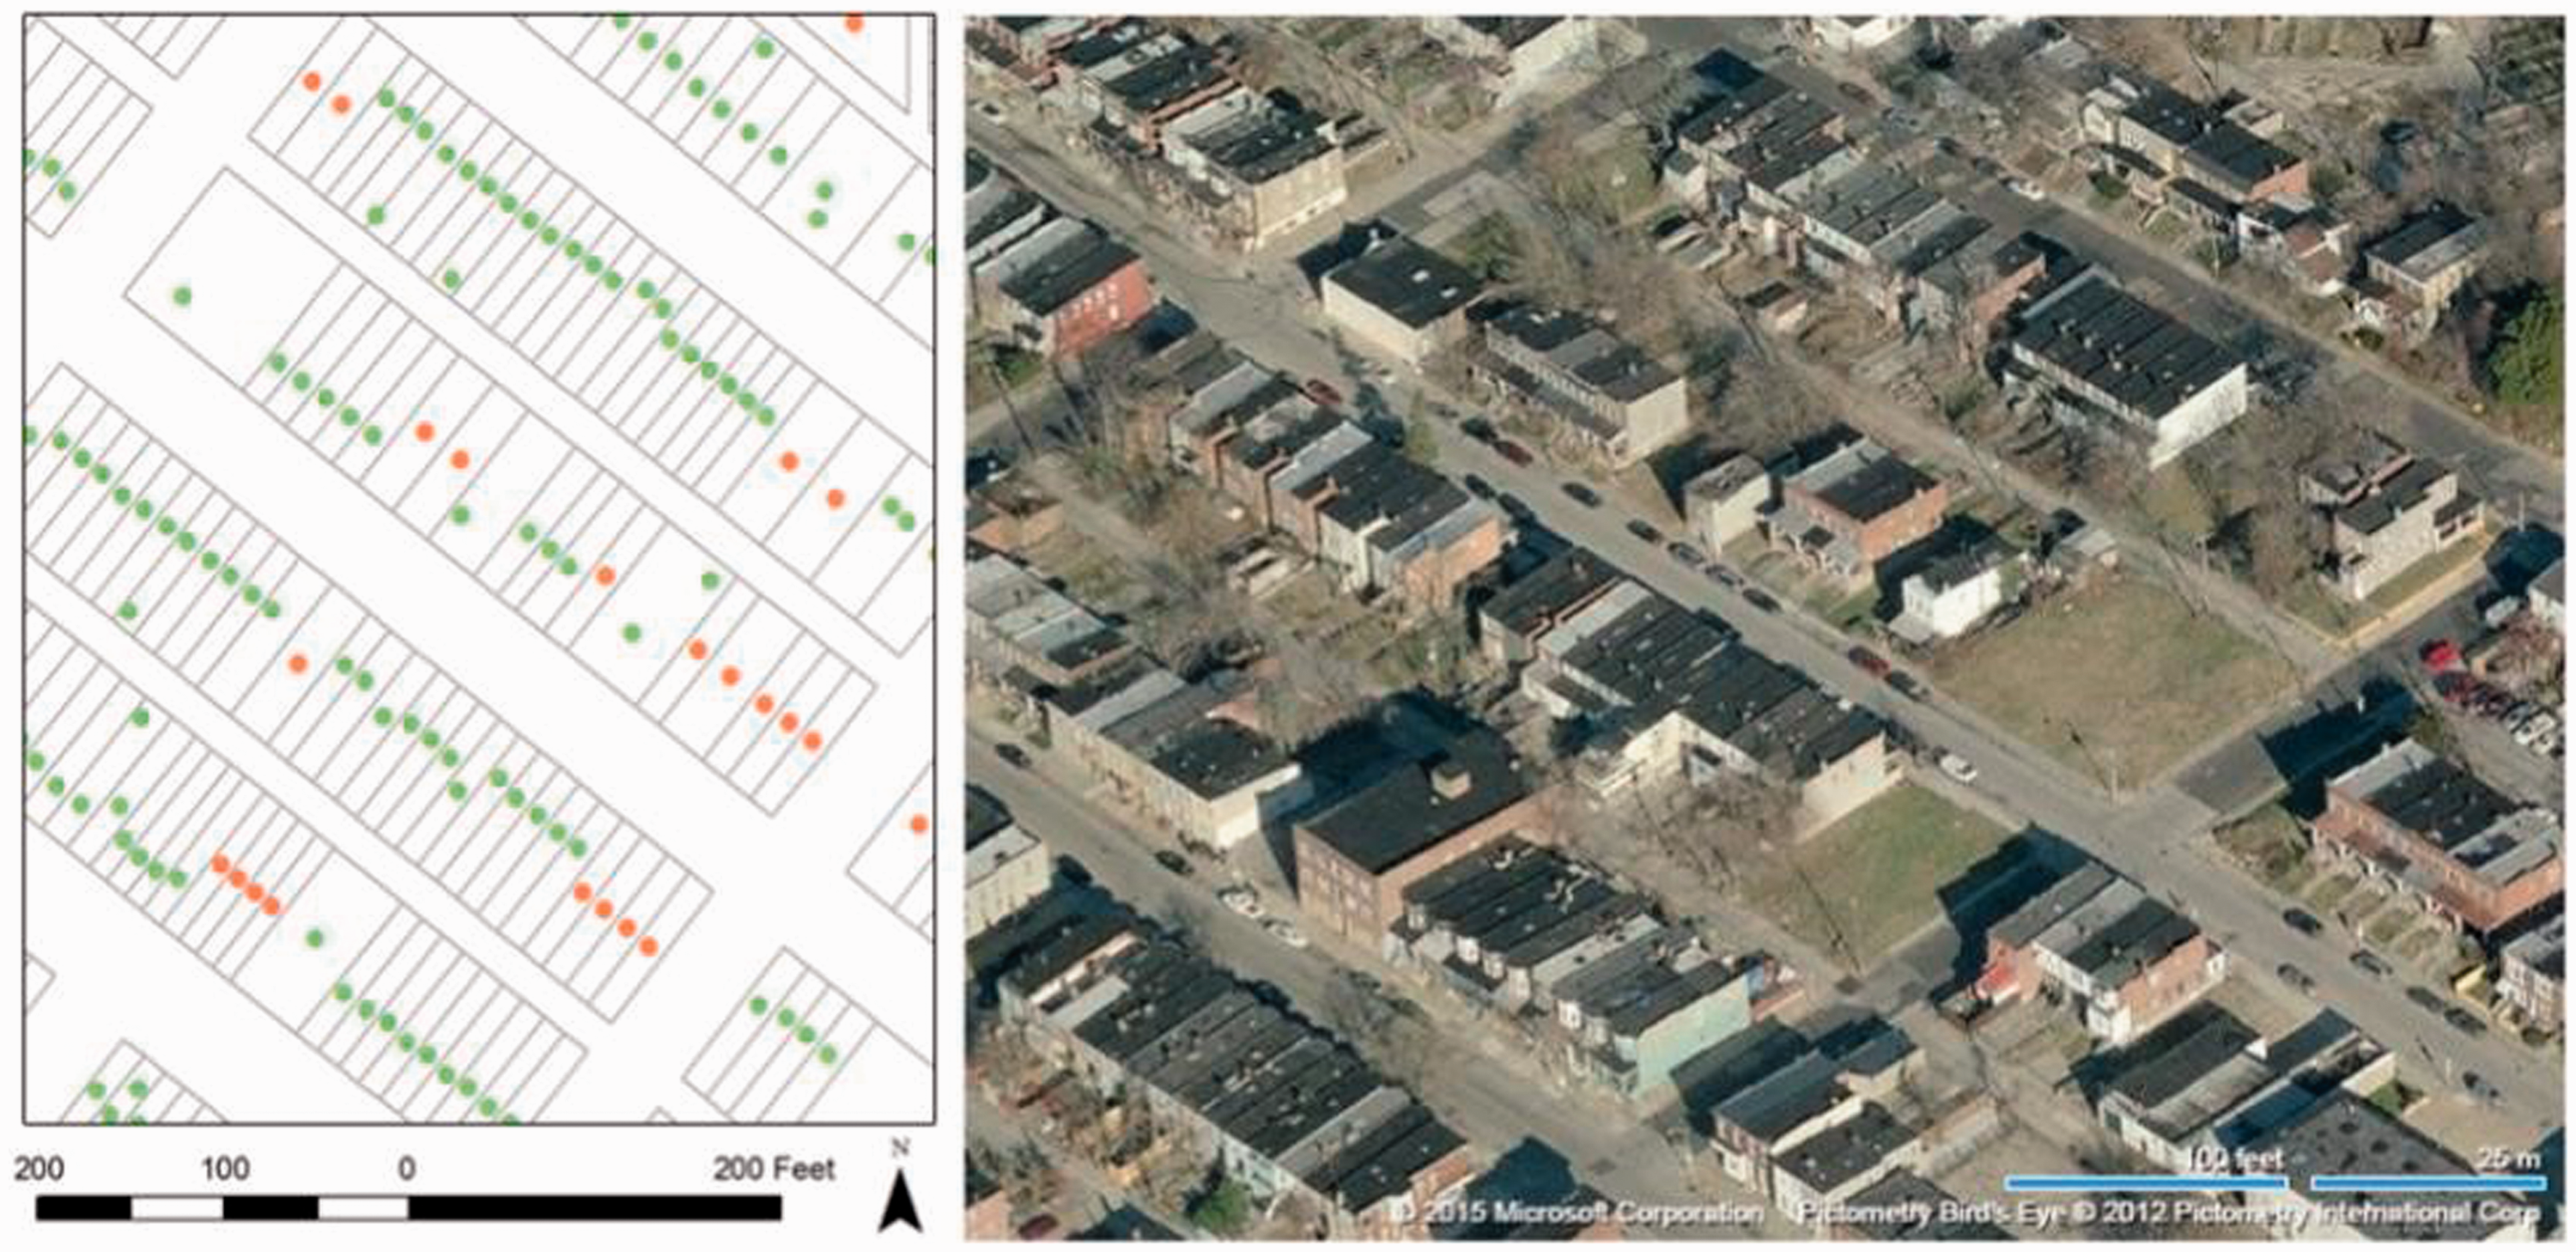
Another style of housing units, shown in Figure 8, is less dense and offers better living conditions. Mainly located in the Coldstream Homestead Montebello, Better Waverly and north East Baltimore Midway neighborhoods, this configuration consists of two rows of row houses, separated by an alley. Each row faces a neighborhood street, and the building parcels, up to 100 feet long and between 15 and 22 feet wide, allow for a front and back yard and a more spacious dwelling area.
Coldstream Homestead Montebello Neighborhood: building footprint and bird’s-eye view.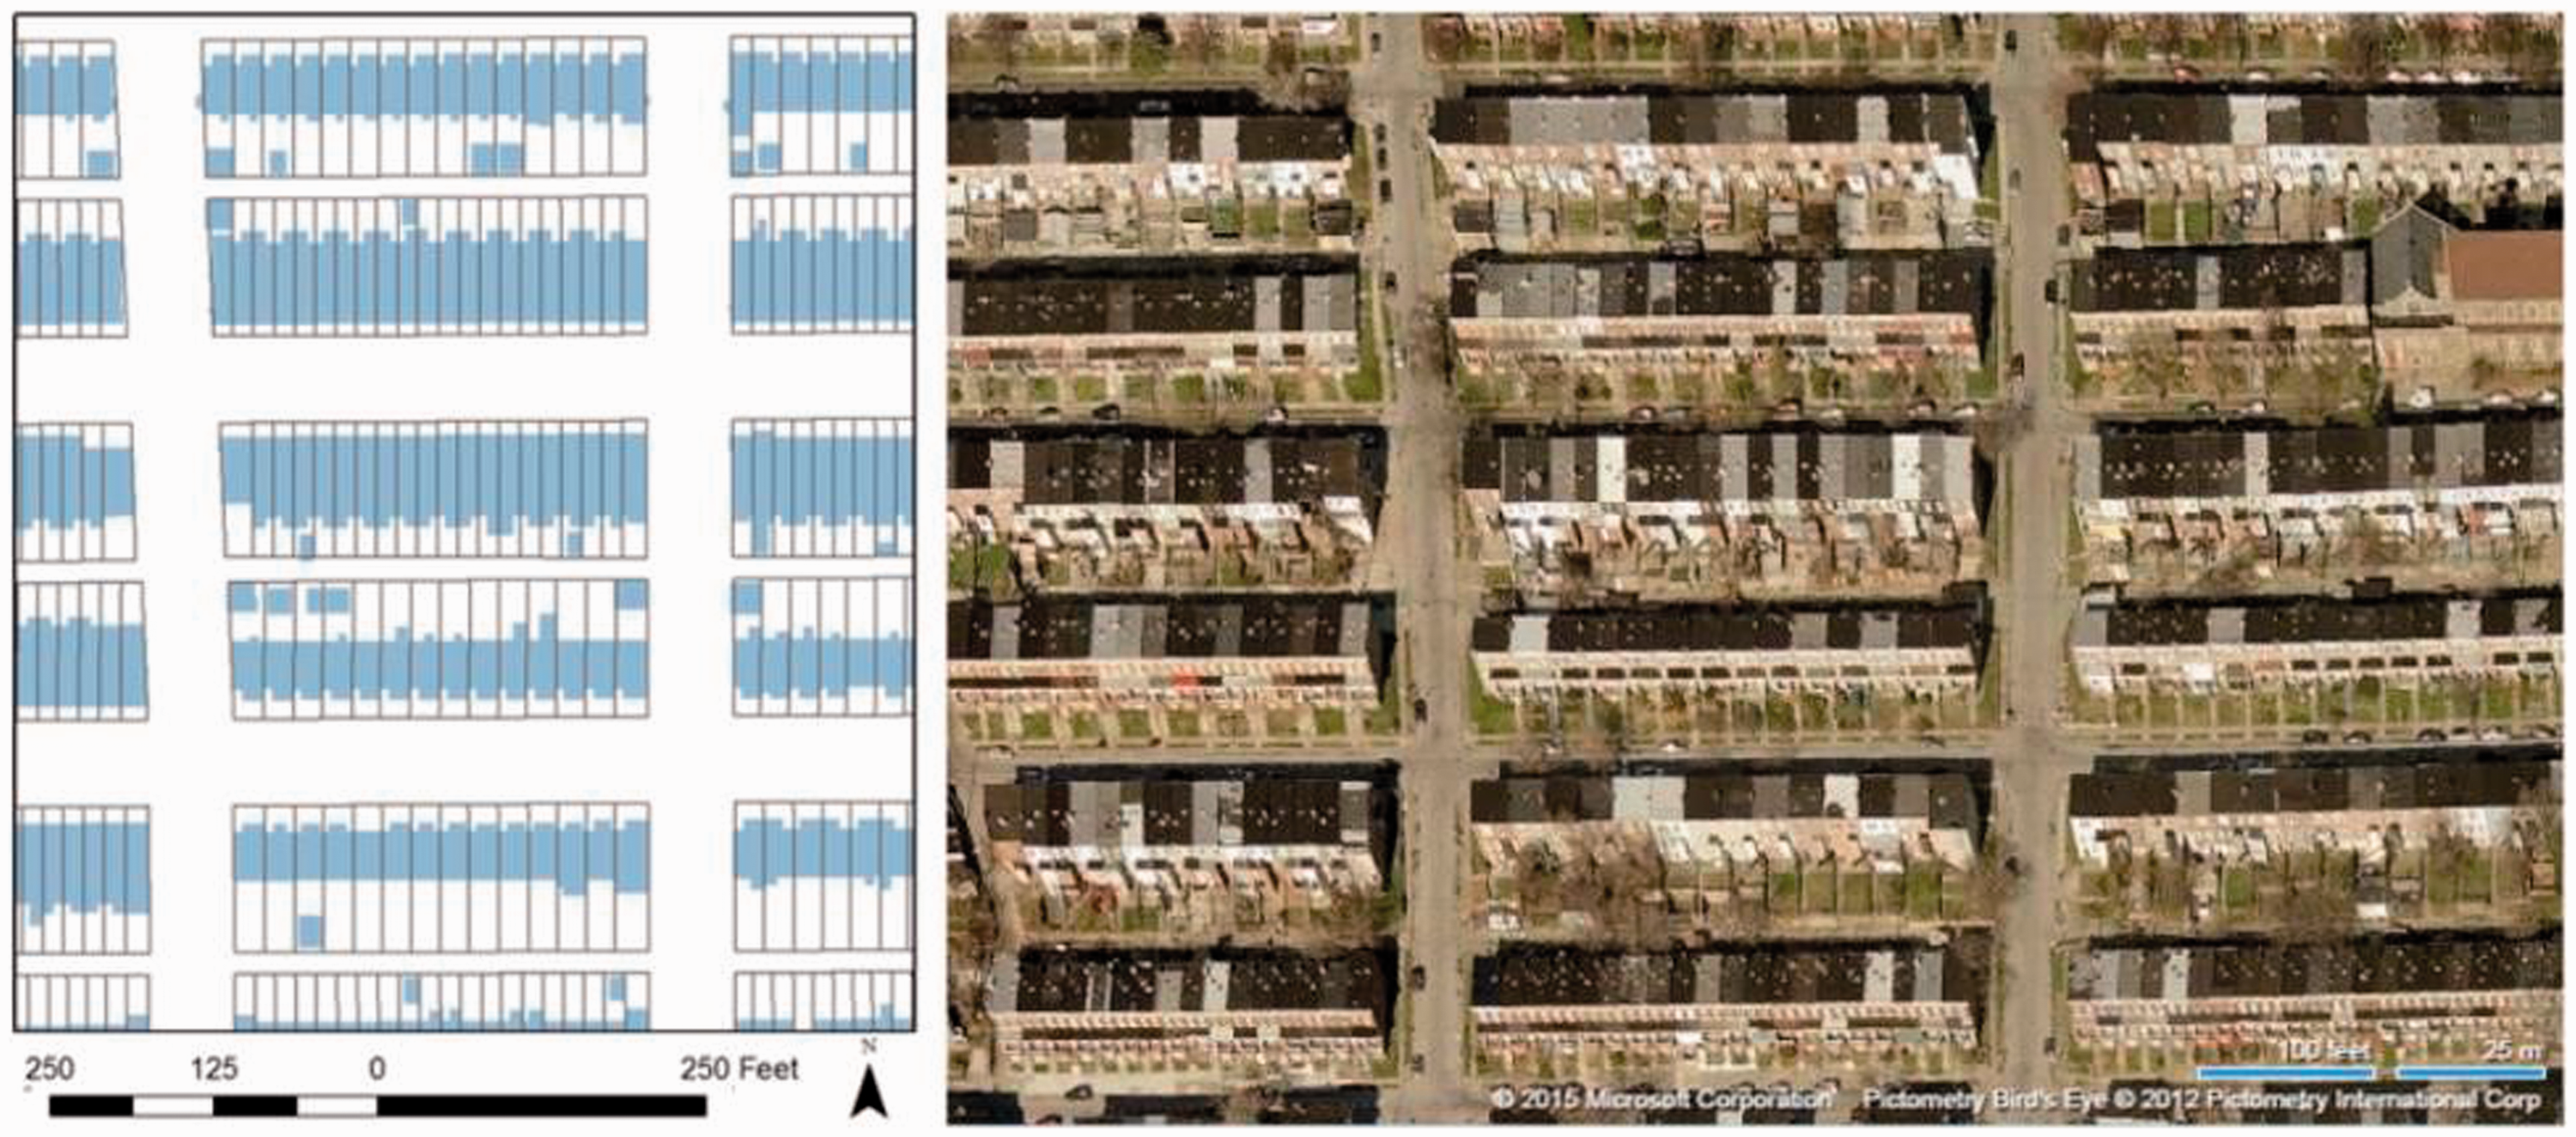
In contrast, typical suburban Baltimore neighborhoods feature detached single-family homes, with parcels of 50 feet by 110 feet allowing space for larger front and back yards and sometimes garages, though arranged in grids similar to housing in the city.
Building footprint changes, 1972–2010
Characteristics of building footprint changes between 1972 and 2010, by study area neighborhood.
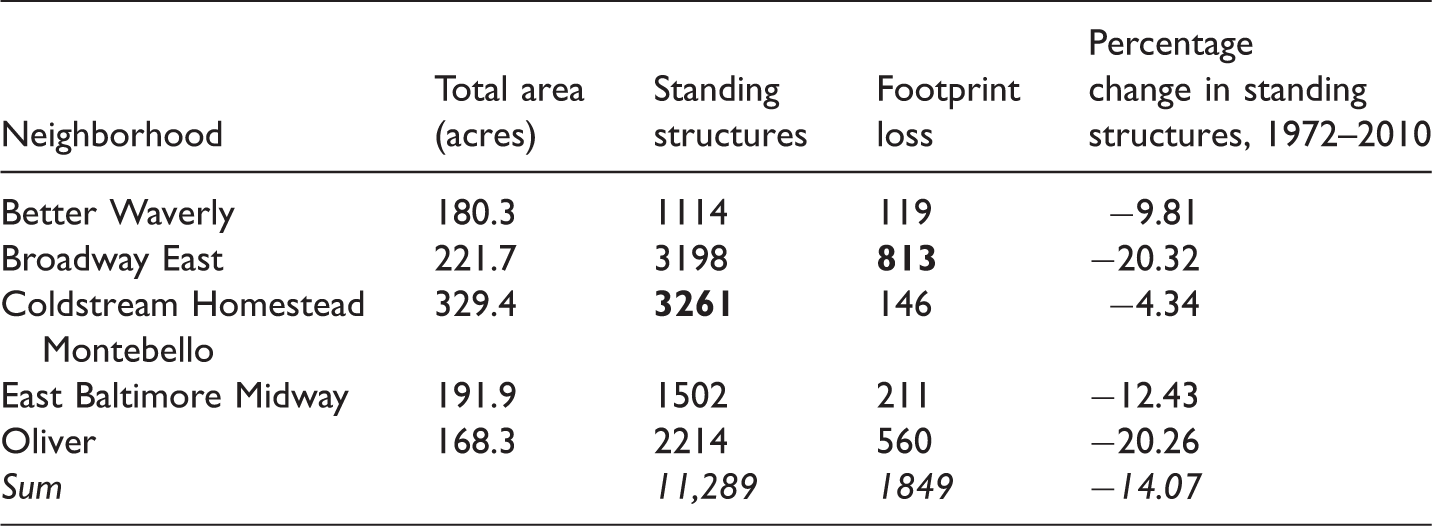
Note: Bold entries in table represent neighborhood comprising the largest percentage share of variables “Standing structures” and “Footprint loss”, respectively.
Building footprint changes across the five study neighborhoods are shown in Figure 9. Green points in the figure represent building footprints with no housing loss, while the orange points represent those with housing losses; empty areas represent non-residential land uses.
Building footprint changes between 1972 and 2010, all study area neighborhoods.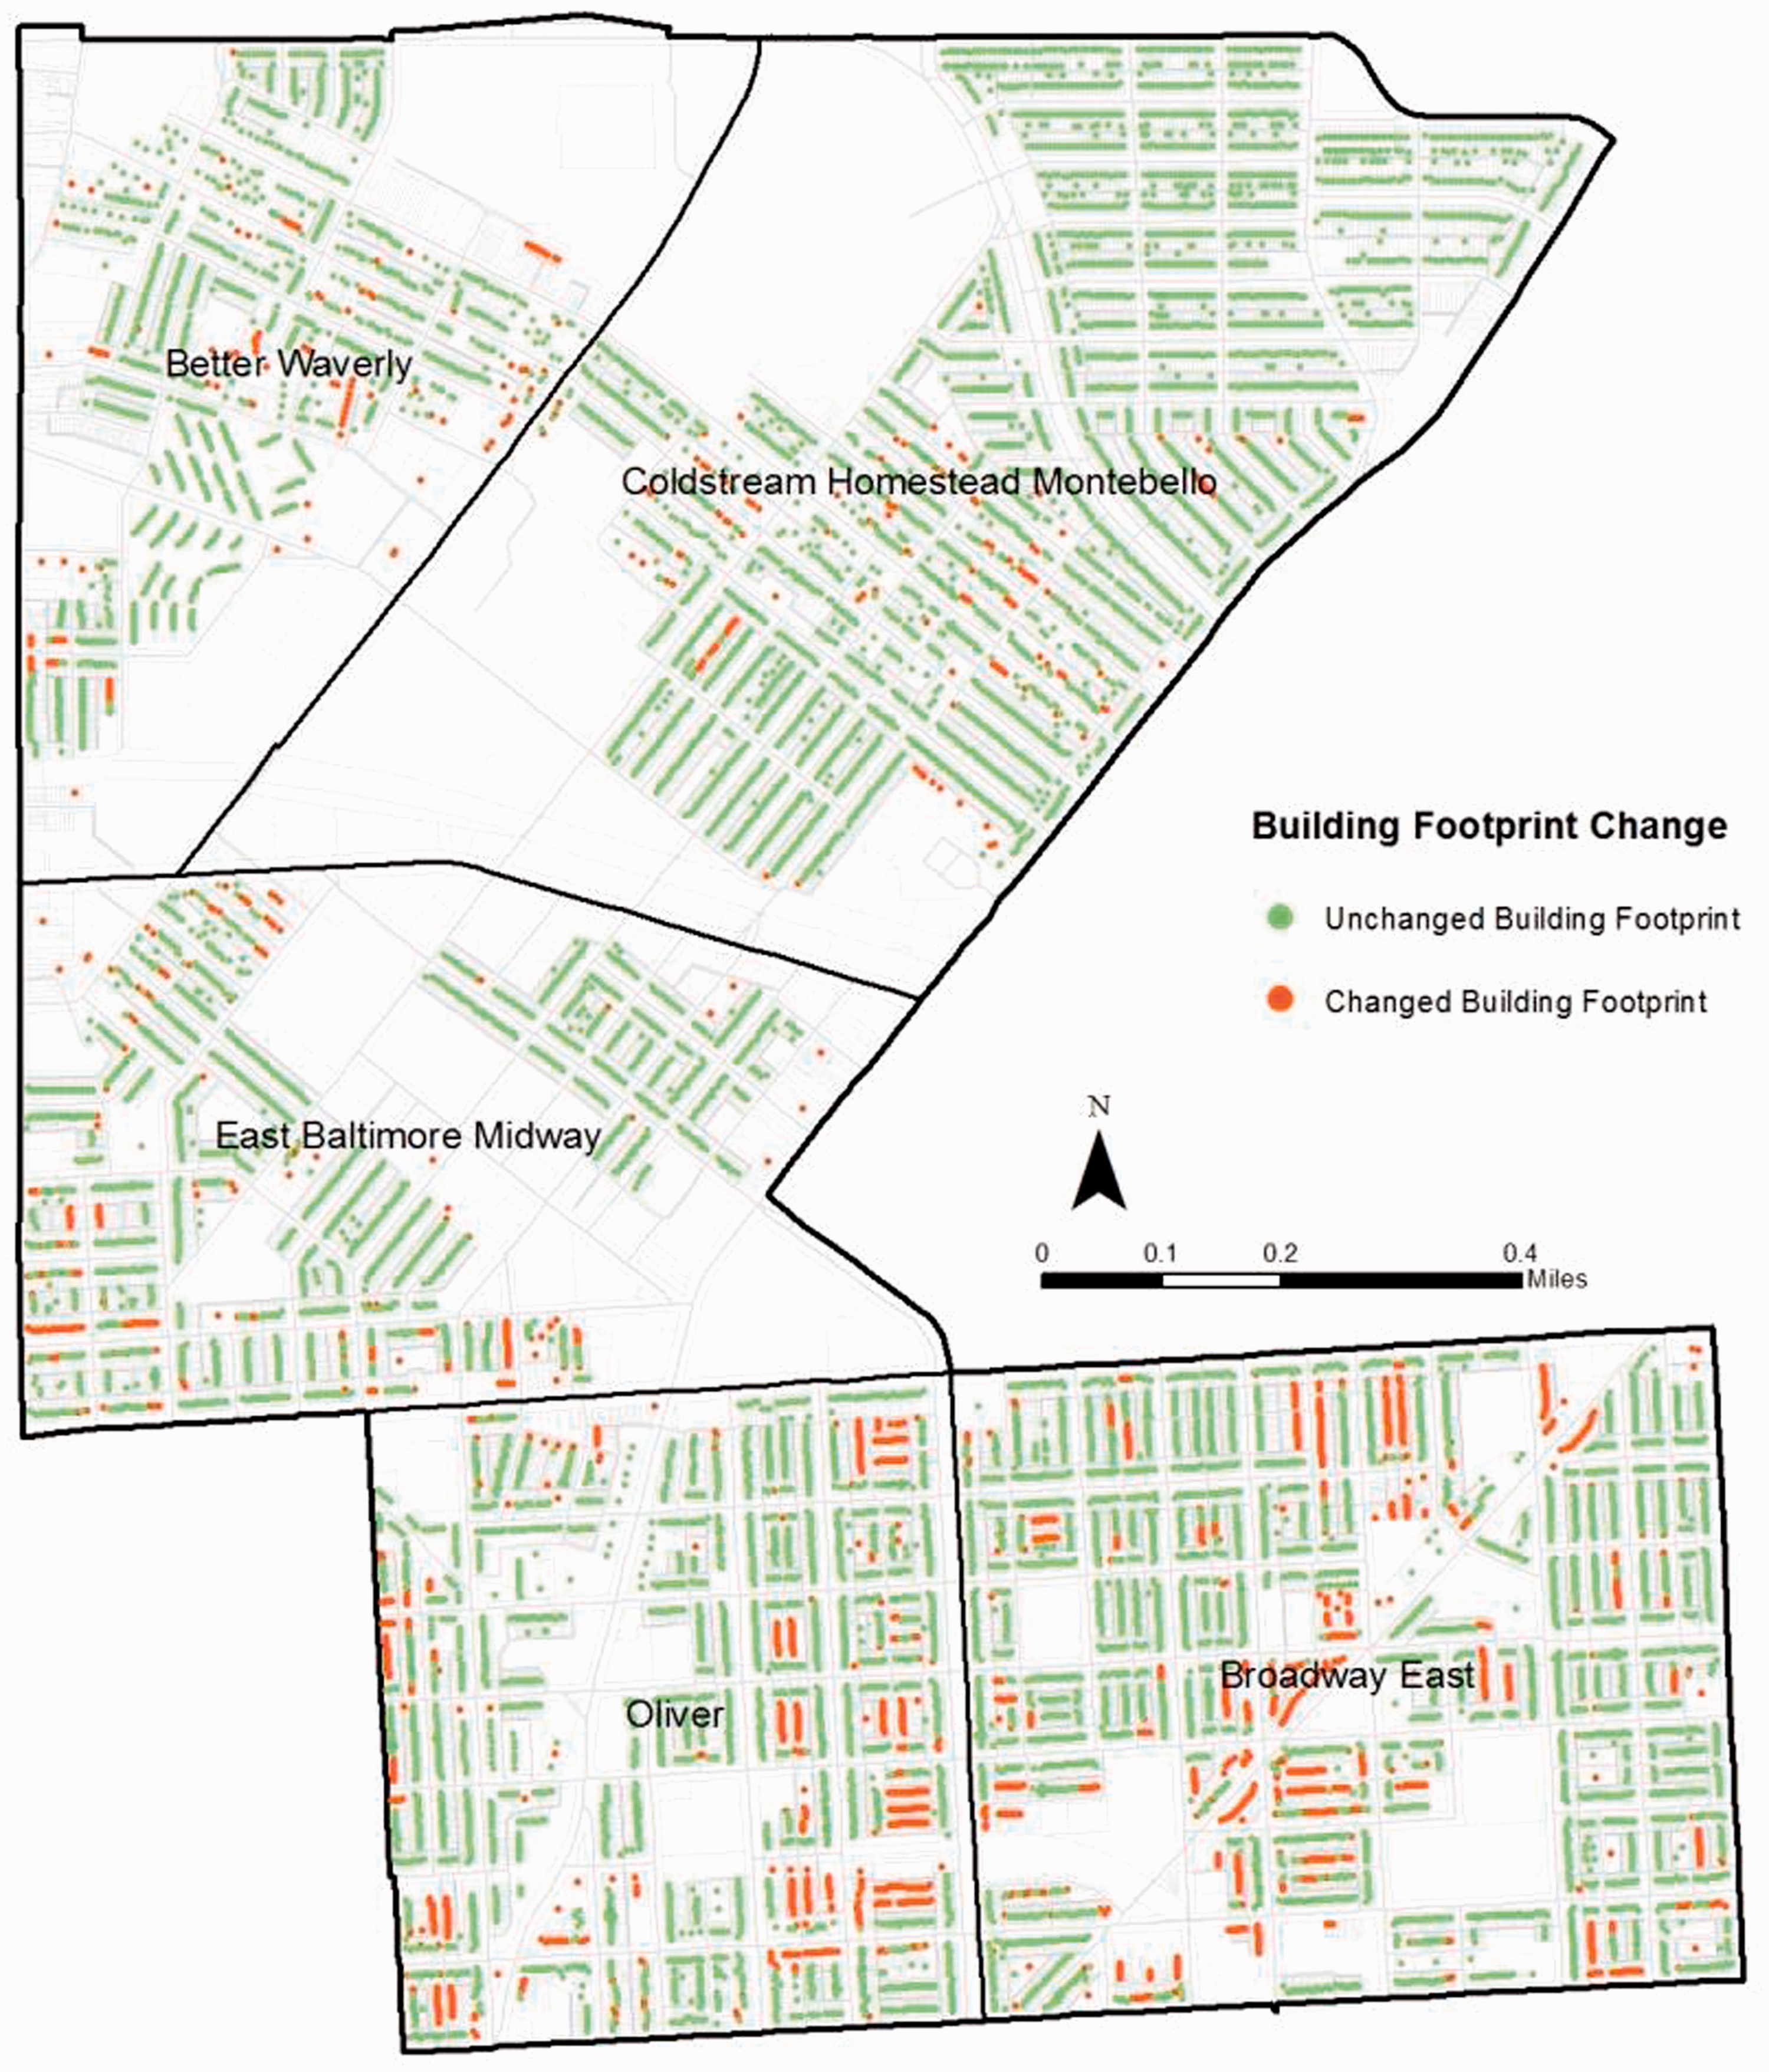
In the Oliver and East Baltimore Midway neighborhoods, and in the southern part of East Baltimore Midway, where row house blocks are filled with small alley houses, building losses were concentrated in entire rows of poor-quality alley housing (Figure 10). In contrast, building losses in the Better Waverly and Coldstream Homestead Montebello neighborhoods, and in the northern part of East Baltimore Midway, were distributed more evenly (Figure 11). As the original structures tended to be of better quality than alley units and smaller row homes, demolitions tended to take place house-by-house, with the resulting vacant lots occasionally containing fenced-in lawns and trees.
Building changes, Oliver neighborhood: footprints and bird’s-eye view. Building Changes, Coldstream Homestead Montebello neighborhood: footprints and bird’s-eye view.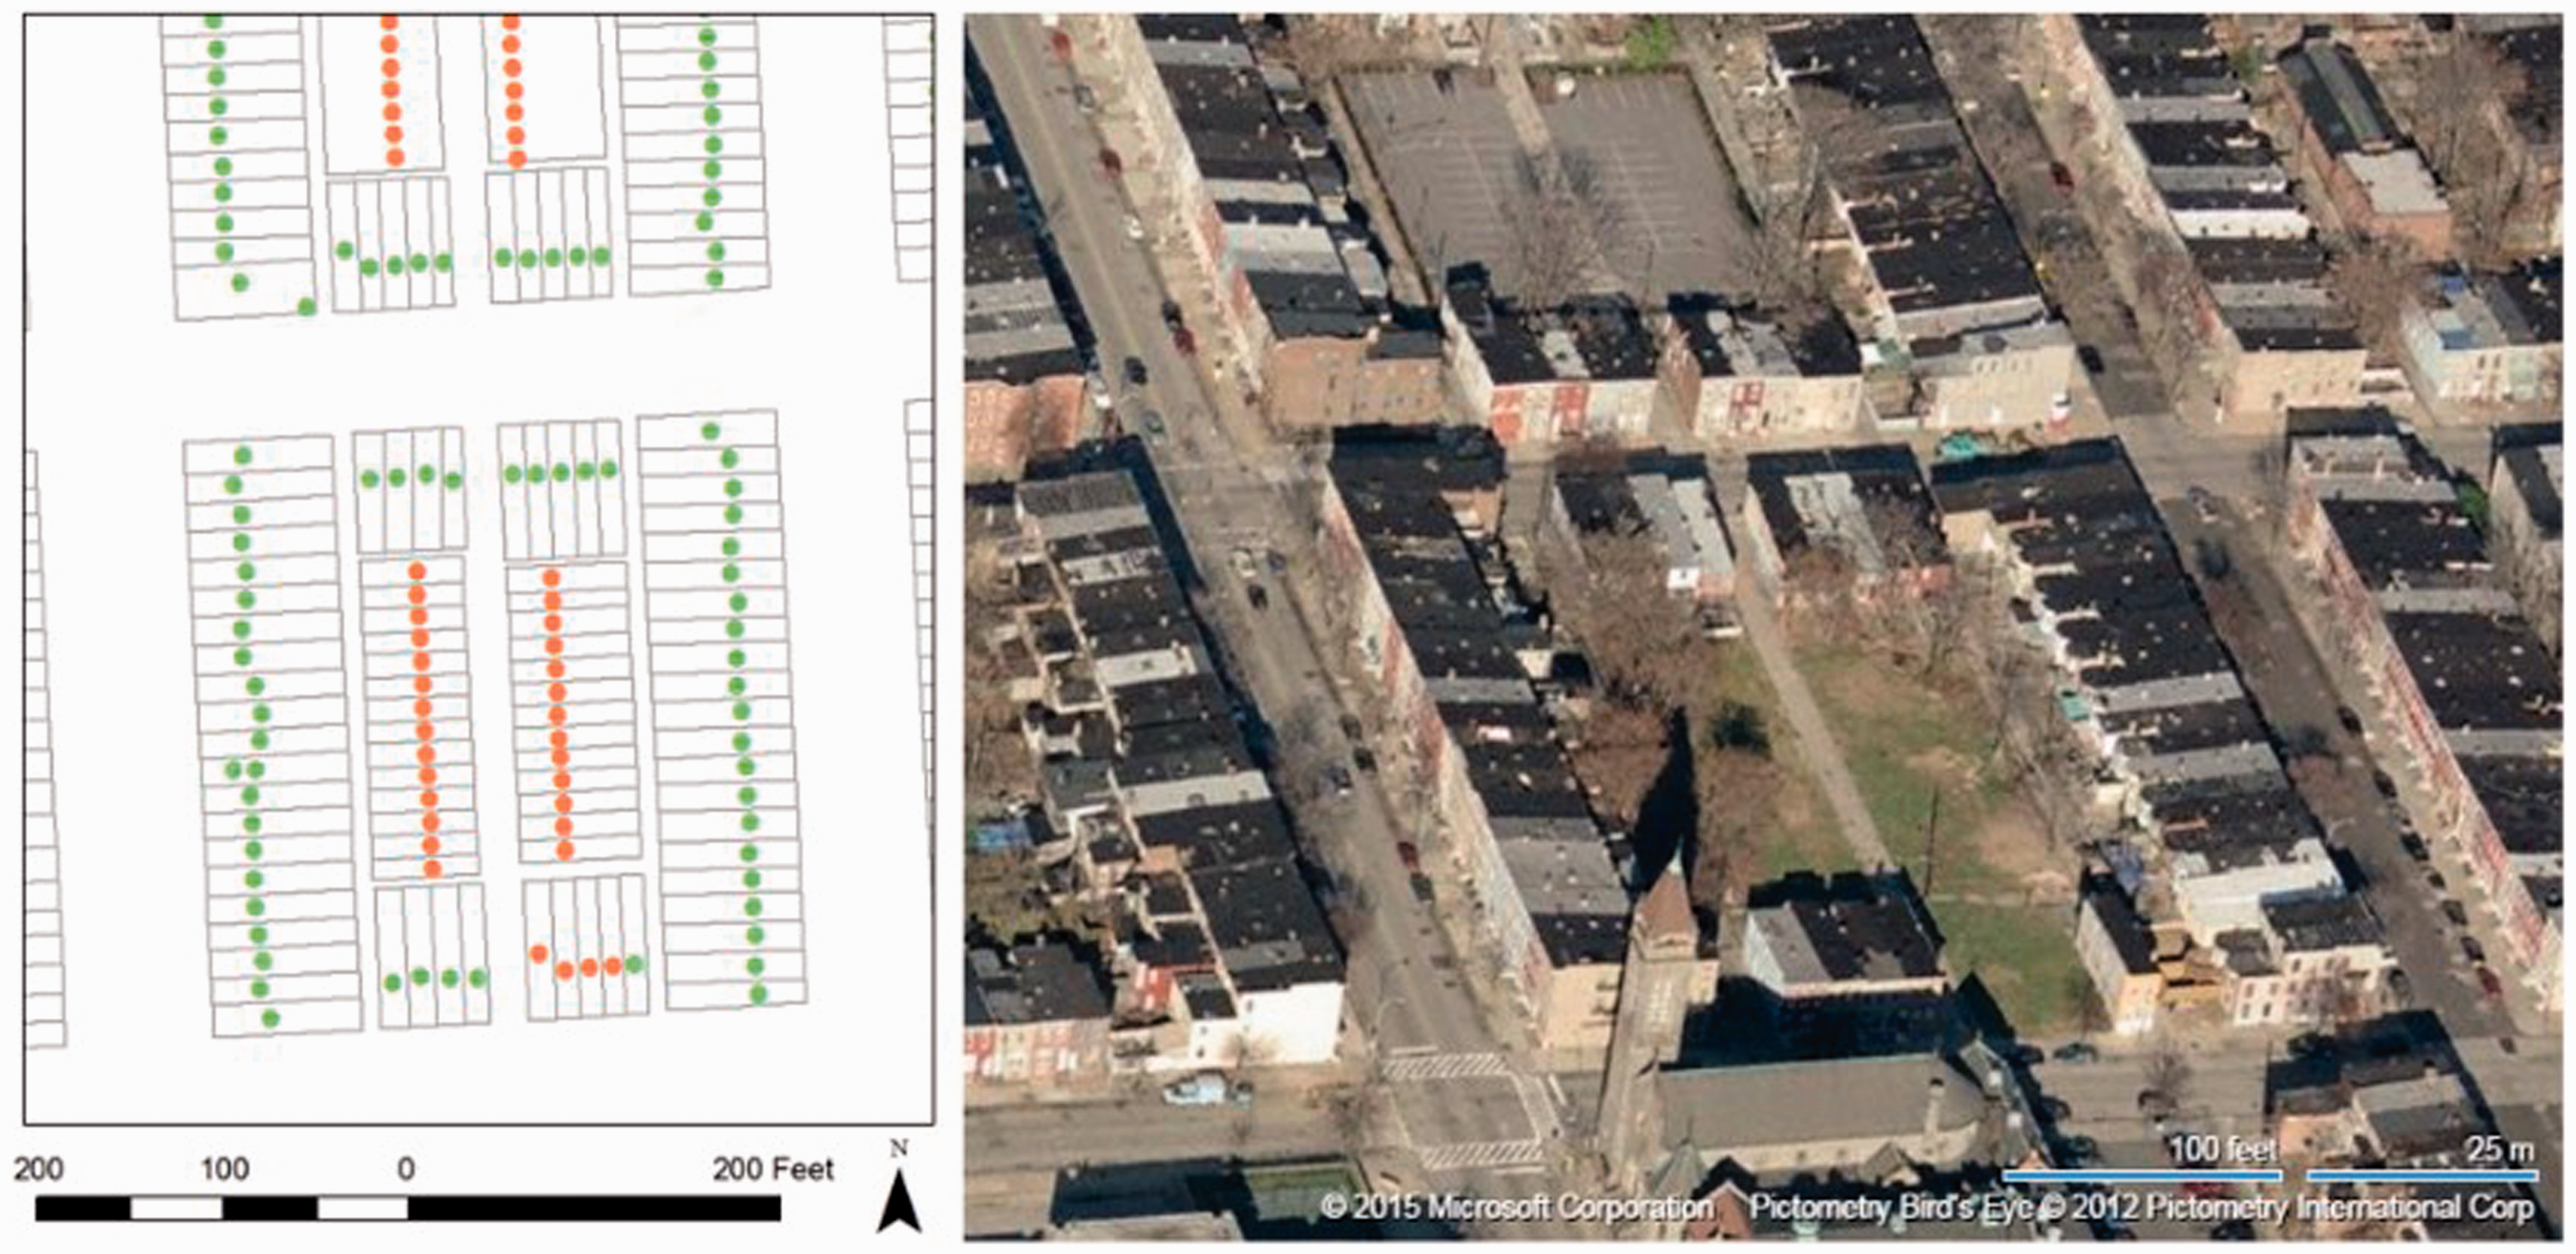
Physical neighborhood characteristics, 2010
Summary statistics, physical neighborhood characteristics, 2010.
Density
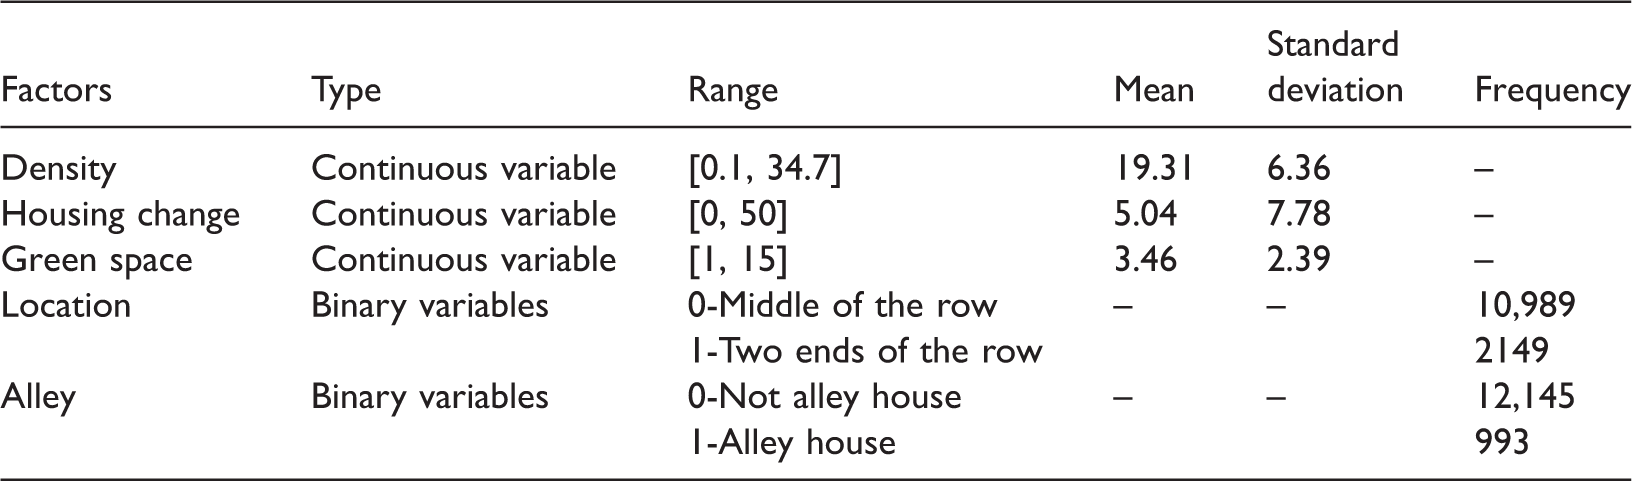
The average housing density of our study area about 19 houses per acre, as compared with 5.7 houses per acre for the city of Baltimore (TownChart, 2010); there are about 68 housing parcels on average within a 150-foot buffer of each parcel in our sample, corresponding to a housing density of 41.95 houses per acre. Figure 12 shows housing density across the study area, with point values converted to a raster map whose cells are 150 feet by 150 feet (Bienert et al., 2007). This map, and all others in this section, also displays points indicating location of housing losses between 1972 and 2010. The densest portions of our study neighborhoods are at the center of residential land use areas; most row homes in the Oliver and Broadway East neighborhoods, where alley houses are concentrated, have the highest housing density measures.
Density of area surrounding housing parcels and building footprint loss.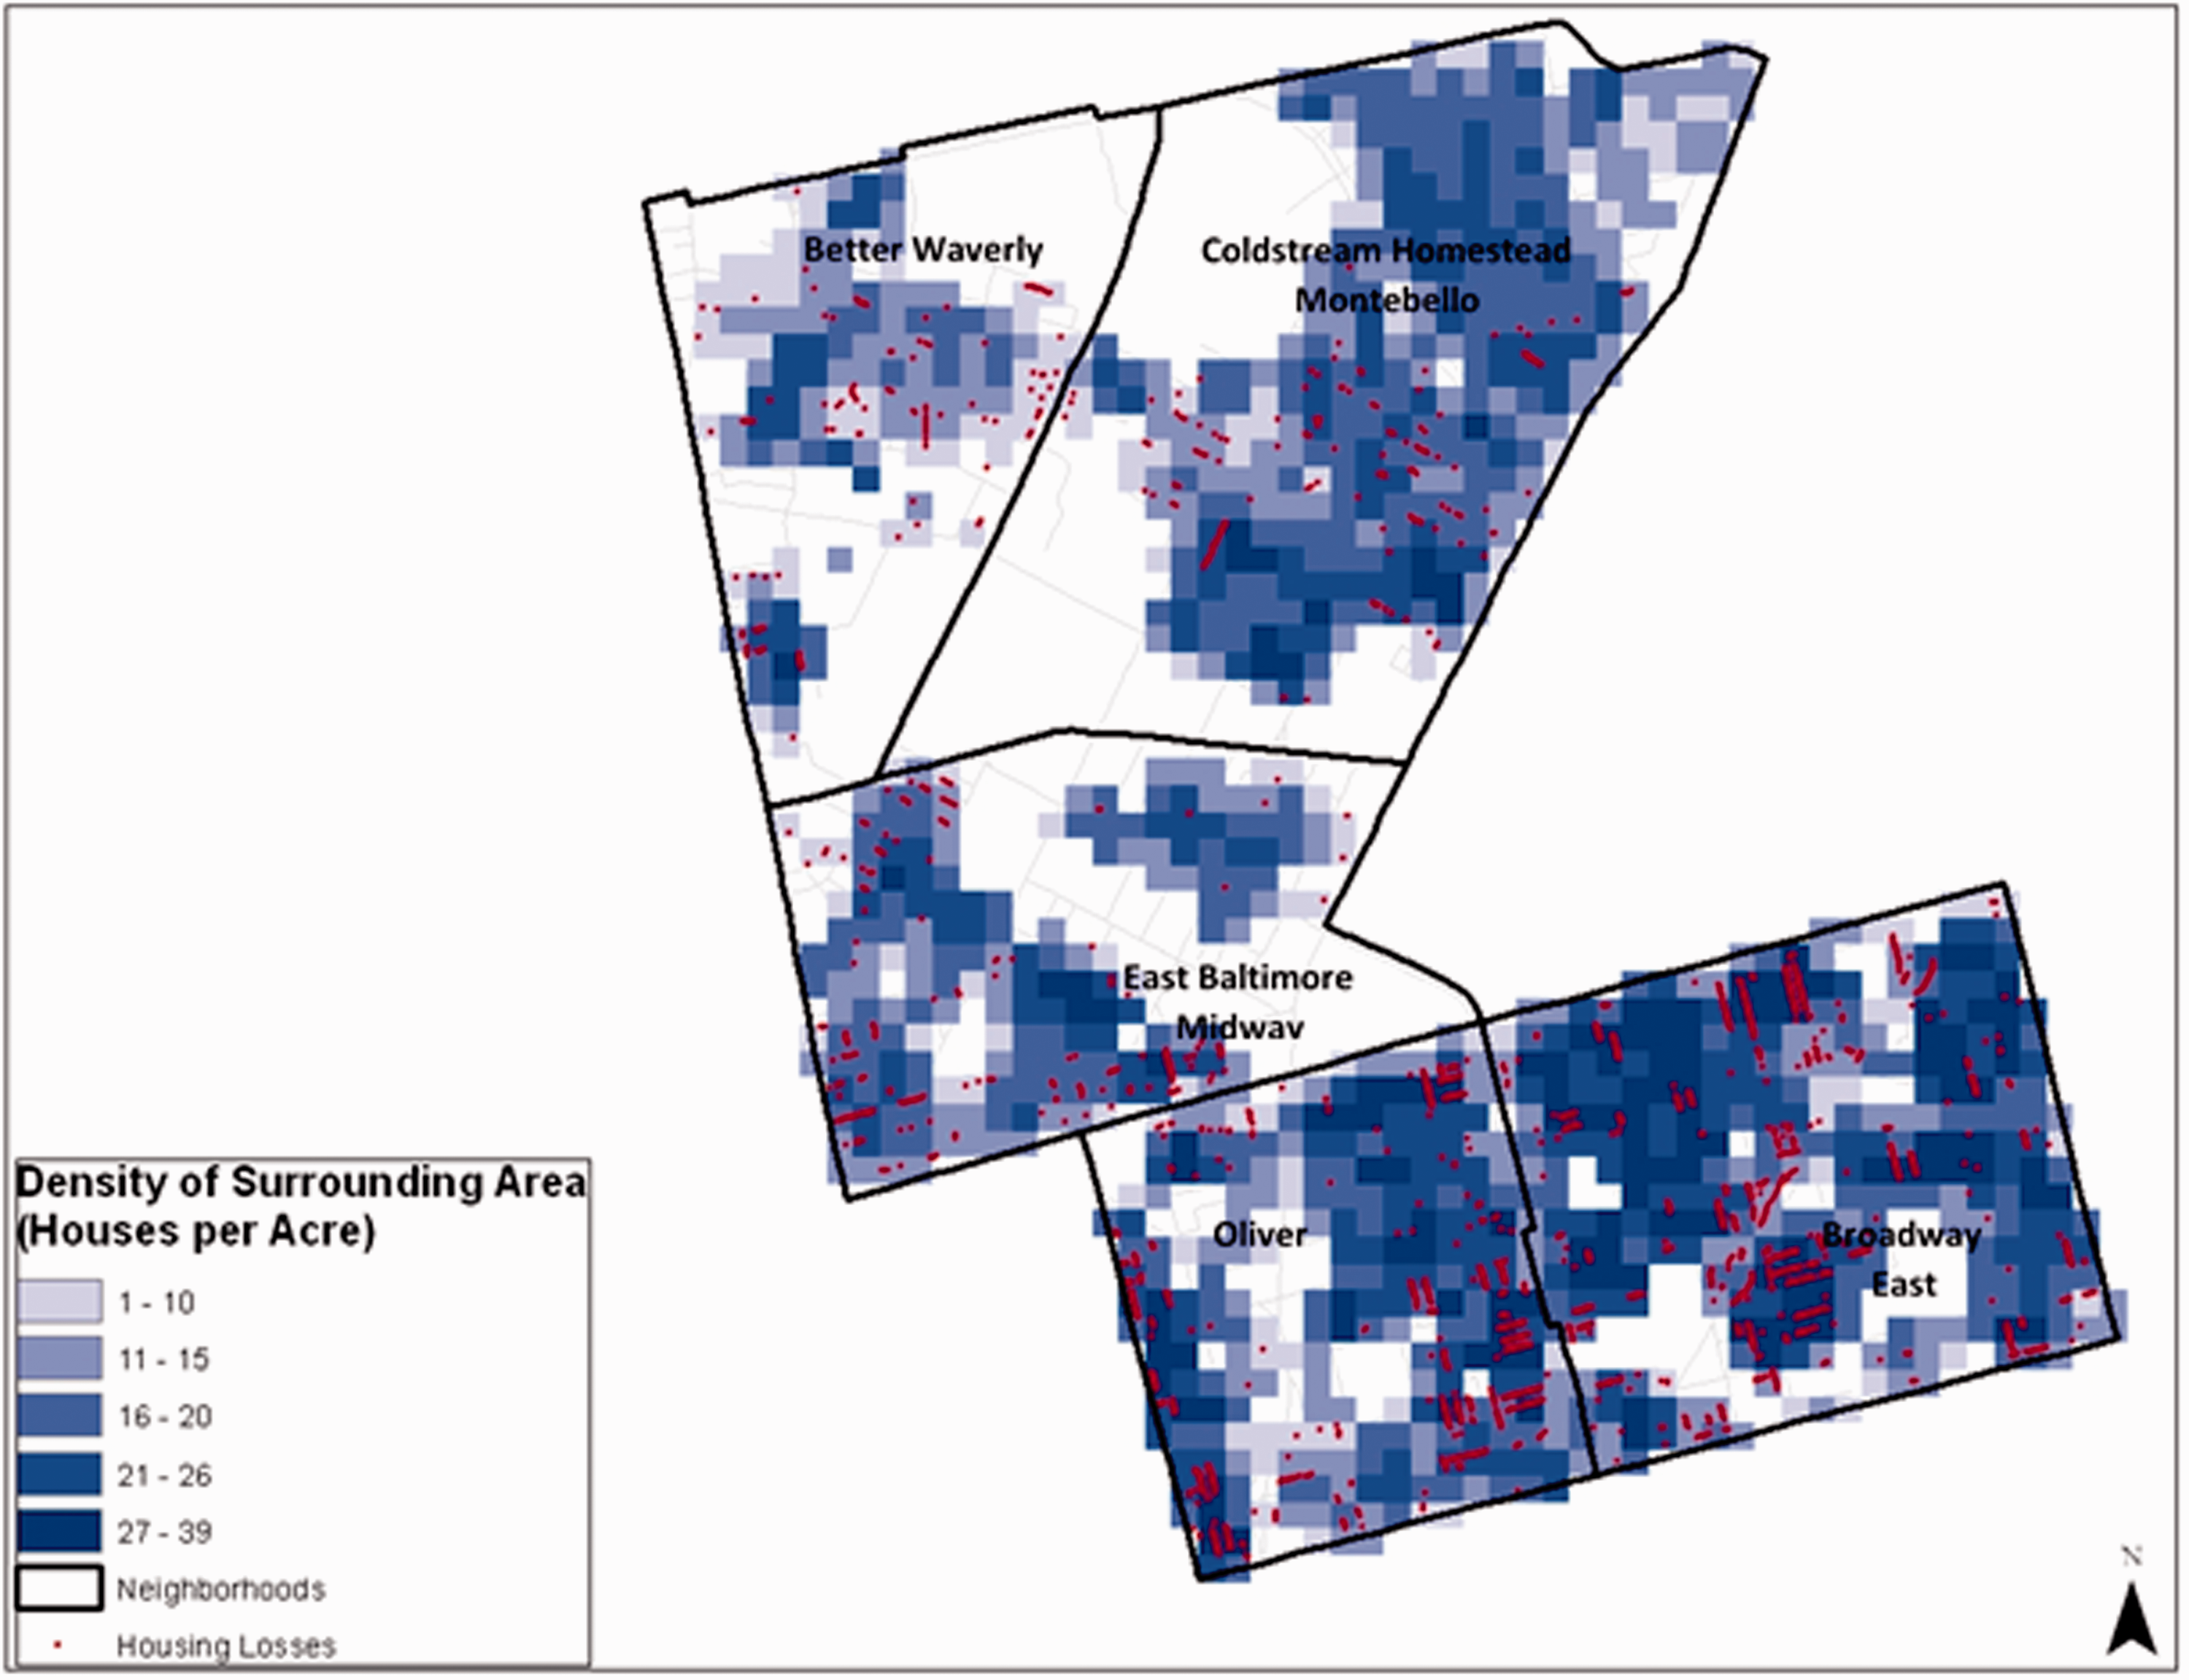
Housing change
We observed an average housing footprint loss of five structures per acre within a 150-foot radius of each observed structure. About 39.4% of parcels in our study area experienced no change in the number of buildings in a 150-foot radius; 12.5% of parcels had only a single housing unit loss in the immediate vicinity. The areas with the highest levels of housing loss are in the Oliver and Broadway East neighborhoods (Figure 13). As above, we have converted point data to raster data for ease of visualization.
Housing changes in area surrounding housing parcels and building footprint loss.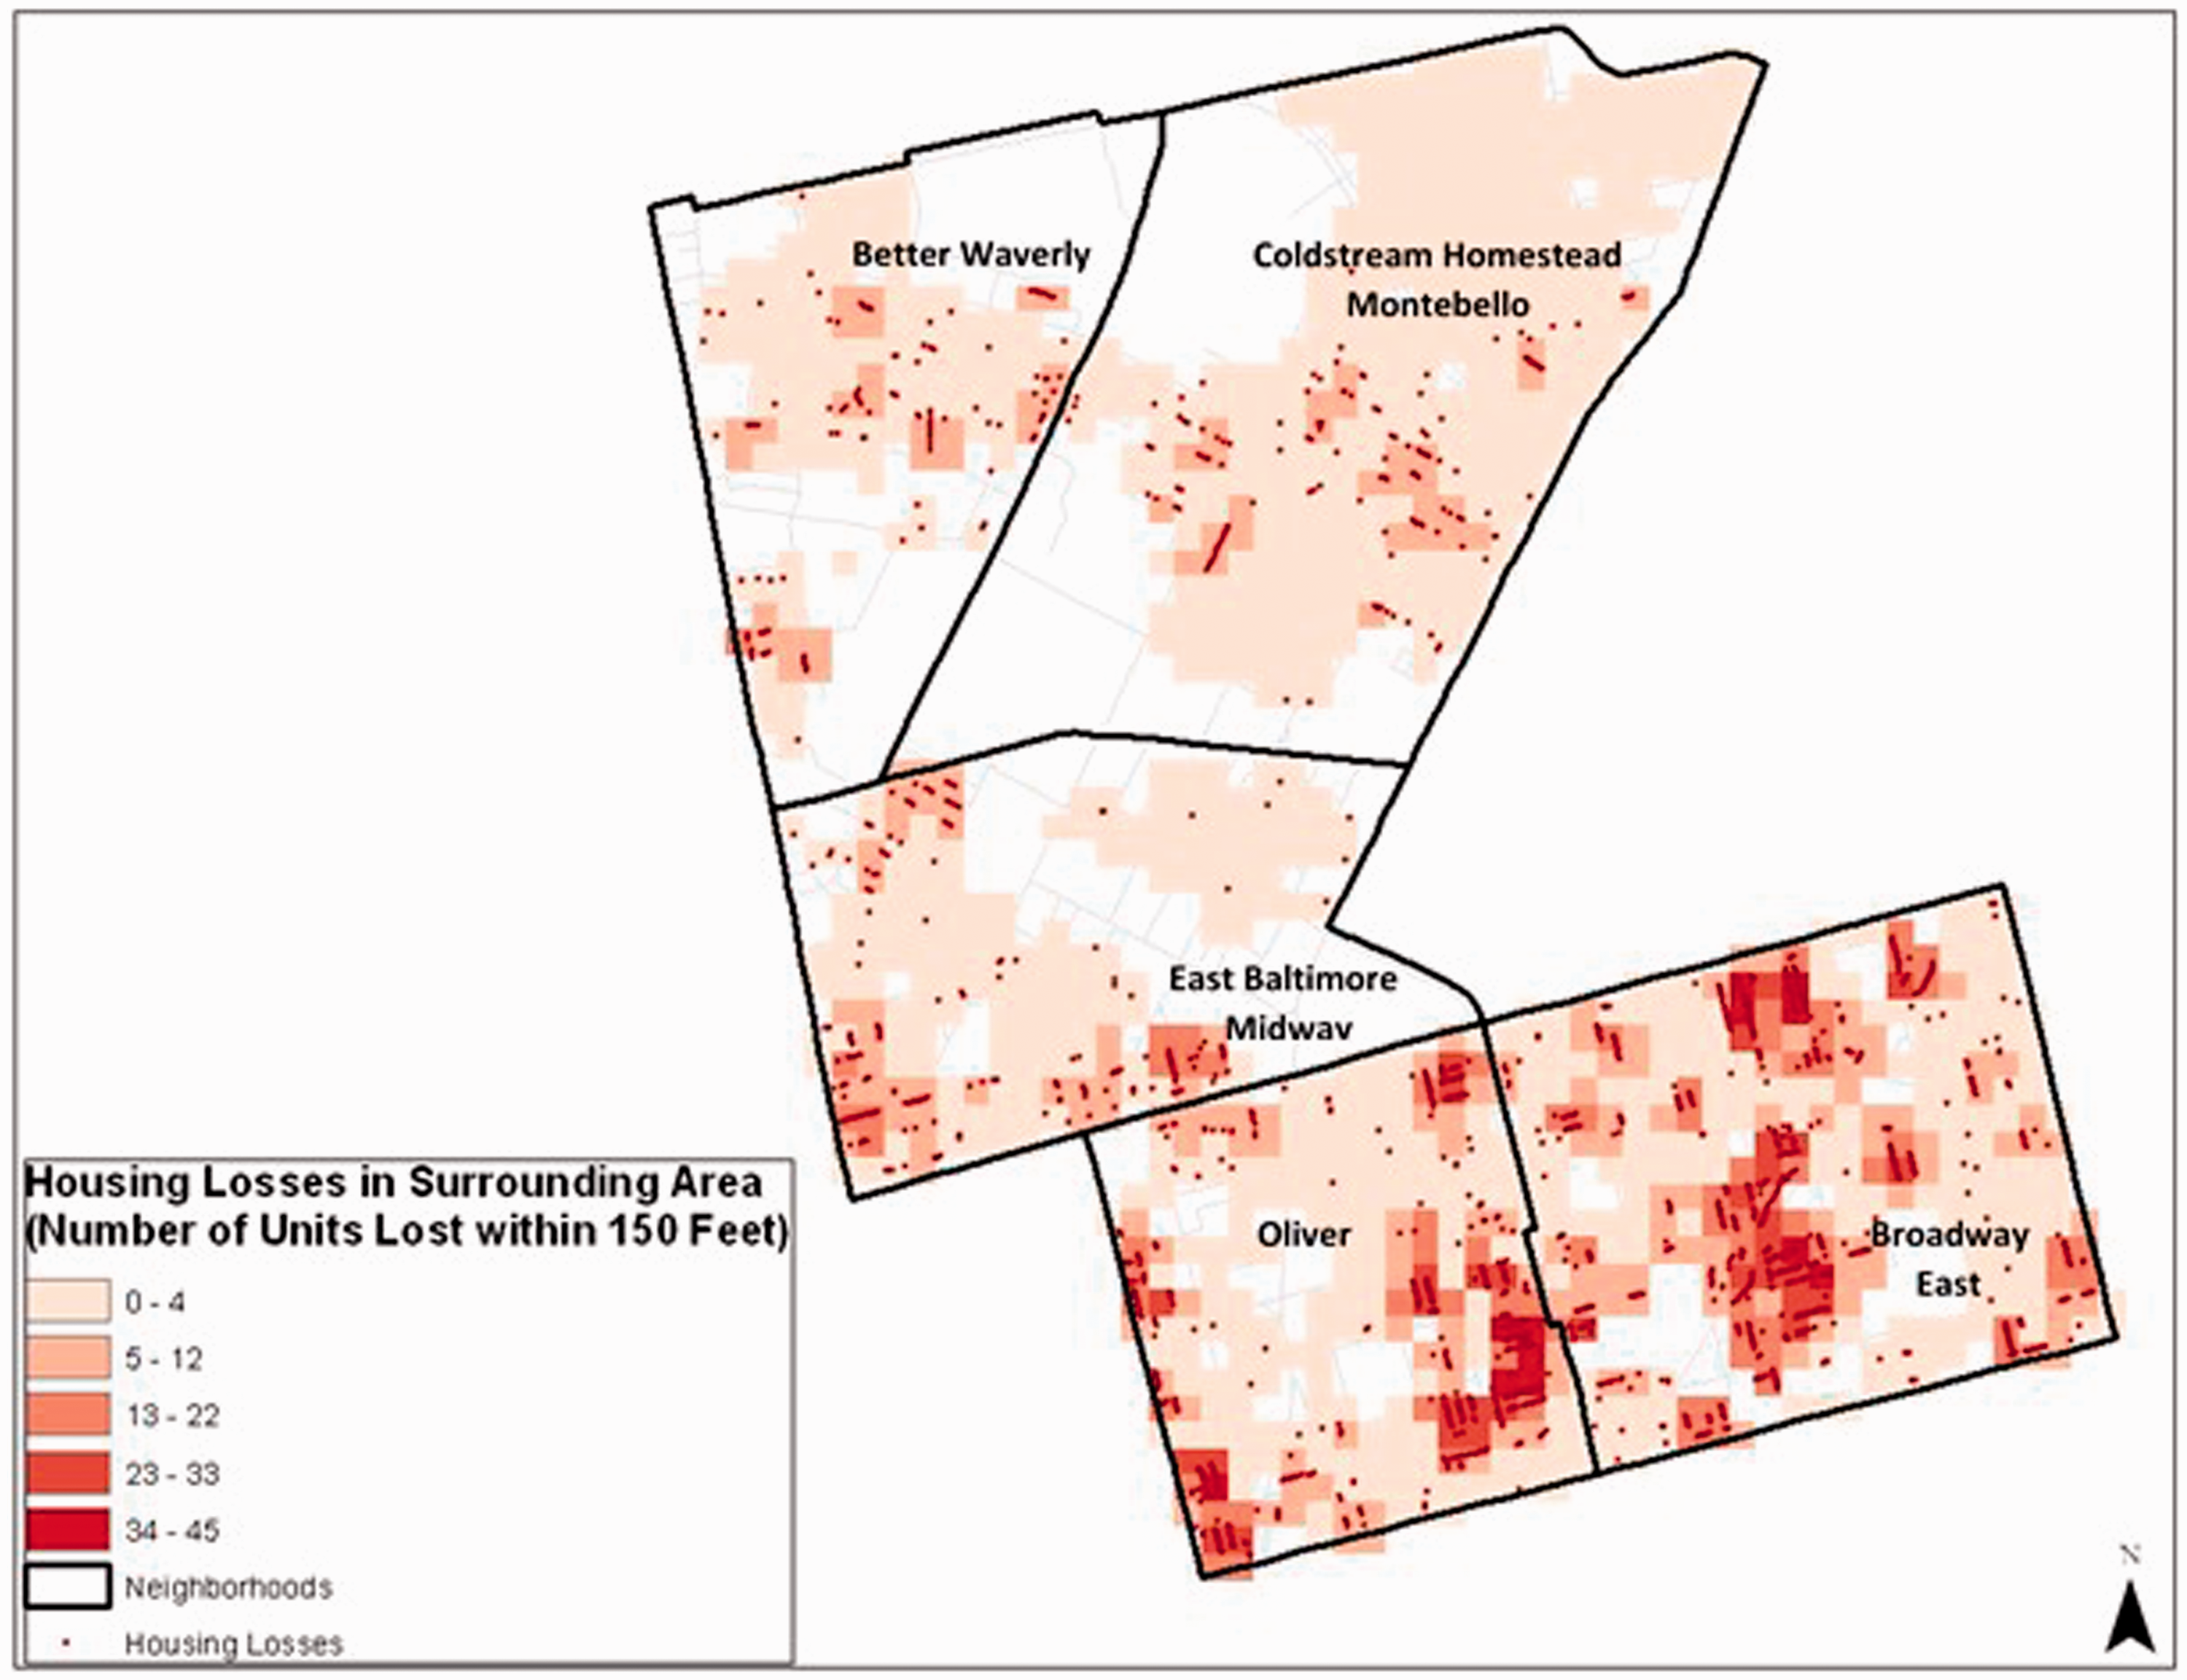
Green space
All building structures in the study area are within 15 minutes’ walk of the nearest green space. This can be attributed to the fact that neighborhoods were designed with green space in the center, as well as the high prevalence of alleys, which increase pedestrian accessibility.
Location in block
Building structures are defined here as being located at one of the two ends of a block of parcels (some of which may be vacant), or not. We define ‘block’ here as that portion of a block face that is continuous, i.e. not separated by an alley or street of any size. The length of row house blocks varies greatly, from five or six parcels, predominately in the Oliver neighborhood, to 15 or more. We find that 2,149 of all 13,138 parcels (16.45%) in our study area are located at either ends of a block. An example of the configuration of row house locations is shown in Figure 14 for the Oliver neighborhood.
Location in block and building footprint loss, Oliver neighborhood.
Alley
There are a total of 993 alley houses in the study area, all of which are in the Oliver and Broadway East neighborhoods. These alley houses are narrower, smaller and built behind the regular row houses.
Socio-economic neighborhood characteristics, 1970–2010
Census tracts are an imperfect approximation to neighborhood boundaries. However, in the absence of 1970 data at areal units lower than Census tract, we will use tract-level socio-economic data for our study area in 1970 and 2010.
Population density
A decrease in population density affects the entire study area (Figure 15). Nearly half of all parcels on which structures have disappeared are located in the four Census tracts with the highest levels of population decline. The neighborhoods with the highest levels of population decline are Oliver and Broadway East, where residential land uses dominate (see Figure 6). In contrast, the neighborhoods with the lowest levels of population decline, Better Waverly and Coldstream Homestead Montebello, feature a variety of mixed uses, as well as the presence of anchor institutions such as Johns Hopkins University and Baltimore College.
Population density change and building footprint loss.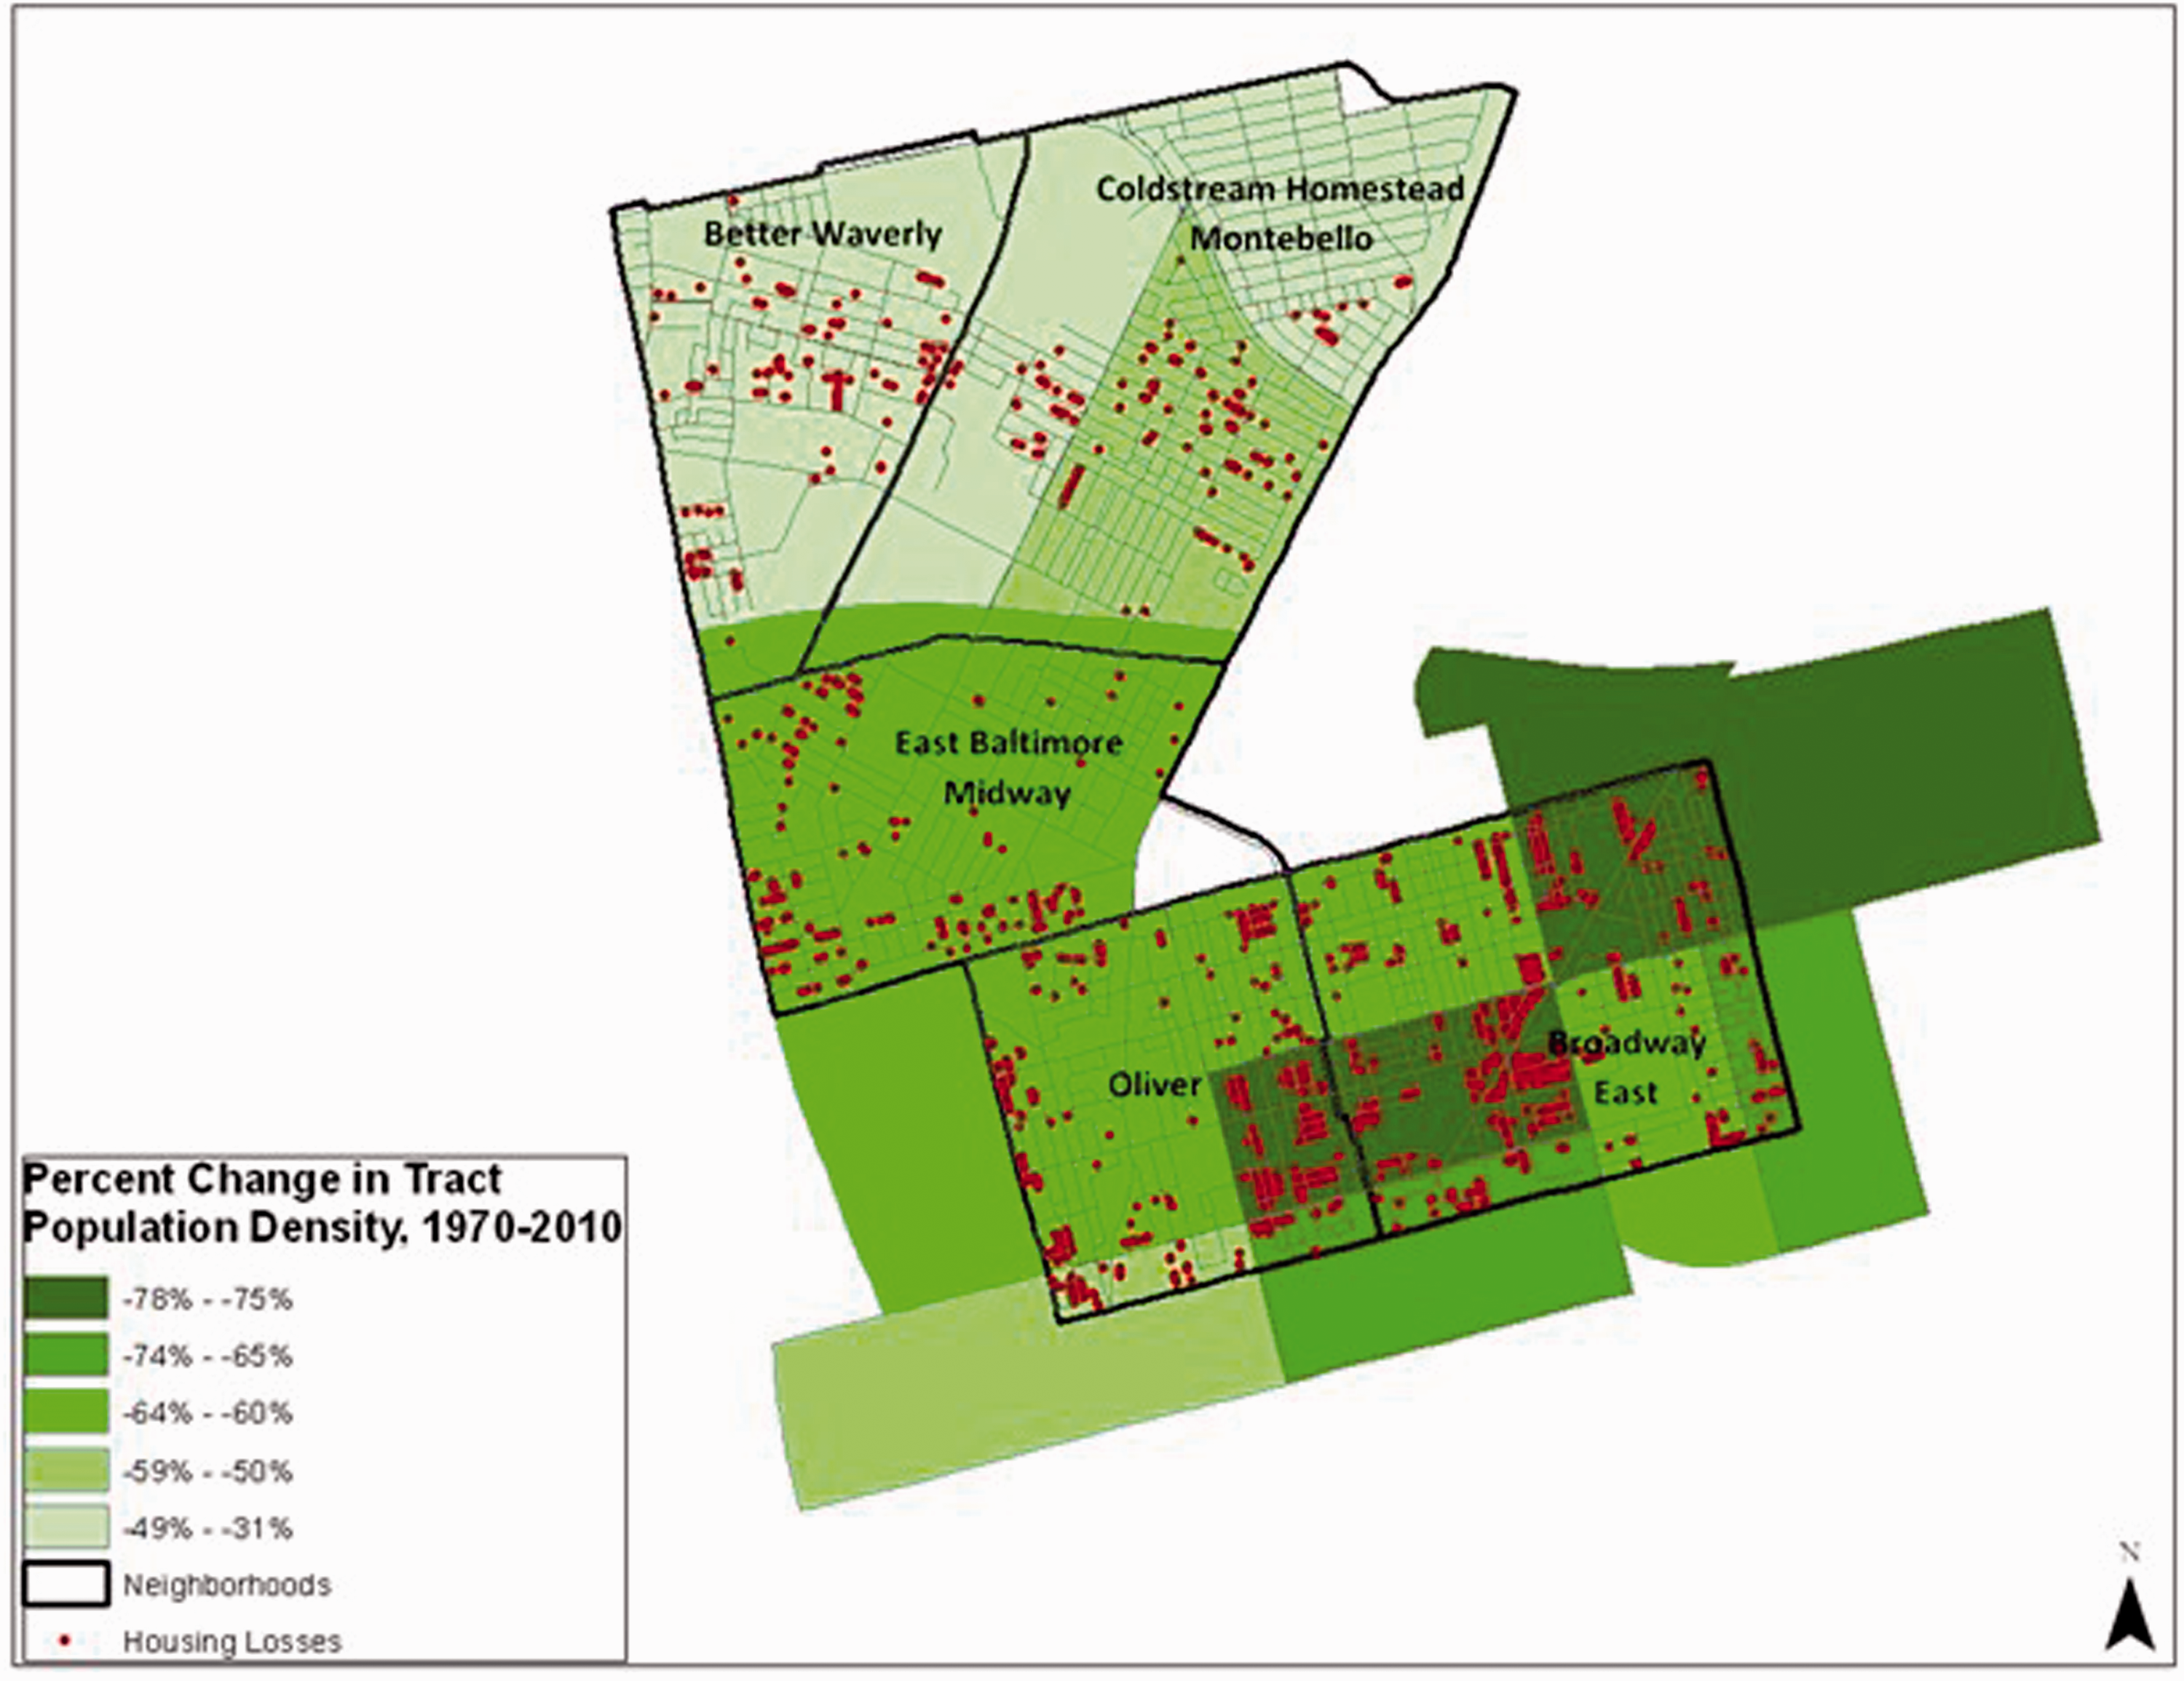
African-American
The change in fraction of neighborhood population that is African American population varies greatly over the study area, ranging from a 4.2% decrease in the Oliver and Broadway East neighborhoods to a 64.2% increase in the Better Waverly and Coldstream Homestead Montebello neighborhoods, a dynamic similar to that for population density change.
Unemployment
Most Census tracts in our study area showed increases in unemployment rates between 1970 and 2010.
Poverty
Though the change in poverty rate between 1970 and 2010 varies across our study area (Figure 16), most Census tracts show an increase in poverty rate. Areas with highest levels of increase in poverty rate are concentrated in the Oliver, Broadway East, and Coldstream Homestead Montebello neighborhoods.
Changes in poverty rate and building footprint loss.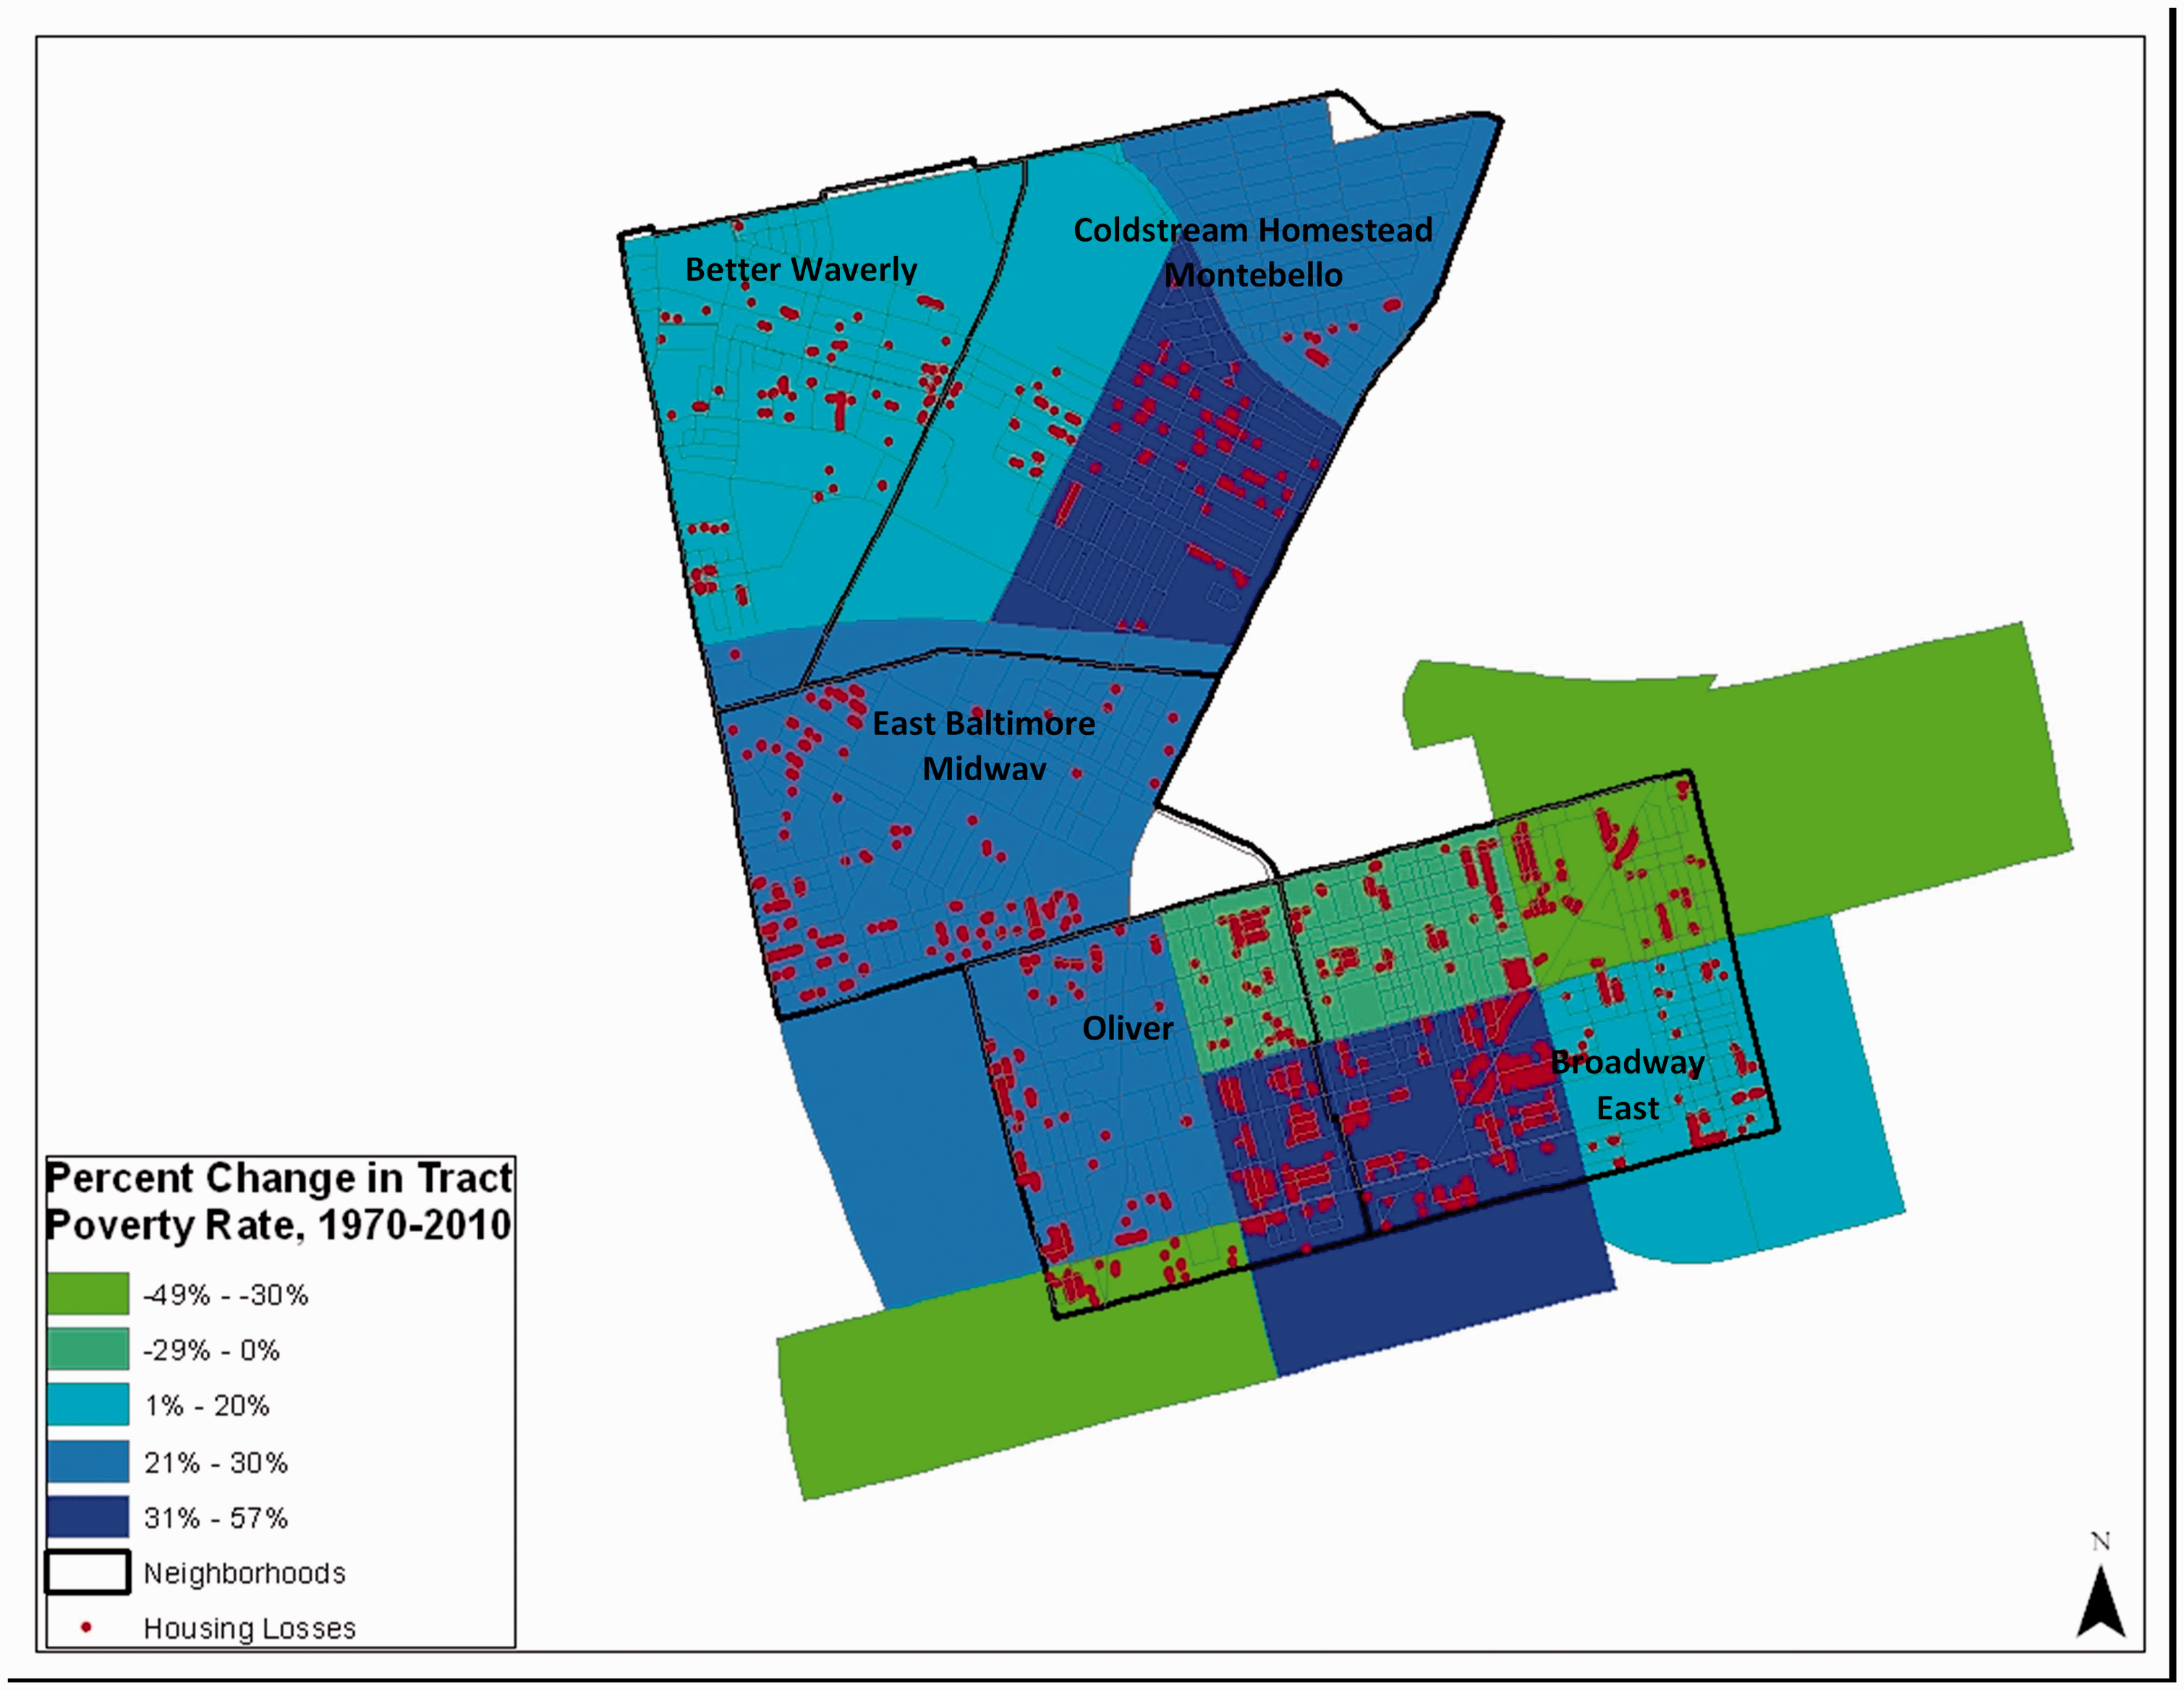
Exploratory analysis
Clustering analysis of housing losses
Recall that in the southern neighborhoods of the study area, Oliver and Broadway East, demolitions have mostly occurred over entire blocks, including blocks of alley houses, while in the northern neighborhoods, Better Waverly, Coldstream Homestead Montibello and East Baltimore Midway, demolitions are distributed more randomly within rows. It is reasonable to speculate that demolition of full rows represents a collective action with forethought, improving the local quality of life through increased open air and free space, while demolition of selected houses within blocks represents a more ad-hoc approach to blight management that may increase the sense of dereliction. In the remainder of this section, we employ quantitative analysis to validate visual evidence of clustering of demolitions, and identify physical and socio-demographic factors that are associated with demolitions.
We used spatial analysis tools to calculate a measure of the degree of clustering of housing losses identified at the parcel level. The Average Nearest Neighbor statistic calculates the average distances between each loss and the closest housing loss to it, and compares these average distances to a hypothetical set of values that would be expected if losses were continuously randomly distributed about the study area. The ratio of the observed to the hypothetical distances indicates the level of clustering present; ratios of less than 1 suggest clustering. The Average Nearest Neighbor statistic calculated for the entire study area was from the data was 0.302 with a p-value of zero, which suggests considerable clustering of housing losses over the study area. We also tested the level of clustering for areal units across the entire study area using Moran’s I statistic calculated for block groups. Based on percent of parcels lost per block, the statistic was 0.235 with a p-value of 0. We randomly allocated demolitions across housing parcels to create a ‘control distribution’. Our Average Nearest Neighbor clustering statistic for this new distribution was 0.639 with a p-value of 0; the Moran’s I statistic measured for percent of parcels lost per block was 0.058, with a p-value of zero. This is an indication that, at the parcel level, demolitions do not appear to be more clustered than we would expect given the spatial concentration of parcels, while the opposite is true at the block group level.
The Average Nearest Neighbor statistic for each of the five study neighborhoods ranged between 0.391 and 0.475, all with p-values of zero; the Moran’s I statistic for percent parcels lost per block indicated clustered or very clustered block attributes for four of the five neighborhoods.
Association between housing loss and neighborhood physical characteristics
Chi-square test of association between housing loss and neighborhood physical characteristics.

N = 13,138.
Association between housing loss and changes in neighborhood socio-economic characteristics
Correlations between housing loss and tract-level socio-economic change variables.
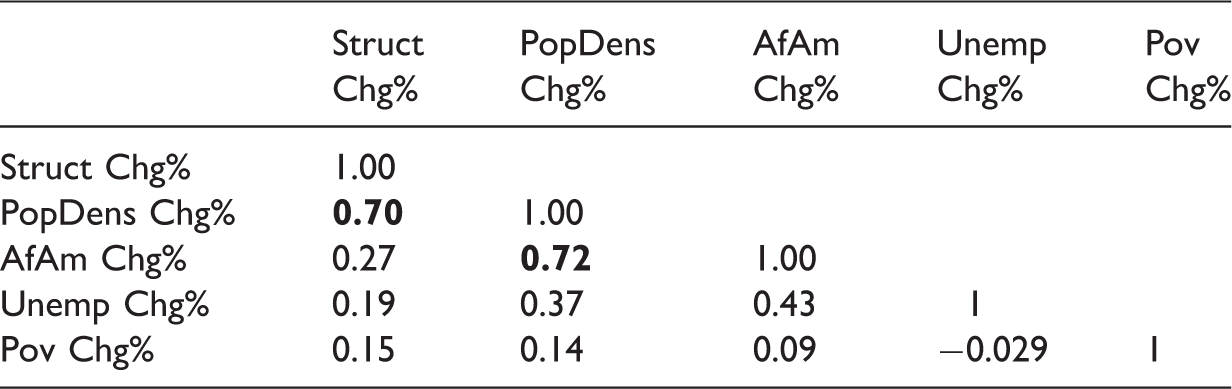
Correlation values in bold are significant at the 5% level. No entries represent correlation values that are significant at the 10% level.
Struct Chg%” is the primary dependent variable in the study.
These results indicate that the only association at the 5% significance level between the key dependent variable, percentage change in housing structures, and any of the four socio-economic change variables, is that for percent change in housing density, at 0.70.
Discussion
Responses to research questions
The answer to the first part of our first research question, focused on changes in spatial configurations of residential housing, is that the five target neighborhoods in our study have lost about 14% of all of their housing structures between 1972 and 2010, though rates and levels of loss vary widely across target neighborhoods. Moreover, residential blocks with small alley houses suffered the greatest losses, with entire blocks of alley housing coming down, while blocks with larger units and fewer alley houses saw losses distributed more evenly. The answer to the second part of our first research question, focused on spatial clustering of observed housing losses, is that there is moderate evidence of spatial clustering of housing losses as demonstrated through visual and statistical analysis at multiple spatial configurations.
In response to the second research question, addressing housing loss associated and physical neighborhood characteristics, we have found visual evidence of associations between housing loss and physical configurations of rowhouse blocks that vary across target neighborhoods, measures of housing density, level of housing loss, accessibility to green space, location at the ends of rows of housing within block faces, and location of housing in alleys. The last five associations were verified through a chi-squared analysis, all at a high level of statistical significance.
In response to the third research question, addressing the association between housing losses and changes in socio-economic characteristics of target neighborhoods, we found that our target neighborhoods faced, overall, large decreases in population density, large increases in the percentage of population that is African-American, and large increases in the percentage of population that is unemployed and in poverty; these changes were most pronounced in portions of the Broadway East and East Baltimore Midway neighborhoods. However, we found little evidence of a strong association between housing loss and changes of these variables.
Our results above allow us to assess the level of support for three hypotheses presented earlier. The first hypothesis, that there is a statistically significant level of clustering of housing losses, is substantially supported. The second hypothesis, that there is a statistically significant association between building footprint changes in the study neighborhoods and selected physical characteristics of housing units and the surrounding neighborhood, is strongly supported. The third hypothesis, that there is a statistically significant association between building footprint changes and changes in selected neighborhood-level socio-economic characteristics, has only limited support.
Limitations and caveats
Our analysis focused on changes in the presence of housing structures upon parcels in five target neighborhoods in Baltimore, as inferred from satellite imagery and administrative property records. Though demolition is a proxy for vacant and abandoned buildings reaching a critical stage of decay, we did not address vacant and abandoned housing. As a result, we are unable to address larger issues for shrinking cities and blighted communities of redevelopment or transformations of existing houses.
Our property data came from 1972 and 2010. With only two years of building footprint data, we were not able to address the important issue of dynamics in changes in building footprints over time, or the mechanisms that generated demolitions in the city. Therefore, our analyses of changes in these tract-level variables between 1970 and 2010 may not have accurately captured changes in socio-economic variables within our target neighborhoods.
A multivariate regression for the physical and socio-economic neighborhood characteristics (alone and together) and percentage property loss might be useful. However, the level of spatial variation in the property loss and physical neighborhood data, and the lack of socio-economic data at levels lower than Census tract put a correct analysis of these data beyond the scope of the present paper.
Finally, our analysis focused on five neighborhoods in East Baltimore; these changes may not be representative of other distressed neighborhoods in the city of Baltimore, nor of neighborhoods in other cities.
Current anti-blight and anti-vacancy efforts in Baltimore
Vacants to Value (V2V; www.vacantstovalue.org/) is a program of the City of Baltimore launched in 2010. Its goal is to transform Baltimore's vacant and abandoned building problem it into an opportunity to clean up and redevelop these properties. The city believes V2V can help raise property values, create community amenities, increase local tax revenue, and attract new residents and businesses. In V2V, the city has designated a set of Community Development Clusters, in which the city forms partnerships with non-profit and for-profit entities interested in investing in these neighborhoods (City of Baltimore, 2010). For city-owned vacant lots, the Land Resources Division streamlines the disposition to make lots transferred to developers faster and easier. For privately owned properties, however, the city pushes owners to rehabilitate or sell or auction them, so that developers can buy and redevelop them. During the redevelopment process, demolition is sometimes necessary to generate space for new development. In contrast to previous demolition efforts that focused on taking down problematic structures without consideration of ways to re-use the resulting vacant land, the city’s Growing Green initiative (www.baltimoresustainability.org/projects/growing-green-initiative/) has identified a variety of planning initiatives that can support creative re-use of vacant and/or blighted parcels to support long-term physical and social sustainability.
Our findings seem to support the idea that changes in physical characteristics of neighborhoods appear to provide stronger evidence of housing loss than changes in socio-economic variables. Therefore, planners may consider placing greater emphasis on changes in the former characteristics than the latter when seeking to anticipate future housing losses and plan future investments for responses to physical housing losses.
Policy and planning recommendations
This work helps planners analyze historical and current data on neighborhood physical and socio-economic characteristics to generate initial and promising insights about the housing demolitions, subsequent changes in building footprints, and variables representing changes in neighborhood physical and socio-economic characteristics that may be associated with building footprint changes. Our results may also help planners to consider the ways that urban form shifts during periods of depopulation so that vacancy and abandoned housing can be better managed.
We recommend that subsequent studies of this kind use more data on changes in building footprints and in socio-economic indicators of neighborhood health. Permits for demolitions, for example, are available through the OpenBaltimore data portal (2017). These data may support more elaborate models by which changes in physical and socio-economic neighborhood characteristics at the block group or block level may be associated with changes in building footprints over time. Results could enable planners to build a deeper understanding of the spatial dynamics of housing demolitions and subsequent footprint changes.
Conclusion
Summary of findings
This paper is an initial effort to document changes in building footprints within selected urban neighborhoods in two points of time, and to identify associations between changes in building footprints and physical and socio-economic characteristics of urban neighborhoods between those two points in time. Our paper has focused on the city of Baltimore, due to its distinctive industrial history and associated housing styles. Using data from five neighborhoods in the eastern portion of the city of Baltimore from the early 1970s and the current decade, we have found substantial support for the propositions that housing demolitions over time are spatially clustered, and are associated with changes in important neighborhood physical characteristics. However, we have found only limited evidence that housing demolitions over time are associated with changes in neighborhood socio-economic measures.
Contribution to scholarship
While there is an extensive research literature on urban shrinkage, post-industrial cities such as Baltimore and urban morphology, we have seen little work specifically on the nature of changes in physical configurations of housing over time rooted in detailed administrative data, as well as research on associations between changes in building footprints and a variety of neighborhood physical and social characteristics. Our study therefore fills a gap in this area. Our study also provides a basis for extensions that might generate more detailed and spatially extensive datasets, and more sophisticated spatial analyses.
Contribution to practice
Planning practitioners in larger cities have access to a wide variety of analytic tools, such as geographic information systems, relational databases and decision support technologies. However, it is less common for planners to have access to data that provide details on changes over time in the physical and social environment of the neighborhoods they serve so as to provide better support for planning interventions. This study will enable planners to make decisions based on well-documented relationships between key variables (e.g. building footprint changes and physical neighborhood characteristics), and to be especially careful when making decisions for which the evidence may be weak (e.g. building footprint changes and socio-economic neighborhood characteristics).
Next steps
There are a number of promising extensions for our study. One is to perform a complete multivariate analysis of physical and socio-economic neighborhood variables associated with building footprint change, accounting for spatial variation in the independent and dependent variables, at the block level, for multiple years between the early 1970s and 2014. Another is to extend the study to other portions of the city of Baltimore. Yet another would be to conduct similar studies in other cities in which row houses are an important part of the housing stock, such as Philadelphia, PA and Wilmington, DE. It may also be fruitful to compare findings from this study to findings from similar studies in distressed cities with other housing architectural traditions, such as Detroit, MI and Youngstown, OH.
Researchers could use the results of this study to build spatial forecasting models by which observed associations between housing loss and physical and social neighborhood characteristics might predict patterns of housing loss and provide more extensive support for neighborhood interventions that address blight and abandonment, as suggested by Culhane and Hillier (2001). Results from this and similar studies could support current research on planning support systems for vacant land management (see e.g. Johnson et al., 2014, 2015).
Footnotes
Declaration of conflicting interests
The author(s) declared no potential conflicts of interest with respect to the research, authorship, and/or publication of this article.
Funding
The author(s) disclosed receipt of the following financial support for the research, authorship, and/or publication of this article: Research for this paper was supported in part by the Abell Foundation, ‘Decision Modeling Tool for Vacant Structure Demolition and Redevelopment’, January 1–December 31, 2013.