
Abstract
Spatial decisions increasingly are made by both professional and citizen stakeholders using interactive maps, yet few empirically-derived guidelines exist for designing interactive maps that support complex reasoning and decision making across problem contexts. We address this gap through an online map study with 122 participants with varying expertise. The study required participants to assume two hypothetical scenarios in the North American hazardous waste trade, review geographic information on environmental justice impacts using a different interactive map for each scenario, and arrive at an optimal decision outcome. This study followed a 2 × 2 factorial design, varying interface complexity (the number of supported interaction operators) and decision complexity (the number of decision criteria) as the independent variables and controlling for participant expertise with the hazardous waste trade and other aspects of cartographic design. Our findings indicate that interface complexity, not decision complexity, influenced decision outcomes, with participants arriving at better decisions using the simpler interface. However, expertise was a moderating effect, with experts and non-experts using different interaction strategies to arrive at their decisions. The research contributes to cartography, geovisualization, spatial decision science, urban planning, and visual analytics as well as to scholarship on environmental justice, the geography of hazardous waste, and participatory mapping.
Keywords
Introduction
Scholars and practitioners in geography, GIScience, and related fields increasingly are seeking visual solutions for grappling with the complexity of our most pressing social, environmental, and economic problems (e.g., Andrienko et al., 2007; Goodspeed et al., 2016; Jankowski et al., 2001; Jankowski and Nyerges, 2001; Rinner, 2003; Robinson et al., 2017; Thomas and Cook, 2005; Yang et al., 2017). Such visualizations leverage the eye's broad sensory bandwidth to the brain, scaling the cognitive faculties of decision makers to the complexity of the problem (Roth and MacEachren, 2016). For decisions that are explicitly spatial, the primary visualization anchoring reasoning is a map (Jankowski and Richard, 1994; Leung, 2012), and increasingly, these maps are highly interactive and delivered online (Goodchild, 2015; Muehlenhaus, 2013; Peterson, 2003). However, few empirically-derived guidelines exist for designing interactive maps that support complex reasoning and decision making across problem contexts (MacEachren, 2015).
We address this gap through a case study on environmental justice (EJ) in the North American trade of hazardous waste. EJ activism and research employ maps to understand the uneven social burdens of environmental hazards, such as clusters of hazardous waste exposure (e.g., Buzzelli and Jerrett, 2003; Sider et al., 2015) and correlations with marginalized populations (e.g., Kweon et al., 2016; Lara-Valencia et al., 2009). EJ-informed decision making requires consideration of a range of social, environmental, and economic dimensions that vary geographically across specific sites (Coutinho-Rodrigues et al., 1997). Further, communities should be invited to participate in spatial decision making about hazard management (Laurian, 2005), empowering a range of different stakeholders to articulate concerns and discuss alternatives using maps (Elwood and Leszczynski, 2013; Jankowski, 2009; Talen, 1999).
Accordingly, EJ issues in the North American hazardous waste trade provide an important and timely problem context for investigating the design of interactive maps that support spatial decision making. Specifically, we ask three research questions:
Does cartographic interface complexity influence the success of spatial decision making? Not all interactive mapping systems work the same way. Interface complexity describes the number of interactive operators within the map (i.e., scope) and the precision that each operator can be interactively adjusted (i.e., freedom) (Harrower and Sheesley, 2005). Empirical research suggests that interface complexity influences how a user works with an interactive map (e.g., Dou et al., 2010; Jones et al., 2009; Keehner et al., 2008), and articulation of the influence of interface complexity on reasoning and decision making is a major research challenge in cartography, geovisualization, and visual analytics (Roth et al., 2017). Does decision complexity influence the success of spatial decision making supported by interactive maps? Not all decision contexts are the same. Decision complexity describes the number of decision criteria and potential outcomes (Jelokhani-Niaraki and Malczewski, 2015). While prior research has assessed the impact of the decision complexity on the decision-making process, research is limited on the effectiveness of interactive maps at different decision complexities (see Armstrong and Densham, 1995; Crossland et al., 1995; Speier, 2006). Development of useful and usable interfaces that support the decision-making process is therefore a major research challenge facing spatial decision science and the design of spatial decision support systems (Leung, 2012). Is the influence of cartographic interface complexity and spatial decision complexity dependent upon the expertise of the decision maker? Finally, not all decision makers think the same way. Individual differences impact all map use, interactive or otherwise (Griffin et al., 2017). Here, we specifically examine user expertise, a combination of education, experience, and familiarity with a given subject (Roth, 2009). This is particularly relevant in participatory mapping for just environmental decision making, where professional and citizen stakeholders negotiate a range of experiences, opinions, and values through the map interface to arrive at a decision (Elwood, 2006).
We addressed these research questions through an online map study that required 122 participants to assume two hypothetical scenarios in the North American hazardous waste trade, review geographic information on EJ impacts using a different interactive map for each scenario, and arrive at an optimal decision. We followed a 2 × 2 factorial design, using interface complexity (assigned between groups) and decision complexity (assigned within groups, resulting in the two tested scenarios per participant) as the independent variables and controlling for participant expertise and other aspects of cartographic design.
Related work
Cartographic interface complexity and spatial decision complexity are treated in a range of research streams related to interactive mapping. MacEachren (1994) identifies three continua defining all map use contexts, with each research question listed above addressing one aspect of each axis: human-map interaction (RQ1: complex interfaces for exploration to simple interfaces for presentation), task (RQ2: complex to simple decisions), and users (RQ3: expert to non-expert decision makers).
There are a range of design decisions that impact the effectiveness of an interactive map, including user goals and needs, interface complexity, overall usability, browser and device compatibility, and the visual style and layout (see Howard and MacEachren, 1996). Interface complexity (RQ1) describes the scope and freedom of an interactive map (Harrower and Sheesley, 2005), which together combine to determine the total number of unique views that can be generated by a user. We narrow our focus to scope in this research, which is defined by the number of unique operator primitives, or generic forms of interactive functionality such as panning, zooming, etc., implemented (see Roth, 2013). While a push towards exploratory visualization has resulted in development of a number of flexible mapping toolkits supporting a range of operators (e.g., Bostock et al., 2011; Hardisty and Robinson, 2011), empirical research has suggested that reducing complexity may better support concrete tasks (e.g., Dou et al., 2010; Jones et al., 2009; Keehner et al., 2008). However, most empirical research on interactive maps has produced mixed results on the utility of specific operator primitives (e.g., Andrienko et al., 2002; Edsall, 2003; MacEachren et al., 1998; Poplin, 2015; Roth and MacEachren, 2016), suggesting that the decision to include a given operator depends on the task and user context (Griffin et al., 2017). We focused on five operators in this study based on two of the most common interface design strategies in web cartography and visualization: a simple web slippy map including panning, zooming, and detail retrieval (Sample and Ioup, 2010) and a more complex information seeking strategy supporting overlay of data (“overview first”), pan/zoom and filter (“zoom and filter”), and retrieve (“details-on-demand”) (Shneiderman, 1996).
Decision making is a higher level cognitive process through which a person evaluates all available factors to make a choice about a given problem (Payne et al., 1993). Decision complexity (RQ2) describes the number of criteria and outcomes involved in a decision (Jelokhani-Niaraki and Malczewski, 2015). While simple decisions tend to have a correct decision outcome, more complicated decisions rely on optimality, or a ranking of prospective solutions by how they minimize or maximize different contextual criteria (Einhorn and Hogarth, 1981). In this research, we vary the number of decision criteria while holding the number of outcomes (i.e., sites) constant to maintain a consistent, elementary-level ranking decision across experimental trials, one common type of map reading task supporting spatial decision making (see Andrienko et al., 2003; Roth, 2012 for overviews of map reading tasks). As with interface complexity, empirical results are mixed regarding the impact of decision complexity on decisions supported by spatial decision support systems and interactive maps, with Jelokhani-Niaraki and Malczewski (2015) finding a significant difference in outcomes by decision complexity and Crossland et al. (1995) and Jankowski and Nyerges (2001) finding no difference in outcomes by decision complexity.
Finally, expertise (RQ3) describes the influence of education, experience, and familiarity with a given subject. While MacEachren (1994) originally described this axis as a distinction between public and private map use, a later focus (MacEachren et al., 2004) was on user expertise, or differences between a general and specialist map user. Again, there are conflicting findings on the role of expertise on map use, with some studies finding increased expertise improves map use and decision making (e.g., Hope and Hunter, 2007; Ooms et al., 2015; Roth, 2009) while others finding no influence (e.g., Aerts et al., 2003; Evans, 1997; Jankowski and Nyerges, 2001).
Methods
Case study: Environmental justice and the transnational hazardous waste trade
We examined the above interface, decision, and decision-maker considerations through a case study about EJ in the North American hazardous waste trade. The case study is part of a larger project to track and map the import of hazardous waste to the U.S. from Canada and Mexico in support of EJ initiatives and participatory decision making (http://www.geography.wisc.edu/hazardouswaste/). Here, hazardous waste is defined as waste that could cause harm to humans or the environment and is also ignitable, corrosive, reactive, and/or toxic.
Preparatory research
Before administering the online map study, we conducted four stages of preparatory research. First, we obtained data on the transnational hazardous waste trade through two Freedom of Information Act (FOIA) requests to the U.S. Environmental Protection Agency (EPA) and digitized the provided import manifests into a geocoded dataset of waste flows (see Nost et al., 2017 for details). Second, we held a one-day mapping workshop at the University of Wisconsin–Madison—described as the Design Challenge—to explore the dataset (see Moore et al., in press for details). Third, we completed a set of semi-structured interviews with three domain experts to ascertain background context about the transnational hazardous waste trade (details in online supplementary materials). We used this input from domain experts to inform the decision scenarios described below. Finally, we conducted a pilot study with a preliminary version of the study with eight students in the University of Wisconsin–Madison Cartography Lab to identify any confusions or problems in the experimental design.
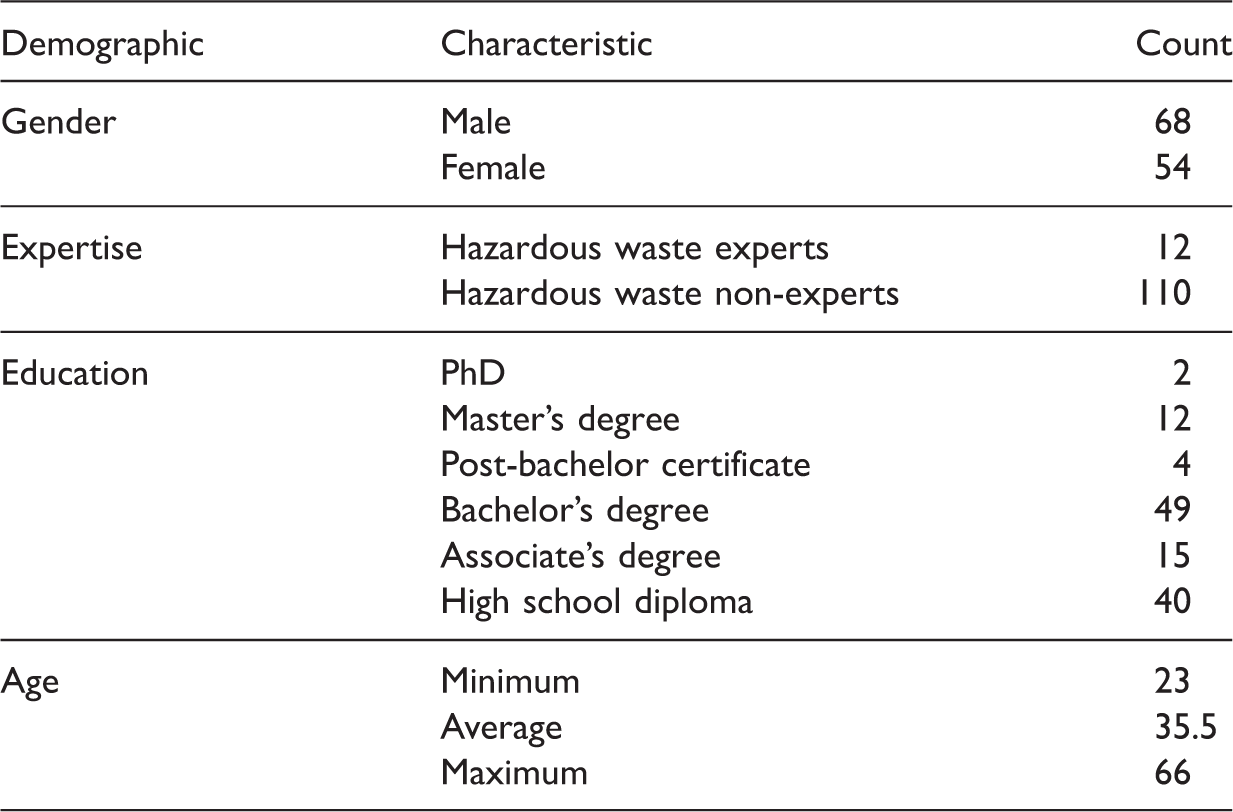
Participants
Demographics of study participants.
Materials
Interface complexity and decision complexity factors.
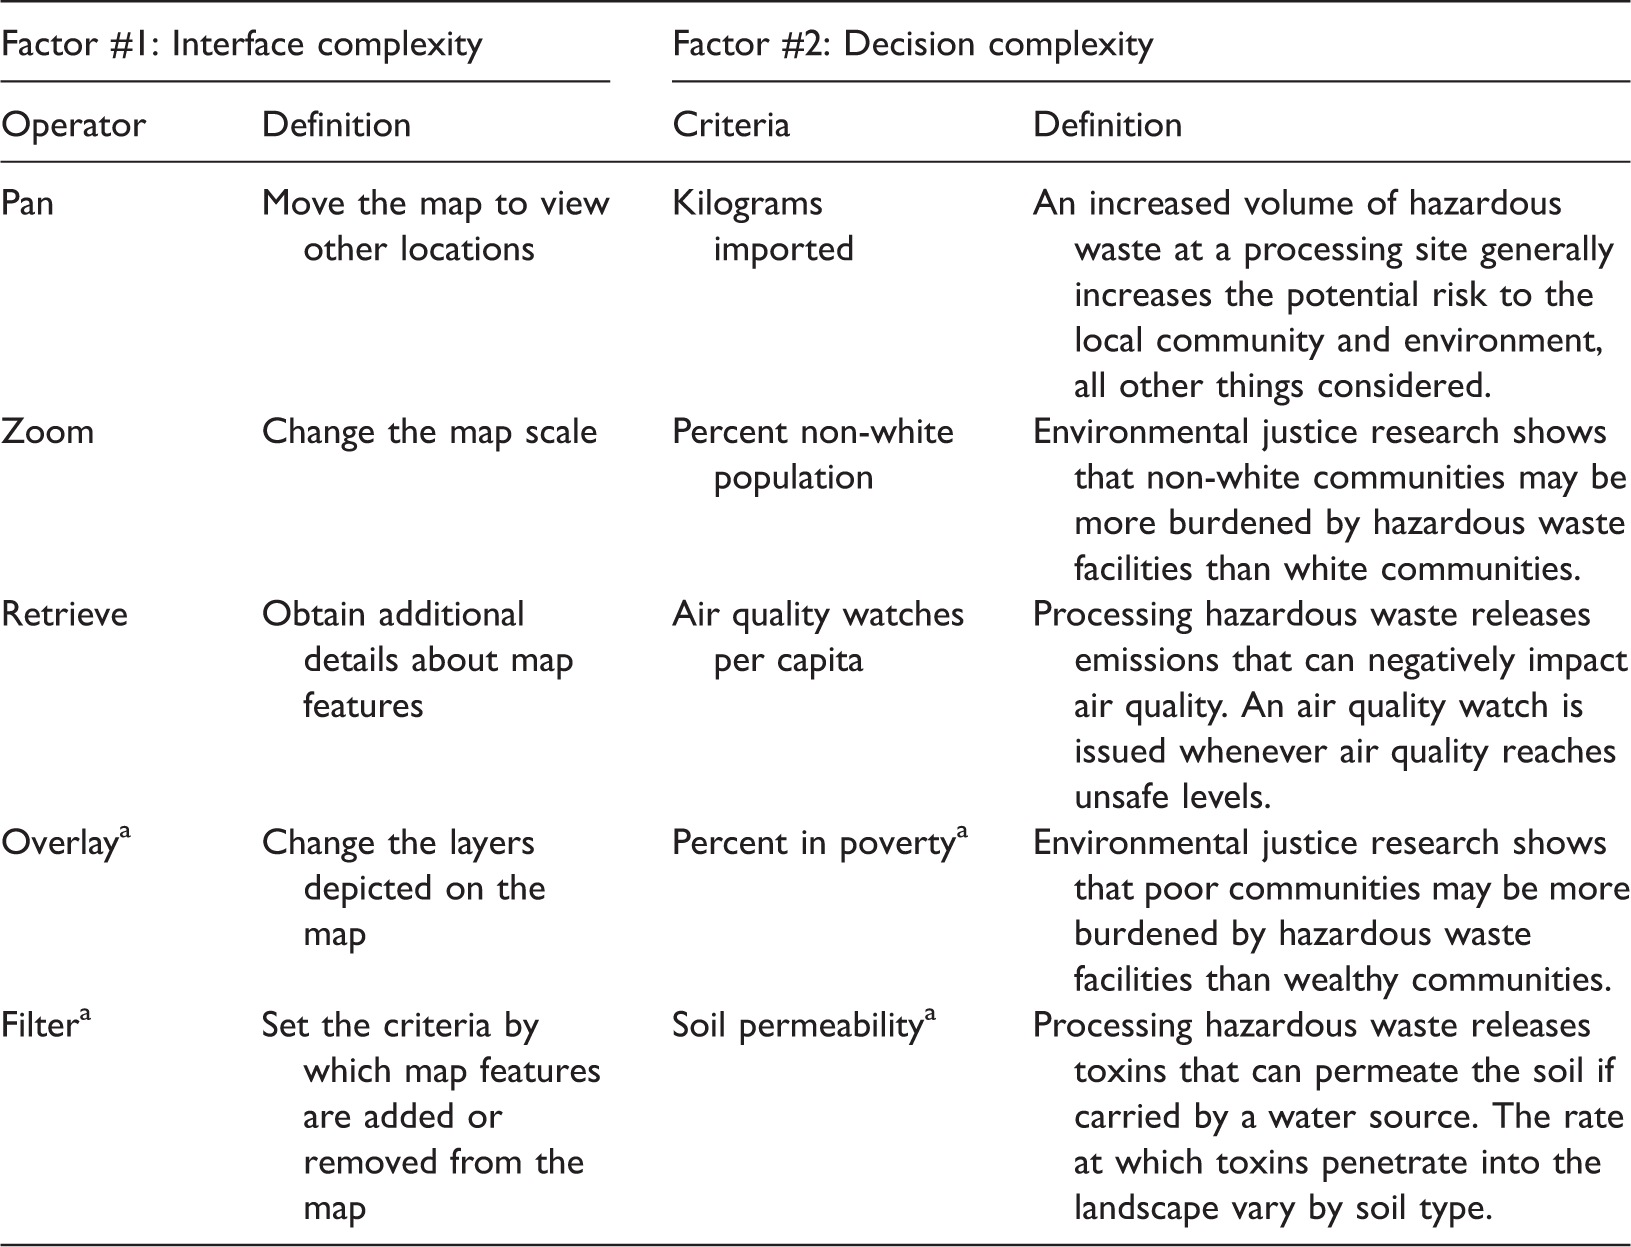
Use in the complex condition only.
We varied interface complexity conditions by interface scope (RQ1). The simple condition was constrained to the pan, zoom, and retrieve operators common to slippy web maps and the complex variation added filter and overlay. Thus, the complex variation did not provide more information about the decision, but rather additional ways to acquire (via overlay) or manipulate (via filter) the mapped information. Both conditions used the same, subdued basemap with limited context features and no labels to promote interaction during decision making. All other aspects of interface design (e.g., usability, compatibility, visual design and layout) were controlled between factors.
We varied decision complexity conditions by the number of decision criteria (RQ2), with the simple and complex condition including three and five criteria respectively (after Crossland et al., 1995). In both conditions, we included one economic criterion (kilograms of waste imported), balanced the remaining criteria between environmental and social impacts, and mapped seven processing facilities to control the number of decision outcomes. The inclusion of seven decision outcomes is based on the geography of the transnational trade of hazardous waste, as no state currently has more than seven processing facilities. We represented kilograms of waste imported using proportional symbols on the facility and made the other criteria available only through interaction. To determine the “optimal” or “correct” ranking of the seven facilities by the provided criteria, we classified each decision criterion into three categories and assigned values 1–3 (1 = low risk, 3 = high risk) to generate a total risk score across criteria. We selected the criteria so that the total scores were equally spaced across the seven facilities, resulting in a “correct” ranking of the seven facilities when considering all available information (i.e., decision criteria) equally following the EJ focus. In the interactive maps, the classification of each decision criterion was reported and mapped on an ordinal low-high risk scale.
Procedure
The online map study began with background information on project goals. After obtaining consent, participants completed a training block with an example decision scenario and an explanation of the available interactive functionality. The participants were allotted as much time as needed to explore the interactive map and complete the example decision before beginning the experimental blocks (Figure 1a).
Tasks participants were asked to complete. (a) The example map (for the complex interface) detailing map functionality. (b) Company manager scenario requiring participants to rank facilities based on preference for doing business. (c) EPA regulator scenario requiring participants to rank facilities based on urgency of site visits.
Participants then completed two decisions of variable complexity using different geography (Ohio, Texas) and different interactive maps. We randomly assigned the decision complexity conditions to vary within subjects—resulting in the two tested scenarios per participant—but the interface complexity conditions varied between subjects so that participants only learned a single set of functionality in the opening example and thus did not try to evoke functionality that was removed in subsequent trials. The combination of decision complexity and geography, and the order of the two decisions within the online map study, was randomized within subjects.
Both decision trials began with participants reviewing a decision scenario. One scenario required participants to assume the role of a manager of a hazardous waste firm looking to send hazardous waste to the U.S. for disposal and rank their preference for doing business with listed facilities (Figure 1b). The other scenario asked participants to assume the role of a regulator at the EPA in charge of ensuring sound waste processing and rank the urgency of site visits to ensure companies are following regulations (Figure 1c). We derived the scenarios from the preparatory semi-structured interviews and confirmed they were appropriate in the pilot study, resulting in simplified, yet reasonably realistic ranking tasks at an elementary (site-specific) level. Importantly, EJ was the focal point in both decision scenarios, with the description contextualizing all reference to all decision criteria (Table 2) and therefore encouraging participants to consider all available information when making their decisions. The online map study completed with an exit survey capturing participant characteristics and experiences (RQ3). The complete study protocol is included in the online supplementary materials.
Measures and analysis
Participants' decisions associated with each map were captured through rank-order forms (Map Task; Figure 1b and 1c). Along with these responses, all map interactions performed by participants while evaluating each scenario were captured by the MapStudy application and recorded in a database. We did not collect decision response or interaction times given the potential for different loading rates and split attention in an online, uncontrolled testing environment.
We assessed correctness of the ranking decision using the Kendall Rank Correlation Coefficient (Crossland et al., 1995; Mennecke et al., 2000). Kendall analysis provides both a measure of correctness (
We conducted z-tests for differences in dependent variables between simple and complex interface complexity variations, and paired two sample t-tests for differences between decision complexity conditions (simple, complex), geography (Ohio, Texas), order (1st, 2nd), and expertise (expert, non-expert). Finally, we used χ2 tests to determine differences in interaction operator extensiveness and frequency.
Results and discussion
Overall decision performance
The overall correctness of the ranking decisions was
We did not find significant differences by geography (Ohio, Texas) or order (1st, 2nd) on decision correctness, difficulty, or confidence. Thus, the study design successfully controlled for confounding effects to isolate the two examined factors.
Participants interacted with the map during 243 of 244 decisions (99.6%) through a substantial total of 5900 combined interactions, an indication that the training block properly introduced participants to the available interactivity. However, there were wide differences in the use of operators by both extensiveness (χ2 = 362.25, p < 2.2 × 10⁻¹⁶) and frequency (χ2 = 24.834, p = 0.003), meaning that the application of operators was non-random and thus intentional interaction strategies were used when making decisions. Overall, participants made greatest use of retrieving details, followed by panning and overlaying datasets, and relatively limited use of filtering and zooming. We again did not find significant differences in interaction by geography or order.
Interface complexity
Interface complexity (Factor #1) was the primary driver of decision performance in the online map study (Figure 2). Participants performed significantly better when given the simple interface that did not include overlay or filter (z = 4.102, p = 4.102 × 10⁻⁵); 68.4% of decisions were statistically correct for the simple condition ( Comparison of means and standard deviations of the various conditions to the overall. (a) Correctness results for simple/complex interface and decision complexities and hazardous waste experts/non-experts. (b) Difficulty results for simple/complex interface and decision complexities and hazardous waste experts/non-experts. (c) Confidence results for simple/complex interface and decision complexities and hazardous waste experts/non-experts. Larger dots indicate significance. See full results tables in online supplementary materials.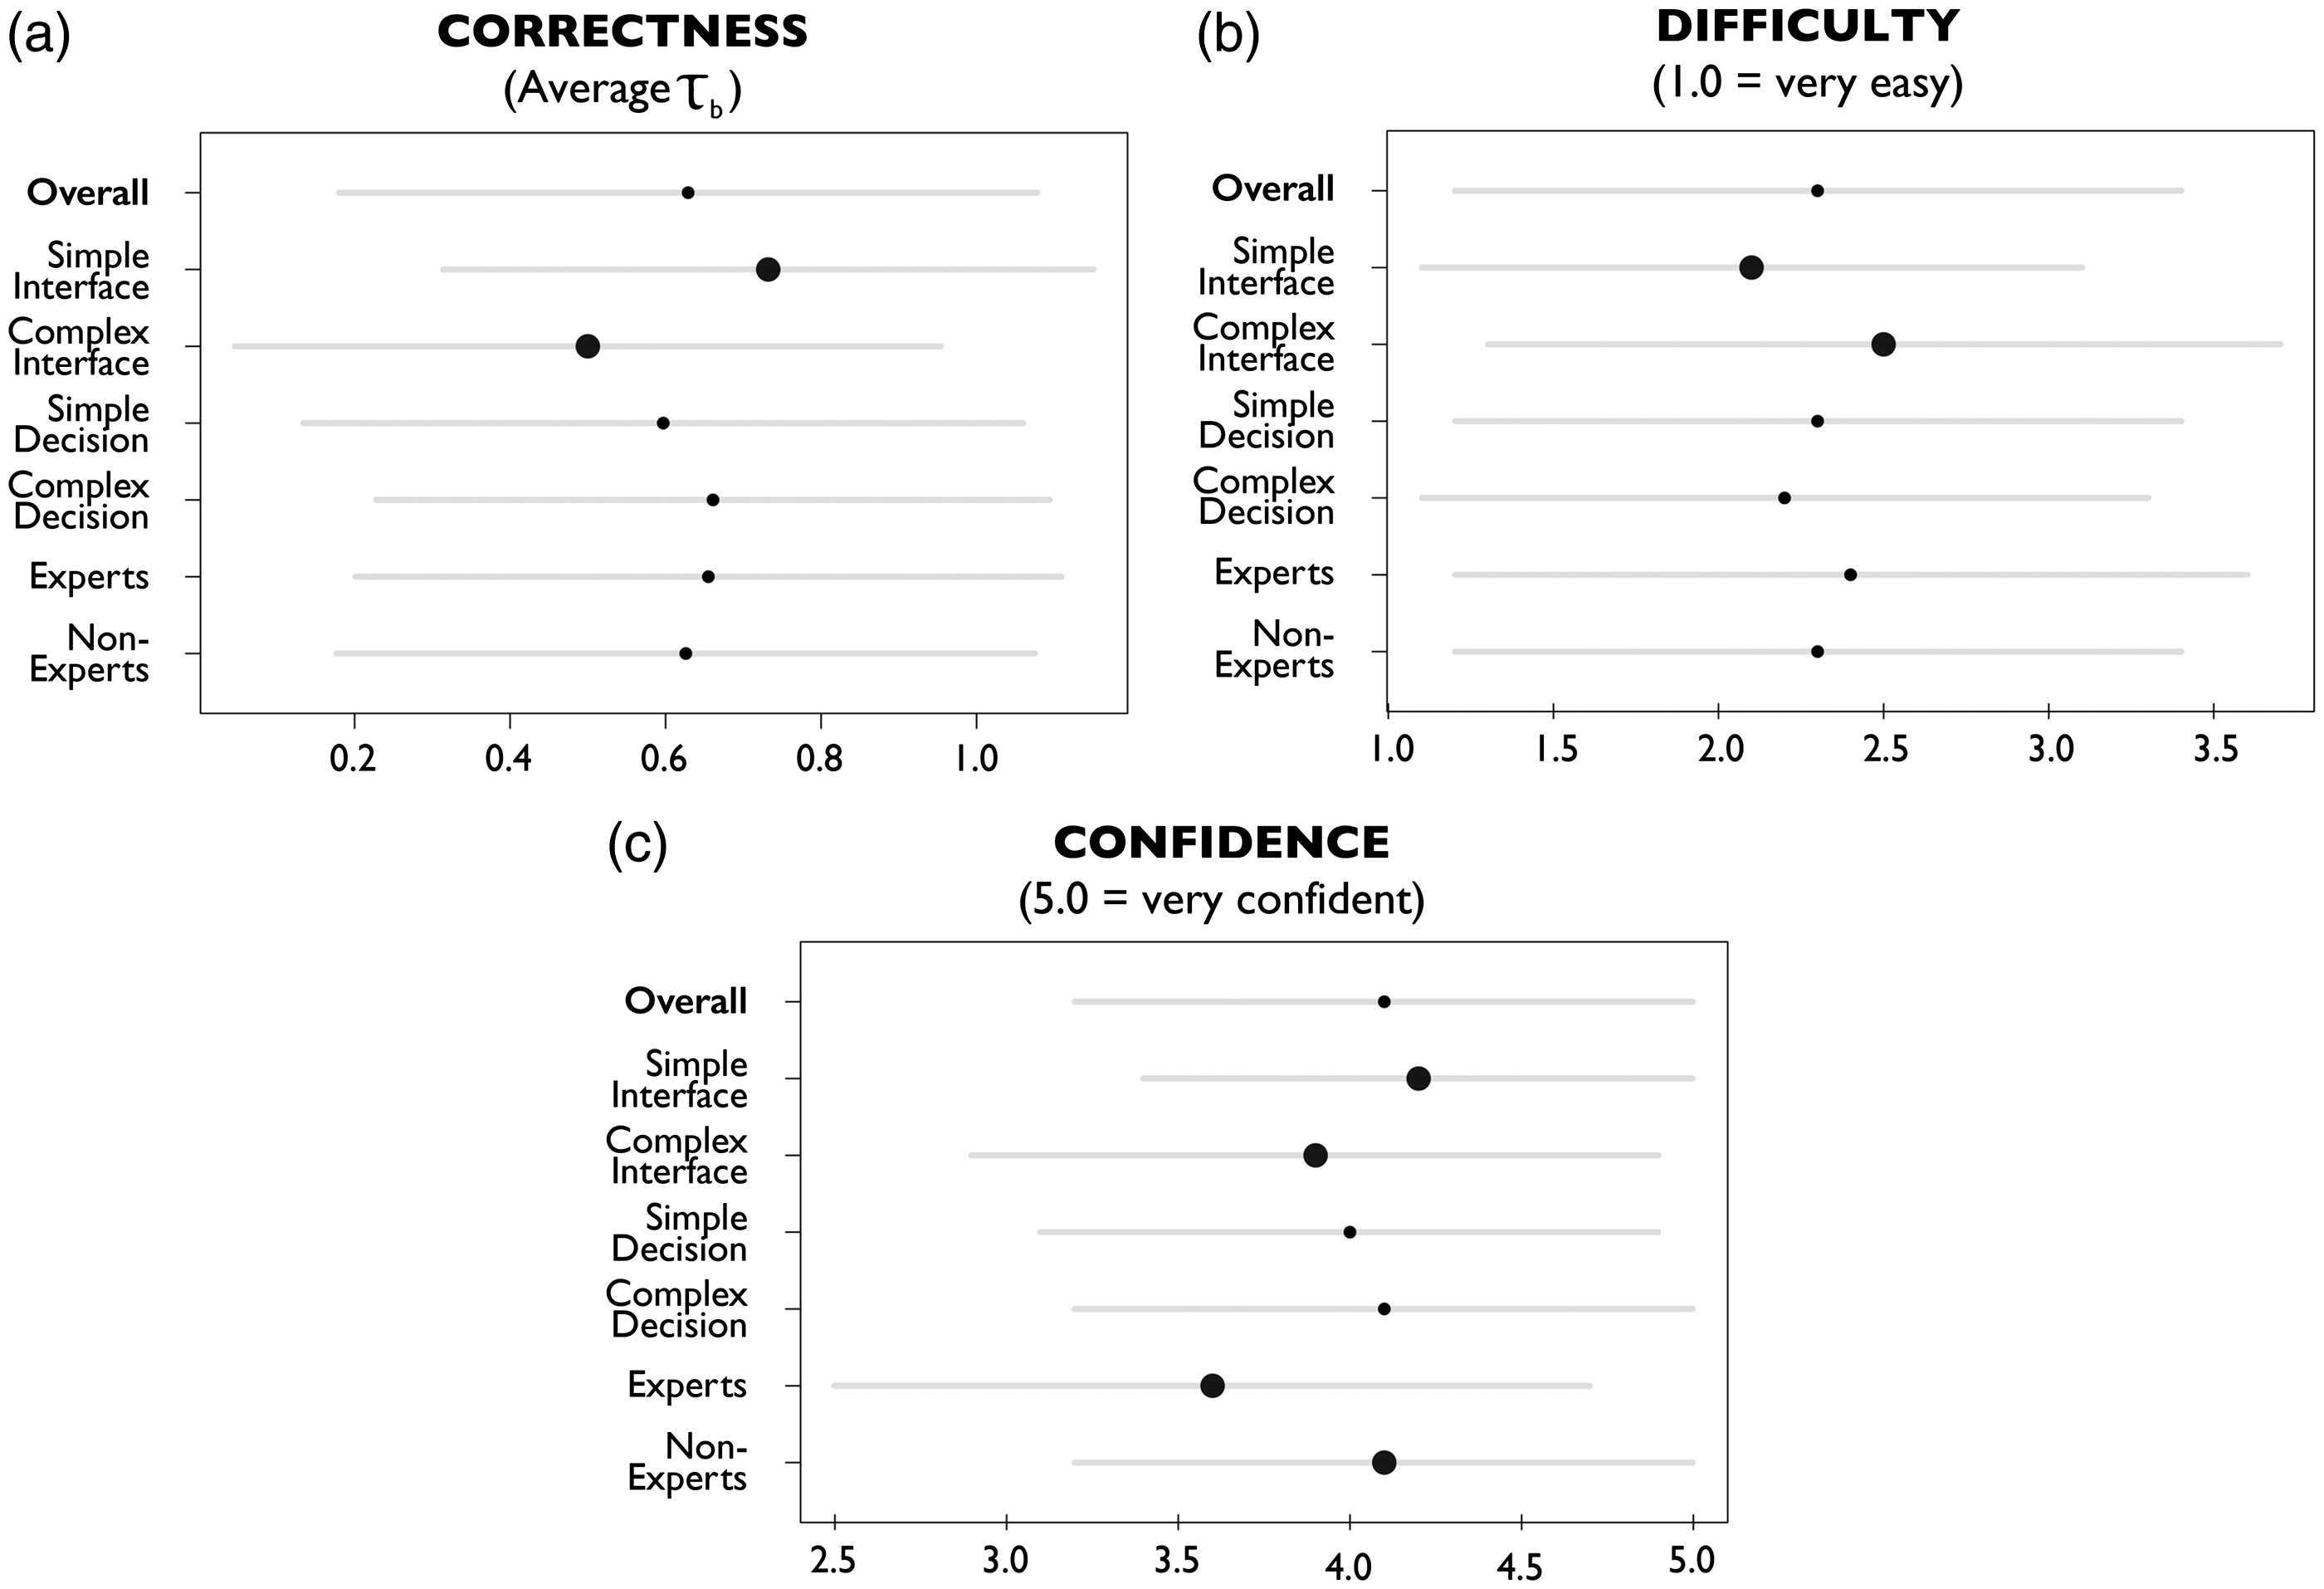
Participants also found decisions supported by the complex interface condition significantly more difficult than the simple condition (z = −3.198, p = 0.001). The inclusion of additional interaction operators in the complex condition made the decision appear to be more difficult to participants, even though the decision itself was unchanged. Accordingly, the added interaction scope and its increased perceived difficulty likely explain the decreased decision correctness in the complex condition.
Further, participants were significantly less confident in their decisions when using the complex interface (z = 2.941, p = 0.003). Thus, not only did the increased interface complexity decrease correctness while increasing perceived difficulty, it also shook participant confidence. In a real-world scenario, this reduced confidence may make decision makers more likely to rely on prior experience or personal opinion during planning.
The observed differences in correctness, difficulty, and confidence between the simple and complex interface complexity conditions were clarified by the interaction logs. While participants did interact more when presented with the complex condition (19.15 versus 30.51 interactions per decision), we did not find significant differences in overall interactions either by extensiveness (t = 0.619, p = 0.580), given the overwhelming number of participants that interacted at least once, or by frequency (t = 0.352, p = 0.759), given the wide variation in interactions across participants. The increase in interaction with the complex condition was expected given the wider interface scope, but also further highlights the importance of constraint in interactive decision support tools, as the added time spent interacting did not clarify the decision, but instead complicated it.
However, interactions did vary by individual operators between interface complexity conditions. Participants employed retrieve significantly more times in the simple condition than the complex (t = 3.77, p = 0.033). Further, 100% of participants used retrieve at least once in the simple condition, but only 80.6% in the complex condition, a large although not significant difference (t = 3.03, p = 0.058). Retrieve accounted for 76.2% of all operators applied in the simple condition, but only 35.6% in the complex condition. Thus, while participants primarily relied on retrieve to make their decision when using the simple interface, participants made more use of wider range of operators in the complex interface, such as pan and overlay.
While participants applied pan relatively frequently in both conditions, the reliance on overlay in the complex condition is particularly noteworthy and suggests that separate interaction strategies were used between the simple and complex interfaces: the former relying on retrieve and the latter integrating use of overlay. Interestingly, retrieve and overlay present opposite interactive approaches for weighing decision criteria against decision outcomes, with retrieve presenting multiple criteria for a single outcome (e.g., as a textual information panel anchored to a single processing facility) and overlay presenting one criteria for all decision outcomes (e.g., as a new visual layer added to the map). In the case study, participants were more successful with the textual, retrieve-focused strategy than the visual, overlay-focused strategy. From a geographic perspective, the scale of the decision may have influenced the relative utility of retrieve versus overlay, as the focus of retrieve on a single outcome likely is more useful for site-based, elementary-level decisions (such as the decisions included in this research) while the focus of overlay on a range of outcomes may be more useful for regional-based, general-level decisions.
Finally, qualitative feedback suggested that filtering was not useful for the pair of decisions—further complicating the relationship between exploratory information seeking and decision support tools—and that pan and zoom were primarily used as enabling operators to work with the reduced screen real-estate for the interactive map in the MapStudy split-panel layout (Figure 1). These operators did not appear to influence decision making. Thus, participant interaction strategies did not indicate substantial information seeking using the complex interface, despite expectations (after Shneiderman, 1996).
Decision complexity
Decision complexity (Factor #2) was far less influential on decision making than interface complexity (Figure 2). We did not find a significant difference in correctness between decision complexity conditions (t = −1.352, p = 0.179). However, participants did perform slightly better on complex decisions (
We also did not find a significant difference between interface complexity conditions in difficulty (t = 0.810, p = 0.419) or confidence (t = −0.797, p = 0.427). Thus, greater decision complexity does not always mean greater decision difficulty or reduced confidence. As with correctness, interface complexity and not decision complexity influenced both dependent variables.
There were few noteworthy differences in interaction strategies between the simple and complex decision complexity conditions. As with the interface complexity factor, we did not find significant differences between conditions in interaction extensiveness (t = −0.127, p = 0.902) or frequency (t = −0.203, p = 0.844). We also did not find significant differences between decision complexity levels in the use of individual operators. Once again, it was the interface complexity, not decision complexity, that determined how participants developed interaction strategies to support their decision-making process.
Expertise
Expertise had a moderating effect on the way that participants used the interactive maps for spatial decision making (Figure 2). Overall, experts (
Interestingly, we found a significant difference between experts and non-experts in confidence (t = −2.723, p = 0.007), but not difficulty (t = 0.467, p = 0.641), with non-experts (4.1/5, SD = 0.9) more confident in their responses than experts (3.6/5, SD = 1.1). While seemingly counterintuitive, this finding actually may be evidence that the expert group demonstrated their prior knowledge by properly assessing the gravity of the decision. Experts understood the consequences of their decisions and more fully weighed the costs of their decision (some of which may be uncertain) into their reported confidence. In contrast, non-experts lacked exposure to real consequences, leading to increased confidence. This finding is important for participatory EJ decision making, as the general public may not be fully aware of prior consequences in similar locations—and thus need such context in addition to local information—but also have a unique understanding of their own risks important to include in collaborative discussion.
Importantly, experts and non-experts differed substantially in their interaction strategies. Overall, experts (29.54 interactions per decision) interacted with the map more frequently than non-experts (only 23.60 interactions per decision) and we found significant differences in the use of each operator by both extensiveness and frequency.
Accordingly, analysis of interaction operators across expertise further clarified differences in interaction strategies. As reported above, participants using the textual, retrieve-focused strategy performed better than participants using the visual, overlay-focused strategy. However, experts more extensively made use of overlay than non-experts (100.0% versus 80.2%), but less extensive use of retrieve (83.3% versus 92.3%). Because there was no significant difference in correctness between conditions of expertise—with experts returning slightly more correct decisions—the overlay strategy was not universally suboptimal, but rather required a degree of expertise to use effectively. One hypothesis is that experts more easily interpreted the overlay map symbols, enabling them to review one criterion (attribute) across outcomes (sites), whereas non-experts relied on non-map text contained in the retrieval pop-ups, presenting information for one outcome (site) across all criteria (attributes). Experts also more extensively and frequently zoomed and filtered compared to non-experts, suggesting greater application of exploratory information seeking on which the complex interface design was based.
Conclusions: Improving spatial decision making with interactive maps
In this article, we reported on an empirical study to improve spatial decision making supported by interactive maps, using a case study on EJ concerns in the North American hazardous waste trade. Specifically, we asked three questions:
Does cartographic interface complexity influence the success of spatial decision making? Differences in interface complexity significantly influenced decision making. Without considering moderating effects, the simpler interactive map resulted in more correct decisions, reduced perceived difficulty, and greater confidence. These findings corroborate growing research that more interface functionality is not necessarily better (e.g., Dou et al., 2010; Jones et al., 2009; Keehner et al., 2008), with the appropriate interface complexity depending on the task at hand and extraneous operators potentially resulting in suboptimal interaction strategies (e.g., Edsall, 2003; Roth and MacEachren, 2016). This difference in confidence is important for spatial decision science, as decision makers may be more likely to rely on prior experience or personal opinion when using more complex interfaces. The interaction logs further explained how interface complexity influenced spatial decision making. Two interaction strategies emerged for making the decisions: a textual, retrieve-focused strategy presenting multiple criteria for a single outcome and a visual, overlay-focused strategy presenting one criteria for all decision outcomes. This difference has several important implications. Participants in general were more successful when using retrieve instead of overlay, perhaps because the decision required them to rank individual sites rather than broad regions. Thus, the scale of analysis and reasoning may impact the relative utility of interaction operators for a given decision, with the map and map interactions perhaps growing more useful over text alternatives for general rather than elementary tasks (Andrienko et al., 2003). Finally, participants used filter and zoom relatively infrequently, suggesting that not all problem contexts require engagement with exploration (after MacEachren, 1994) and information seeking (after Shneiderman, 1996). Does decision complexity influence the success of spatial decision making supported by interactive maps? Not all decision contexts are the same, but decision complexity did not impact the decision-making process. We did not find significant differences in decision correctness, difficulty, confidence, or interaction strategies between the simple and complex decisions, a result consistent with Crossland et al. (1995) and Jankowski and Nyerges (2001). Taken together, these findings on interface and decision complexity are important from a design perspective, as the interactive map design can have more influence over the decision-making process than the decision itself. Thus, interactive mapping tools actually may interfere with the decision-making process when designed poorly or for the wrong problem context. We hypothesize that a threshold specific to every problem context exists where decision complexity, not interface complexity, has a greater influence on the decision-making process and outcomes. In particular, future research is needed to vary the number of decision outcomes in addition to decision criteria to understand the interplay of all components of decision complexity with interface complexity. Is the influence of cartographic interface complexity and spatial decision complexity dependent upon the expertise of the decision maker? Finally, differences in participant expertise influenced the interaction strategies participants used to complete their decision. We expect the role of expertise to become more important as the decision complexity grows. While we did not find a significant difference by expertise in perceived difficulty, experts were significantly less confident in their decisions. This finding corroborates prior work on expertise in mapping and clarifies the above relationship between interface complexity and confidence: while the complex interactive map reduced confidence and therefore would make decision makers more likely to rely on prior experiences or personal opinions, expert decision makers are always better positioned to draw from experience, particularly from their understanding of the potential consequences of their decisions. Further research is needed to understand how to build expert and non-expert trust in interactive maps to support decision making and action. The differences in interaction strategies between experts and non-experts were striking, with experts making use of a wider range and number of interactions. Based on these results, experts are capable of making use of more complex interactive maps, while non-expert citizens need simple interactive maps to participate in the decision-making process, supporting MacEachren (1994). As experts and non-experts begin to work together for community-driven EJ—and as the expert and non-expert continue to blur in a digital, information-driven age—we anticipate a move away from generic, multi-purpose systems towards custom interactive maps tailored for a specific collaborative assemblage of spatial decisions and decision makers.
Our research had several limitations that point to further research extensions. First, we investigated interface and decision complexity in a single application domain—EJ in the hazardous waste trade—and our findings should be corroborated in other application domains. Second, this study did not consider collaborative decision making, with each participant making their decisions individually. We are planning follow-up field work in the hazardous waste trade to understand how decision makers collaborate on problems to negotiate an optimal outcome using a wider range of information with numerous uncertainties. Finally, our analysis pointed to several additional experimental factors and measures worthy of examination, including additional interaction operators, a wider range of decision complexities, a comparison of site (elementary) and regional (general) decisions, and additional individual differences. We have made our source code available as supplementary materials to enable extension (see also http://www.github.com/uwcart/).
Interactive maps hold substantial potential for improving spatial decision making. In the context of EJ, such interactive maps make otherwise disparate geographic information accessible and usable, enabling decision makers to consider a wide range of social, environmental, and economic impacts as they determine our future landscapes. As geographic information and interactive maps to this information become increasingly central to such spatial decisions, we need future research on what interactions are needed for which types of decisions and decision makers.
Supplemental Material
Complexities Supplemental Tables -Supplemental material for Improving spatial decision making using interactive maps: An empirical study on interface complexity and decision complexity in the North American hazardous waste trade
Supplemental material, Complexities Supplemental Tables for Improving spatial decision making using interactive maps: An empirical study on interface complexity and decision complexity in the North American hazardous waste trade by Kristen Vincent, Robert E Roth, Sarah A Moore, Qunying Huang, Nick Lally, Carl M Sack, Eric Nost and Heather Rosenfeld in Environment and Planning B: Urban Analytics and City Science
Supplemental Material
Complexities Interview Protocol -Supplemental material for Improving spatial decision making using interactive maps: An empirical study on interface complexity and decision complexity in the North American hazardous waste trade
Supplemental material, Complexities Interview Protocol for Improving spatial decision making using interactive maps: An empirical study on interface complexity and decision complexity in the North American hazardous waste trade by Kristen Vincent, Robert E Roth, Sarah A Moore, Qunying Huang, Nick Lally, Carl M Sack, Eric Nost and Heather Rosenfeld in Environment and Planning B: Urban Analytics and City Science
Supplemental Material
Complexities Source Code -Supplemental material for Improving spatial decision making using interactive maps: An empirical study on interface complexity and decision complexity in the North American hazardous waste trade
Supplemental material, Complexities Source Code for Improving spatial decision making using interactive maps: An empirical study on interface complexity and decision complexity in the North American hazardous waste trade by Kristen Vincent, Robert E Roth, Sarah A Moore, Qunying Huang, Nick Lally, Carl M Sack, Eric Nost and Heather Rosenfeld in Environment and Planning B: Urban Analytics and City Science
Supplemental Material
Complexities Study Protocol -Supplemental material for Improving spatial decision making using interactive maps: An empirical study on interface complexity and decision complexity in the North American hazardous waste trade
Supplemental material, Complexities Study Protocol for Improving spatial decision making using interactive maps: An empirical study on interface complexity and decision complexity in the North American hazardous waste trade by Kristen Vincent, Robert E Roth, Sarah A Moore, Qunying Huang, Nick Lally, Carl M Sack, Eric Nost and Heather Rosenfeld in Environment and Planning B: Urban Analytics and City Science
Footnotes
Declaration of conflicting interests
The author(s) declared no potential conflicts of interest with respect to the research, authorship, and/or publication of this article.
Funding
The author(s) disclosed receipt of the following financial support for the research, authorship, and/or publication of this article: This research was supported by the National Science Foundation Awards #1539712 and #1555267, the University of Wisconsin–Madison Department of Geography Trewartha Research Grant, the AAG Cartography Specialty Group Master's Thesis Research Grant, and the Wisconsin Alumni Research Foundation.
Supplementary material
Supplementary material is available for this article online.
References
Supplementary Material
Please find the following supplemental material available below.
For Open Access articles published under a Creative Commons License, all supplemental material carries the same license as the article it is associated with.
For non-Open Access articles published, all supplemental material carries a non-exclusive license, and permission requests for re-use of supplemental material or any part of supplemental material shall be sent directly to the copyright owner as specified in the copyright notice associated with the article.