



Abstract
In this study, we propose a cost-effective method for tranquillity mapping using multi-criteria analysis and open geospatial data. We apply this method in an extended zone around a major Greek highway trespassing areas of high natural value. Composite criteria are developed through analytic functions and geostatistical methods to reflect either barriers or enablers of tranquillity. The results indicate that it is possible to identify tranquility zones which are spatially plausible. To verify the validity of the results, we calculate the Kappa coefficient (0.71) and the overall accuracy (80%) using preference data obtained from non-specialized photo-interpreters in a sample of places on Google Earth. We believe that this method can inform planning, especially in countries with a weak landscape policy.
Introduction
Tranquillity is a concept in the literature used to describe both a state of mind and an experience perceived in certain spaces. As a state of mind, tranquillity is synonymous to calmness, quietness, solitude and a sense of escape from the everyday lifestyle (Herzog and Barnes, 1999; Herzog and Bosley, 1992; Kaplan and Kaplan, 1989; Ulrich et al., 1991). Spaces that enable a sense of tranquillity are considered restorative for health and therefore, “increasingly important in a world of sensory overload” (Pheasant et al., 2010: 501). Understanding and predicting the patterns of tranquillity has been a topic of interest in land-use and landscape planning (CPRE, 2005; Land Use Consultants, 2007; Jackson et al., 2008; Pheasant et al., 2009a, 2009b), forest management (Bell, 1999), tourism (Schwarz, 2013; Votsi et al., 2012, 2014) and urban green and walkability studies (Watts, 2018; Watts et al., 2011, 2013).
Most recently, there has been an interest for tranquillity at the European policy level. The EU has acknowledged the significance of tranquillity recognizing the risks imposed by increasing levels of noise in Europe. The implementation of the European Noise Directive (Commission of the European Communities, 2002). obliges member states to take measures for the protection of quietness. Subsequently, a good practice guide to map the quiet areas of Europe was proposed with an aim to promote policies for the conservation of these areas (EEA, 2014). This method developed an index, namely the Quiet Suitability Index (QSI), based on two hypotheses: (a) noise sources directly distract from quietness and (b) land cover and the population density indirectly affect the way people perceive noise. Votsi et al. (2012, 2014) contributed to the development of this method with their proposed framework for mapping quiet areas in Greece to elicit opportunities for green tourism.
Nevertheless, this concept of tranquillity as identical to quietness has neglected an important body of literature which suggests that the perception of tranquillity is far more complicated. At least four key conceptual dualisms need to be taken into consideration in order to approach tranquillity in an integrated manner: (a) naturalness – artificiality; (b) noise disturbance – quietness (or sound pleasantness); (c) urbanization – ruralness (or remoteness); (d) light pollution – darkness (or dark night sky).
Significant contributions to the emergence of tranquillity as a concept related to specific qualities of space date back to studies related to mental health (Kaplan, 1995; Kaplan and Kaplan, 1989; Ulrich et al., 1991). The Attention Restoration Theory (ART) of Kaplan and Kaplan (1989) proposed that engagement with nature effortlessly activates sensory responses, such as imagination and “soft fascination”. Soft fascination has been advocated as an enabler of attention restoration after prolonged periods of intense mental effort. In revisiting the components of restorative environments, Kaplan (1995) highlighted the sense of “being away” offered by idyllic natural settings that have the extent to accommodate richness of sensory stimuli and coherence. This theory established the connection between tranquility and naturalness.
Naturalness can be understood as the closeness to a natural state, which expresses the level at which a process occurs without artificial influence; a gradient ranking from absolutely natural to completely artificial (Fry et al., 2009; Machado, 2004). Frequently, naturalness is evaluated as the indicator of tranquillity by considering the degree to which a landscape is free from the presence of permanent structures (perceived naturalness) or biophysical disturbance (Machado, 2004; Rüdisser et al., 2012). In this context, tranquillity is the perceived grade of naturalness.
The first empirical efforts to distinguish between tranquillity and visual preference for naturalness revealed a positive correlation (Herzog and Barnes, 1999; Herzog and Bosley, 1992). However, it became clear that visual stimuli alone could not sufficiently explain the perception of tranquillity induced by natural environments. Pheasant et al. (2008, 2009a, 2009b) developed a linear regression model, called “Tranquillity Rating Prediction Tool” (TRAPT). TRAPT moved beyond the visual perception of naturalness to include the presence of historic and cultural artifacts as a component that further enhances the perception of tranquillity. Most significantly, TRAPT included man-made noise during daytime as a variable that directly disturbs tranquillity.
Noise disturbance was adopted as one of the main indicators for the production of the first tranquility maps in the UK. Tranquil areas were defined as “places sufficiently far away from visual and noise intrusion or development of traffic to be considered unspoilt from urban influences” (Land Use Consultants 2007). Therefore, mapping was based on a set of exclusion criteria, such as distance zones from roads, towns, airports, power stations, etc. (Bell, 1999; Land Use Consultants 2007). Those tranquillity maps were later criticized as being solely dependent on the negative features that spoil tranquility and were revised to include criteria that enable tranquillity (Land Use Consultants 2007; Jackson et al., 2008).
Revised concepts of tranquillity consider audition in a more holistic context by considering the components that construct the “soundscape” (Schafer, 1977, cited in Aletta et al., 2016). Soundscape is focused on the way noise is perceived and therefore, it does not exclusively focus on noise as a disturbing factor. Instead, it also considers the “pleasantness of sound” (Aletta et al., 2016; Botteldooren et al., 2011; De Coensel and Botteldooren, 2006; García et al., 2013; Payne, 2013). Pheasant et al. (2010) and Watts and Pheasant (2015) proved that sound considered pleasant, such as biological sounds and sounds of weather, significantly enhance the perception of tranquillity. However, at the presence of combined audio-visual stimuli, the construction of tranquillity occurs with a more complex pattern. This pattern highlights the intricate ways in which visual landscape interacts with auditory soundscape to construct the perception of tranquillity and calls for more integrated understandings of the concept (Pheasant et al., 2010; Watts and Pheasant, 2015).
This call has been addressed by studies that focus on understanding the subjectivity of tranquillity. Such studies apply mixed methods, where mapping usually follows a qualitative phase seeking to elicit a bottom-up narrative of tranquillity perception (Hewlett et al., 2017; Jackson et al., 2008). Findings consent with previous studies on the parameters that disturb tranquillity, such as noise, visual disturbance from artificial landscapes, the presence of people, etc. They also agree that naturalness, natural sounds and the absence of people significantly enhance tranquillity. Furthermore, the findings revealed a new concept that has not been addressed in earlier studies; the “dark night sky”.
The dark night sky is systematically being mentioned by participants as a quality that positively contributes to the perception of tranquillity (Hewlett et al., 2017; Jackson et al., 2008). Yet, this quality is severely hindered by the artificial brightening of the night sky, alternatively known as “light pollution”. Falchi et al. (2016) suggest that light pollution represents a profound environmental alteration that affects even landscapes that otherwise seem untouched by humans during daytime. This disturbance hinders a unique human experience; the opportunity to view the night sky and the Milky Way (Falchi et al., 2016). The dark night sky as a resource worth preserving is gradually gaining international attention through the designation of dark night sky reserves and parks accompanied by “lightscape management” policies developed in a bottom-up way with the communities involved. The dark night sky reserves develop the potential for a new a new type of green tourism, named “astrotourism” (IDA, 2017).
Although Jackson et al. (2008) included light pollution as an indicator of tranquillity, they did so by using nationally available data that statistically estimate the skyglow above urban areas. In a similar vein, Hewlett et al. (2017) mapped light pollution using locally available street light data. We consider the method proposed by Chalkias et al. (2006) for mapping light pollution using night lights satellite imagery to be more suitable for wide geographic coverage. The novelty of our approach is that we propose a method for tranquillity mapping that combines both noise and light pollution. To our knowledge, there is only one study so far that has developed a combined indicator for mapping noise and light pollution (Votsi et al., 2017).
Barriers and enablers of tranquillity used in previous studies.
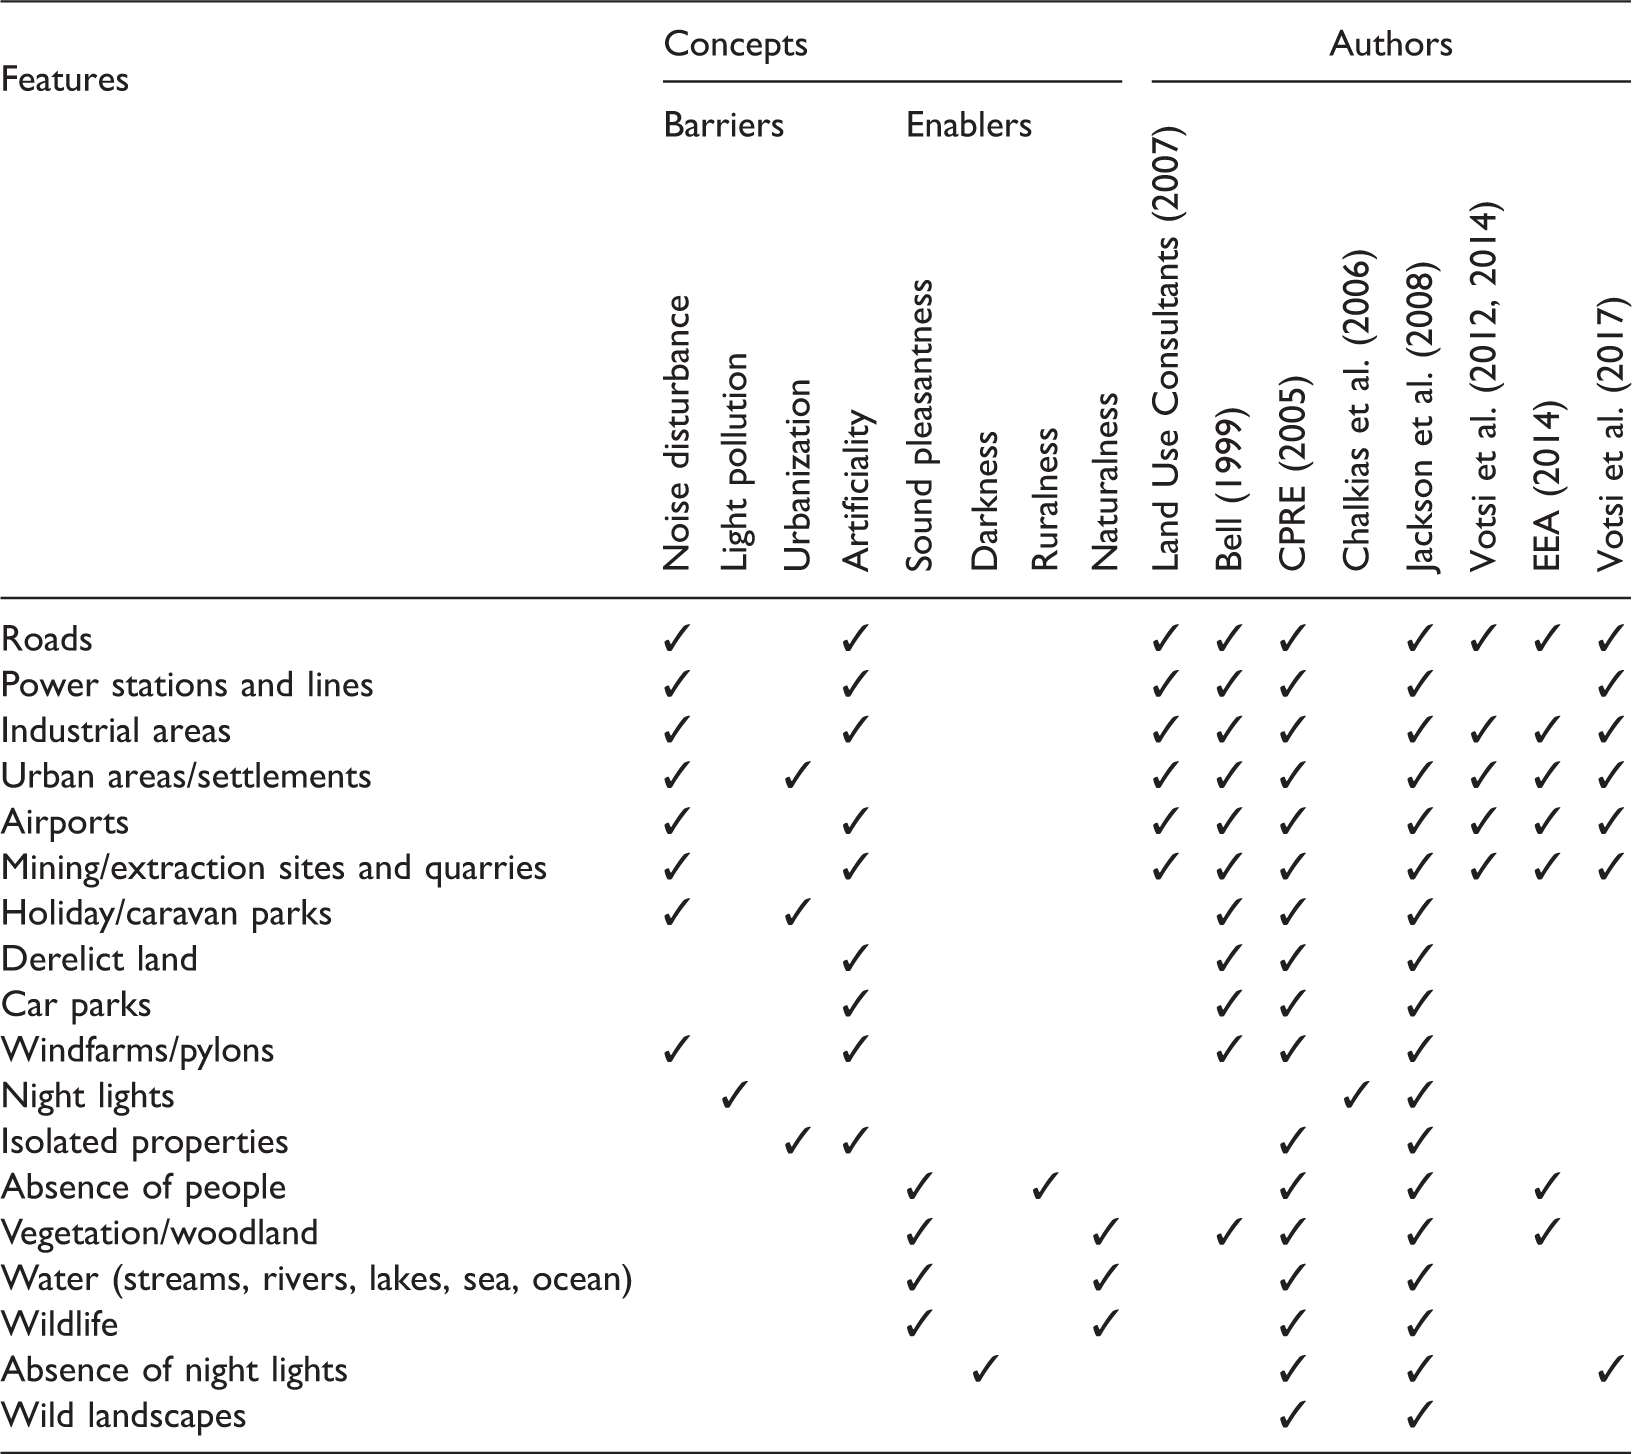
The rest of the article is structured as follows. The next section describes the data and the study area. Next, we present the method followed for the mapping of the proposed indicators. Then, the results are presented in maps followed by a validation method to estimate the Kappa coefficient and the overall accuracy. Finally, discussion is presented connecting to a wider policy framework where this model can potentially be used.
Data and study area
Data
Public domain datasets available at the global, European and national levels were selected (Table 2). The raw data were pre-processed to obtain a common projection system (the Greek national grid – EPSG2100) and common spatial boundaries. All data were resampled to obtain a pixel size of 100 × 100 m. The basic datasets used are:
(i) The CORINE Landcover (CLC). A well-known land use and land cover dataset, produced by the EEA, using common standards throughout the EU member states and associated countries. The basic method used to produce the final maps is photo-interpretation of satellite data. The data are available in raster format at a resolution of either 100 m or 250 m. The CORINE classification system is hierarchical, consisting of three levels of detail. The finest level consists of 44 thematic categories. We used the CLC 2000 at 100 m resolution which was the most recent data available for Greece at that time. The CLC 2000 derives from Landsat-7 ETM single date satellite data with geometric accuracy of less than 25 m and minimum mapping unit at 25 ha (Copernicus, 2017a). (ii) The European Settlement Map (ESM). A spatial raster dataset mapping human settlements in Europe based on satellite imagery. It has been produced with the Global Human Settlement Layer (GHSL) technology by the European Commission, Joint Research Centre. It represents the percentage of built-up per spatial unit and is available at resolutions of 10 m and 100 m. We used the ESM 2016 (a.k.a EUGHSL2016) at 100 m resolution which is produced by automatic information extraction processes using SPOT-5 and SPOT-6 satellite images 2.5 m pixel size (Copernicus, 2017b). (iii) Night lights were obtained from the VIIRS (Visible Infrared Imaging Radiometer Suite) sensor, onboard the Suomi NPP satellite. Launched in 2011, its objective was to substitute the DMSP satellite series, which constituted the basic data source for night lights since the ‘70s and were discontinued at 2013. Compared to DMSP/OLS, VIIRS provides higher spatial resolution (742 m instead of 2.7 km) and a substantially better radiometric resolution (14 bit instead of 6 bit) that overcomes the signal saturation problem, typically observed over urban cores in OLS data (Stathakis and Baltas, 2017). We used the monthly cloud-free mosaic of October 2015 (NOAA, 2015). (iv) The digital elevation model was obtained from the NASA Shuttle Radar Topography Mission (SRTM) at 90 m original spatial resolution which was resampled at 100 m. The caveat of the original dataset produced by NASA is that it contains voids in areas covered by water bodies or snow due to inherent characteristics of the satellite. For this reason, we used the rectified version (Version 4) provided by the CGIAR-Consortium for Spatial Information (CGIAR-CSI) which applies void-filling methods to enhance the original dataset (CGIAR-CSI, 2017). An overview of the datasets.
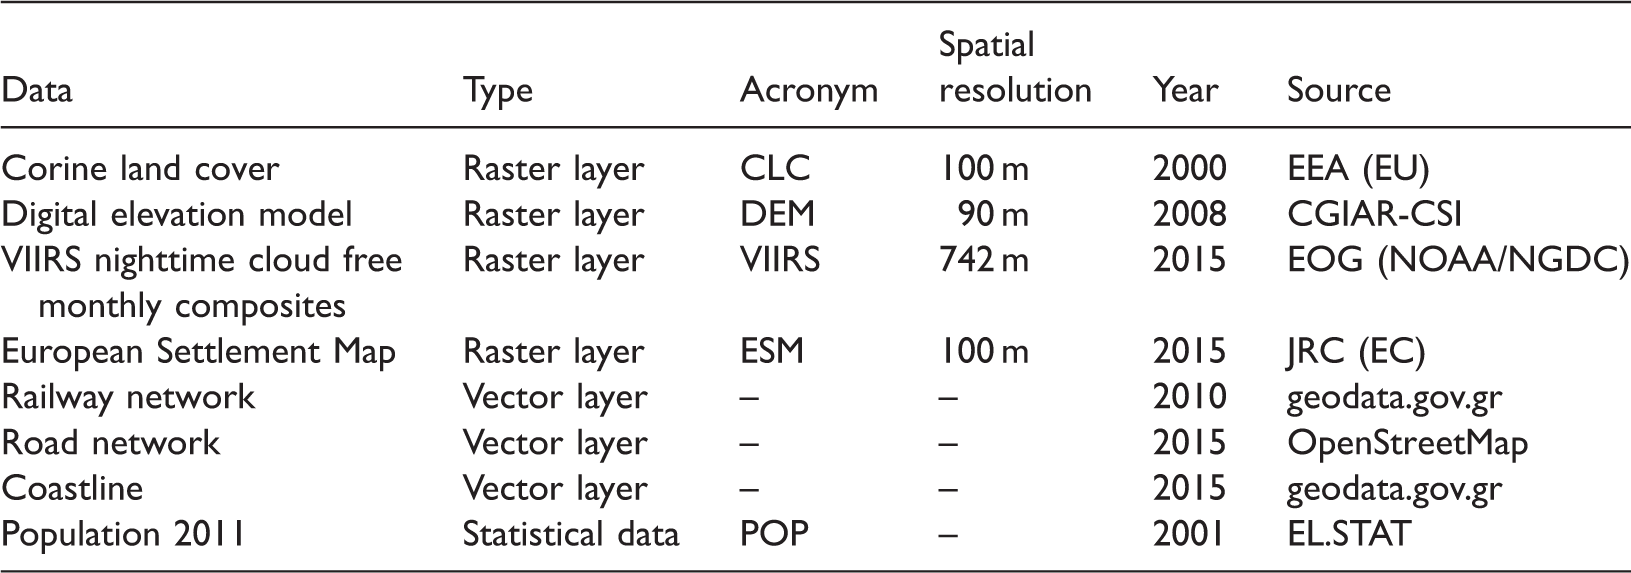
The different source, dates and pre-processing stages of the data pose limitations and biases that have to be kept in mind during the interpretation of the results. A basic concern arises from the scale of the night-light satellite images (742 m) which does not comply with the selected scale of the analysis. In addition, the complexity and high fragmentation of the Greek space results in some categories of land cover not being reliably represented (Tsilimigkas and Kizos, 2014).
Study area
The case study to test the method is a buffer zone around the biggest Greek highway, known as Egnatia, which started operating in 2009, in northern Greece. As shown in Figure 1, this zone covers 21,232 km2 and extends from the city of Igoumenitsa (on the west coast) till Thessaloniki (to the east). Its width is approximately 30 km around the highway. At some parts it extends a bit more than 30 km to include larger geographical units. To define the width of the zone we based on empirical evidence regarding the visual impacts of wind turbines proposed by Bishop (2002), since there is no threshold established for highways. The zone has a total resident population of approximately 1.8 million people (ELSTAT, 2011).
Case study area.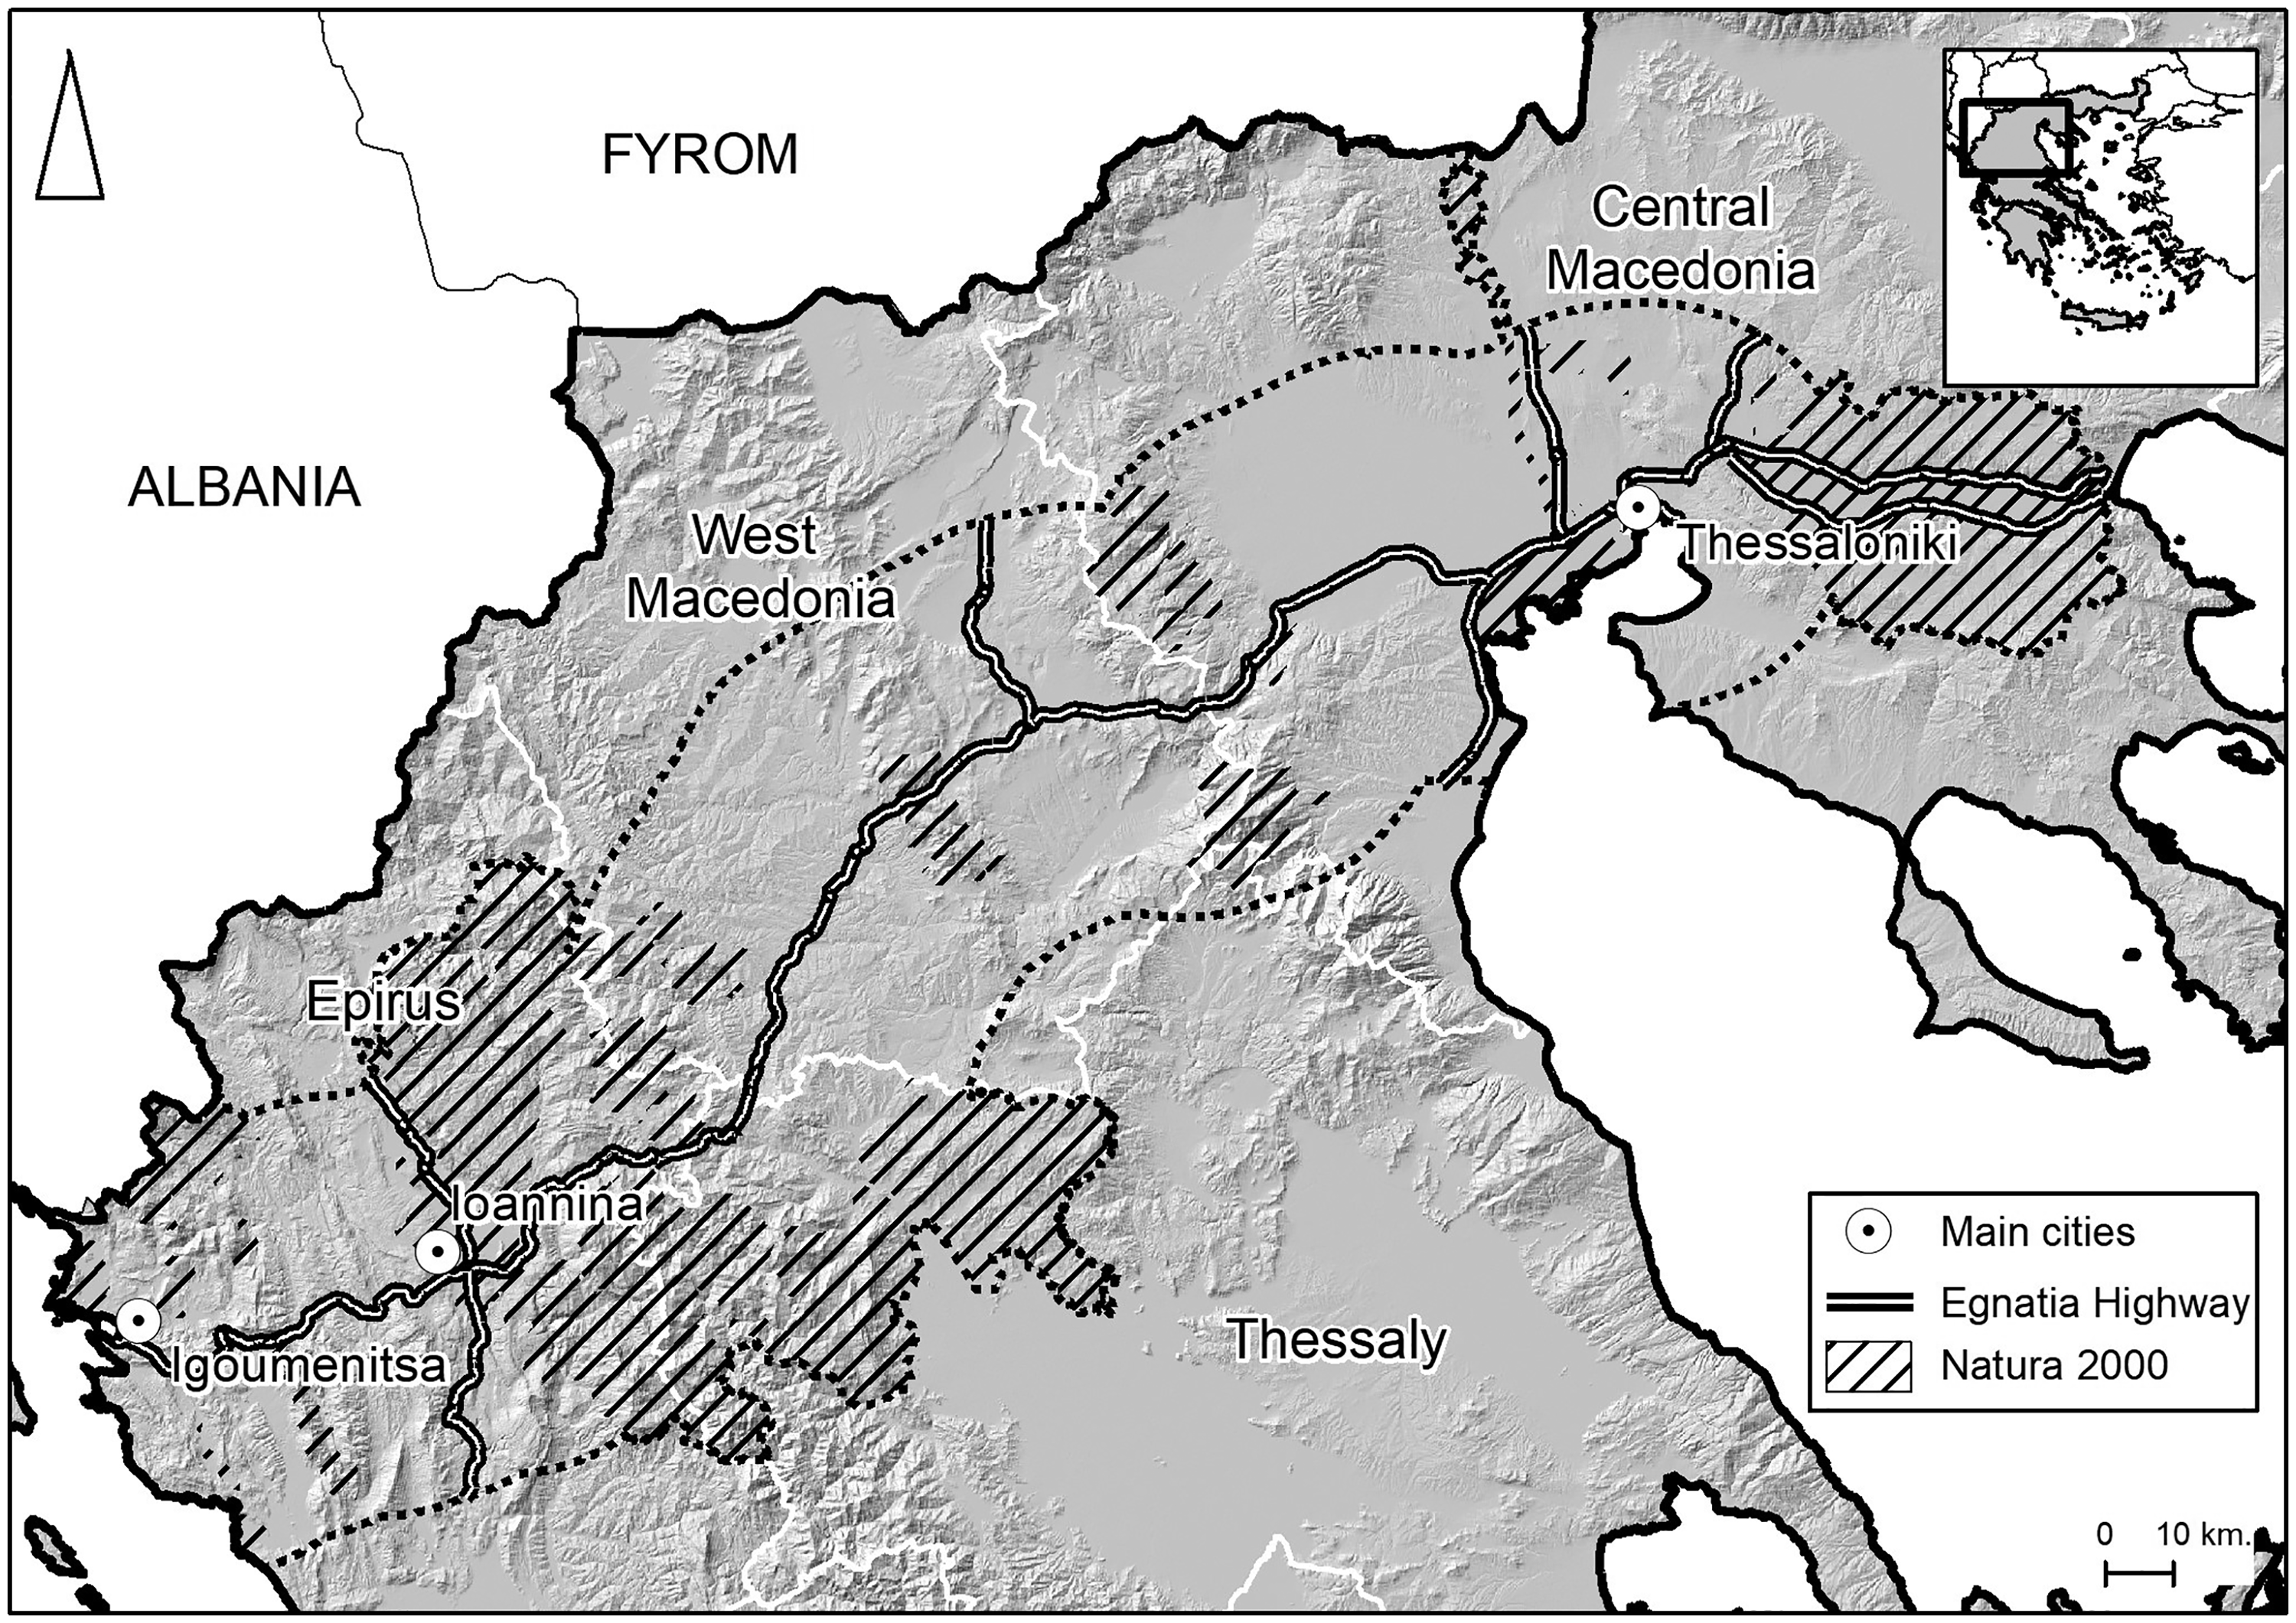
The west part of this zone belongs to the regions of Epirus, West Macedonia and Thessaly. It is mainly mountainous with particular geomorphology and high environmental value. A number of designated protection zones are clustered there. This area used to be the most isolated and underdeveloped part of Greece for many years. This spatial isolation along with the harsh climatic conditions did not promote the development of significant urban centers apart from the city of Ioannina (OGG, 2008; Tsilimigkas et al., 2015).
On the contrary, the east part presents a totally different growth profile since Thessaloniki, the second biggest city of Greece, is located there. The strategic location of this region acting as gate to the Balkans, along with the metropolitan role of Thessaloniki and the surrounding big flat agricultural land, makes it one of the most developed areas in the whole country (OGG, 2008). The interest in this case study occurs from this west-east dualism which has created a variety of landscape typologies.
Big infrastructure and especially highways are difficult to integrate to the landscape. They usually impose their presence and create new landscapes (Hadjibiros and Argyropoulos, 2011). In this context, the selection of this case study aims at mapping tranquillity in this area which underwent significant changes over the last years.
Methods
Proposed indicators
Indicators and criteria for mapping tranquillity. Hypotheses shown in introduction.

As artificial noise sources we identified the road and railway networks, the industrial and mining sites (CLC codes 121 and 131), the airports (CLC code 124) and the urban areas/settlements (CLC codes 111, 112 and 142). We then decided the distance thresholds (Di) from each noise source beyond which the noise impact theoretically ceases to exist. We used empirical evidence from other studies to set these thresholds (EEA, 2014; Votsi et al., 2012). Finally, we estimated the indicators 1–6 by creating the Euclidean distance layers and reclassifying them to a binary scale 0–1, as follows:

As regards the light pollution, we defined a binary indicator: the direct visibility to night lights or the absence of it, which enables the viewing of the stars (indicator 7). This indicator is estimated through viewshed analysis. A typical viewshed map requires entities that act as “targets” and entities that act as “observers”. Here, we define as “observers” the night lights and as “targets” the rest of the study area (Figure 2(a)). This reversion of “targets” and “observers” allows the results to be presented in a continuous grid (Figure 2(b)). Night lights from VIIRS were converted to a binary raster (lights/no-lights) after testing several threshold values.
(a) Night lights used as “observers”; (b) viewshed analysis output (areas with no light pollution depicted in black).
The original viewshed output is an integer raster with each pixel holding the count of visible lit pixels from it. This raster is then converted to a raster holding values in [0,1] using fuzzy membership classification. The value of zero corresponds to a location that has no visible lit pixels. The value of one corresponds to pixels that are themselves lit. Intermediate values (0,1) show locations from which a certain number of lit pixels is visible.
Ruralness is highly associated with the population density. However, the limitations posed by the aggregate spatial units at which population data are gathered, have been well described in the literature (Gallego, 2010; Kim and Yao, 2010; Tobler, 1979). Therefore, we used census data at the lowest administrative level (LAU 1) to apply a technique of dasymetric mapping (Eicher and Brewer, 2001; Gallego, 2010; Mennis and Hultgren, 2006). This way we obtained an estimate of population density at a finer resolution (100 m). The estimate is based on the assumption that the population is evenly distributed among all the eligible locations. This assumption is usually criticized as oversimplified (Gallego, 2010; Kim and Yao, 2010). However, it substantially increases the accuracy of the population estimate. The following basic formula used in many dasymetric mapping applications was selected here due to its simple content and calculation:
Thessaloniki and the surrounding area (a) population density in LAU 1 level; (b) ESM layer used as weighting factor; (c) disaggregated population density and (d) final degree of ruralness.

We used the typology proposed by Dijkstra and Poelman (2014) to transform the disaggregated density layer into the degree of ruralness (indicator 8) as follows:
(i) Urban: a cluster of contiguous grid cells with a density of 1500 inhabitants per km2 and a minimum population of 50,000 high density clusters. (ii) Intermediate: a cluster of contiguous grid cells with a density of 300 inhabitants per km2 and a minimum population of 5000. (iii) Rural: rural grid cells (grid cells outside urban and high density clusters).
Subsequently, we reclassified those categories into a discrete numerical scale, where 0, is allocated to urban areas, 0.5 is allocated to intermediate areas and 1 is allocated to rural areas (EEA, 2014).
Perceived naturalness is associated with the natural character of land covers (indicator 9). We used a categorical scale from 1 to 7, which measures the degree of artificiality of land, after human activities have altered the potential natural condition (EEA, 2014). For example, value 1 is allocated to the most natural land covers (water bodies and wetlands), while value 7 is allocated to the artificial surfaces (urban fabric, industrial, commercial and transport units, etc.) This categorical scale is then reclassified to a continuous 0–1 scale through linear stretching.
Finally, to balance the fact that the noise criterion is focused on exclusion zones, we develop the indicators 10–12 which contribute to the enhancement of tranquillity. We consider dense forests and water bodies as land covers with an additional ability to enhance the perception of tranquillity. To obtain the areas of interest, we used the CLC categories for dense forests (codes 311, 312, 313) and lakes (code 512). Rivers and the coastline were obtained from nationally available public domain data, while the alpine zones were obtained from the DEM model with the assumption that they are more likely to be found in areas with an elevation higher than 1700 m. Finally, we estimated the indicators 10–12 by creating the Euclidean distance layers and reclassifying them to a binary scale 0–1, as shown in equation (3):

Criteria synthesis
We multiplied the final reclassified indicators in order to yield composite criteria, as shown in equation (4). The grouping of indicators is empirical and we acknowledge that there are a number of options that could have been applied instead.

Subsequently, we combined the final tranquillity maps according to the equation (5).

The final layers underwent a generalization process to remove the “salt and pepper noise”. The final scenarios were then modified into a three-class categorical scale (low-moderate-high) that is more comprehensive than a numerical scale for tranquillity.
Validation
To create the ground reference data needed for the validation, a methodology proposed by Nowak and Greenfield (2010) was implemented. A sample was created by a selection of 200 random locations within the case study. Those locations were converted into the appropriate format to be inserted in Google Earth™. Subsequently, they were used to harvest the photos from Panoramio™ within a distance of 100 m; a distance equal to the pixel size of our analysis. In case no photo was available within this distance, another location was selected randomly. In case there was more than one photos available for a location, only one photo was selected based on its ability to reflect the typology of the landscape of the surrounding area (i.e. mountainous, agricultural, urban, coastal, industrial, etc.). Photos with obvious filter enhancement or other digital processing were excluded. Pure skyscapes, pure seascapes, photos focusing exclusively on objects (i.e. flowers, animals, individual buildings, etc.) or wrongly geocoded photos were also excluded. In case none of the available photos for a location was eligible based on these criteria, another location was selected randomly. The final sample of 200 photos was divided in four equal subsamples of 50 photos each.
Four participants (two males and two females) non-specialized in photo-interpretation were asked to participate in a structured interview. Participants were aged between 23 and 28 years old, affiliated with the University of Thessaly and the Harokopio University of Athens. They were recruited by the researcher via e-mail or personal phone call. Informed consent was given verbally.
The interviews took place in the premises of Harokopio University of Athens during January 2016. The participants were asked to assess each subsample of photos, with each photo being assessed by one participant. More specifically, they were asked to classify the photos in three categories (low – moderate – high) following the question “to what extent does the landscape depicted in the photo feel calm and peaceful; a landscape you would choose if you wanted to escape from your everyday routine”. Each session lasted between 1 h 30 min to 2 h, during which the researcher recorded the unique identifier of each photo against the participant's classification. Meantime, written notes were taken to record additional observations. A sample of the photos used during the interview is seen in Figure 4.
Typical landscapes of (a) low; (b) moderate and (c) high tranquillity.
The final results were validated with the calculation of Kappa coefficient (κ) and the overall accuracy (Acc). The overall accuracy is the percentage of correctly classified cases between two raters assigning cases to a set of k categories, divided by the total number of cases. The Kappa coefficient is the proportion of agreement corrected for chance between two raters assigning cases to a set of k categories (Cohen, 1960), calculated according to the equation (6):


Results
The results highlight the dualism between the east and west part of the study area and provide plausible spatial patterns of tranquillity (Figure 5(d)). The most extended high tranquillity zone is identified at the mountain range of the west part of the study area, shared between the regions of Epirus, West Macedonia and Thessaly. However, within this seemingly tranquil zone clusters of moderate and low tranquillity can be noticed close to the highway. This is a combined result of noise (Figure 5(a)), visibility to the lights of the highway (Figure 5(b)) and the perception of low naturalness around such infrastructure (Figure 5(c)). On the other hand, four distinct zones of low tranquillity can be noticed: (a) at the east plain in which the city of Ioannina is located; (b) at the central part, where there is an extensive area of quarries; (c) at the west plain where Thessaloniki is located and (d) along the highway and the main transport infrastructure of the area.
Criteria and synthesis (a) noise; (b) visual-aesthetic; (c) perceptual; and (d) tranquility.
The rest of the study area demonstrates a mosaic of tranquillity patterns. This is most prominent in the coastal zone of the east part which combines areas of high and low tranquillity at a very close proximity. While coastal areas are privileged for being close to the sea, the excessive development and the overconcentration of people seems to occur at the expense of tranquillity.
Approximately, 45% of the area (9274 km2) is classified as highly tranquil, whereas 26% (5364 km2) falls in the low tranquillity category. An overlay of the tranquillity categories with the CLC indicates that 89% of the wetlands are classified into low tranquillity zones, whereas forests and water bodies are the two land covers which define the high tranquillity zones (Figure 6).
Degree of tranquillity per land cover.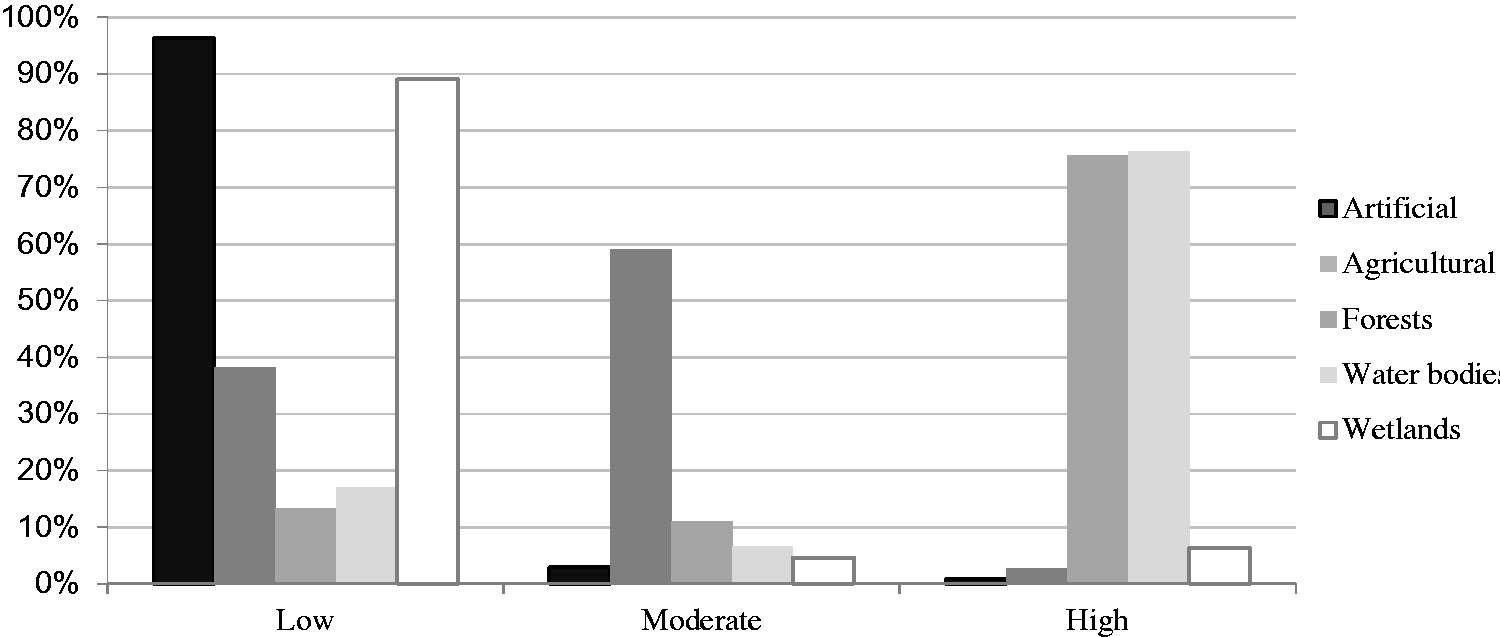
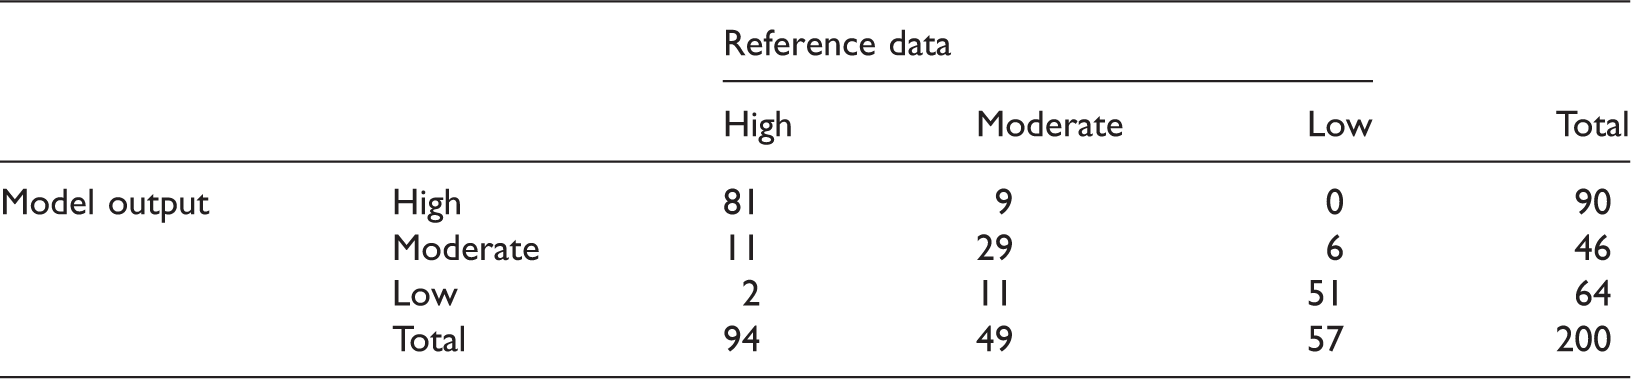
The classification schema developed in this study seems to capture the major spatial typologies of the study area. This is verified by the Kappa coefficient (κ = 0.70) along with 80% overall accuracy (Table 5).
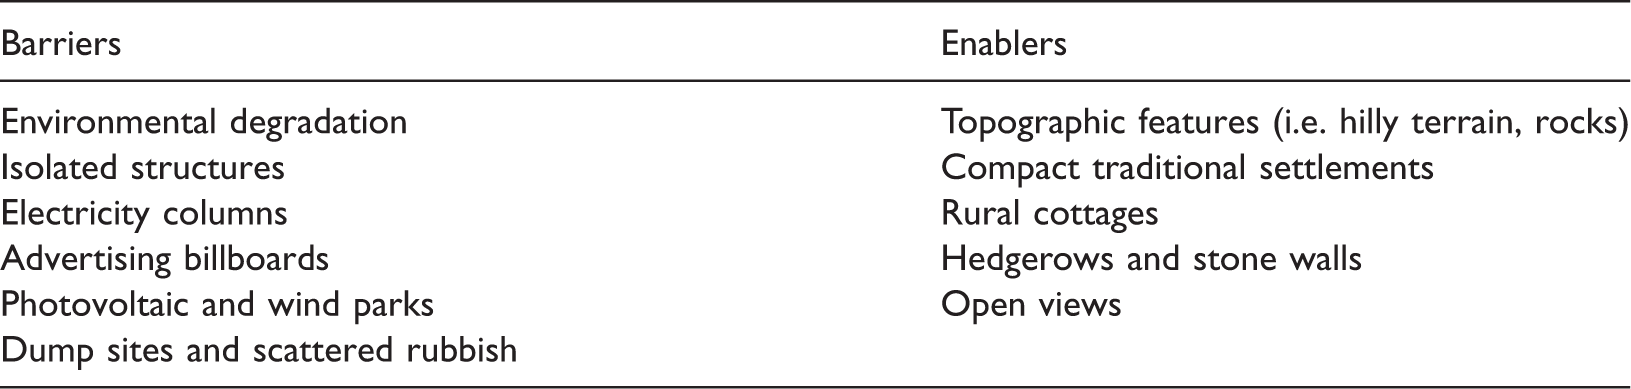
Barriers and enablers of tranquillity recognized by the participants during the interview.
Confusion matrix used to calculate the Kappa coefficient and the accuracy.
It is hypothesized that at the presence of auditory stimuli, the participant's perceptions of tranquillity would possibly change, as proposed by Pheasant et al. (2010) and Watts and Pheasant (2015). This is another caveat of using visual data from Google Earth™ for the validation. Therefore, we acknowledge that this validation protocol needs to be further considered in order to include auditory data input before significance of the validation can be claimed.
Conclusions
The past decades have witnessed a growing interest in recognizing tranquil spaces that directly or indirectly contribute to the restoration of human health and well-being. At a policy level, this interest is most prominently reflected in Europe through two instruments: the European Landscape Convention (Council of Europe, 2000) and the European Noise Directive (2002/49/EC). The Convention's definition of landscape as “an area as perceived by people, whose character is the result of the action and interaction of natural and/or human factors” stands for a more holistic interpretation of tranquillity than the concept of “quietness” emerging from the END. Nevertheless, the Convention's non-binding character has failed to produce significant impacts on the operational levels of planning in many countries (Plieninger et al., 2015). For example, in the Greek spatial planning system, issues concerning landscape have only been incorporated in a fragmentary manner at the regional level. Therefore, methods that could assist in the creation of a national or regional landscape assessment typology are important (Tsilimigkas et al., 2017).
On the other side, END has produced a framework for classifying the quiet areas of Europe (EEA, 2014) led by a narrow interpretation of tranquillity based on sounds. These fragmentary interpretations of tranquillity in the European policies have discouraged the development of an integrated methodology to incorporate landscape, soundscape and “lightscape” that were identified as important components of tranquillity in the scientific literature review. This is the gap we addressed in this paper. Building on the EEA guidelines for mapping quiet areas in Europe (EEA, 2014), we expanded the framework to further consider perceptual aspects of the landscape along with nighttime qualities of tranquil space, such as darkness. In doing so, we developed a method that is cost-effective for three reasons: (a) due to the relatively simple calculation of the indicators; (b) the indicators' ability to define macroscale zones and (c) the availability of open domain European datasets (i.e. no cost) to enable comparisons and the monitoring of future changes.
The results are rational and reveal that the most tranquil areas are the mountains, where years of isolation managed to maintain low urbanization processes, high degree of unspoilt nature, quietness and the dark night sky. This typology demonstrates spatial patterns in the Greek landscape that have been well explained by Kizos and Vlahos (2013), Tsilimigkas and Kizos (2014), Tsilimigkas et al. (2016), and Tsilimigkas et al. (2018). The Egnatia highway has definitely lowered the perceived tranquility of many areas. Clusters of intrusion along the highway are evident in the results. Therefore, the method can prove useful in setting and monitoring policy objectives.
Furthermore, the criteria used to assess tranquillity are closely related to landscape. We propose that the zones identified here could help the identification of landscape zones. Landscape zones are recognized and delineated based on the distinctive character of an area considering a set of natural and anthropogenic variables. In the Greek Planning Framework, each of these zones includes a further classification into: (i) landscapes of international value; (ii) landscapes of national value; (iii) landscapes of regional value and (iv) degraded landscapes (MEECC, 2010). In this context, zones of high tranquillity can be linked to landscapes of international or national value. Similarly, areas of low tranquillity could indicate zones of degraded landscapes. At the national scale this framework could be formed as a strategy to set the long-term objectives and actions with regards to tranquil spaces.
The proposed method is applicable in regional and national scale. In order to develop this concept in local level one has to reduce the cell size (<100 m) of the datasets, use auditorial material in combination with visual for the validation, and apply analytical approaches proper for tranquillity assessment at local level (Pheasant et al., 2008, 2009a, 2009b).
Understanding the complex patterns through which tranquillity is constructed is not only a matter of objectivity based on sensory perceptions. It is also a subjective construct based on the socio-cultural background of people. Capturing this latter aspect of tranquillity is challenging, yet crucial for a democratic and inclusive approach to tranquillity. Especially, since policies demand the designation of tranquil spaces for which specific measures are to be taken, inclusivity and the representation of the subjective values of a wide range of stakeholders must be seriously considered (Hewlett et al., 2017; Jackson et al., 2008). Synergies and knowledge exchange between the objective and subjective studies of tranquillity at the local level will be able to further inform spatial analysis frameworks, such as the one proposed here.
As part of future work we will consider complementing the visual criterion with more indicators, such as visibility to wind turbines and other energy infrastructure. Another enhancement of the same criterion would be to weight the visibility of night lights with the distance from which the lights are observed. Finally, we will use the most recent datasets that have become available in the meantime and track changes in the spatial patterns of tranquillity. Ideally, we would like to apply the method for the whole country and conduct comparisons among different regions or even different countries.
Footnotes
Declaration of conflicting interests
The author(s) declared no potential conflicts of interest with respect to the research, authorship, and/or publication of this article.
Funding
The author(s) received no financial support for the research, authorship, and/or publication of this article.
 .
.
.