
Abstract
Both pre-disaster approaches, e.g., mitigation and preparedness, and post-disaster approaches, e.g., response and recovery, play important roles to mitigate the damage from large-scale disasters. From the viewpoint of disaster response, there have been studies on evacuation guiding schemes and applications using evacuees’ mobile devices, e.g., smart phones. On the other hand, disaster preparedness has also been studied mainly on geographical information analysis, e.g., road blockage probability and people flow data. The road blockage probability is the probability that the corresponding road is blocked due to collapse of roadside buildings when an earthquake occurs. The people flow data express the people flow in usual time. In this paper, with the help of evacuation guiding schemes, road blockage probability, and people flow data, we propose a road network risk analysis approach that considers people flow in both ordinary and evacuation situations, which can be used to as a tool to strengthen the urban fabric for fostering better evacuees’ responses in disaster situations. First, the proposed approach derives ordinary road demand, which is the degree of road usage at a certain interval in an ordinary situation, from the people flow data. Then, it calculates evacuation road demand, i.e., the degree of road usage at a certain interval in an evacuation situation, by extending the edge betweenness centrality under the assumption that people located according to the ordinary road demand move to refuges along their evacuation paths. Finally, it detects roads with high risk of encountering blocked road segments by combining the road blockage probability and evacuation road demand. Through numerical experiments under a case study of Arako area of Nagoya city in Japan, we show the proposed approach can detect such high-risk roads. Furthermore, we show the detected roads spatially change according to the people flow in ordinary situations, evacuation behavior, and disaster occurrence time.
Keywords
Introduction
In the 2011 Great East Japan Earthquake, public transportation systems, e.g., railway networks and road networks, suffered terrible damage, and thus, about 90% of disaster victims were forced to evacuate on foot or by car (Cabinet Office, Government of Japan, 2012). In addition, it has been reported that disaster victims could not smoothly collect and distribute important information, e.g., safety information, evacuation information, and government information, due to serious damage to communication infrastructures, e.g., cellular networks and wired backbone networks (Ministry of Internal Affairs and Communications, Japan, 2011). To mitigate such disaster damage, both pre-disaster approaches, e.g., mitigation and preparedness, and post-disaster approaches, e.g., response and recovery, are important (Carter, 2008).
From the viewpoint of disaster response, there have been studies on evacuation guiding schemes and applications using evacuees’ mobile devices, e.g., smartphones (Hara et al., 2018; Komatsu et al., 2018; SOZO Company Limited, 2014). In SOZO Company Limited (2014), an evacuation guiding application can present an evacuation route even in an offline environment by using map information and shelters’ location information stored in the application. Furthermore, it enables intuitive evacuation guiding by Augmented Reality using the smart phone’s camera. This application has already been introduced in multiple municipalities in Japan.
Komatsu et al. (2018) propose an automatic evacuation guiding scheme based on implicit interactions among evacuees and their mobile devices. This scheme can automatically estimate blocked road segments from the difference between evacuation route presented by mobile device and evacuee’s actual evacuation route (trajectory). Evacuees can improve their evacuation behavior by sharing such information among them through their mobile devices. Hara et al. (2018) extend this scheme by adding the route selection considering both speediness and safety of evacuation. The safety of evacuation route is evaluated by a risk map where each road has road blockage probability (City of Nagoya, 2015). The road blockage probability is the probability that the corresponding road is blocked due to the collapse of roadside buildings when an earthquake occurs. In Japan, some municipalities, e.g., Nagoya city, have been disclosing the risk map.
From the viewpoint of disaster preparedness, the safety of each road in the road network can be estimated in advance by using the above-mentioned risk map. In addition, the degree of road usage during the evacuation, i.e., evacuation road demand, can be analyzed based on the people flow yielded by evacuation guiding or behavior. This analysis can be realized by extending edge betweenness centrality (Girvan and Newman, 2002). Evacuation road demand also depends on the geographical distribution of initial locations of evacuees in an ordinary situation. In recent years, such geographical population distribution can be easily obtained through the collection of location information by proliferated mobile phones. In addition, person trip survey (Ministry of Land, Infrastructure, Transport and Tourism, Japan, 2007) and its extension of people flow data (Sekimoto et al., 2011) are available in certain urban areas of Japan.
In this paper, we propose a road network risk analysis approach that considers people flow in both ordinary and evacuation situations, by taking account of evacuation guiding schemes, road blockage probability, and people flow data. In particular, we focus on the risk of encountering blocked road segments, i.e., blocked-road encounter risk, because it is important to minimize the number of people who encounter the blocked road segment at evacuation from the viewpoint of safety of evacuation. The blocked-road encounter risk of a certain road can be evaluated by using road blockage probability and evacuation road demand.
Through numerical experiments under a case study of Arako area of Nagoya city in Japan, we show how such high-risk roads temporally and spatially change according to the people flow in ordinary situations, evacuation behavior, and disaster occurrence time. These information can be used to strengthen the urban fabric for fostering better evacuees’ responses in disaster situations. In addition, the approach can also be applied to other areas facing similar disaster risks.
The rest of this paper is organized as follows. The following section gives related work, and the subsequent sections show people flow under ordinary and evacuation situations. A further section describes the proposed approach of risk analysis, which is followed by the results of risk analysis. The final section provides conclusions and future work.
Related work
In this section, we introduce related work from the viewpoint of analysis of road network characteristics, road demand, and area risk.
Analysis of road network characteristics
To analyze the road network characteristics, we first need to represent the road network as a graph consisting of nodes (vertices) and edges. The graph representation is mainly divided into two approaches: primal approach (Porta et al., 2006b) and dual approach (Porta et al., 2006a). The primal approach straightforwardly turns intersections (resp. roads) into nodes (resp. edges), and the resulting graph is called a primal graph, which is suitable for the road network analysis based on geographical distance.
On the other hand, the dual approach generates a dual graph that regards roads (resp. intersections) as nodes (resp. edges). The dual approach originally comes from Space Syntax (Hillier and Hanson, 1984). It first constructs an axial map where consecutive roads are merged into a single straight line, called axial line, by considering their linearity. Next, it makes the dual graph where the axial lines are nodes and the intersections among the axial lines are edges. The dual graph can be regarded as a direct representation of a city plan and can significantly reduce the complexity of the original road network. Note that the path length between two nodes in the dual graph is evaluated by the number of edges (steps) in the path. In this paper, we focus on the speedy evacuation under disaster situations, and thus, the primal graph representation, which supports the geographical distance, will be applied.
There are diverse metrics to evaluate the characteristics of the primal/dual graphs, e.g., degree distribution, characteristic path length (Watts and Strogatz, 1998), clustering coefficient (Strogatz, 2001), and centrality. The degree distribution can reveal how the connectivity among nodes is biased. The characteristic path length is the average path length among all possible pairs of nodes in the graph. The clustering coefficient is the average number of triangle structures in the graph, where two nodes linked by an edge have a third node in common. In this paper, we focus on the roads with high evacuation road demand, which can be regarded as a kind of centrality. The centrality is a metric to evaluate the importance of single entities in networks, e.g., intersection (node) and road (edge), from the various aspects according to the purpose of analysis. This results in the different definitions of centrality, which can be basically categorized into four types (Porta et al., 2006b): being near others (degree centrality; Freeman, 1978), closeness centrality (Freeman, 1978), and integration (Hillier and Hanson, 1984), being between others (betweenness centrality; Freeman, 1977), being direct to the others (efficiency centrality (Latora and Marchior, 2001) and straightness centrality (Vragović et al., 2005)), and being critical for all the others (information centrality; Latora and Marchiori, 2007).
Analysis of road demand
The road demand can be estimated by the edge betweenness centrality. The betweenness centrality was originally proposed by Freeman (1977) and extended to the edge betweenness centrality by Girvan and Newman (2002). The betweenness centrality of a node (resp. edge) is defined as the frequency that the corresponding node (resp. edge) is included in the shortest paths between two arbitrary nodes in the network.
It has been pointed out that there is a strong relationship between betweenness centrality and bias of geographical population distribution (Fukuyama and Hato, 2012; Porta et al., 2006a, 2009; Wang et al., 2012). Fukuyama and Hato (2012) analyze how the moving area of pedestrians in Barcelona has been changing in each era and reveal Barcelona has been developing such that the central square can keep high betweenness centrality. Porta et al. (2006a, 2009) demonstrate that place with high betweenness centrality tends to concentrate in the densely populated area such as main road and commercial area. Wang et al. (2012) show that each road can be categorized into four types: (1) topologically important and diversely used, (2) topologically important and less diversely used, (3) not topologically important and diversely used, and (4) not topologically important and less diversely used, by taking account of betweenness centrality and actual usage of roads estimated from location information collected by mobile phones.
These existing studies indicate that people tend to gather around places with high betweenness centrality. In case of pedestrian route selection, there are possible route selection other than the shortest path selection, e.g., complexity reduction strategy and complexity maximizing strategy (Hill, 1982). In the complexity reduction strategy, the pedestrian is assumed to select a route with the smallest number of turns during the travel. This results in other type of centrality, called integration in Space Syntax, which is the total number of turns required for an edge to reach all other edges following the complexity reduction strategy (Hillier and Hanson, 1984).
In this paper, we focus on the evacuation in disaster situations, and thus, we estimate the evacuation road demand by the modified betweenness centrality based on all evacuees’ paths given by the automatic evacuation guiding system.
Analysis of area risk
There have been studies on analysis of area risk, which focus on vulnerability (Tate et al., 2010), connectivity (Bono and Gutiérrez, 2011), evacuation-difficult areas (Chen et al., 2012; Church and Cova, 2000), and important areas during evacuation (Jenelius and Mattsson, 2012; Kanno et al., 2017).
Tate et al. (2010) propose a method to evaluate the vulnerability of target area to disaster, e.g., earthquake and tornado. In particular, the vulnerability is evaluated in terms of zone of impact, occurrence frequency, social loss, fatality risk, and recovery ability. They reveal areas with high vulnerability in Charleston, SC. Bono and Gutiérrez (2011) focus on the connectivity of road network before and after a disaster, with the help of graph theory. They demonstrate the example results in case of the 2010 Haiti earthquake. Church and Cova (2000) propose a method to detect evacuation-difficult areas using Critical Cluster Model (CCM), which is one of the network partition models. The evacuation-difficulty of an area is expressed by the ratio of the population in the area and the capacity of the roads outgoing from the area. Chen et al. (2012) introduce a path selection scheme under the consideration that evacuees tend to move away from the disaster occurrence point and propose a method to display evacuation-difficult areas on the map using CCM.
Jenelius and Mattsson (2012) divide the target area into multiple sub-areas in a grid manner and evaluate the importance of sub-areas in terms of their betweenness centrality and the increase of traveling time among two arbitrary points under the condition that the corresponding area is unavailable (blocked). Kanno et al. (2017) identify temporarily populated areas by analyzing Twitter data with location information and evaluate the importance of roads by the betweenness centrality based on the shortest paths between such highly populated areas and refuges.
In this paper, we analyze the risk of road network from the viewpoint of the blocked-road encounter risk during the evacuation behavior.
People flow under ordinary situations
The people flow under ordinary situations, i.e., ordinary people flow, will affect the evacuation road demand because people on each road in the ordinary situations will start evacuating at the disaster occurrence. In this section, we define ordinary road demand as the degree of usage of a road under ordinary situations. In what follows, we introduce the people flow data and explain how to calculate the ordinary road demand from the people flow data.
People flow data
The people flow data are artificially generated from the person trip survey data. The person trip survey is a questionnaire-based survey about person trips, each of which is the movement of the corresponding person for a specific purpose, e.g., commuting and shopping. If a trip includes multiple transportation methods, e.g., walk and car, it is further divided into the corresponding sub-trips. In the person trip data, each sub-trip has the following information, e.g., person ID, locations of origin and destination, travel time, and transportation method. The people flow data compensate the trajectory between origin and destination of sub-trip by sequential positions at a certain interval, i.e., 1 minute. In the compensating process, the railway map and timetable are used in case of rail, and the shortest path selection is used in other cases. It has been pointed out that more than 90% of evacuees evacuated by walk, bicycles, motorcycles, and cars, in the 2011 Great East Japan Earthquake (Cabinet Office, Government of Japan, 2012). In this paper, we calculate the ordinary road demand using the people flow data related to these transportation methods on road networks.
An example of the people flow data and its explanation are given in online supplemental material.
Ordinary road demand
Let
In recent years, the location information of people can be easily obtained by proliferated mobile phones under consideration of privacy. In such situations, we can obtain more realistic ordinary road demand. On the other hand, there may be a situation where we can only obtain (the time series of) population information per area. In this case, we assume that each road has identical ordinary road demand
People flow under evacuation
The people flow under evacuation depends on several factors. First, the ordinary people flow will determine the initial locations of evacuees. Next, evacuation routes will determine which roads will be used during the evacuation. The evacuation routes depend on the existence of evacuation guiding and its route selection. If the evacuation guiding is not available, we assume that evacuees will follow the shortest path selection. The automatic evacuation guiding scheme in Komatsu et al. (2018) also applies the shortest path selection for speedy evacuation. As for both speedy and reliable evacuation, Hara et al. (2018) propose a risk-aware path selection scheme.
In what follows, we first introduce the automatic evacuation guiding scheme and the risk-aware path selection scheme. Then, we describe how to define evacuation road demand based on the ordinary people flow and path selection.
Automatic evacuation guiding scheme
Komatsu et al. (2018) propose the automatic evacuation guiding scheme based on implicit interactions among evacuees, their mobile devices, and cloud systems. In this scheme, a mobile device of each evacuee first presents an evacuation route, called recommended route, based on the map information, the nearest refuge’s location, and current location measured by Global Positioning System (GPS). In addition, the mobile device periodically records evacuee’s actual evacuation route, i.e., trajectory, using GPS. It is natural for each evacuee to change the route when he/she encounters with a blocked road segment. The mobile device can automatically estimate the blocked road segment from the difference between the recommended route and trajectory and calculates a new recommended route avoiding the blocked road segments. Furthermore, the mobile device shares the information of blocked road segments with others through direct wireless communication among them, e.g., Bluetooth (Bluetooth Special Interest Group, 2016) and Wi-Fi Direct (Wi-Fi Alliance P2P Technical Group, 2016), and/or through wireless communication with the cloud systems via remaining communication infrastructures. As a result, this automatic evacuation guiding scheme can improve evacuees’ evacuation behavior. Komatsu et al. (2018) adopt the shortest path selection scheme to achieve speedy evacuation.
Risk-aware path selection scheme
Hara et al. (2018) extend the automatic evacuation guiding scheme in “Automatic evacuation guiding scheme” section by adding the risk-aware path selection scheme that aims to reduce the possibility of encountering blocked road segments during evacuation. The risk-aware path selection scheme evaluates the safety of evacuation route by using a risk map where each road has road blockage probability (City of Nagoya, 2015). The road blockage probability is the probability that the corresponding road will be blocked due to a collapse of roadside buildings and/or road liquefaction, according to the degree of disaster. For example, Nagoya city in Japan provides the road blockage probability of each road in the area by taking account the potential risk of Nankai Trough Earthquake. The road blockage probability is calculated by using the structure of roadside building (wooden, non-wooden), building age, and height, width, and liquefaction-risk of the road. Figure S1 in the online supplemental material shows a sample of risk map in Arako area of Nagoya city, where a darker red line shows the road has a higher road blockage probability.
We define pe

Evacuation road demand
Given the path selection scheme, the evacuation road demand can be defined by extending edge betweenness centrality. Edge betweenness centrality C(e) of road

The evacuation road demand can be derived by modifying equation (2) as follows. At first, the destination of evacuation will be selected from the set of refuges,

An example of calculation of evacuation road demand is given in online supplemental material.
As mentioned in “Ordinary road demand” section,
Proposed approach
In this paper, we analyze the risk of encountering blocked road segments, i.e., blocked-road encounter risk, because it is important to minimize the number of people who encounter the blocked road segments during their evacuation. The road with high blocked-road encounter risk can be regarded as the road with high road blockage probability and high evacuation road demand. In particular, it is important to clarify roads with high blocked-road encounter risk even under the relatively speedy and safe evacuation based on automatic evacuation guiding with risk-aware path selection.
Note that equation (3) potentially gives higher evacuation road demand for roads near refuges (destinations), which mainly comes from the structure of road network. Suppose that evacuation is conducted based on the risk-aware path selection scheme,

Figure 1 illustrates the flow chart of calculating the above-mentioned ordinary road demand, evacuation road demand, and compensated evacuation road demand. With the appropriate combination of these information, we can conduct the following analysis.
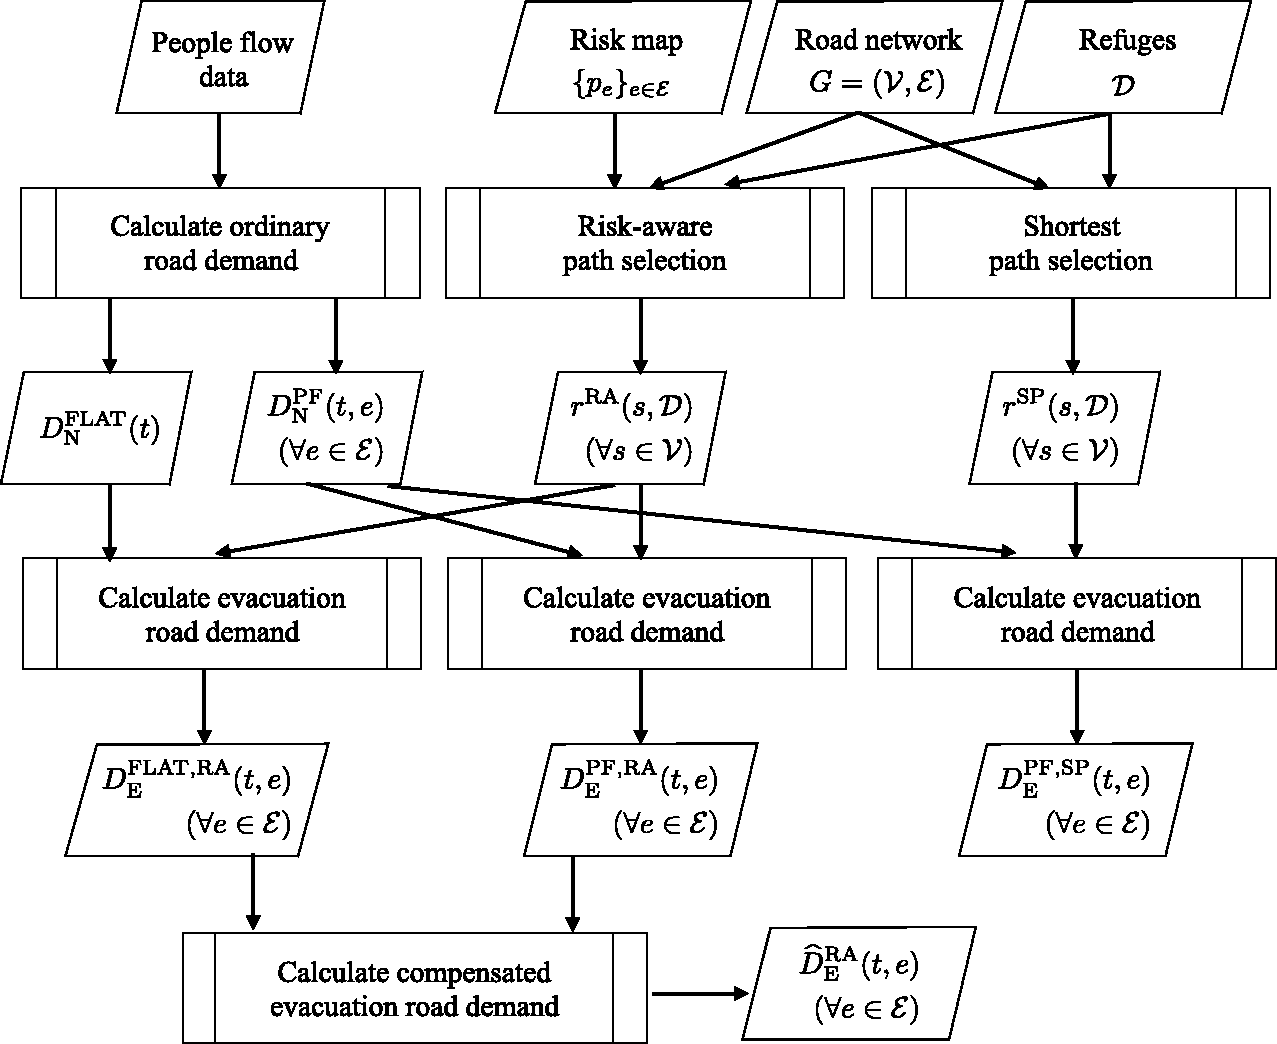
Flow chart of calculating ordinary road demand, evacuation road demand, and compensated evacuation road demand.
Analysis of blocked-road encounter risk based on
Analysis of importance of ordinary road demand based on
Analysis of impact of difference in evacuation behavior based on
Analysis of impact of difference in disaster occurrence time based on
Risk analysis results
Through numerical experiments, we evaluate the proposed approach in terms of the difference of ordinary road demand, evacuation behavior, and disaster occurrence time.
Evaluation model
We use the map of
We can obtain both people flow data and road blockage probability in the area. In Figure S1 in the online supplemental material, there are five black squares that are actual refuges in this area. Darkened (resp. lightened) roads mean that they have high (resp. low) road blockage probabilities.
We use the people flow data of 2011 Nagoya area, which includes the most recent data of the target area. In particular, we use the data of weekday, i.e., 3 October 2011, to conduct the analysis considering human life cycle, i.e., commuting period (8:00–8:59) and returning period (17:00–17:59). As mentioned in “People flow data” section, we only use the people flow data related to transportation methods on road networks, i.e., walk, bicycles, motorcycles, and cars.
In what follows, we use ordinary road demand based on people flow data in commuting period and risk-aware path selection scheme, unless otherwise specified.
Analysis based on people flow data and risk-aware path selection
At first, we reveal which roads will be high risk even under the risk-aware path selection scheme in case of commuting period. Figure S3 in the online supplemental material illustrates the relationship between evacuation road demand

Locations of roads with top 5% evacuation road demand (risk-aware path selection, ordinary road demand based on people flow data, and commuting period).
As we expected, we first observe that roads with high evacuation road demand concentrate in the proximity to refuges. This comes from the structure of evacuation road demand given by equation (3), where the destinations of paths are set to be the refuges. On the other hand, we also find out that there is a long sequence of roads reaching to the central refuge. This is caused by the fact that the surrounding roads have relatively high ordinary road demand. Next, we focus on the blue roads in Figure 2. As mentioned in “Risk-aware path selection scheme” section, the risk-aware path selection scheme selects the path avoiding roads with high road blockage probabilities as much as possible. Therefore, this indicates that these blue roads have high blocked-road encounter risk but it is difficult to avoid them even under the risk-aware path selection scheme. This is because these roads exist in the area where roads with high road blockage probabilities, i.e., roads with dark red, are densely located. In addition, there also exist roads with high ordinary road demand in this area.
Importance of ordinary road demand
Next, we investigate the importance of considering the ordinary road demand by comparing the evacuation road demands of two cases: (C1) ordinary road demand based on people flow

Locations of roads with top 5% evacuation road demand (risk-aware path selection, identical ordinary road demand, and commuting period).
The total number of roads with top 5% evacuation road demand is 76. We first observe that about 72% of them are green roads, which can be extracted without taking account of realistic ordinary road demand. On the other hand, we also find that 21 yellow roads are overestimated their potential increase of evacuation road demand, due to lack of consideration of realistic ordinary road demand. With the help of proposed approach, we can newly discover 21 blue roads with high evacuation road demand under the consideration of realistic ordinary road demand.
Next, we focus on blocked-road encounter risk mainly caused by the geographical population distribution at the beginning of evacuation. As mentioned in “Proposed approach” section, this risk can be quantitatively evaluated by compensated evacuation road demand, i.e.,
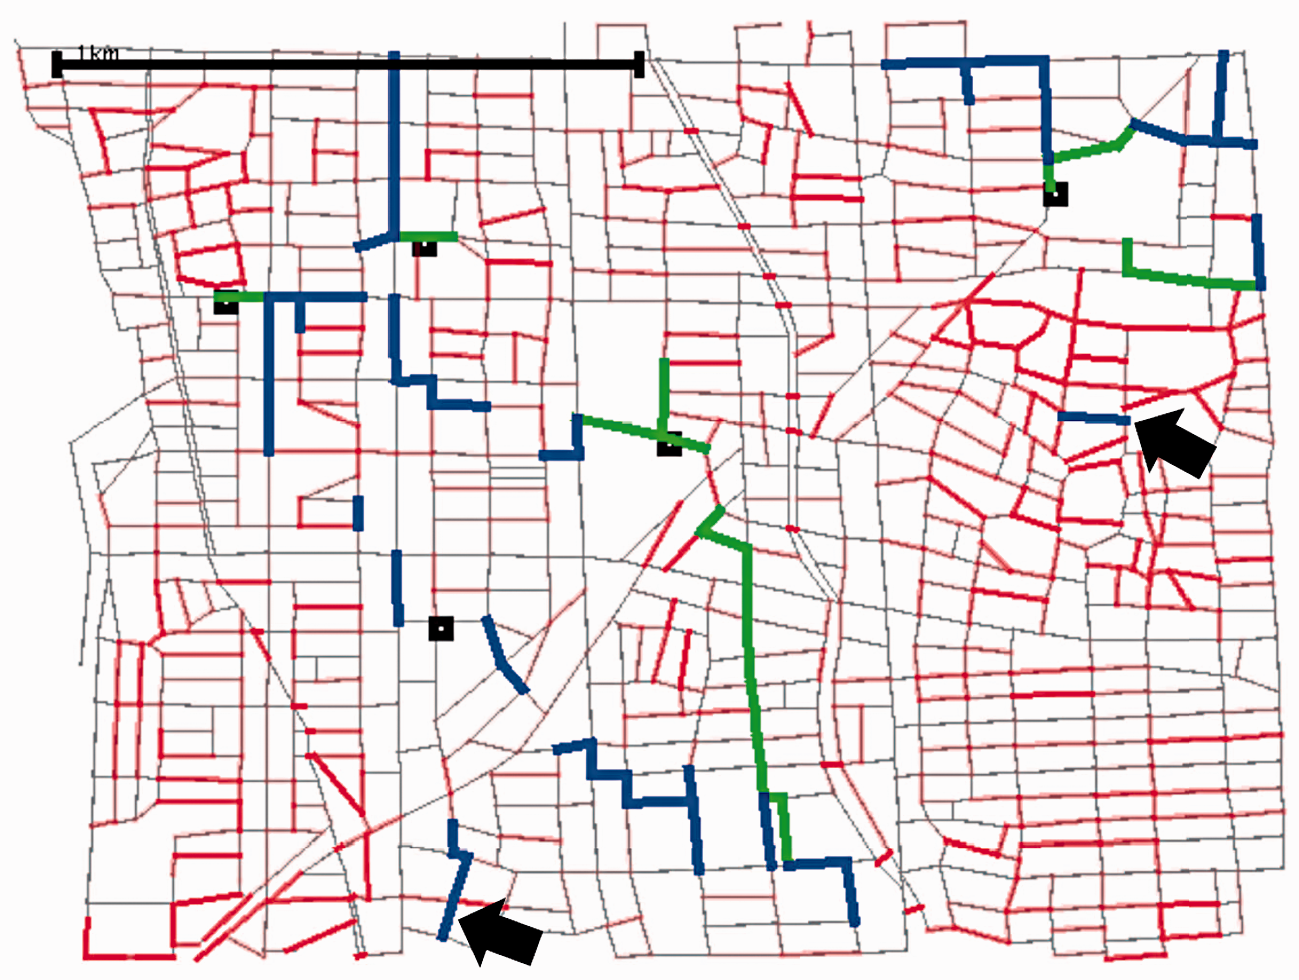
Locations of roads with top 5% compensated evacuation road demand (risk-aware path selection and commuting period).
The total number of roads with top 5% compensated evacuation road demand is 76. We first observe that about 60% of them are blue roads, which cannot be extracted without considering the compensated evacuation road demand. In particular, we focus on the two blue roads pointed by the arrows in Figure 4. Those roads have more than 0.6 road blockage probabilities and top 5% compensated evacuation road demand, and thus, they are roads with high blocked-road encounter risk, which can be newly discovered by proposed approach.
Impact of difference in evacuation behavior
In this section, we reveal how the difference in evacuation behavior affects evacuation road demand of each road by comparing evacuation road demand based on shortest path selection scheme,
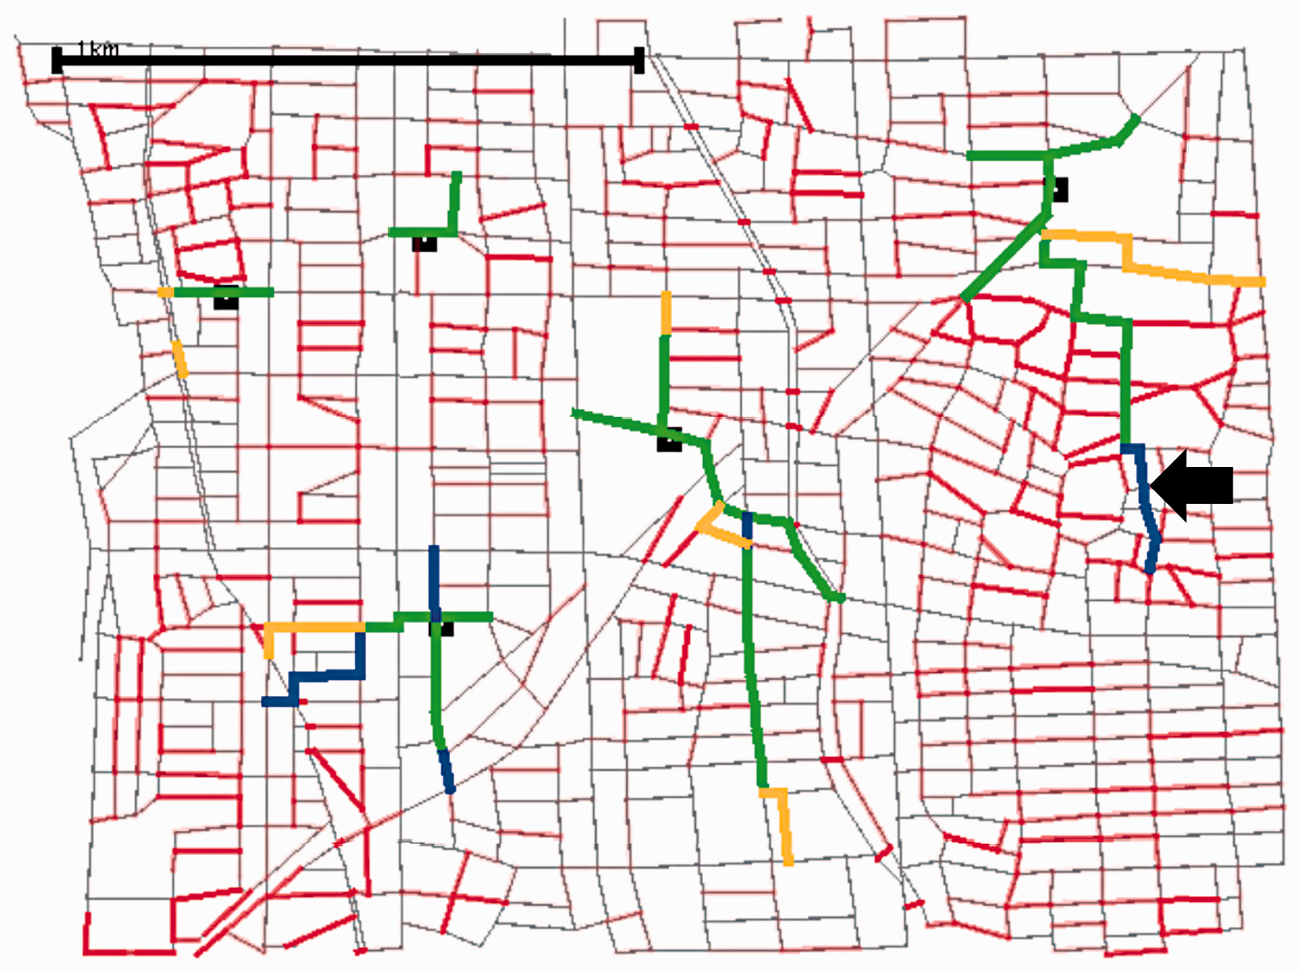
Locations of roads with top 5% evacuation road demand (shortest path selection, ordinary road demand based on people flow data, and commuting period).
We first observe that green roads occupy 80% of roads with top 5% evacuation road demand, which indicates that most of roads with high evacuation road demand do no change, regardless of evacuation guiding schemes. As for the remaining blue and yellow roads, we can confirm that the risk-aware path selection scheme can alleviate the blocked-road encounter risk compared with the shortest path selection scheme, because the blue road pointed by the arrow has more than 0.5 road blockage probabilities and are highly used only in case of shortest path selection.
Impact of difference in disaster occurrence time
Finally, we investigate how the difference in disaster occurrence time affects evacuation road demand of each road by comparing evacuation road demands of two cases: (C3) ordinary road demand based on people flow data in commuting period (8:00–8:59) and (C4) ordinary road demand based on people flow data in returning period (17:00–17:59). In addition, we calculate evacuation road demand based on risk-aware path selection scheme. Figure 6 emphasizes three kinds of roads on the risk map: green roads that have top 5% evacuation road demand in both cases (C3) and (C4), yellow roads that have top 5% evacuation road demand only in case (C3), and blue roads that have top 5% evacuation road demand only in case (C4).
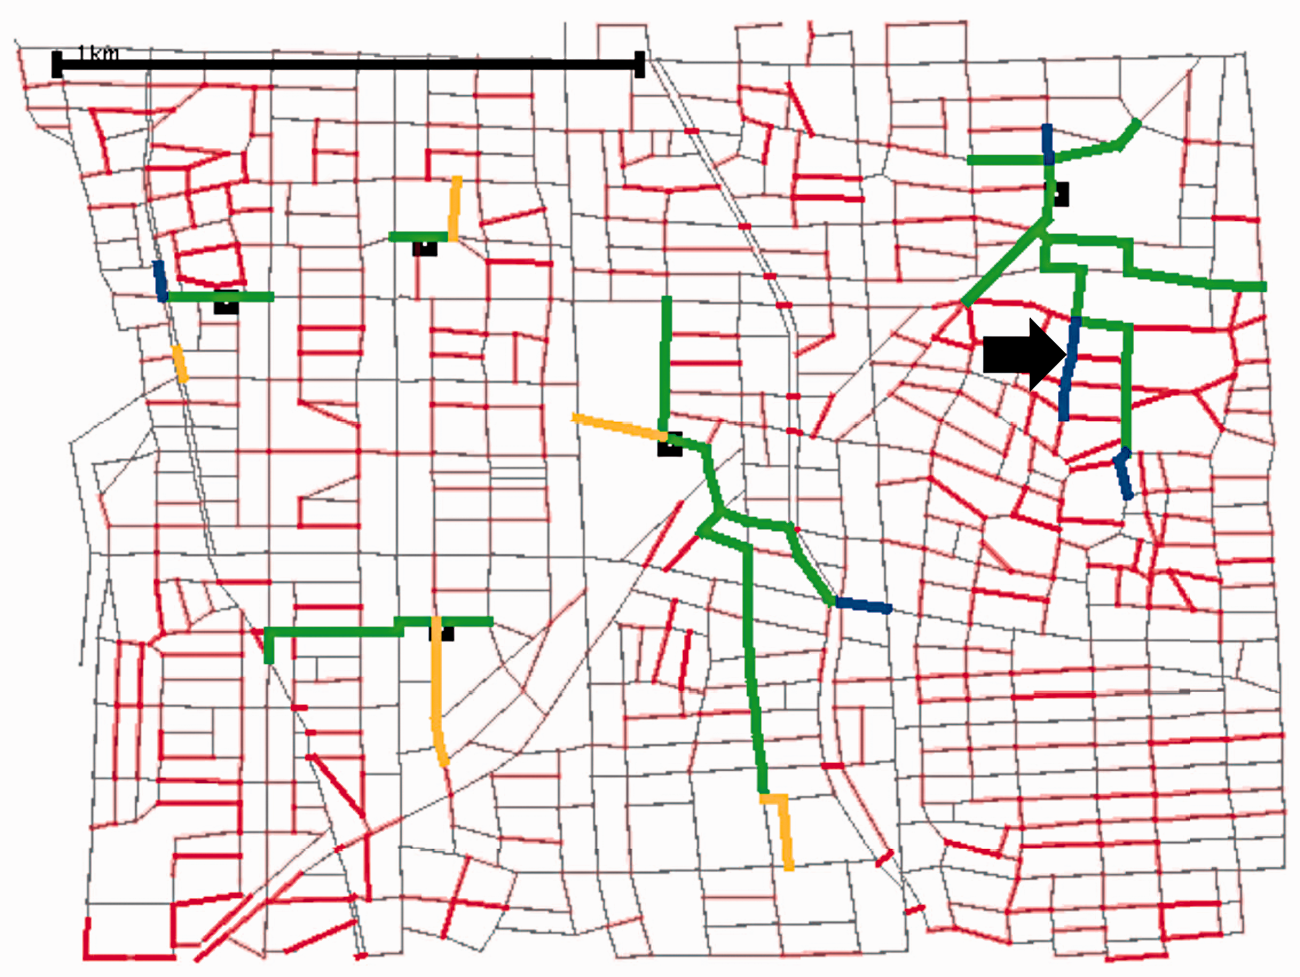
Locations of roads with top 5% evacuation road demand (risk-aware path selection, ordinary road demand based on people flow data, and returning period).
We first observe that 88% roads with top 5% evacuation road demand are green roads, which indicates that these roads are highly used in both commuting period and returning period. The remaining yellow and blue roads emerge from the difference of ordinary road demand between commuting period and returning period. Specifically, the blue road pointed by the arrow has more than 0.6 road blockage probability and top 5% evacuation road demand. This road tends to have high blocked-road encounter risk only in returning scenario.
Conclusion
In this paper, from the viewpoint of disaster preparedness, we proposed a road network risk analysis approach that considers people flow in both ordinary and evacuation situations, with the help of evacuation guiding schemes, road blockage probability, and people flow data. First, we defined ordinary road demand and evacuation road demand. The ordinary road demand is the degree of road usage at a certain interval in an ordinary situation and can be derived from the people flow data. The evacuation road demand is the degree of road usage at a certain interval in an evacuation situation and can be derived by extending the edge betweenness centrality under the assumption that people located according to the ordinary road demand move to refuges along their evacuation paths. The proposed approach detects roads with the high risk of encountering blocked road segments (i.e., blocked-road encounter risk) by combining the road blockage probability and evacuation road demand.
Through numerical experiments using actual data of Nagoya city in Japan, we investigated how roads with high blocked-road encounter risk change according to the difference of ordinary road demand, evacuation path selection, and disaster occurrence time. We observed that the risk-aware path selection can alleviate encountering blocked roads compared with the shortest path selection, but some roads with high road blockage probabilities cannot be avoided even under the risk-aware path selection scheme. We also showed that the compensated evacuation road demand can reveal roads with high blocked-road encounter risk even if they are far from refuges. Next, we found that considering the ordinary road demand based on people flow data can adequately estimate the evacuation road demand. Finally, we found that some roads with high blocked-road encounter risk change according to the disaster occurrence time.
As future work, we plan to apply our approach to other areas facing similar disaster risks.
Footnotes
Declaration of conflicting interests
The author(s) declared no potential conflicts of interest with respect to the research, authorship, and/or publication of this article.
Funding
The author(s) received no financial support for the research, authorship, and/or publication of this article.