
Abstract
The size and form of cities influence their social and environmental impacts. Whether cities have the same form irrespective of their size is still an open question. We analyse the profile of artificial land and population density, with respect to the distance to their main centre, for the 300 largest European cities. Our analysis combines the GMES/Copernicus Urban Atlas 2006 land use database at 5 m resolution for 300 larger urban zones with more than 100,000 inhabitants and the Geostat population grid at 1 km resolution. We find a remarkable constancy of radial profiles across city sizes. Artificial land profiles scale in the two horizontal dimensions with the square root of city population, while population density profiles scale in three dimensions with its cube root. In short, cities of different size are homothetic in terms of land use and population density, which challenges the idea that larger cities are more parsimonious in the use of land per capita. While earlier literature documented the scaling of average densities (total surface and population) with city size, we document the scaling of the whole radial distance profile with city size, thus liaising intra-urban radial analysis and systems of cities. Our findings also yield homogenous spatial definitions of cities, from which we can re-question urban scaling laws and Zipf’s law for cities.
Introduction
More than half of the world’s population lives in urban areas today. This share is increasing over time, while the world’s population is itself increasing (UNPD, 2014). This phenomenon leads to growing urban areas across the globe and consequent loss of (semi-)natural areas and biodiversity around cities, to the benefit of artificial land uses (Seto et al., 2012). Urban areas concentrate human activities within limited spatial extents. Consequently, cities also concentrate the consumption of energy resources, including fossil fuels and their polluting byproducts, such as carbon or nitrogen oxides, contributing to major health problems and climate change. The surface and density of cities are undoubtedly two key factors in understanding their environmental and health effects.
There is research emerging toward an interdisciplinary science of cities (Batty, 2013) that should eventually link the location of human activities in urban areas, the form of cities, and their environmental consequences or socio-economic benefits. An active part of this field focusses on quantifying environmental and socio-economic outcomes of cities with respect to their size, i.e. the scaling of these outcomes with population (Bettencourt, 2013; Bettencourt et al., 2007; Leitão et al., 2016; Louf and Barthelemy, 2014; Pumain, 2004; Shalizi, 2011). This research, however, considers each city as a whole but disregards their form and internal structure, which themselves can change with size, thus ignoring endogeneity effects (as also stressed for income by Thisse, 2014). In addition, research in this field still lacks a coherent and homogeneous definition of what an urban area is across many cities of different size. Louf and Barthelemy (2014) and Arcaute et al. (2015) show that the spatial definition of a city has a major influence on scaling relationships. Here we contribute to filling in both gaps.
Inspired by a long line of literature in urban geography and economics (Alonso, 1964; Clark, 1951; Fujita, 1989; McDonald, 1989; Von Thünen, 1875), we consider the form of cities through their radial profiles, i.e. how their structure changes with distance to the main centre. We conduct a detailed empirical analysis of how the internal radial structure of the European city scales with its population, with the aim to start bridging the gap between the two aforementioned strands of urban modelling literature, namely the analysis of systems of cities and the analysis of the internal structure of cities. We contend that space is insufficiently taken into account in the former, especially theoretically, while scaling effects are insufficiently considered in the latter literature, especially empirically.
At the ‘systems of cities’ (or urban scaling laws) end of the literature, there is simply no internal spatial structure. The research is mainly empirical and focuses on how different aggregate variables that describe the socio-economic or physical state of cities evolve with city population. Assuming only a single aggregate attribute and an average density for each city is a hazardous assumption. Indeed, and fortunately, a large portion of urban economics and urban geography research is devoted to the variation of densities, land uses, income or rents within cities, because they matter for understanding and planning cities. Especially important to this internal heterogeneity are distance to the centre effects, i.e. radial effects, including transport costs but also centre-periphery amenities, which impact land use and population densities, as shown along the Alonso–Muth–Mills’ monocentric tradition (Alonso, 1964; Fujita, 1989; Mills, 1967; Muth, 1969).
Notwithstanding the relevance of internal city structures, the theory (which we denote hereafter ‘systems of cities’ or ‘urban systems’) capable of approximating the distribution of urban populations (particularly Zipf’s law) and other city aggregates across cities is largely dominated by an a-spatial random growth framework (following Gibrat, see for example Favaro and Pumain, 2011; Gabaix and Ioannides, 2004; Krugman, 1996) that sometimes invokes endogenous intra-urban – but usually non-explicitly spatial – processes. For example, Gabaix (1999) and Eeckhout (2004) relate positive agglomeration and negative externalities effects to total population, not to the internal distribution of this population. Rozenfeld et al. (2009) endogenise land consumption in a random growth model but assume costs to be proportional to the total surface consumed and densities to be constant. Bettencourt (2013) proposes an intra-urban dissipative model with social interactions and transport networks and relates outputs to scaling laws, but ignores radial distance effects.
At the intra-urban scale end of the literature, the empirical validation of increasingly refined theoretical models from the monocentric tradition (Alonso, 1964; Mills, 1967; Muth, 1969) is still very rare. Most of the literature develops from stylised facts without validating, jointly, all model components (density and rent profiles, costs, income, urban fringe). Ahlfeldt (2011) offers one of the most comprehensive tests for a single city (Berlin). Only the analysis of population density gradients, since Clark (1951), received an empirical investigation effort that is comparable to the urban scaling literature, though more fragmented – the latest exhaustive review to our knowledge is McDonald (1989). It usually considers individual case studies, not cross-sections of numerous cities. More importantly, population density profiles are rarely discussed against land use profiles, the limits of the city and total urban population. This is particularly sad because the location of the urban fringe (the maximum extent of urban land uses) and the total population are key outcomes (or constraints) in monocentric models. In Europe, Guérois and Pumain (2008) fitted a double linear function to the profile of urbanised surfaces for 40 cities but could not link it to density profiles due to the absence of coherent population data and definition of cities. In the US, McGrath (2005) related the urbanisation area (via the urban fringe) to essential parameters of the standard monocentric model (income, transport costs and the opportunity cost of land) as well as to total population for 30 cities, but disregarded the density profile.
Obviously data gathering is a strong limiting factor to a thorough validation of standard monocentric models. This is however gradually changing with the emergence of more precise, comparable and almost ubiquitous land use data.
An important difficulty that remains in both strands of the literature for comparing results is the definition of spatial units. Within cities, density measurements are affected by the modifiable area unit problem (MAUP) (Openshaw, 1983) as soon as areal units (census tracts, municipalities) are used to retrieve population or artificial land surfaces. Any change in the number or borders of the reference area units may substantially change results because population is not homogeneously distributed within these units, hence the importance of using the finest possible geographical units and both land use and population data. In addition, the chosen limit of the city itself influences the value of aggregate attributes and resulting scaling laws (e.g. Arcaute et al., 2015; Louf and Barthelemy, 2014). Some researchers use administrative units and a functional definition of cities (e.g. based on commuting patterns), other consider raster data and morphological criteria (continuity of built-up space) or population density cutoffs. There is need for comparable methods for defining cities.
Rozenfeld et al. (2008, 2011) and Arcaute et al. (2015) define the boundaries and surface of cities using a clustering algorithm in order to analyse deviations to Gibrat’s law. Interestingly, Rozenfeld et al. (2011), using this endogenous definition of cities, find that areas are essentially proportional to population with almost no role left to density within the scaling behaviour. In the meantime, the authors also ‘defer to later work the interesting question of the heterogeneity [in density] within cities’ (Rozenfeld et al., 2011: 2221). We therefore find ourselves with a theory of urban scaling that is at best devoted to small density variation across cities – a variation acknowledged to be small empirically compared to intra-urban variations, while an entire empirical and theoretical literature is devoted to this variation but struggles to assemble pieces empirically, particularly across the city size distribution. We are somehow only left with the intuition of Nordbeck (45 years ago, Nordbeck (1971)) that cities have the same form whatever their size. However, Nordbeck does not analyse empirically the internal structure of cities, but derives his laws from aggregate measures of surfaces and populations.
Our paper challenges this situation by providing – for Europe – what we believe is the first analysis of the scaling of the entire population density and land use profiles. Our work is grounded on the finest comparable land use and population data. Although our approach relies on an ex-ante definition of cities (larger urban zones (LUZ)), the scaling relationships we find – one of them remarkably rejoining Nordbeck’s ratios – also allow us to derive new definitions of cities that are consistent across sizes. Hence, in addition to characterising the radial profile of the European city and its scaling, both in terms of land use and population density, we can therefore also verify aggregate scaling behaviour (Zipf) for different definitions of cities.
The remainder of the article is organized as follows: first, we provide a general definition of the scaling and radial profiles used as our main research method; second, we present our dataset and its processing; third, our results section reports the land and density profiles obtained and how they scale with population; fourth, we address the robustness of our generic profiles against variations across cities and against our radial assumption; finally we offer a discussion and perspectives.
Homothetic scaling and radial profiles
In this work, we search separately for two scaling laws. The first one is a surface scaling law to reflect variation in urbanised land use as population varies. Land use is indeed an areal problem of two (geographical) dimensions. The second one is a volume scaling law to reflect variations in population density as population varies. The distribution of population in space can indeed be seen as a three-dimensional problem. Scaling laws have been studied for a long time in biology and gave rise to a domain named allometry, which compares the shape of large and small organisms across scales, usually in three dimensions. After Nordbeck (1971)), allometric equations have also been transferred to cities.
In the study of the scaling of forms, laws are usually compared to a reference law named isometric scaling, which describes organisms whose shape does not change across scales: when the size changes, the elements that make the form, i.e. proportions and angles, are completely preserved. In mathematics, an isometry is a transformation that preserves all distances. Another term for isometric scaling is homothetic scaling. A homothety is a mathematical transformation that multiplies all distances by a fixed factor. We favour the homothetic scaling term here since it refers well to a homogenous dilation of an object (as illustrated on Figure 1), but the term isometric scaling could equally be considered. Comparatively, the term allometric scaling, despite its more general use by Nordbeck and subsequent authors in urban growth theory, refers specifically to constant but different rates of changes for the different parts of an object (Huxley and Teissier, 1936). In that sense using an allometric equation does not necessarily hold a preservation of forms. It is only the case with the homothetic (or isometric) transformation.
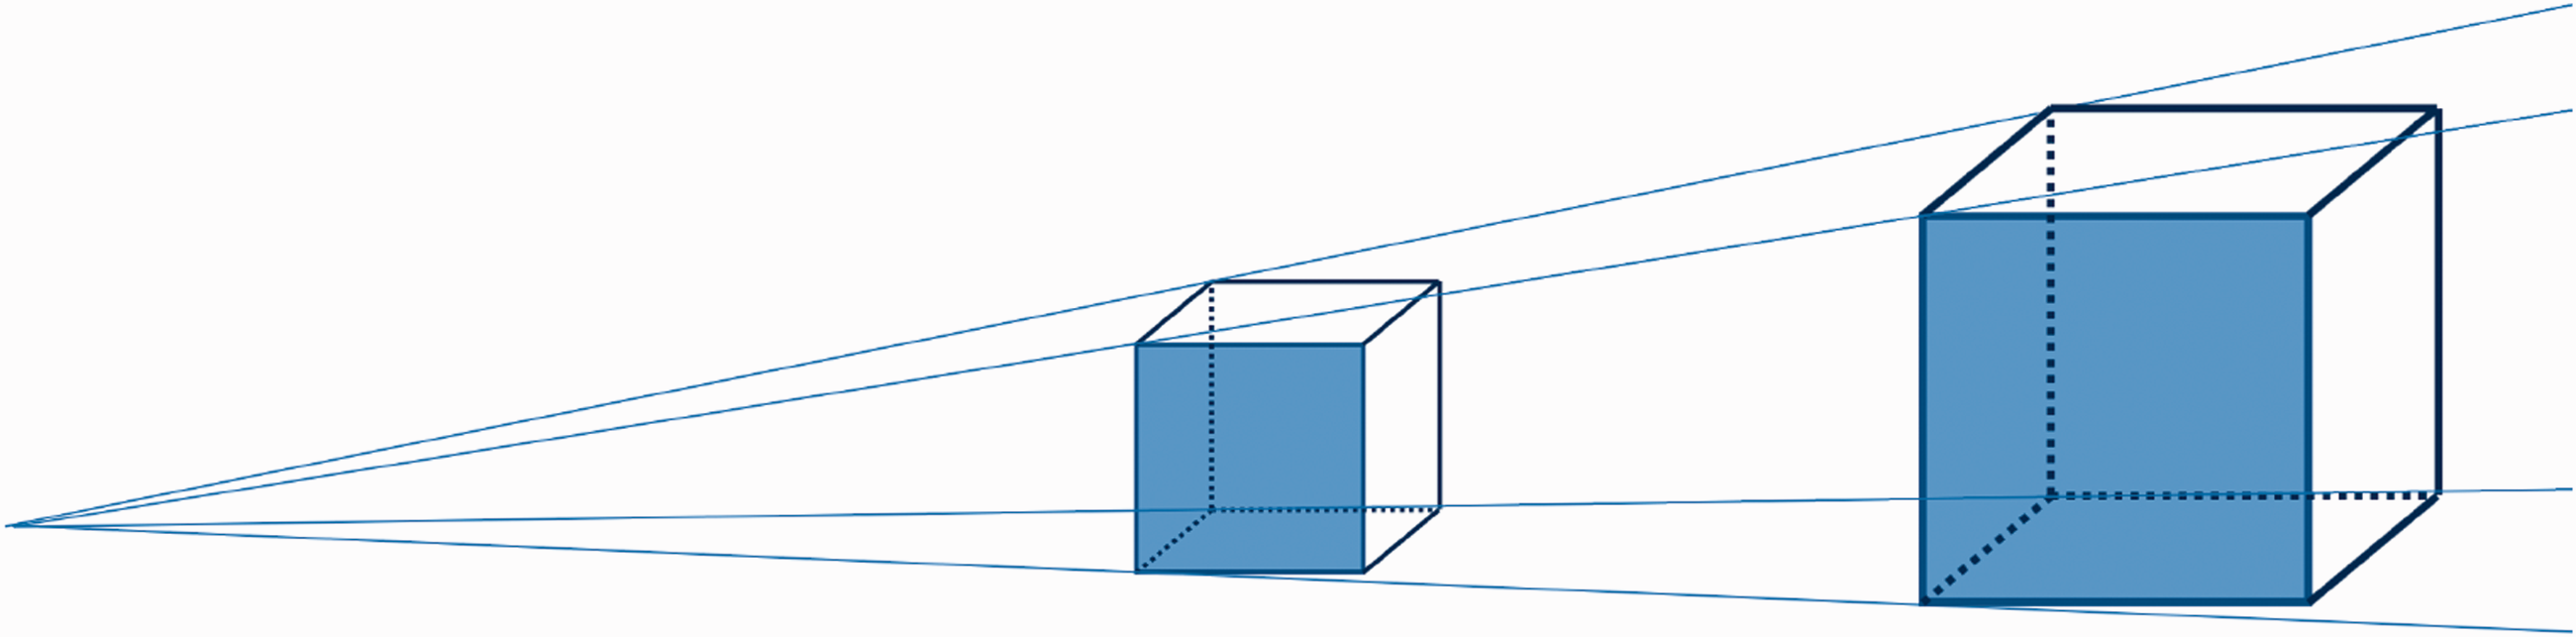
Illustration of a homothety, and of isometric scaling.
In the case of three-dimensional organisms, homothetic (isometric) scaling gives rise to the square-cube law: the volume of a given object grows with the cube of its size, while its surface grows with the square. This is illustrated on Figure 1 for a cube and works similarly for any shape. If a is the length of the side of this cube, then the area of each face (see for instance the front face, coloured in blue) grows as a2 while the volume grows as a3.
Conversely to allometric research in city science that considers aggregate attributes (e.g. the total urbanised surface) or attributes of parts of the object (e.g. average density or income), we conduct a much refined analysis of the scaling of forms by using a radial/profile approach, which is standard in urban economics. We consider the entire distribution of land and people within the city. While a radial approach has limitations in the sense that a single reference centre for the object needs to be defined, it is a considerable progress towards understanding actual forms compared to the aggregate, spatially blind measures used in scaling research.
We conduct a radial analysis of land use and population density, both separately regarded as functions of the distance r to the city centre. Thus, we express respectively a surface scaling law for the radial function of the urban land use s(r) and a volume scaling law for the radial function of the urban density

Data and geoprocessing
Our main data source is the European Urban Atlas 2006 developed by the GMES/Copernicus land monitoring services. The database provides a precise description of land use at 5 m resolution in the 300 major European urban areas, defined according to Eurostat Larger Urban Zones (LUZ), with more than 100,000 inhabitants each in 2006. These urban areas make up more than 200 million inhabitants, i.e. more than 40% of the EU population in 2006. As in any system of cities, many of these 300 urban areas have a small population, and few have a high population. This fact has been linked to Zipf’s law for many systems (see the review by Nitsch (2005)) and has been studied for European cities by many authors including recently Bettencourt and Lobo (2016).
We transform the Urban Atlas polygon dataset into a 20 m resolution grid with the same land use information using a central point rule for aggregation: each cell of the grid is given the value of the polygon that comprises the centre of the cell. This transformation facilitates computing while preserving spatial objects of small width, like roads (conversely to a majority rule). We then combine this land use grid dataset at the level of LUZs with population density from the Geostat population grid, which covers the European Union (EU) with a 1 km resolution, also for the year 2006. Population counts given by the Geostat grid are downscaled to the 20 m land use grid, using the ‘urban fabric’ classes of the Urban Atlas. Those classes are based on different levels of soil sealing (S.L.) as follows and illustrated on Figure 2 for the inner city of Vienna, Austria: Continuous Urban Fabric (S.L.: > 80%), Discontinuous Dense Urban Fabric (S.L.: 50%–80%), Discontinuous Medium Density Urban Fabric (S.L.: 30%–50%), Discontinuous Low Density Urban Fabric (S.L.: 10%–30%), Discontinuous Very Low Density Urban Fabric (S.L. < 10%). Each class is given a weight, respectively 0.85, 0.65, 0.4, 0.2 and 0.05, describing its contribution to the residential location of households. The population in each 1 km2 cell is then attributed to the (20 m wide) urban cells using these weights (Figure 2).

Illustration of the datasets and methods on Vienna, Austria: Urban Atlas 2006 (top left), Geostat population grid (top right). Distribution of the population according to land use and rings of the radial analysis (bottom left). Land use shares as functions of the distance to the centre (bottom right).
Since we conduct a radial analysis of the land use and population density profiles, an important choice is the location of the city centre. In this work, we choose the location of the city hall, which corresponds well in most European cities to the historical centre of the city and is usually located in a completely artificialised area close to high population density zones. Other authors have used the coordinates of the city hall as the location of the city centre (see e.g. Walker, 2016; Wilson, 2012). In the online supplemental material (online supplemental Figure 11), we show that the precise location of the city centre has actually only a small influence on the results.
We define concentric rings of fixed width
As reminded above, the total population of a city has been widely used as a scaling parameter, to evaluate the evolution with city size of different variables, such as income or road space. In line with this scaling literature, we use the total population N as a measure of size. For consistency, we compute the total population of each urban area from the population grid data (sum over all cells of the LUZ). Grid cells which are partially covered by the LUZ are counted proportionally to the covered surface.
Results: Scaling laws
In order to compare cities of different size and to identify whether there exists a generic radial profile that would be representative of a European city, we now study sequentially the scaling of the artificial land use share and then the scaling of the population density curves.
Artificial land profile
We denote by s(r) the share of artificial land use
2
at distance r of the city centre. When comparing the shape of s(r) curves for different cities, as shown on the left column of Figure 3 for different European capital cities (top) and for all cities of the database (bottom), one can observe that their evolution is similar: they start at roughly 100% in the very centre and decrease further from the centre. Additionally, we see that this decrease is faster when the city population is smaller. On the top left panel of Figure 3, the different curves appear clustered around population size groups: the two biggest cities in the dataset (London and Paris, with roughly 12 million inhabitants), three smaller capital cities (Warsaw, Budapest, Lisbon, roughly 2.5 million inhabitants) and three small ones (Tallinn, Ljubljana and Luxembourg, with roughly 500,000 inhabitants). In order to compare those curves to each other, it is then interesting to rescale the horizontal axis proportionally to a power of the city population N. We perform this on the right column of Figure 3, using on the horizontal axis the rescaled distance
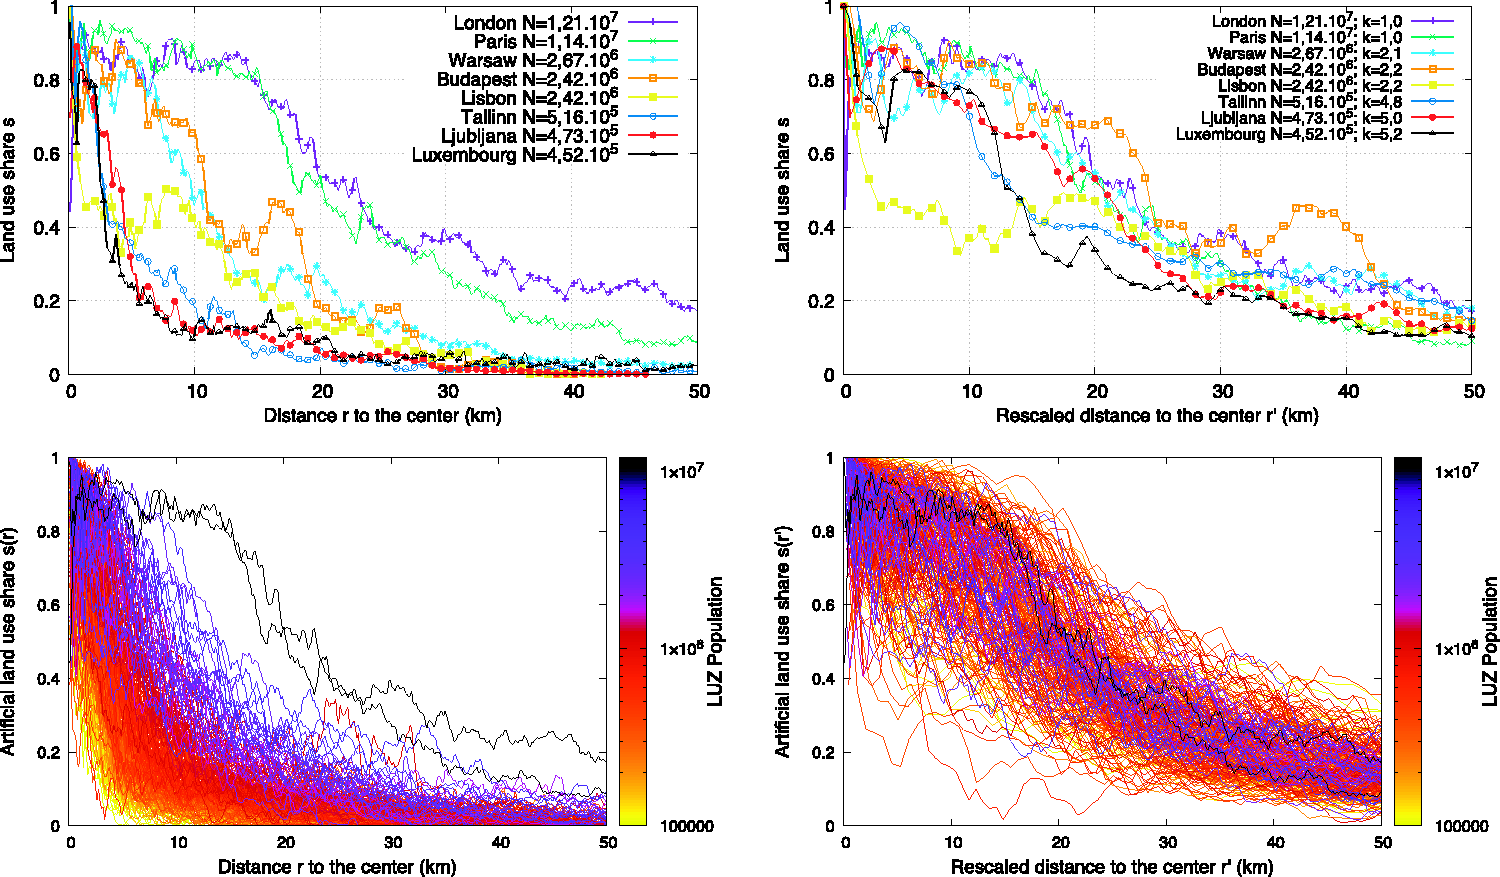
Left column: shares of artificial land use as functions of the distance to the centre in different European capital cities (top panel) and in all 300 cities of the database (bottom panel). The total population N is given in the legend. Right column: rescaled curves for the same cities – on the top panel, the rescaling factor k (s.t.
The second row of Figure 3 then presents the same exercise for all 300 cities within the database. There are observable fluctuations after rescaling, as can be expected from cities with very different characteristics other than size (physical aspects such as elevation changes, presence of water bodies or climate variations, as well as historical and cultural aspects of urbanisation, including planning policies). However the rescaling captures a very clear common trend. We show in the online supplemental material section that the value a = 1/2 for the rescaling exponent is robust and close to optimal.
How can we interpret this rescaling with the square root of city population? We have to remember that the land use curves represent averages over two-dimensional rings, so that two horizontal dimensions are actually rescaled with respect to the square root of city population. This means that the artificial surface around the city centre scales linearly with city population. Given the definitions above, we can conclude that cities are homothetic in terms of land use profiles, and that the scaling with population size is linear. This is an empirical evidence of the similarity of all European cities, irrespective of their size. This result can be related to the proportionality between area and population found by Rozenfeld et al. (2011) for US and UK cities, although the methods used are quite different (a clustering algorithm and population data). It is also related to the much earlier analysis of Tobler (1969), who obtained an exponent 0.44 for the scaling of the radius.
Figure 4 gives a different perspective of the same phenomenon. From the previous results, we concluded that most European cities of the database are comparable in terms of land use as long as the distance to the centre is rescaled with respect to the square root of population size. Choosing a specific rescaled distance to the centre, for instance

Average land use shares in discs of rescaled radius
Population density profile
We now perform a similar analysis for population density. The left column of Figure 5 shows that the density
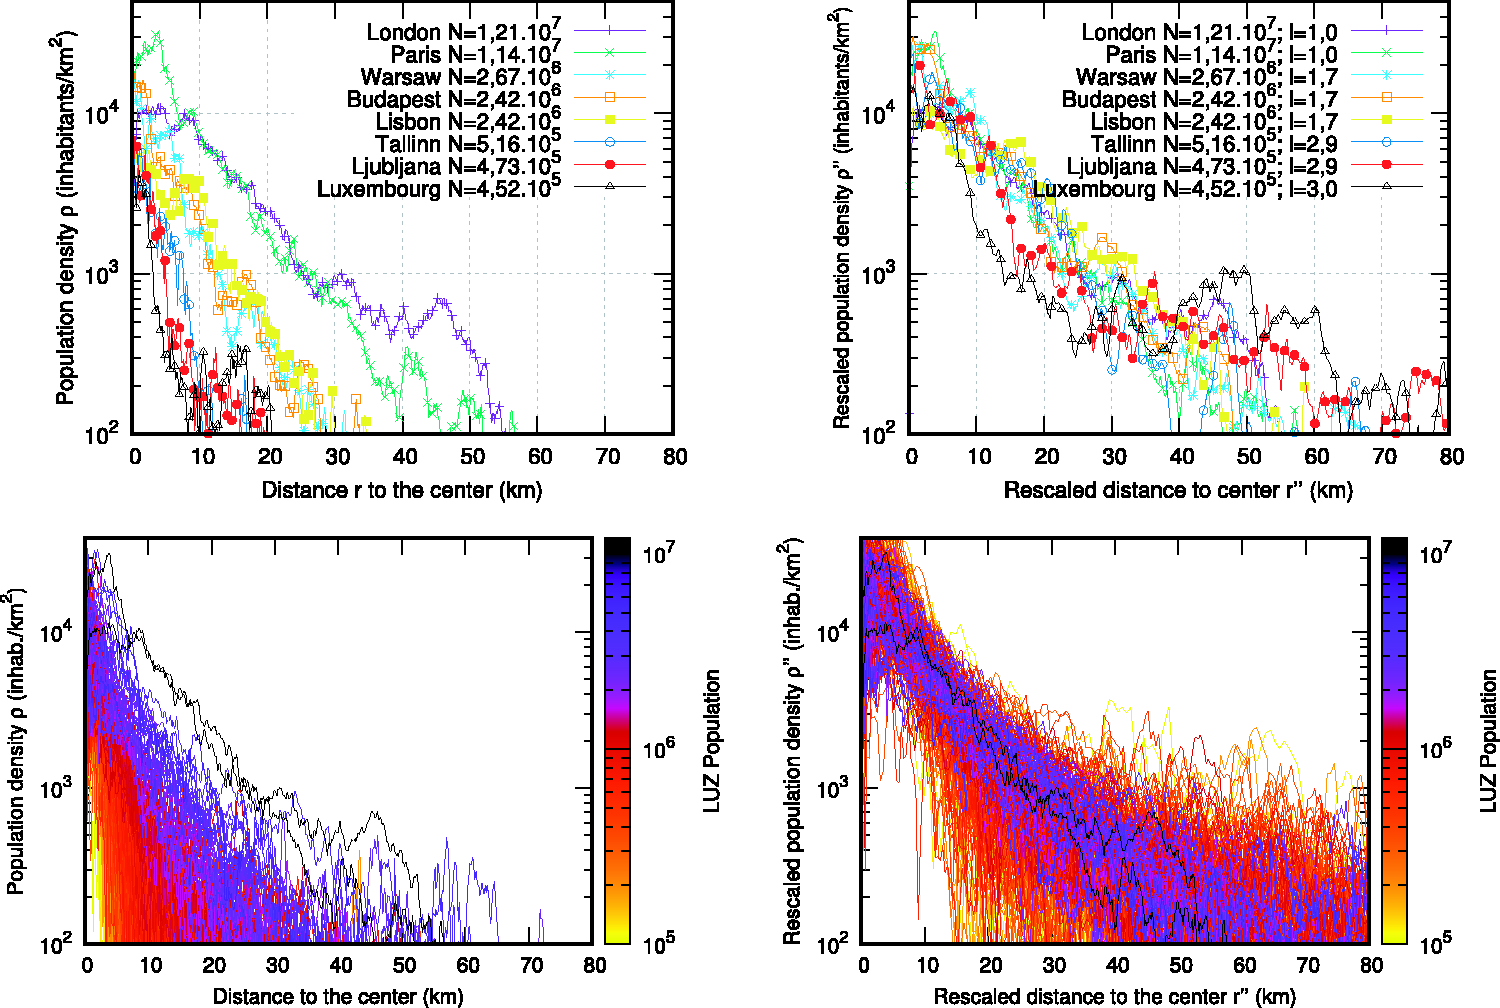
Left column: population density as a function of the distance to the centre in different European capital cities (top) and all cities of the database (bottom). The population N is given in the legend. Right column: rescaled curves for the same cities – on the top panel, the rescaling factor l (s.t.
We find that the exponent that works best in this case is the cube root of city population: we use a rescaled distance to the centre noted
This result is again an empirical evidence of the common radial organisation of European cities, this time in terms of population density, and again of their similarity across different sizes. It also shows that the population can be considered as the third dimension of a volume, and that bigger cities are also ‘taller’ ones in population terms. A research perspective that follows directly would consist in applying this same approach to three-dimensional data featuring building height (studied for instance by Schläpfer et al., 2015) and test whether the volume of city buildings scales with population size consistently with the scaling of population density studied here.
Importantly, our results provide clear empirical evidence to the early intuition of Nordbeck (1971) who stated that ‘It seems legitimate to claim that all urban areas have the same form and shape’. Using dimensional analysis, he derived a scaling of urban surface with the power 2/3 of the population (this relation between population and surface is studied for instance by Batty et al. (2011)) and found a very good agreement with data from the 1960 and 1965 Swedish censuses. We prove here that this is a very general law and that it holds when the distribution of densities within a city is considered. The city definition of Nordbeck was different to ours but we find the same scaling: each disc inside a constant value of our rescaled radius
This is actually another possible viewpoint on the scaling of population density, which consists in studying the evolution with population size of the average population density in the discs of different sizes (proportional to the cube root of the total population) defined by a fixed rescaled radius
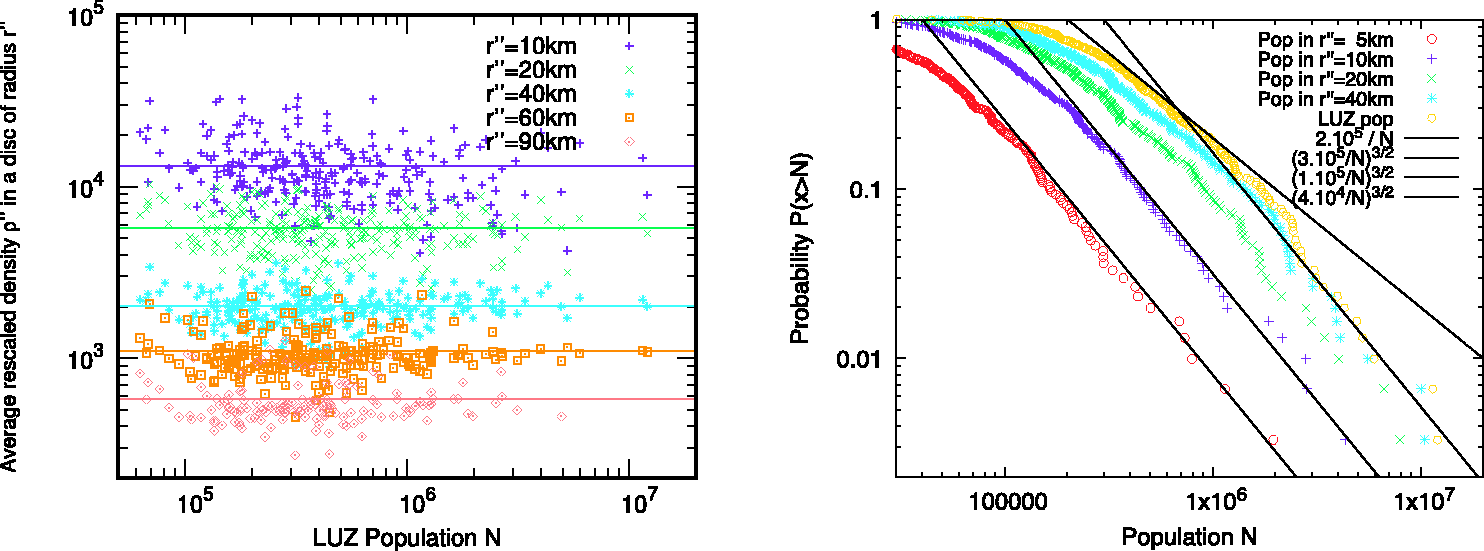
Left panel: average rescaled density
The right panel of Figure 6 studies the size distribution of cities in the database. It compares this distribution for the populations of the LUZs used in the database, to the populations of reduced urban areas based on a fixed rescaled radius
We note that although London has the largest population (soon followed by Paris) across the database when considered at the level of the LUZ, Paris is clearly the first European city when considering discs defined with small values of the rescaled radius
One possible reason for this observed deviation from Zipf’s law for European cities lies in the way urban areas are defined in our approach: using a fixed rescaled radius
Robustness
In this section, we address two challenging limitations of our results and approach: the fact that there are fluctuations around the average profiles, and the fact that the radial approach smoothes out non radial structures, including subcentres interspersed in the structure. As explained earlier, we already checked robustness against varying locations of the city centre.
Fluctuations
Here we wish to discuss and quantify the amount of deviation observed around the generic radial profiles of land use and population density of Figures 3 and 5. In the online supplemental material, we use a signal to noise ratio to find the optimal value of the scaling parameters. As explained earlier, we show that the values a = 1/2 and b = 1/3 of the rescaling exponents are very close to optimal. Importantly, we also see that there are clear maxima, implying a clear central profile, in both cases. In addition, in the case of the land use profiles, the ratio of ‘explained’ variations (signal) to residual variations (noise) is quite high (as high as 3.5 on online Supplemental Figure 12) and slightly lower for the density profiles (as high as 2 on online Supplemental Figure 12). Further, we also show in the online supplemental material that the rescaled profiles do not depend on the way small and large cities are weighted (online Supplemental Figure 13), which implies that the contributions of small and large cities to these fluctuations are quite similar.
To complement this robustness analysis, we display here the distribution of the fluctuations around the average for each distance to the centre. This is represented on Figure 7, showing that the spread is actually fairly limited in the case of artificial land use profiles, and wider for population density, especially in the peripheries. We also note that this spread is evenly distributed when comparing positive and negative fluctuations, at least regarding land use.
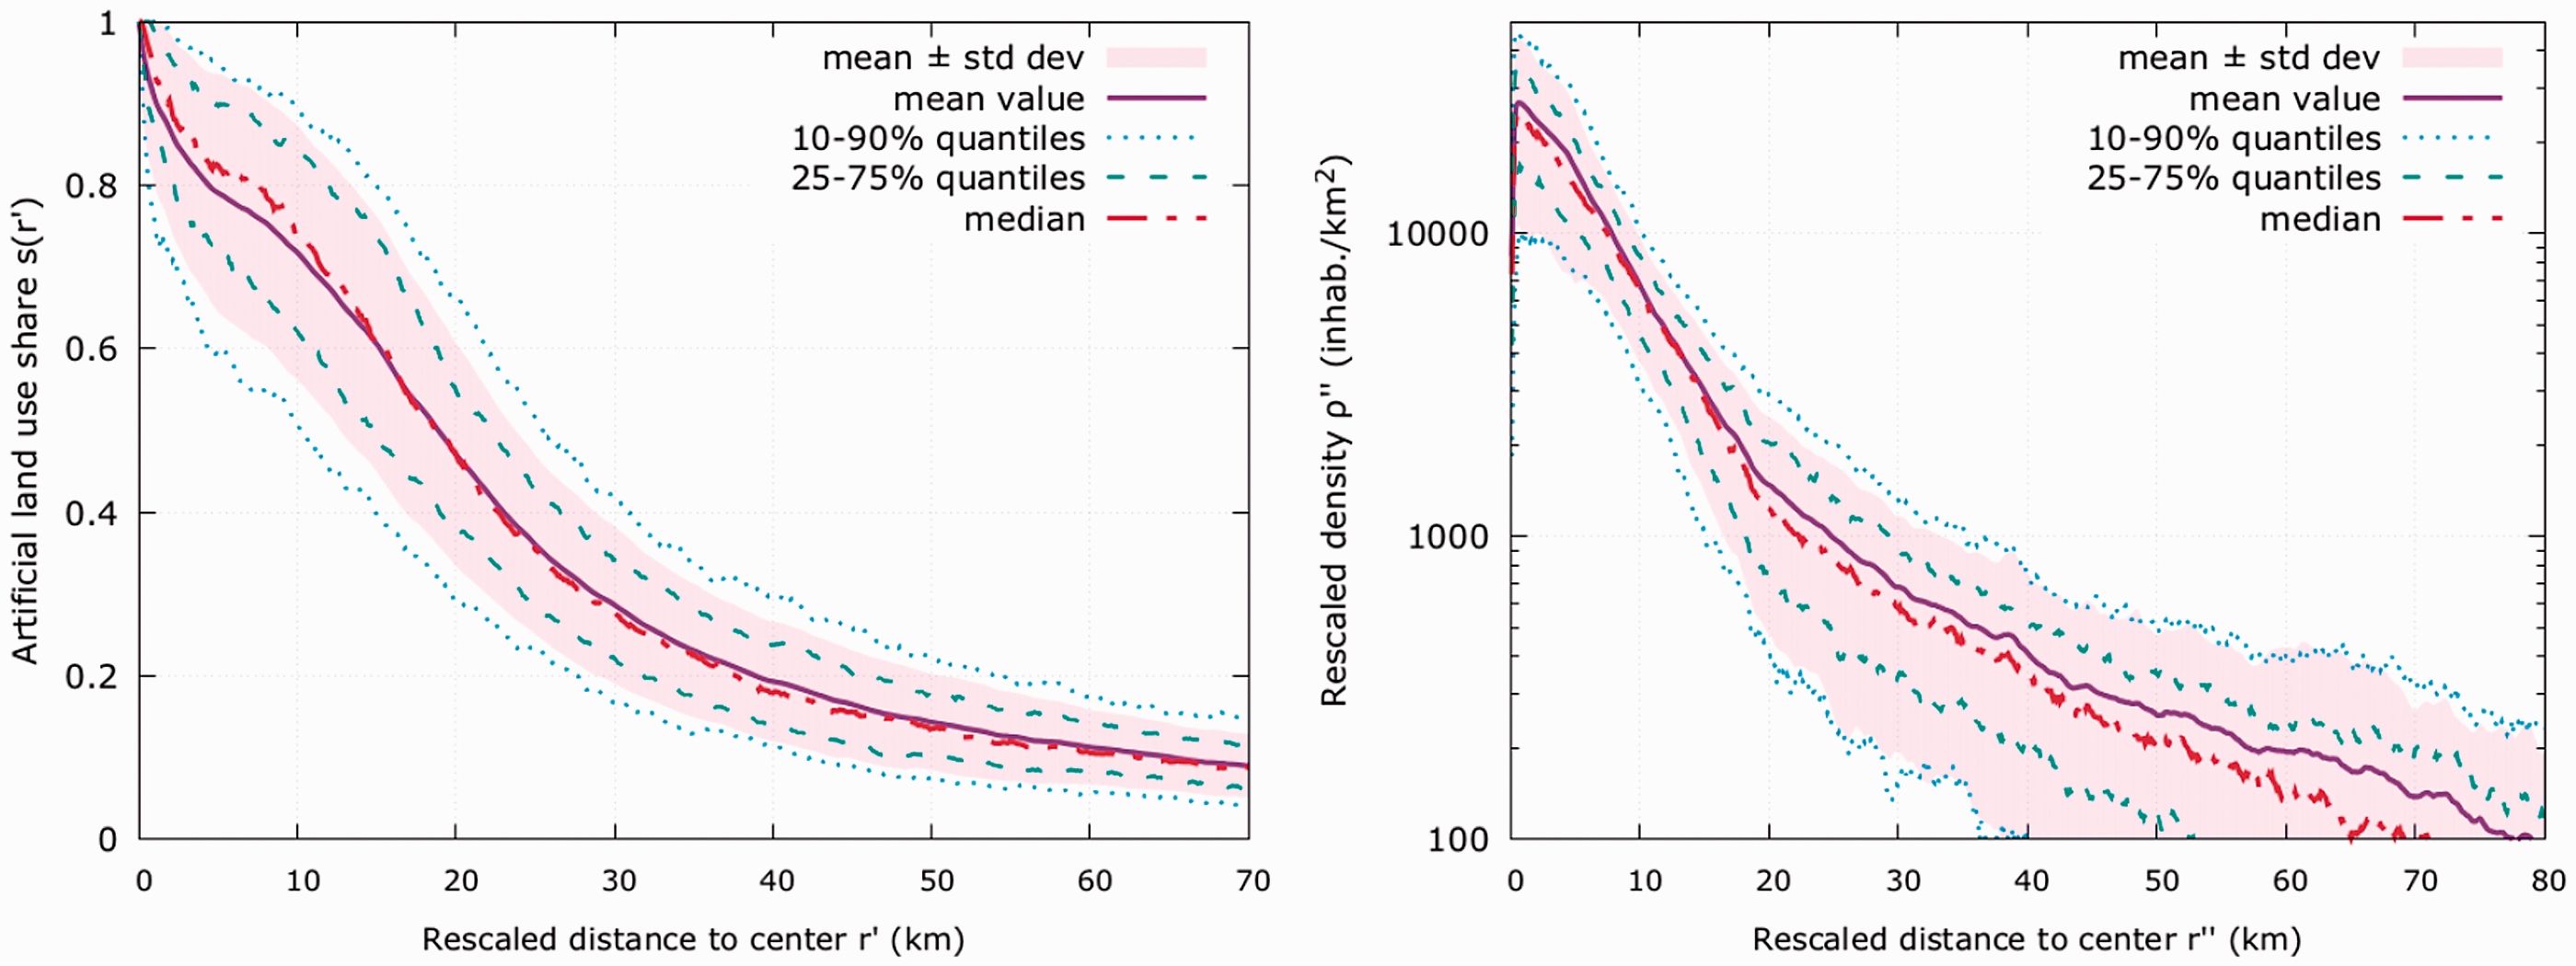
Distributions of artificial land use (left) and population density (right) rescaled radial profiles for all 300 cities of the database.
Figures 4 and 6 are also telling about the homogeneity (no drift) of the fluctuations when cities are cropped at different distances. Following the recommendations of Shalizi (2011), we presented earlier per capita quantities in those figures (i.e. rescaled quantities where the population effect is taken off) since it provides a clear view on potential deviations from proportionality. We can however use these data for linear estimation, following the common procedure in urban scaling research: keep the population effect and fit non-rescaled quantities against total population (after taking the logarithm of both quantities). The dependent variable is then the artificial area

Summary of the linear fits (equation (2)) corresponding to Figures 4 and 6.

Note: β is the estimated scaling exponent, and
aFits performed only on cities which have less than 20% missing data within the considered
A number of conclusions can be drawn from the table: first, the fact that all estimated β coefficients are quite close to unity confirms the validity of our two scaling laws. Second, the measured coefficients of correlation R2 are high. In particular, they are very high compared to most urban spatial scaling laws (see for instance Batty et al. (2011)). This is again a positive point for the spatial scaling laws uncovered here. More strikingly, the decrease in the coefficient of correlation R2 is very small when we impose proportionality (β = 1) in equation (2), to the point that it can barely be seen on the last line of Table 1 because it affects mostly the third or fourth digit. Third, the land use fits performed only on non-coastal cities are systematically better than those performed on all cities, which confirms the fact, observed on Figure 4, that non-coastal cities follow the general rule more closely than coastal ones, and that the presence of large bodies of water close to the city centre is a major source of discrepancy from the general behaviour.
Non-radial urban structure
We now approach a second limitation of our work, i.e. the smoothing-out of non-radial structures within cities. Indeed, although the internal structure of cities has a clear radial component as we show in this work, it is clearly not the only aspect of the internal urban structure. We can typically think of subcentres or directional spatial heterogeneities. We present here a preliminary attempt to link our radial analysis to more general analyses of the internal urban structure. Our approach still consists in analysing radial profiles, but we compare different portions of discs (wedges) instead of focusing only on the full disc, in order to verify the robustness of the profiles within a city. We perform this analysis on London and Paris, the two largest cities of the dataset, which arguably can present the largest spatial heterogeneities or more subcentres.
More precisely, we divide the urban space in different wedges of angular width
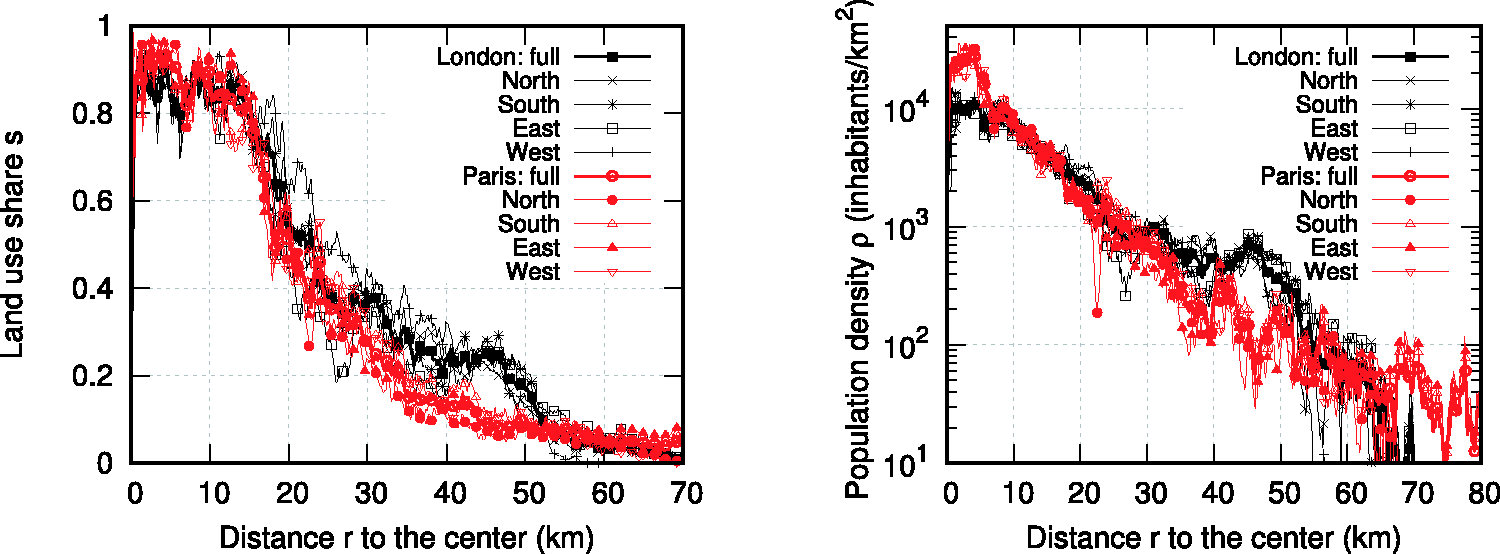
Angular variations of artificial land share (left) and population density (right) radial profiles for London and Paris: the radial profiles obtained on half discs oriented towards the cardinal directions are compared to the profile of the full disc.
However, the size of our wedges and of the studied samples decreases as n increases. As a result, fluctuations increase, which is expected from the central limit theorem. We represent this on Figure 9, which shows for London the radial profile of the fluctuations for different values of n (that is, different angular widths
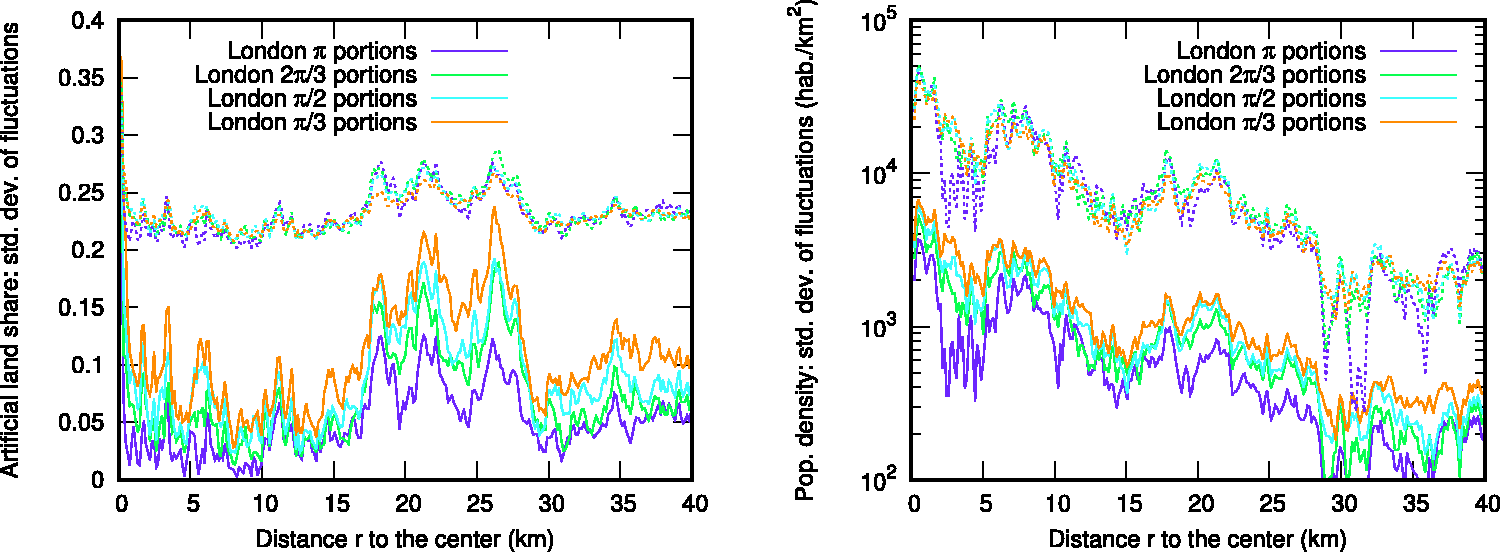
Standard deviation of artificial land use share (left) and population density (right) for portions of discs of different angular width. The dashed lines indicate rescaled curves
Moreover, these fluctuations increase with n as the angular width (and sample size) decreases. Again from the central limit theorem, which would suppose that all samples are taken from the same distribution and hence that there is no spatial structure apart from the radial one studied here, we would expect these fluctuations to increase as
We obtain these exponents with a systematic analysis, presented on Figure 10: for each distance r to the centre and different values of the scaling exponent c, we compute the standard deviation of
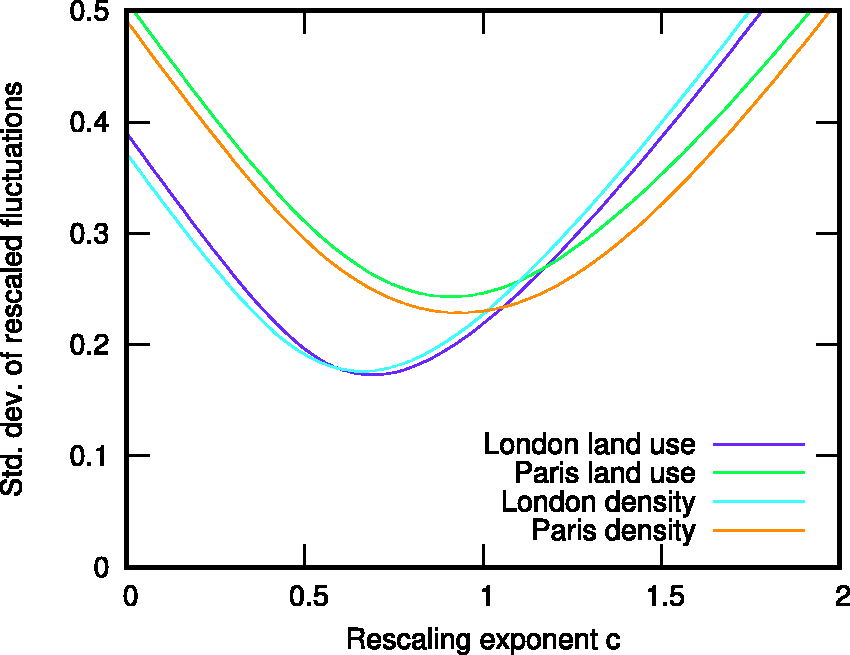
Study of the exponent of angular fluctuations of land use and population density. The ordinate measures the dissimilarity between rescaled curves
While powerful to capture a major spatial component of urban forms and its scaling, a full disc radial analysis indeed hides additional urban spatial structures, possibly quite city-specific. This is of course well-known to empirical urban research, including fractals or polycentricity measures. The methodology used in this section could prove useful to link radial analysis to these other approaches and later draw theoretical links.
Discussion
This study provides empirical evidence across 300 European cities of the simple geometrical scaling of cities as seen from the radial evolution of their land use and population density. While it is only a specific view of internal urban forms, our radial analysis and the derived scaling laws proved to be robust. European cities show remarkably constant profiles across city size. It is striking that the radial profiles are so well captured by rescaling with the square and cube roots of city population. We can consider cities as simple volumes that spread over a surface in proportion to their population. Urban forms are homothetic in both land and density. Land is a two-dimensional object; hence each of its dimensions scales with the square root of city population. Population density is three-dimensional; hence each of its dimensions scales with the cube root of city population.
The two homotheties we find also mean that there are no economies or diseconomies of scale related to urban form. Bigger cities are more expanded in surface, but are not more (or less) parsimonious in the use of land per capita. Similarly the volume per capita is constant: when cities get bigger they also get taller.
Our findings complement theoretical intuitions and dispersed empirical results that appeared decades ago in the literature (Nordbeck, 1971; Tobler, 1969), when datasets were less detailed and extensive. These former works suggest that the scaling laws we find here for Europe are probably also valid for other areas in the world and other time periods. We confirm for instance that the urban area scales as the power 2/3 of city population – the result of Nordbeck (1971) – when density curves are considered, but the urban area and population are proportional when considering land use.
Our work also identifies the common radial structure of the European city and shows that people and activities are very inhomogenously located in urban areas. A large part of urban areas is actually (semi-)natural, as Figure 3 shows. This clearly calls for reconsidering the aggregate/average density approaches in urban systems analysis and for drawing explicit links between scaling laws and monocentric intra-urban models (Delloye et al., 2018). Obviously, generic urban models, that would aim to cover cities of different sizes, should be able to account for the scaling phenomena studied here and the generic profiles of land uses and population we have found.
Our results are consistent with the theoretical model proposed by Bettencourt (2013) – at least for the scaling of population density. Rather than adding to it or developing competing models that would cover the radial evidence and scaling we show here, we think priority should be given to explicitly liaising with standard urban economic models (Alonso, 1964; Fujita, 1989). They are definitely well established in geographic, economic and planning research and explicitly relate the radial internal structure of cities – which we identify here empirically – to households’ and firms’ behaviour. Whether these models are also able to respond to the scaling effects empirically demonstrated here should be the object of future work (Delloye et al., 2018). Their ability to let non-urbanised land emerge within a city, as is the case here for all European cities, or their ability to explain building heights in such a way that the density structure shown here can be replicated given land use constraints and across city-size, are two key challenges and perspectives. Empirically, such tests will require the profile of land or housing prices to be retrieved coherently, as well as building heights to be captured (e.g. lidar data), and both to be analysed for many cities of different population size.
There is a lot to gain from capitalising on, and further integrating, intra- and inter-urban modelling literature, especially by bringing more space into scaling laws research and more scaling behaviour into intra-urban research. For instance, we have demonstrated here that understanding the scaling of the entire urban profile offers a very practical tool for comparing cities by providing coherent definitions of cities that are largely lacking in urban research. We have shown here how such scaling-based homogeneous definitions of urban areas can affect our understanding of Zipf’s law for cities (Figure 6). It could be used in the future for other city-wide attributes, in particular for the comparison of those environmental or socio-economic outcomes of cities that, in urban planning, are supposed to derive from urban form rather than city size. Depending on objectives, one can adapt the definition and spatial extent of cities by choosing either the scaling of land use as reference, typically where environmental or biodiversity effects are supposed to depend on land take or fragmentation, or the scaling of population density as reference, typically when social interactions or agglomeration economies are studied. An important perspective of work consists in relating these scaling laws to commuting patterns, from which the definitions of functional urban areas (such as LUZs) are derived.
A limitation of our work has been to use as a scaling parameter the population provided from the area covered by the LUZ. A better approach should be to loop between the data and the scaling law from which we derive the city definition. This is an interesting perspective, provided that convergence to a fixed point can be reached.
Supplemental Material
Supplemental Material - Supplemental material for Evidence for the homothetic scaling of urban forms
Supplemental material, Supplemental Material for Evidence for the homothetic scaling of urban forms by Rémi Lemoy and Geoffrey Caruso in Environment and Planning B: Urban Analytics and City Science
Footnotes
Authors' note
Rémi Lemoy is also affiliated to University of Rouen, IDEES Laboratory UMR 6266 CNRS, Mont Saint Aignan, France.
Acknowledgements
The authors acknowledge helpful discussions with M Batty, E Altmann, F Simini, P Jensen, and P Picard, and thank two anonymous referees for insightful comments.
Declaration of conflicting interests
The author(s) declared no potential conflicts of interest with respect to the research, authorship, and/or publication of this article.
Funding
The author(s) disclosed receipt of the following financial support for the research, authorship, and/or publication of this article: This research has been supported by funding from FNR Luxembourg with the ALONSO-EU postdoc project and from University of Luxembourg with the SOSBUGS project.
Notes
References
Supplementary Material
Please find the following supplemental material available below.
For Open Access articles published under a Creative Commons License, all supplemental material carries the same license as the article it is associated with.
For non-Open Access articles published, all supplemental material carries a non-exclusive license, and permission requests for re-use of supplemental material or any part of supplemental material shall be sent directly to the copyright owner as specified in the copyright notice associated with the article.