



Abstract
Since the establishment of the People’s Republic of China in 1949, China’s urban development policies have experienced dramatic changes, from anti-urbanisation before 1978, to anti-large-city-development during 1978–1999 and coordinated urbanisation in 2000–2012. Using city-level data from 1949 to 2012, this paper examines China’s development policies and city size distribution. Evidenced by the Zipf coefficient, we found that China’s city sizes became more evenly distributed before 2000, and this pattern was reversed after 2000. These findings suggest that China’s urban system is strongly affected by its shifting urban development strategies.
Introduction
Researchers care about city size distribution because it reveals the geographical distribution of population and economic activities within a nation (Fujita and Mori, 1997; Ioannides and Overman, 2004). Understanding driving forces of city size distribution adds to our knowledge of urban systems and helps us practice informed urban planning. This paper studies whether and how China’s urban development policies affect the city size distribution, using the Zipf’s exponent as a measure of the distribution inequality. Zipf’s law states that the city rank (R) associated with city size (S) is proportional to S to some negative power. In terms of urban systems, the power is close to 1, which is known as the rank-size rule. Empirical studies from many countries confirm that the rank-size rule holds in most cases, though deviations exist (Clark and Stabler, 1991; Nitsche, 2005; Rosen and Resnick, 1980; Soo, 2007).
China’s urban system differs from that of many nations, due to having long been developed under a planned economy and still being strongly influenced by government policies. Studies show that state intervention in China shaped its urbanisation and city system differently from those of the free market economies (Gu et al., 2015; Liu et al., 2015; Ma and Timberlake, 2013; Yeh et al., 2015). If the rank-size rule prevails when free market dominates, will it fail because of government intervention? This paper addresses this question. It studies whether China’s urban development policies override the rank-size rule, and if so, in which direction and to what magnitude.
The contribution is two-fold. First, this paper evaluates the effectiveness of China’s urban development policies. Since China’s urban development policies explicitly discriminate cities by size, they are expected to change the inequality of the city size distribution if effectively enforced. Such inequality changes can be reflected by the Zipf’s exponents. Previous studies noticed that China’s city system did not fit the rank-size rule (Chen et al., 2013), and suggested economic reform, special economic zones, the one-child policy and migration control as causes (Anderson and Ge, 2005; Luckstead and Devadoss, 2014). A few noticed the influence of urban development policies (Chen et al., 2013; Gangopadhyay and Basu, 2013; Song and Zhang, 2002), but none established the causality between those policies and the rank-size rule with robust econometric analyses. The causality sheds light on the effectiveness of those policies, and adds to our understanding of whether and how much government intervention changes the city size distribution.
Second, the paper contributes to our knowledge of how quickly city size distribution converges to the rank-size rule after the removal of the intervention. China largely reduced restrictions on city growth after 2001, providing a valuable chance to study the convergence of an urban system to the rank-size rule with the relaxation of government intervention, and more generally how Zipf’s law performs dynamically when the urban system deviates from the steady state (Gabaix, 1999; Li and Song, unpublished paper, 2014).
China’s urban development policies and urbanisation: 1949–2012
China has experienced dramatic changes in urban development policies, from anti-urbanisation prior 1978 to ‘control large cities, reasonably develop medium-size cities, greatly promote small cities’ in the 1980s and 1990s, and ‘coordinated urbanisation’ in the 2000s. Yeh et al. (2006) and Li (2008) summarised China’s urban development policies.
Before 1978, China’s urban policies were anti-urbanisation. The first urban development policy was made in the first national urban construction conference in September, 1954. 1 Cities were divided into four categories and managed differently. The first group included cities where significant new industrial projects were constructed, such as Beijing, Taiyuan and Lanzhou. The second group, called ‘expanding cities’, included Anshan, Shenyang and Changchun. The third group enjoyed limited room for expansion and included cities such as Shanghai, Tianjin and Hangzhou. The fourth group included medium-small cities not expected to expand. After the conference, starting from 1953, 150 cities made their first master plans according to the above development strategies (Tan, 2005). This industrial-led development policy contributed to an increase in the urbanisation level from 10.6% in 1949 to 15.4% in 1957. 2
The Communist Party of China Central Committee issued ‘1978(13) Document’ in March 1978 and guided China’s urbanisation by ‘controlling large cities but developing more small cities and towns’. 3 The focus of development was small cities. For extra-large cities with population over one million, no growth was allowed. For large cities with population over half a million, they needed to limit city size to under one million. Medium-size cities were warned not to develop into large cities. In October 1980, the above policy was amended into ‘control large cities, reasonably develop medium-size cities, and greatly promote small cities’, which was the fundamental strategy of China’s urban development. 4 Under this policy, medium-size cities were allowed to expand. Between 1980 and 1990, the number of cities increased from 223 to 467, urban population increased from 191.40 million to 301.91 million and the urbanisation level rose from 19.4% to 26.4%. In the 1990s, China continued its anti-large-city-growth policy. In April 1990, the policy changed to ‘strictly control large cities, reasonably develop medium-size and small cities’, putting large cities under more controls. 5 Those policies were well implemented in small and medium-sized cities. The number of county-level cities increased dramatically during the 1990s and approximately 50% of the urban population lived in small cities (Xu and Huang, 2011; Zhu, 2000). Small and medium-sized cities on average grew 203% in size from 1978 to 1998. The controls on large cities had some impact, but were not fully enforced. Large cities on average grew by 58% from 1978 to 1998, much slower than small and medium-sized cities. But only 7 out of 27 large cities with more than half a million people in 1978 retained a population less than one million by 1998. The rest failed to follow the policy. Cities larger than one million in 1978 grew on average by 62%. They also failed to fulfill the requirement of the policy which forbade their growth.
An important turning point occurred at the end of the 1990s. In October 1998, The Third Session of the Fifth Central Committee of the CPC explicitly proposed ‘increase the level of urbanisation’ as the urban development policy. 6 Controls on large cities were gradually relaxed. In March 2001, the Ninth National People’s Congress passed the Tenth Five-year Plan that put special efforts to ‘improve the function of regional central cities and develop the areas surrounding large cities’. 7 Coordinated urbanisation became the new urban development policy. The role of large cities in promoting economic development was recognised, many controls were removed, rural–urban migration became easier, and China started to let the market play a more important role in shaping its urban system. Between 2000 and 2010, vast rural–urban migration occurred and urban population increased from 459.06 to 669.78 million. China’s urbanisation level increased from 36.22% to 49.95%. Sixteen urban agglomerations formed, centred around large and super-large cities, and regional planning was initiated to promote their development (Huang et al., 2012).
Figure 1 shows that before 1978, China had a limited number of cities of all sizes. 8 This reflects the anti-urbanisation policy. From 1978 to 1990, the number of super-large, extra-large and large cities increased slightly, while a large number of medium-sized and small cities emerged. It corresponds to the policy of ‘control large cities, reasonably develop medium-size cities, and greatly promote small-size cities’. From 1991 to 2000, the number of super-large and extra-large cities remained almost unchanged, while the number of large cities began to increase. In the first half of the 1990s, the number of small and medium-sized cities grew quickly; in the second half of the 1990s, the number of small cities started to decline and the number of medium-sized cities experienced slower growth. After 2000, China saw increases in numbers of medium-sized, large, extra-large and super-large cities. This reflects the growth control relaxation on large cities.

Number of cities of different sizes in China, 1949–2009. Different size categories are defined according to non-agricultural population in the city proper (Chen et al., 2013). See detailed definition in footnote 8. The data before 1984 only had a category of non-agricultural population over 1 million. Therefore, we cannot distinguish between the super-large and extra-large cities and we define all those cities to be extra-large. After 2009, data on non-agricultural population in the city proper are no longer available.
Data
This paper used the unbalanced panel data of the municipal, prefectural and county-level cities in China, 1949–2012. The number of cities varied across years because new cities emerged.
Urban population from 1984 to 2012 was obtained from the China City Statistical Yearbooks (Bureau of Statistics of China 1985–2013a). The data before 1985 were obtained from Fifty Years of Cities in New China (Bureau of Statistics of China, 1999b). 9 We cross-checked the two sources using the two years (1985 and 1988) that they both contain. The two sources match each other in their reported urban population, defined as registered (Hukou) population in the city proper, in 94.5% city-year observations. We concluded pooling data from these two sources will not cause problems.
Some cities experienced administrative changes over the studied periods. Cities were identified by the same geographical boundary, whenever feasible. For example, a city that upgraded from a county-level city to a prefectural-level city without territorial change was regarded as the same city.
The definition of ‘city’ in this paper is worthy of discussion. Ideally, ‘cities’ used in fitting the rank-size rule should be economic cities, defined by the elevated population densities. But such data are not available in China. ‘City’ in this paper is defined as the core districts of an administrative ‘city’– the city proper. The suburbs and surrounding counties are excluded. They are part of the administrative city but contain some or even large portions ruralness in character. Excluding them mitigates the bias caused by using administrative data to fit an economic law. This city definition corresponds well to the city defined in China’s urban development policies. The policies were imposed on administrative cities and they focused on controlling population in the city proper (see Bureau of Statistics of China (1985—2013a)).
Another issue is the measurement of city size. Ideally, city size should be measured by the resident population. But the resident population for each city is only available from the census, which was carried out once every decade. As a result, we used the registered population to measure city size. Though with clear limitations, the registered population is still the best population data available on a yearly basis over long time spans. The registered population underestimates residents in large cities and overestimates in out-migrating cities. It is therefore likely to cause an upward bias of the Zipf’s exponent. The differences between the two populations have increased over the studied periods with the improvement of mobility in China, and the bias may grow as well. Fortunately, after 2005, China’s National Bureau of Statistics required all cities to use the resident population in calculating per capita GDP. We have therefore been able to recover a short time span of resident populations from 2005 to 2010. Using those resident population data, we evaluated the bias in section ‘Registered population versus resident population’. The results show that larger cities, as expected, tend to have larger gaps between the two populations, but our estimated Zipf’s exponents are not severely biased, even in the most recent years.
Figure 2 displays China’s urbanisation rates, calculated by urban population divided by total population, 1949–2012. Before 1978, China’s urbanisation rate remained low. It took off after 1978. It grew faster after the late 1990s, and reached 52.57% in 2012.
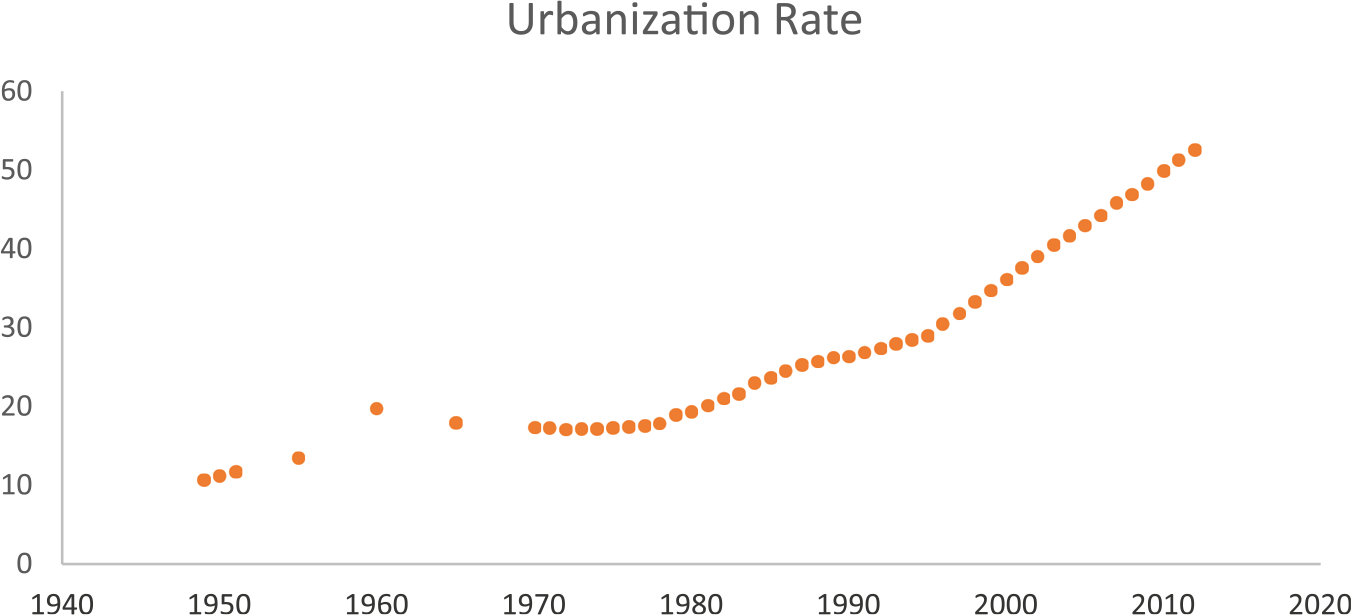
Urbanisation rates in China. Urbanisation rate is urban population divided by total population. Urban population is measure by the registered population before 1981, the resident population for the census years (1982, 1990, 2000 and 2010), and projected resident population based on a small census sample in the remaining years.
Zipf’s law for Chinese cities: 1949–2012
Zipf’s exponent for Chinese cities, 1949–2012
We used the following equation to estimate the Zipf’s exponent every year:

where Ri is the rank of the ith city, Si is the city size,
Figure 3 presents the estimated Zipf’s exponents from 1949 to 2012. Two main findings are observed. First, the Zipf’s exponents increased then decreased. The Zipf’s exponents increased from 0.8679 in 1949 to 1.2187 in 1999. The difference is statistically significant at the 5% level under a wald-test, suggesting city size became more evenly distributed. The trend reversed in 2000 and the Zipf’s exponents started to decline, from 1.2187 in 1999 to 1.1443 in 2012. The difference is significant at the 5% level, indicating Chinese cities were diverging in size and became less evenly distributed.

The Zipf’s exponent for Chinese cities: 1949–2012. The shaded area indicates the 95% confidence interval.
Our results are consistent with previous studies, but more complete in that we revealed the reversal of the trend after 2000. Previous studies also found that the Zipf’s exponent in China increased in certain time periods before 2000: Song and Zhang (2002) 1991–1998; Anderson and Ge (2005) 1978–1999; Xu and Zhu (2009) and Gangopadhyay and Basu (2013) 1990–2000. But they did not reveal the reversed trend after 2000 because they did not include data after 2000. Li and Sui (2013) identified 1996 as the turning point from which the Zipf’s exponent started to decrease using the largest 70% of cities in China. The difference in the turning point is caused by their exclusion of small cities.
The findings reflect China’s urban development strategies. The Zipf’s exponents started to increase after the end of the anti-urbanisation policy. They kept increasing during 1978–1999, when the policies promoted the growth of small cities and controlled the growth of large cities (which is expected to even the city size distribution). The trend reversed after 2000 when the growth control on large cities was relaxed.
Second, the Zipf’s exponents were at first significantly less than one, then equal to, and finally greater than one. From 1949 to 1965, the Zipf’s exponents were significantly less than one at the 5% level under a t-test, meaning the city size distribution was more uneven than the rank-size rule predicts. During 1978 to 1992, the Zipf’s exponents were not significantly different from one. The rank-size rule held. After 1993, the Zipf’s exponents were significantly larger than one. Song and Zhang (2002) also found the Zipf’s exponent in 1998 to be significantly larger than one, but significantly smaller than one in 1991. The difference is caused by their measuring city size with non-agricultural population in the city proper. 10 The more even city size distribution after 1993 could indicate Chinese large cities having unexhausted agglomeration economies, because of strict growth control. Some studies provided evidence that Chinese cities tend to be smaller than their optimal sizes. Wang and Xia (1999) found that China’s large cities on average had unexhausted agglomeration effects during 1989–1996. Au and Henderson (2006) concluded the same for 1990–1997. These two papers covered the time frame corresponding to the ‘strictly control large cities, reasonably develop medium-size and small cities’ policy during 1990–1999. The policy controlled the growth of large cities and may have resulted in the unrealised agglomeration economies. In addition, Wang (2010) found cities in China are undersized compared with cities in other countries during 2005–2007.
The variations in the Zipf’s exponents reveal the inequality change of the city size distribution but not where the change comes from. To see whether and how the specific distribution variations correspond to the urban development policies, we further examined China’s city size distribution in logarithmic form in 1978, 1988, 1998 and 2008 in Figure 4, using non-parametric kernel estimation. From 1978 to 1988, change in the city size distribution was dominated by the emergence of small and medium-sized cities, while the relative number of large cities declined. From 1988 to 1998, the change was driven by small cities developing into medium-sized cities and medium-sized cities developing into large cities. The distribution density of large cities grew despite the government control, although the very right tail grew little indicating extra- and super-large cities may be tightly controlled. From 1998 to 2008, the distribution changed little. There were some slight declines in the relative number of small and medium cities and some increases in that of large cities.

China’s city size distribution in selected years.
Robustness tests
Previous studies suggested truncation plays an important role in Zipf’s law (Li and Sui, 2013). We carried out robustness tests to address the truncation issue using three different thresholds – the fixed number threshold, the fixed size threshold, and the fixed percentage threshold. The fixed number threshold uses a fixed number of cities to fit Zipf’s law. We used 260 cities with complete data since 1984. The fixed size threshold excludes cities below a minimum population. We used two minimum sizes commonly applied in previous studies: 80,000 (Xu and Zhu, 2009) and 100,000 (Anderson and Ge, 2005; Li and Sui, 2013). The fixed percentage threshold uses a fixed percentage of the largest cities. We used the largest 85% cities every year, as recommended by Li and Sui (2013). Table 1 present these results and their comparison with the previous results without truncation.
A comparison of results using different thresholds.

Notes: + indicates the coefficient is significantly different from 1, at the 5% level. * indicates the coefficient is significantly different from the no-threshold result, at the 5% level. The values in bold show the turning point from which the Zipf’s exponent started to decline. As mentioned in the paper, they all lay in the interval of [1998, 2001]. Sample size in parentheses.
Although the absolute magnitude of the Zipf’s exponents changed significantly with different thresholds, several important general patterns remained similar. First, the rank-size rule in general did not hold. The Zipf’s exponents were significantly larger than one for no less than ten years in any of the results. Second, the Zipf’s exponents increased and then decreased. The general trend was clear and robust. Third, the turning point was closely related to the time of the policy change. The turning point from which the Zipf’s exponents started to decline changed slightly across different thresholds, but all fell in the interval [1998, 2001]. As mentioned in the Introduction, 1998 to 2001 was exactly the time period when a series of policies were implemented that shifted China’s urban development policies from ‘strictly control large cities, reasonably develop medium-size and small cities’ to ‘coordinated urbanisation’.
Registered population versus resident population
As mentioned above, using registered population to measure city size causes biases. We used the recovered short period of resident population to evaluate how serious the biases were. The resident population was recovered using GDP divided by per capita GDP, because China’s National Bureau of Statistics required all cities to use resident population to calculate per capita GDP since 2005. 11
Table 2 shows the comparison of the two populations. In general, as expected, gaps between the two populations were greater in larger cities. But many small cities’ resident populations also accounted for more than 1.5 times the registered population because it only takes a small increase in population to double their sizes. Differences in the two populations shown in Table 2 do not necessarily imply severe biases in the estimated Zipf’s exponents. To evaluate the biases, we estimated the Zipf’s exponents using the recovered resident population and compared them with the previous results using the registered population in Table 3. In panel A, we used unmatched samples, meaning that cities used in estimating the two Zipf’s exponents in the same year are different. Each was estimated with all cities having information on the relevant population. Panel A speaks to the situation that if a researcher used the resident population data to evaluate the Zipf’s exponents in China, whether their results would be different from ours. In panel B, we used a matched sample, a subset of cities with both registered and resident populations. Panel B excluded the possibility that the similarities in the two Zipf’s exponents in panel A were caused by the differences in sample size or sample composition. Results in the two panels are consistent. First, as expected, the Zipf’s exponents estimated with the resident data are, in most cases, smaller. For example, in panel A, in 2010, the Zipf’s exponent was 1.156 with the resident population, and 1.169 with the registered population. Second, except for 2005, the two Zipf’s exponents were not significantly different from each other, indicating the registered population did not lead to severe biases.
Registered population versus resident population, 2005–2010.
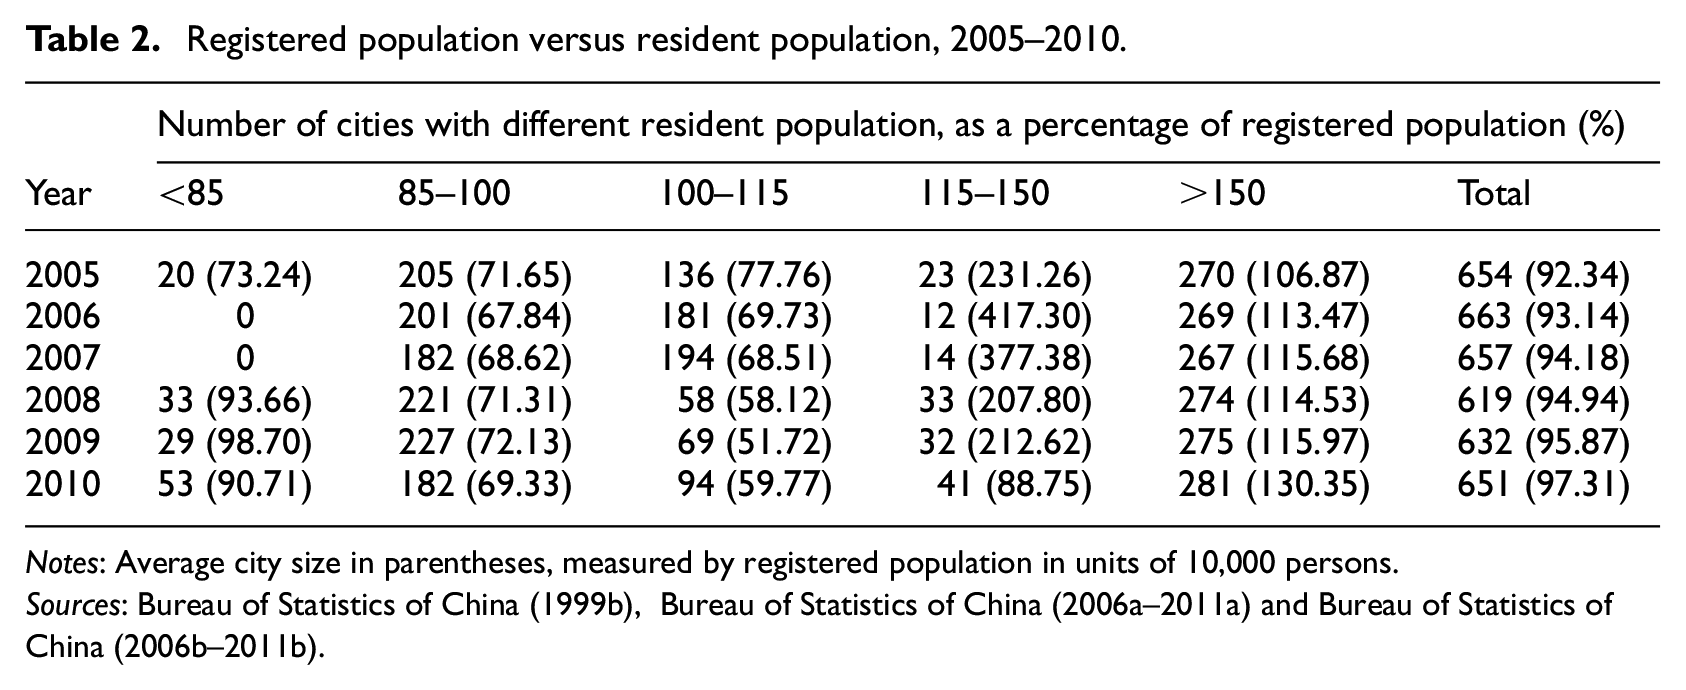
Notes: Average city size in parentheses, measured by registered population in units of 10,000 persons.
Sources: Bureau of Statistics of China (1999b), Bureau of Statistics of China (2006a—2011a) and Bureau of Statistics of China (2006b—2011b).
Zipf’s exponent estimated with registered population versus resident population.

Notes: In panel B, we used a matched sample, meaning that only cities with both information of registered and resident populations were included. Panel B ensures the differences or similarities between Zipf’s exponents estimated with the two populations were not caused by the differences in sample size or sample composition.
Sources: Bureau of Statistics of China (1999b), Bureau of Statistics of China (2006a—2011a) and Bureau of Statistics of China (2006b—2011b).
Do policies explain the dynamics of the Zipf’s exponents?
Equation (1) allows for flexible relationships between
Two sets of restrictions were considered. First, years regulated by the same urban development policy share the same Zipf’s exponents. The equation is specified as follows:
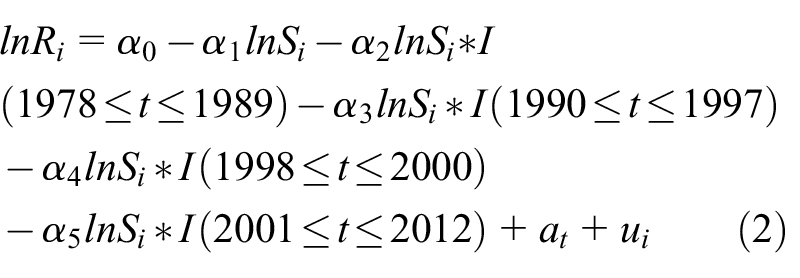
where I() denotes an indicator function that equals 1 if the inequality in the parentheses holds, and equals 0 otherwise.
Second, years regulated by the same urban development policy have different Zipf’s exponents, but share the same growth rate. Policies change both the level and the growth rate of the Zipf’s exponents. The equation is as follows:
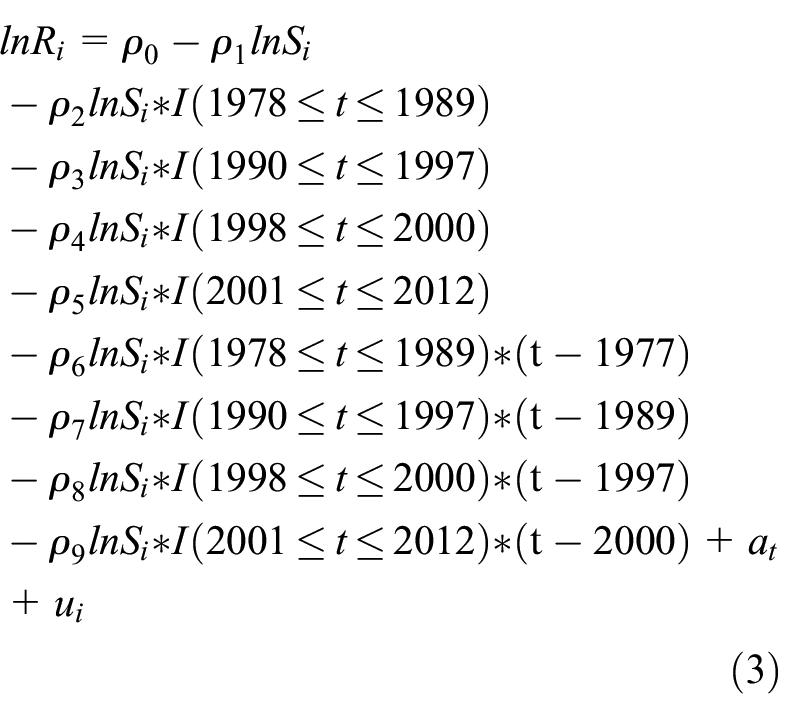
The interaction terms correspond to the durations of the policies, conditional on that the policies were in place. For example,
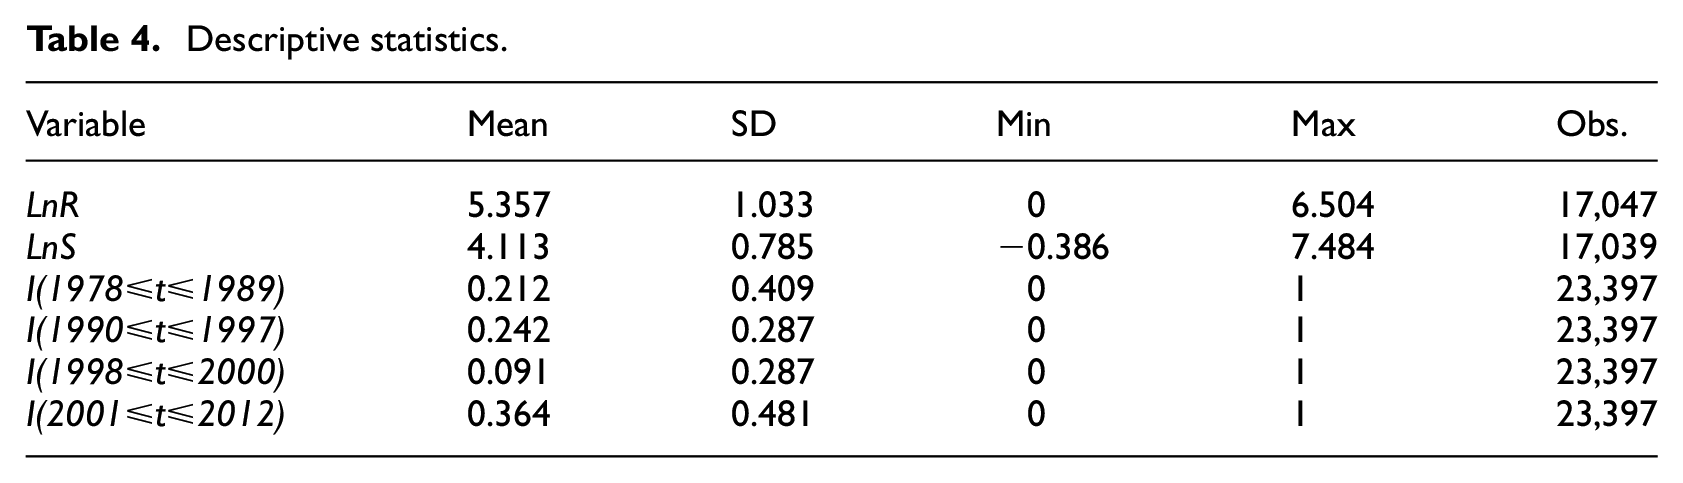
Table 4 shows the descriptive statistics and Table 5 shows the results. Column (1) in Table 5 estimates equation (2). The three major waves of urban development policies after 1978, excluding the transition period, significantly upshifted the Zipf’s exponents and the city size distribution became more and more even. The differences between the coefficients for every two consecutive policies were significantly different under F tests at the 5% level. The transition period had significantly smaller Zipf’s exponents than the periods before and after it, but the coefficient was not significantly different from that of 1978–1989.
Descriptive statistics.
Restricted models on Zipf’s exponent.

Notes: Column (1) reports the estimated
Column (2) in Table 5 estimates equation (3). The results again confirm that policies during 1978–1989, 1990–1997 and 2001–2012, upshifted the Zipf’s exponents. The transition period, 1998–2000, also upshifted the Zipf’s exponents than the previous period in this model, and its coefficient was insignificantly different from that of the 2001–2012. The durations of the ‘control large cities’ policies during 1978–1989 and 1990–1997, conditional on the implementation of the policies, upshifted the Zipf’s exponents, although insignificantly so during 1978 to 1989. On the contrary, the Zipf’s exponents significantly decreased with the duration of the transition period and the ‘coordinated urbanisation’ policy, conditional on the policy implementation. These results indicate that policies took time to exhibit larger effects. The longer the nation had been under ‘control large cities’ policies, the more even the city size distribution was, while the opposite was true with the ‘coordinated urbanisation’ policy.
Table 6 compares the results of equations (1)–(3). Equation (1) is fully interacted, in the sense that it runs a separate regression for each year. Equations (2)–(3) pool the data across years and introduce a variety of intermediate strategies to account for differences across years. They are restricted versions of equation (1). Column (2) and (3) of Table 6 show the implied Zipf’s exponents of the estimated equations (2) and (3) in a specific year, and whether they are significantly different from the results of equation (1). For example, the implied Zipf’s exponent of equation (2) for 1990 equals
A comparison of results from equations (1)–(3).

Notes: * indicates the coefficient is statistically significant from the coefficient of equation (1), at the 5% level.
Conclusions
This paper examined the link between China’s urban development policies and the city size distribution. Since 1949, China’s urban development strategies have experienced dramatic changes, from anti-urbanisation before the reform, to anti-large-city-development during 1978 to the end of 1990s and coordinated urbanisation after 2001. With the changes of urban development policies, China experienced variations in the pace of urbanisation and in the Zipf’s exponents.
Using city-level data from 1949 to 2012, this paper investigated China’s city size distribution via Zipf’s law. Based on the Zipf’s exponent, we found that China’s city size distribution became more and more even before 1999, when the urban development policies restricted the growth of large cities but promoted the growth of medium and small cities. This pattern reversed after 2000, when the urban development policies shifted toward a more market-oriented trajectory. City sizes started to diverge and the rank-size rule may eventually return. Our results indicate that China’s urban development policies exhibited an important impact on city size distribution.
Footnotes
Funding
This research received grants from Lincoln Institute of Land Policy and Tianjin Higher Education Innovation Team Program (grant number TD12-5063).