




Abstract
This study proposes an alternative to the conventional entropy-based land use mix index, which is generally used to measure the diversity of land use. Pedestrian volume was selected as the dependent variable as it represents the vitality of districts, which many recent urban studies now consider important. The study investigates an entropy-based weighted land use mix index, which is weighted by different land use types. For the index, different areas are needed to generate a unit of pedestrian volume, whose measure is m2/person/day. The study demonstrates that this alternative is more effective than the existing conventionally used entropy-based land use mix index for explaining pedestrian volume. The research confirms that the conventionally used entropy-based land use mix index can have a positive or negative impact depending on the land use characteristics of the survey points because the conventionally used entropy-based land use mix index has a non-linear relationship with pedestrian volume. By analysing 9727 surveyed locations of pedestrian volume in Seoul, Korea, the study demonstrates that the weighted land use mix index, rather than the conventionally used entropy-based land use mix index, can improve the explanatory power of the estimation model for the relationship between pedestrian volume and built environments, showing consistent results throughout the empirical analysis. In future built-environment studies, the utility of the weighted land use mix index is expected to improve if studies include how to find the accurate weighting of the land use in estimating the pedestrian volume.
Keywords
Introduction
Recent trends in sustainable development demonstrate that land use mix (LUM) is considered critical today in urban planning and urban design. Planning arguments, which include smart growth, new urbanism, and transit-oriented development, emphasize the importance of land use diversity as a central principle. The issue of how to measure LUM is practical as well as important in evaluating whether the concepts are applicable. If researchers and/or planners are unable to estimate the effects of land use diversity in their analysis and planning, the mix of land use arguments may be vulnerable to criticism.
The entropy-based LUM index established by Cervero and Kockelman (1997) has been the most representative index used to measure land use diversity in built environment studies, including urban planning and design, transportation planning, and health studies. However, several previous studies have pointed to the limits of this index (e.g. Cerin et al., 2007; Duncan et al., 2010; Lee and Koo, 2013; Yoon et al., 2014; Yun and Choi, 2013). Some analyses using the index have not presented statistically positive effects of LUM on pedestrian volume and, in certain cases, have even shown a negative relationship.
Im and Choi (2019 found that the LUM index had a critical limitation beyond those already discussed by Kockelman (1996), Brown et al. (2009), Hess et al. (2001), and others. They confirmed that the conventional entropy-based land use mix index (hereafter, CLUM) has an n-shaped relationship with pedestrian volume and that, in the case of the sample from the whole city, the explanatory power of pedestrian volume increased in the empirical model when using both CLUM and CLUM squared rather than only using CLUM. However, they only suggested the use of the CLUM and did not suggest an advanced alternative. Based on the general fact that different land use generates varied walking volume, this study develops and proposes an index that corrects and complements the CLUM.
To propose an alternative index, the study examines the origin and scope of the CLUM and confirms the limits of the index. This study focuses on the walking generation unit (WGU) by building use 1 area as a link between pedestrian volume and land use diversity. Because each building use requires a different area to generate one unit of pedestrian volume, this application can increase the likelihood of estimating pedestrian volume in an area with mixed land use. This study presents an entropy-based weighted land use mix index (WLUM) and applies different weighted values by WGU of each land use. The pedestrian volume estimation models using CLUM and WLUM are developed for the high-density and mixed land use city, Seoul, South Korea. This study verifies that WLUM is a more efficient indicator by examining the direction of the coefficient values of the index and the explanatory power of the empirical models. The suggested WLUM will help researchers more readily understand the effects of land use diversity and can be applied to practical plans.
Literature review
Land use diversity and the CLUM
According to recent urban planning principles, appropriate LUM will reduce car trips, improve people’s health, encourage street vitality, and increase property value (e.g. Cervero and Duncan, 2003; Diao and Ferreira, 2010, 2014; Forsyth et al., 2008; Frank et al., 2005; Handy et al., 2006; Sung et al., 2015; Zhang, 2004). While traditional Euclidian zoning and modernism-based development have facilitated land use segregation, many cities have been attempting to promote a LUM. Measuring the mix of land use informs the understanding of the effects of such diversity as well as of establishing urban policies and planning. Cervero and Kockelman (1997) developed an entropy-based land use mix index or LUM (here, CLUM) based on the entropy concept (see equation (1)). This is a typical indicator used for measuring LUM (Ewing and Cervero, 2010; Song et al., 2013)

It is commonly expected that there will be a positive (+) relationship between CLUM and the dependent variable of built environments. Im and Choi (2019: 7–8), however, demonstrated that the positive (+) relationship between CLUM and people’s behaviour mainly occurred in residential areas, and the association is limited when CLUM values are around 1. They also empirically demonstrated that the relationship between CLUM and pedestrian volume was negative (−) in commercial areas.
Pedestrian volume, CLUM, and the limitation of the index
Over 50 years ago, Jacobs (1961) suggested land use diversity as a means to promote the vitality of districts. However, it was not until the last decade that research activity increased in the areas of the diversity of land use and the vitality of streets. Recently, Gehl and Svarre (2013) showed how pedestrian volume can be used as a representative index to measure district liveability. In fact, studies that seek to determine the factors that affect pedestrian volume only began to be published in the last decade (e.g. Hajrsouliha and Yin, 2015; Lee and Koo, 2013; Liu and Griswold, 2009; Yun and Choi, 2013). In these studies, CLUM was used as the index in most of the studies that examined the effect of LUM on pedestrian volume. However, these pedestrian volume studies do not discuss the limitations of the index.
Kockelman (1996: 49) stated that ‘the index of land use balance, entropy, remains constant when distinct land use types remain in constant relative proportions; yet mixing or integration of land uses can change dramatically’, but this topic has not been discussed in depth. Although there are studies that have attended to the issue of CLUM, these focus solely on geometric points and have suggested only a fragmentary alternative. As such, it has been difficult to overcome the fundamental limitations of their alternatives to CLUM (e.g. Brown et al., 2009; Hess et al., 2001). In addition, health studies have concentrated on the number of land use categories, namely k in equation (1). Other health studies have focused on specific land use categories that should be excluded when calculating CLUM because they do not affect people’s behaviour (e.g. Cerin et al., 2007; Christian et al., 2011; Duncan et al., 2010; Forsyth et al., 2008).
Most previous studies analysing the characteristics of CLUM have not discussed the fundamental characteristics of the index. However, Im and Choi (2019) showed the non-linear characteristic of CLUM. An example of this is shown in Figure 1, in which point ‘a’ comprises a mixture of 80% residential and 20% commercial use and point ‘b’ comprises 80% commercial and 20% residential use, with both equal to 0.72 of the CLUM value. Kockelman (1996), Brown et al. (2009), and Hess et al. (2001) all noted this issue with CLUM but focused only on the proportion of 20:80 or on the fact that points ‘a’ and ‘b’ had the same CLUM value.
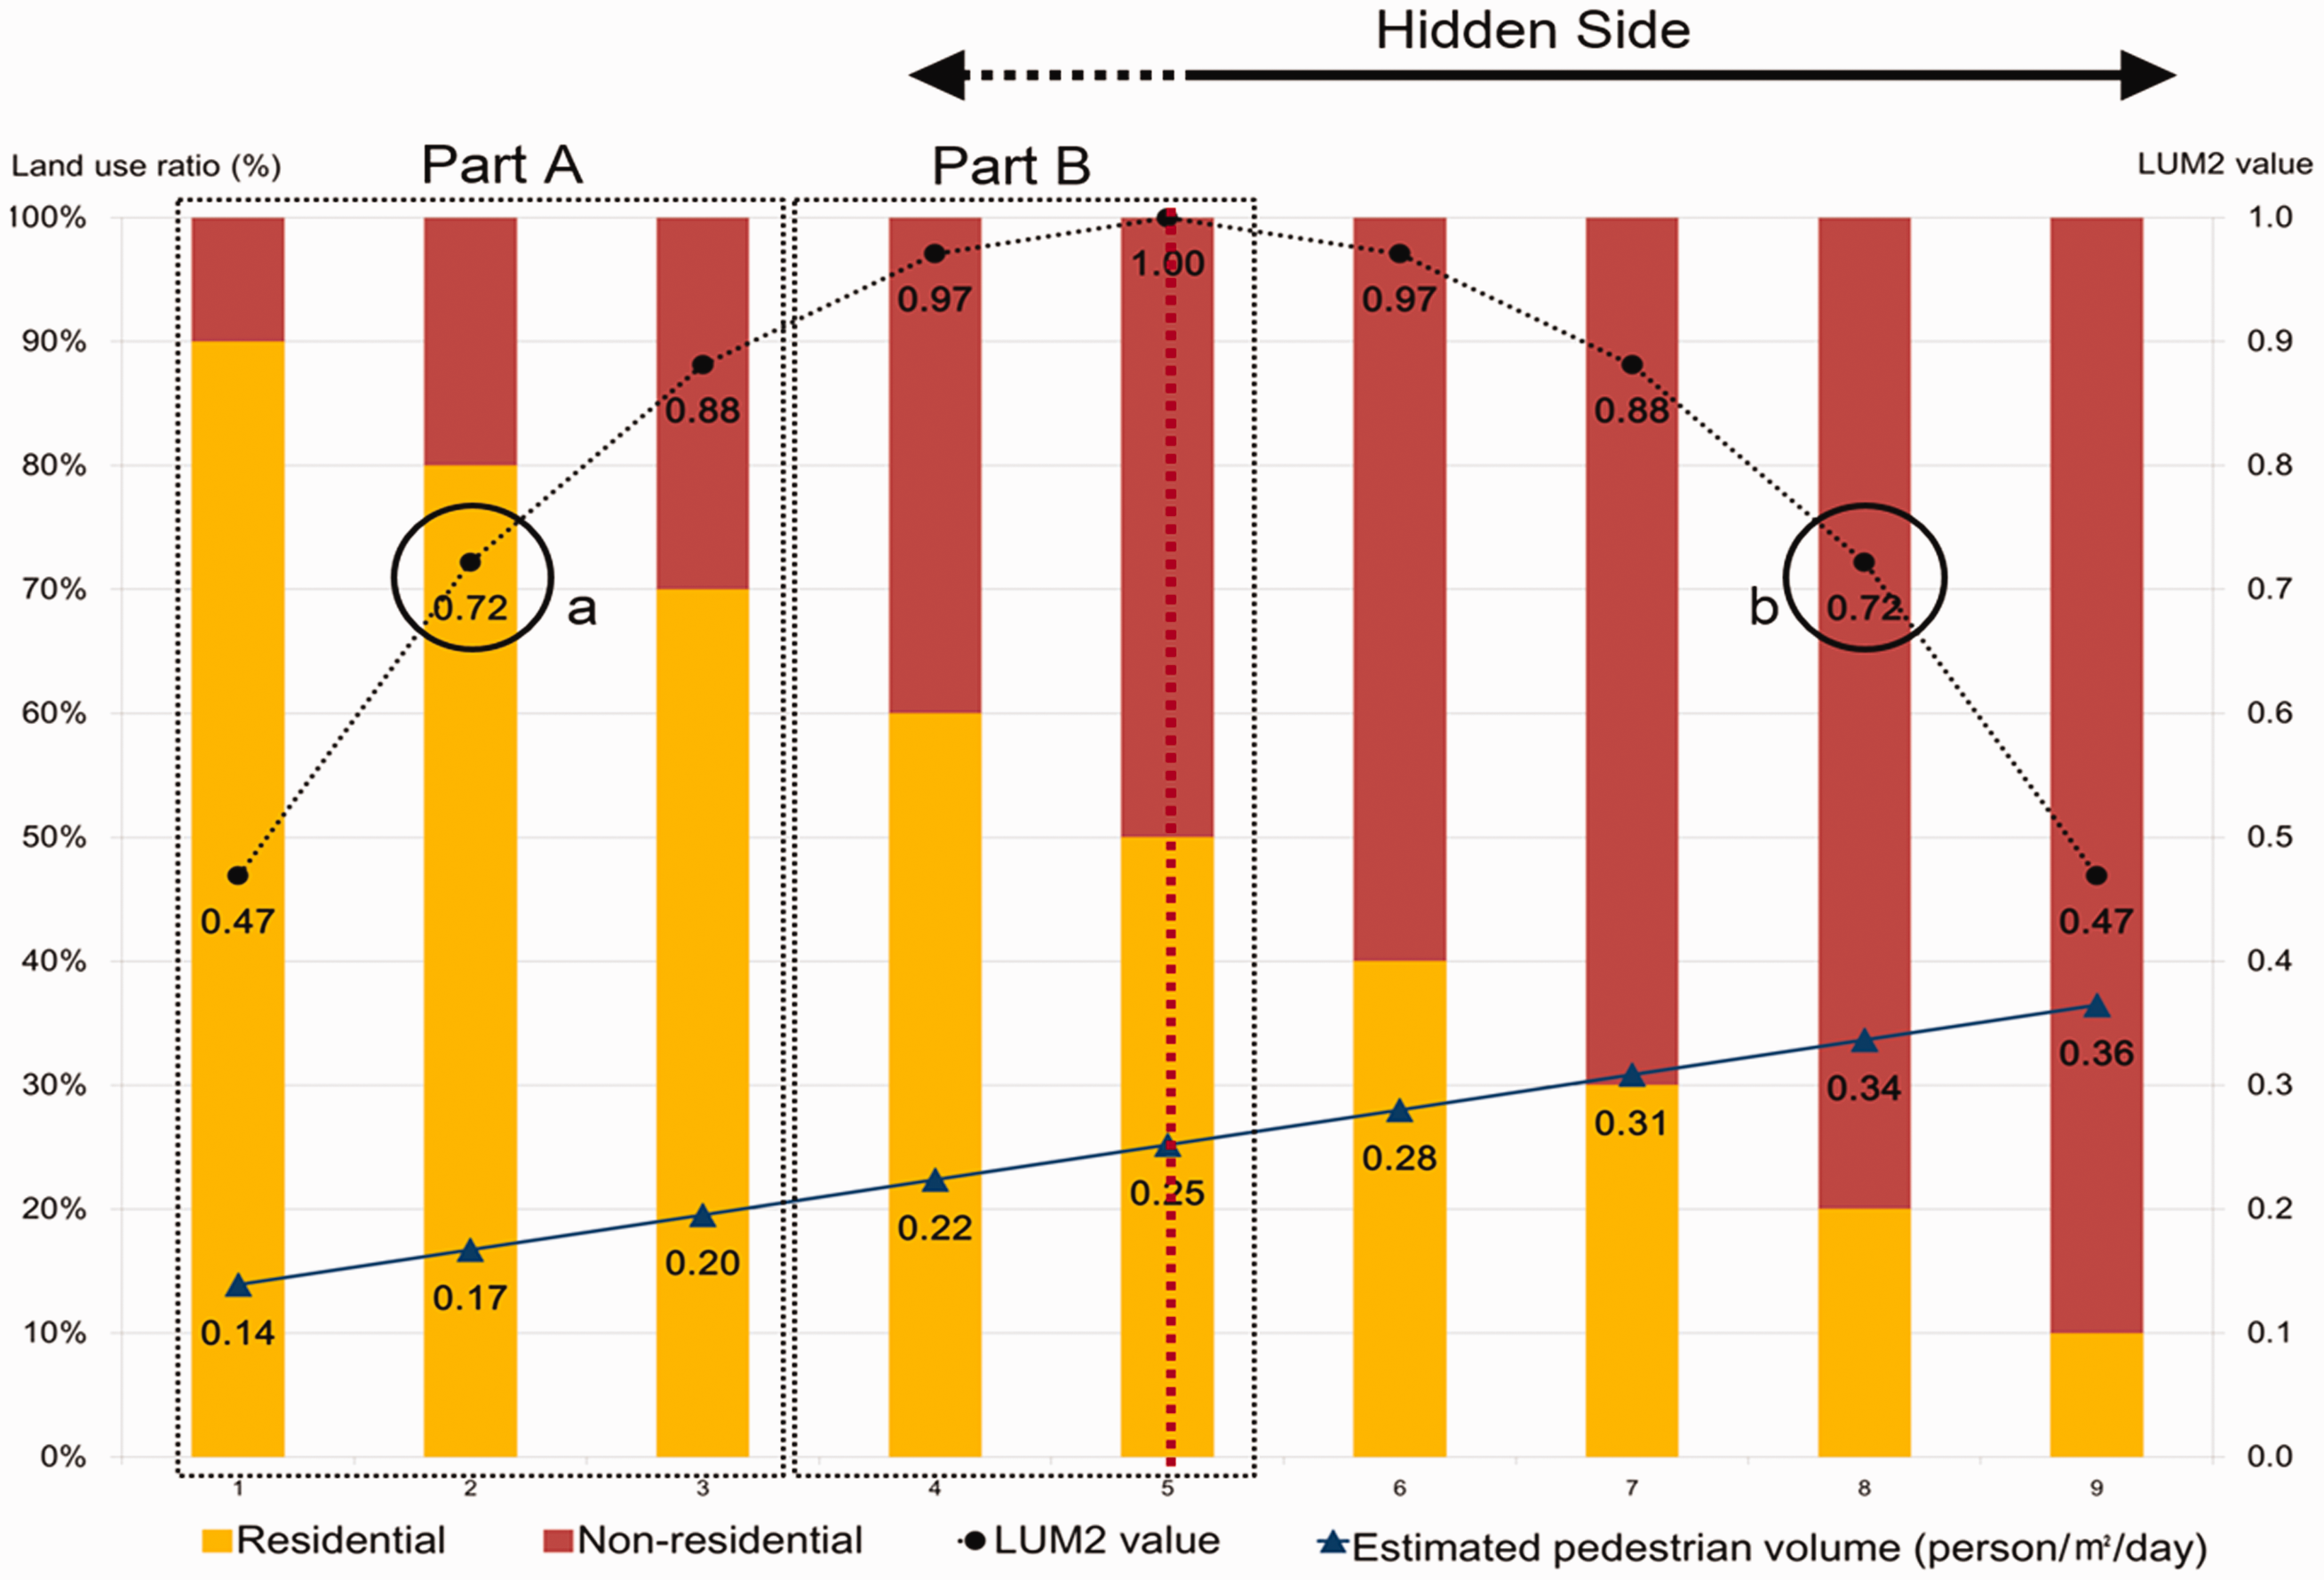
The relationship between CLUM2 index and estimated pedestrian volume. Source: Im and Choi (2019) revised. LUM: land use mix.
This issue is even more evident when CLUM2 is plotted in linear form in Figure 1. The CLUM2 value is the dotted line and the quadratic function curve: the form of the ‘n’ shape for CLUM2 makes a fixed relationship with the dependent variable difficult (Im and Choi, 2019). On the left side of the vertex in Figure 1, CLUM2 and the estimated pedestrian volume have a positive (+) relationship, but on the right side, they have a negative (−) relationship. 3
Korea Transport Surveys and DB Construction Projects (Korea Transport Institute, 2001) show that different pedestrian volumes are generated through various building use categories: residential is 0.11 person/m2/day, commercial is 0.85/m2/day, office is 0.35/m2/day, and other is 0.33/m2/day. Applying these values for CLUM2 in residential and non-residential uses, one can draw a straight line, which is similar to the one that can be drawn for estimated pedestrian volume in Figure 1 (Im and Choi, 2019). This straight line serves as a logical image of the pedestrian volume created when mixing residential and non-residential uses, and it reconfirms a limitation of CLUM.
Im and Choi (2019) show how using CLUM4 and CLUM42 together in the empirical estimation model for pedestrian volume is logical. CLUM generates a positive pedestrian volume (+) coefficient, and CLUM42 generates a negative (−) one. However, the researchers overlook the possibility of changes in the meaning of CLUM, reflecting various land use categories with different WGUs. They do not consider the weighting of pedestrian volumes generated in different use scenarios.
Methodology and data
Developing WLUM
The issue of weighting each land use to overcome the limitation of CLUM was discussed by Kockelman (1996: 49), who was the first to suggest the standardization of the equation in the entropy-based model. She recommended that ‘one feasible weighting scheme might depend on deviations from the regional balance of proportions across the J use types’. However, there are no extant studies that reflect weighting values. Perhaps this is because previous studies have been based on heuristic beliefs that the CLUM would have a positive (+) relationship with the dependent variable or that biased samples come from largely residential areas (Im and Choi, 2019).
This study proposes a WLUM, which modifies the CLUM, to reflect the weighted value of different land use categories. When different land uses are classified into n uses, each classification needs a different area to make a unit of pedestrian volume. Alternatively, each use generates a different pedestrian volume per unit area, and it can be deduced that the WGUs can be created.
There are two ways to calculate the WGU: in one, the denominator is the area of use, and in the other, the denominator is the number of pedestrians. Korea Transport Surveys and DB Construction Projects (Korea Transport Institute, 2001) provide a survey of the weights for the former, and the measured value is person/m2/day. If we use the weights of the data as is, the weighted proportion of residential:commercial:business:other use is 1:7.68:3.21:3.05. Im and Choi (2019) called the former WGU, but when WLUM is calculated using the former proportions, the values logically show a negative (−) relationship to pedestrian volume and can create unnecessary confusion, because the general public would understand that LUM in a city has a positive relationship to pedestrian volume. However, if the number of pedestrians is the denominator, a positive (+) relationship to pedestrian volume is shown. Based on the concept of weighting, the latter is also right. The pedestrian denominator’s unit is m2/person/day. The weights for residential:commercial:business:other use are then 1:0.13:0.31:0.33. Therefore, this study used the weighted value in which the denominator is the number of pedestrians.
For ease of understanding, different unit areas can be estimated for each building use to represent one pedestrian WGU. If unit values are applied, equation (1) is transformed into equation (2). We can deduce that if each land use is classified into n, different values for pedestrians per unit area are accommodated, which will appear in the form of WGU. Equation (2) refers to WLUM as a dependent variable, and the weighting is based on the amount of pedestrian WGUs for each building use

Equation (2) proposes a biased ‘n’ shape rather than a general symmetrical ‘n’ shape for the CLUM by including the weights of the pedestrian WGU amounts for each use in the entropy formula. The relation between WLUM and the amount of walking will be mostly positive (+), although CLUM has a non-linear relationship with the estimated pedestrian volume. If the WGU proposition for residential and non-residential is set to 1:0.248, reflecting the data from Korea Transport Surveys and DB Construction Projects (2001), the WLUM2 value graph can be added to Figure 1 with CLUM2 and estimated pedestrian volume, as shown in Figure 2.
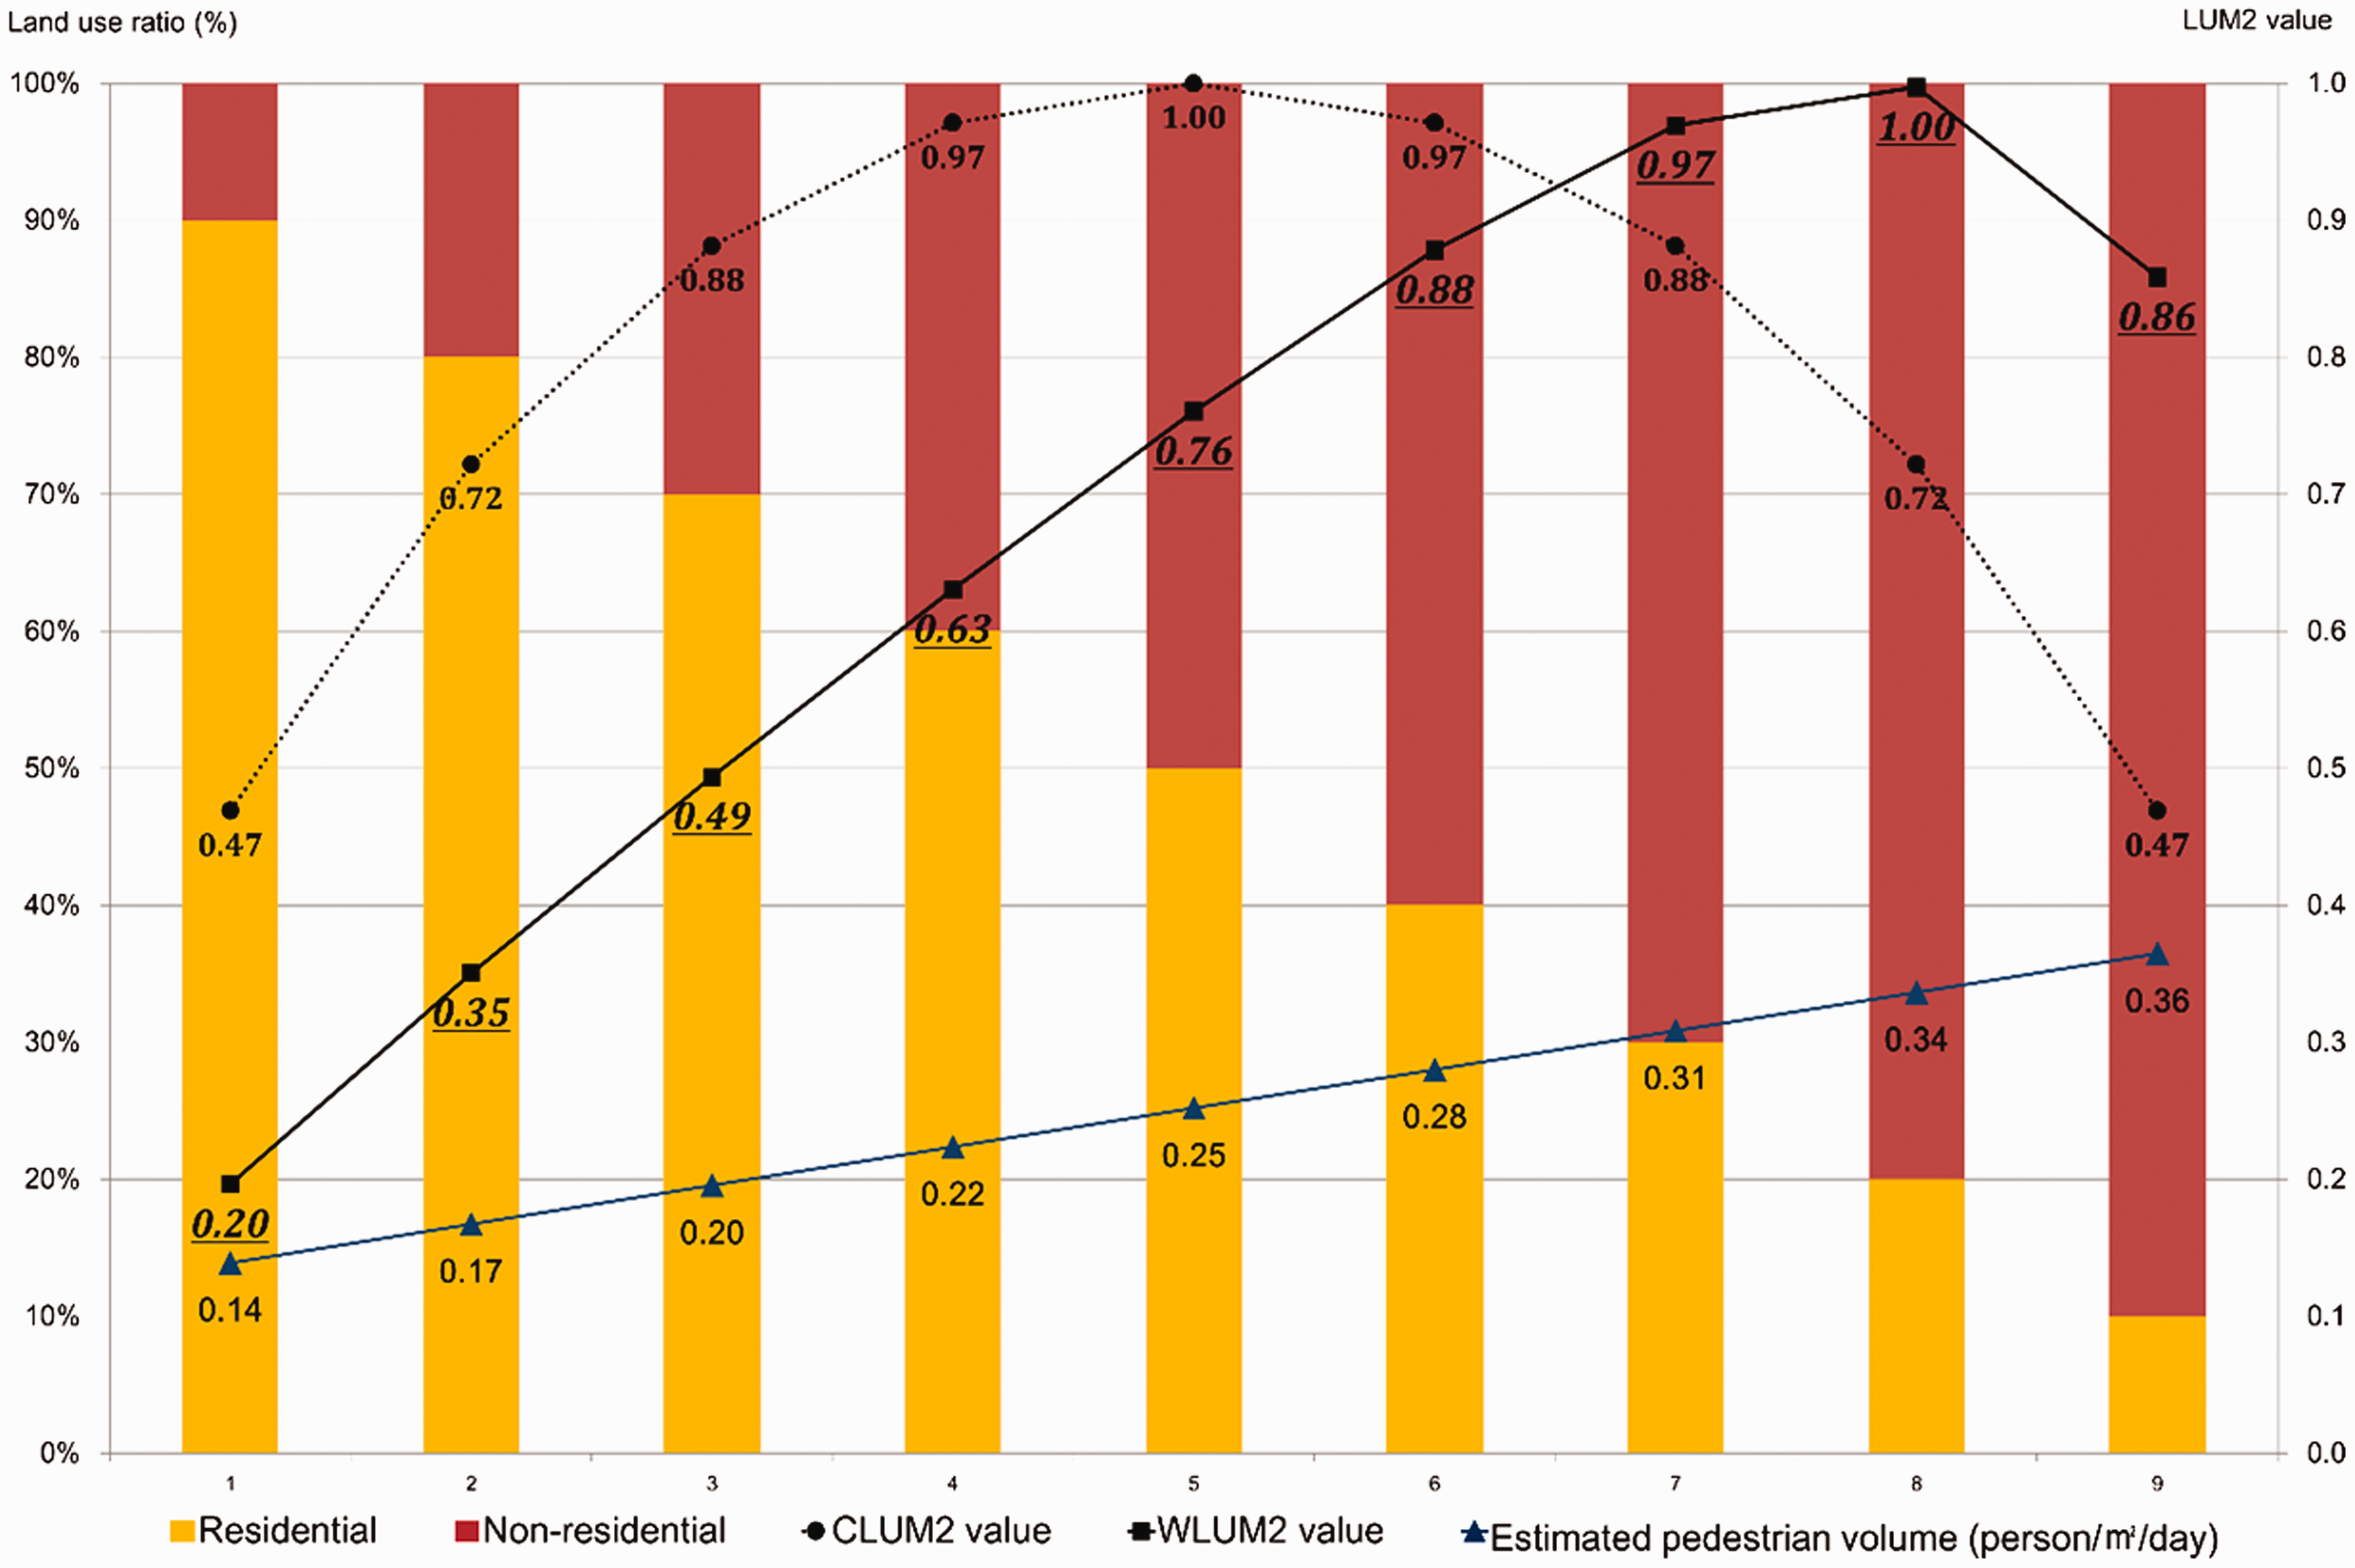
LUM, CLUM2, WLUM2, and estimated pedestrian volume. CLUM: conventional entropy-based land use mix index; LUM: land use mix; WLUM: weighted land use mix index. Note: WLUM4 weight (residential:non-residential = 1:0.248).
The slope of the WLUM depends on the value of the weighted value (Wi). If the Wi of each land use approaches 1, the shape of WLUM becomes similar to that of CLUM. In other words, if the difference in the weighted values among the land uses increases, the negative (−) relationship with the pedestrian volume, shown on the WLUM graph’s right side, decreases. Based on the fact that each land use has different WGUs, WLUM can provide a better explanation for pedestrian volume than can the CLUM (see Figure 2).
Seoul, data set, and initial findings
Seoul is a city with a use mix characteristic of high density, which many urban studies have focused on recently (Jang et al., 2017; Sung and Choi, 2017). Its size is 605.2 km2 and its population is 10,204,057 (Seoul Metropolitan Government, 2017). The public subway and bus networks are well connected and have high utilization rates (Pan, 2013). As the metropolitan government researched the city’s pedestrian volume at a wide range of surveyed locations in order to identify how to promote walking and street activity, it offered an appropriate research opportunity to analyse the relationship between pedestrian volume and LUM.
The data for empirical analysis are based on the pedestrian survey conducted by the Seoul Metropolitan Government in 2009 (hereafter, the 2009 pedestrian volume survey). The survey included 10,000 locations in diverse parts of the city. Survey spots were randomly selected from areas where there was a possibility for a certain amount of walking. The pedestrian volume of each survey spot was studied during weekdays and weekends. The physical environment at the street level (street-level design elements such as road width, survey spot slope, the presence of braille blocks, and pedestrian-only streets) within 50 m of every spot was listed.
The dependent variable for the analysis was set as the weekday average pedestrian volume at the survey spots. Information on independent variables affecting the number of pedestrians was obtained from previous studies (e.g. Hajrsouliha and Yin, 2015; Lee and Koo, 2013; Liu and Griswold, 2009; Yun and Choi, 2013). In some previous studies, socioeconomic factors such as the numbers of workers and residents were considered as independent variables for pedestrian volume estimation. This study mainly employed independent variables for the built environment to analyse the urban planning and design objects that are subject to manipulation. Independent variables were divided into LUM (diversity), street-level design elements, accessibility, and regional and land use characteristics.
Street-level design elements in this study were collected from the 2009 pedestrian volume survey. Sidewalk width and numbers of road lanes would be expected to have positive effects on pedestrian volume, as they indicate high levels of traffic or use. Pedestrian-only streets, street furniture, and braille block would be expected to have a positive impact on volume since they suggest levels of street maintenance and safety. Bus stops and subway entrances within 50 m and bus-only lanes would also be expected to have positive effects, because they facilitate the movement of high volumes of pedestrians. The slope of the survey spot would have a negative effect in that it would impede walking.
LUM and characteristics were calculated by using the Seoul Metropolitan Government property tax list in 2009, which has approximately 120 categories listed as ‘type of buildings according to taxation-purpose use’. Land use in a 100 m radius 4 of the survey spots was calculated by aggregating the floor area for each building use. Four types were used to compute CLUM4 and WLUM4 for a combination of residential, commercial, business, and other uses. The last 9728 survey points, excluding spots where land use characteristics were missing, were selected for the analysis (see Figure 3).
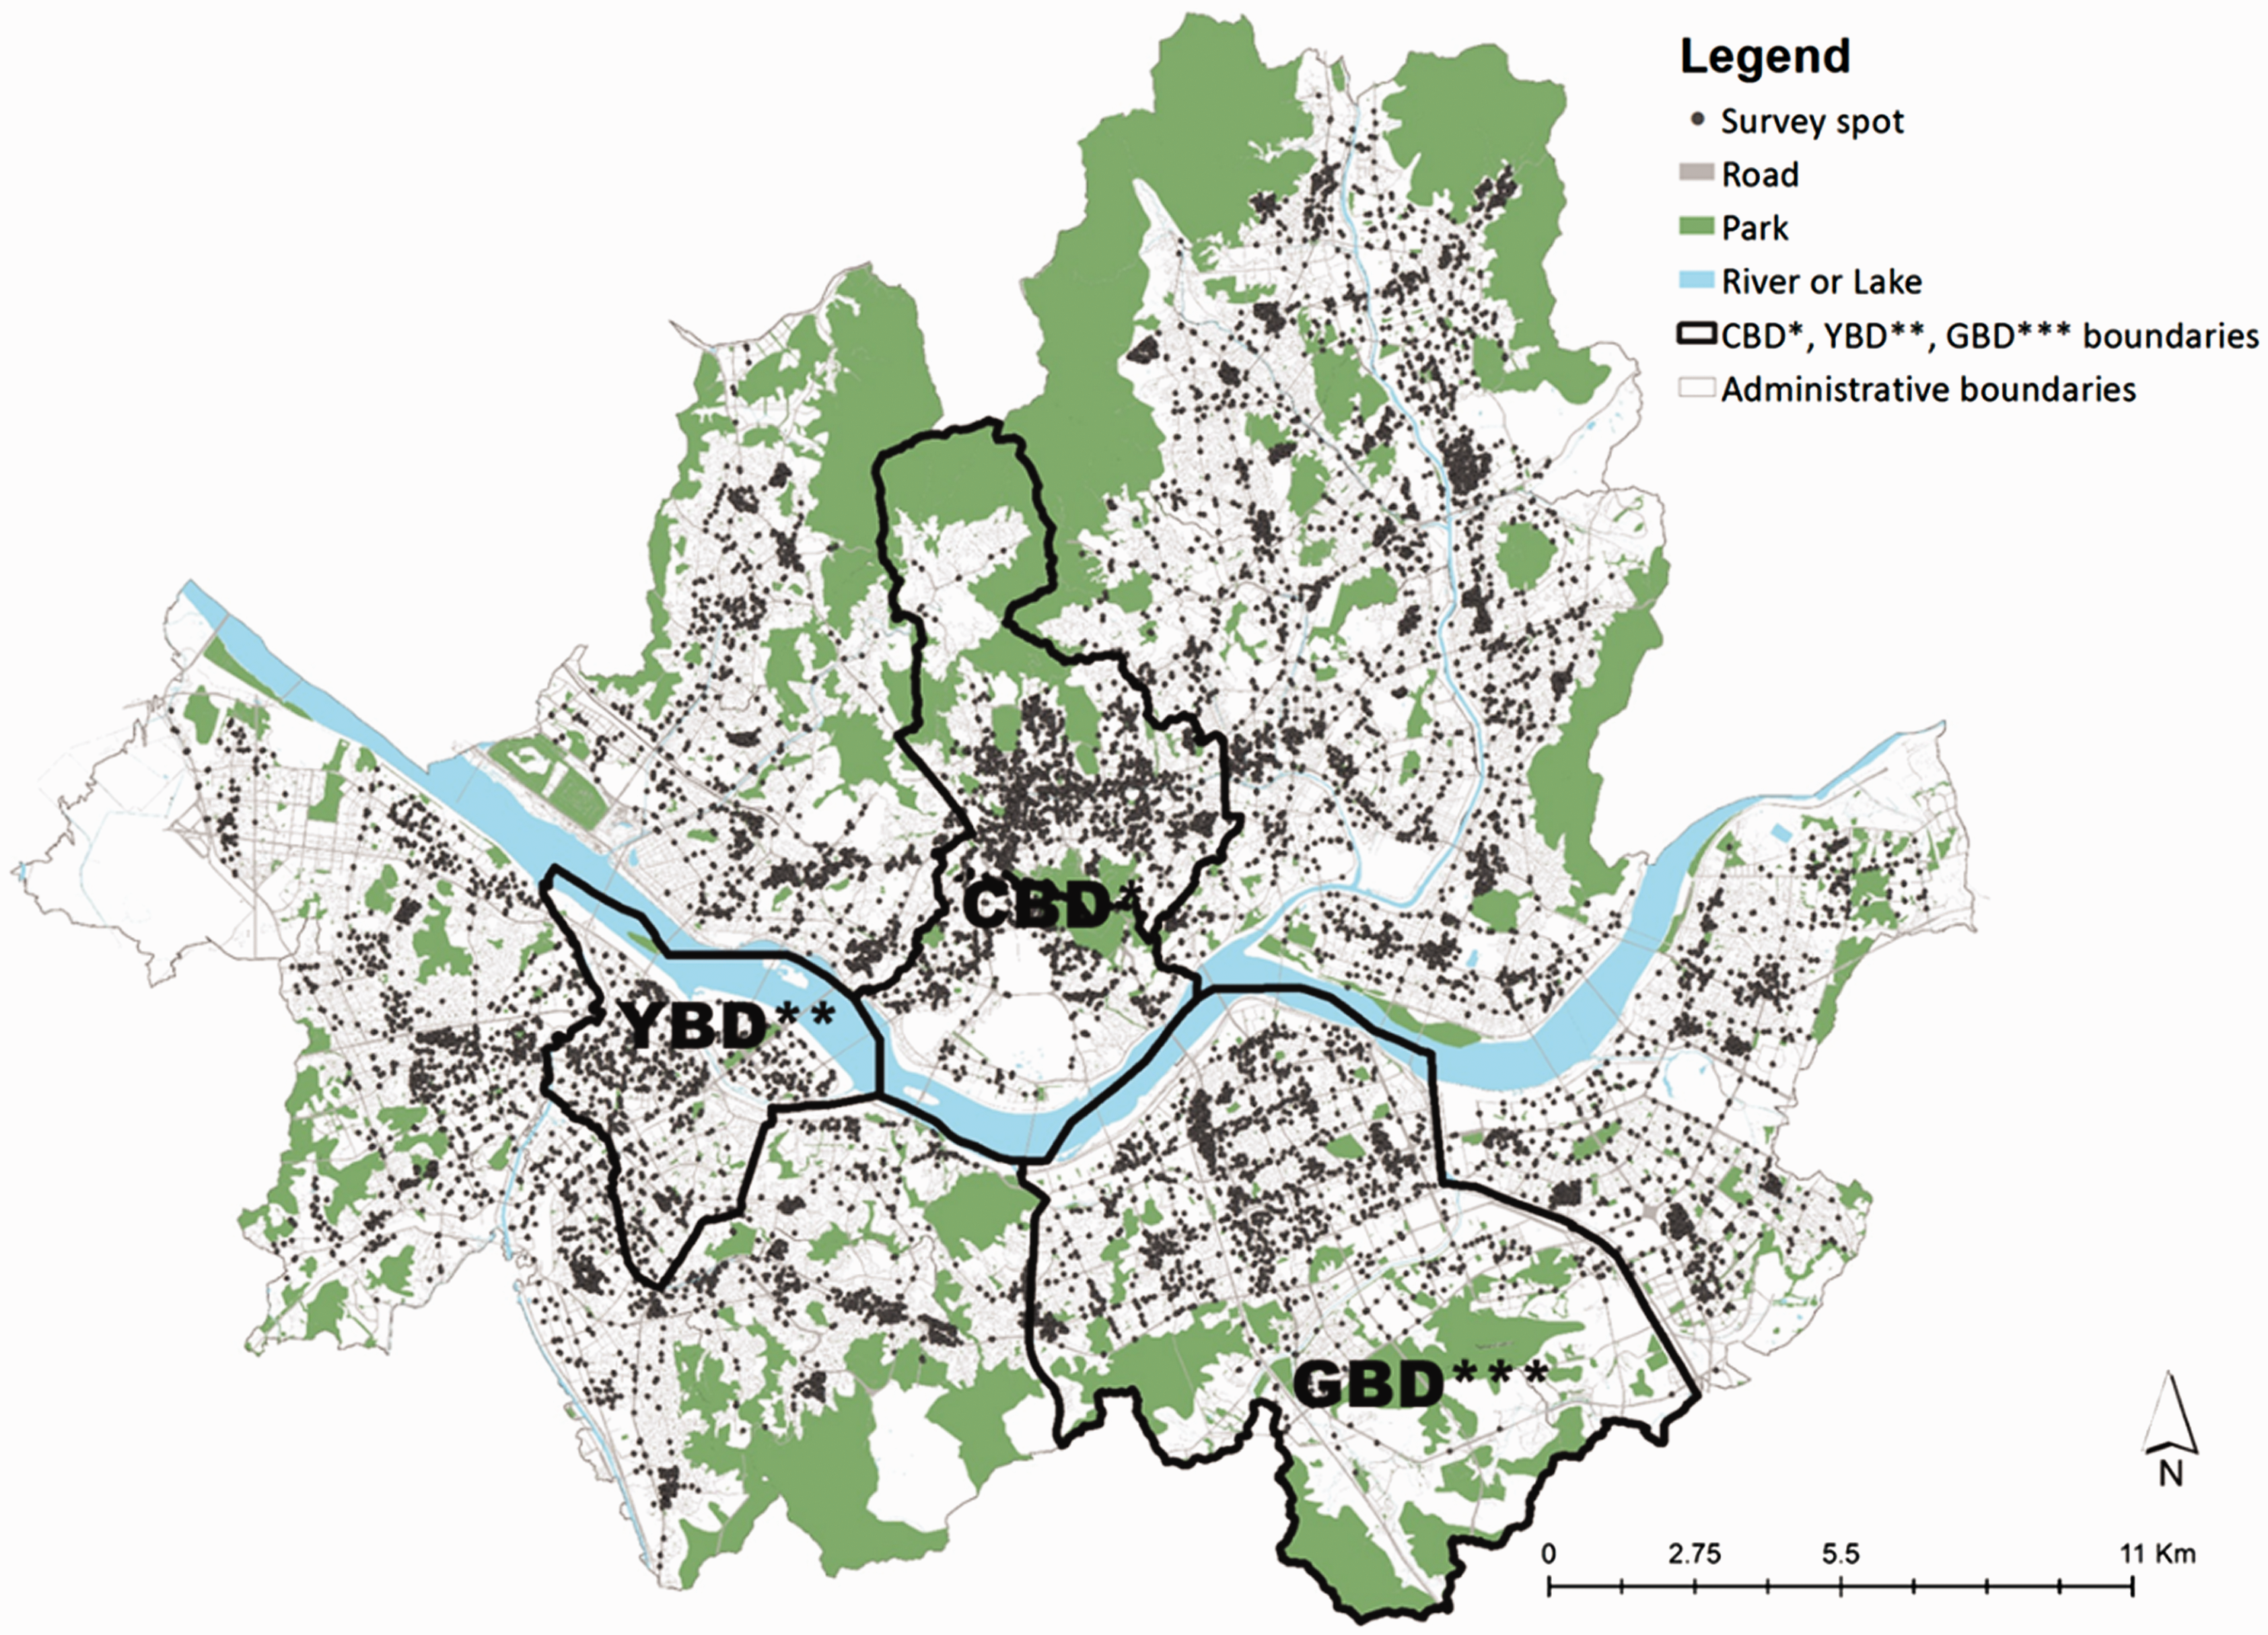
Survey locations of pedestrian volume and district classification in Seoul. Note: *CBD is Central business district in Seoul. **YBD is Yeong-deung-po/Yeo-ui-do business district in Seoul. ***GBD is Gangnam business district in Seoul.
Accessibility to bus stops and the subway was calculated using the Seoul Metropolitan Government’s road network data. Accessibility would negatively affect pedestrian volume because mass transit absorbs pedestrians. As central commercial business districts (CBDs) are expected to have more pedestrians than others and because Seoul is assumed to have three CBDs, these were coded. The north of the Han River (‘big river’ in Korean) are relatively older districts compared to the south of the river, and the former have more pedestrians than the latter. Thus, region type was also included in this study’s data set.
This research constructed CLUM4 and WLUM4 within a radius of 100 m from the survey spots and analysed how these two indicators correlated with the measured pedestrian volume. Figure 4 is a graph of pedestrian volume values based on the CLUM4 and WLUM4 values. The LUM values are represented by a line, and the pedestrian volume is represented by a bar graph. Graph (a) in Figure 4 does not clearly show the relationship between walking and CLUM4, although graph (b) in Figure 4 suggests that WLUM4 and pedestrian volume have a weak linear positive (+) relationship. Pearson’s correlation coefficient between CLUM4 and pedestrian volume is 0.126, for CLUM42 it is 0.108, for WLUM4 it is 0.286, and for WLUM42 it is 0.269. All of these are statistically significant. On the other hand, Figure 4 shows that the two LUM values having low pedestrian volumes in an average weekday are widely distributed in both graphs.

Pedestrian volume, CLUM4 and WLUM4 (measured from 9728 spot). (a) CLUM4 and pedestrian volume and (b) WLUM4 and pedestrian volume. LUM: land use mix. Note: WLUM4 weight (residential:commercial:office:other = 1:0.13:0.31:0.33).
The distribution pattern of points with volumes over 10,000 pedestrians seems to be random regardless of the CLUM4 values in graph (a) of Figure 4. However, the pattern shows a relatively linear relationship with WLUM4 in graph (b). In graph (a) of Figure 4, the circle represents the spot with the highest walking volume, having around 100,000 pedestrians per weekday, representing about 0.53 of the CLUM4 value, whereas this circle in (b) is 0.62 of the WLUM4 value. The spot is located on the main street of a retail and restaurant area called the Gangnam Station district. The commercial rate of land use within a radius of 100 m from the survey spot is 66.6% with office at 30.5%, and there is no residential land use there (see Table 1).
Top 10 and bottom 10 pedestrian volume spots, CLUM4, and WLUM4.

CLUM: conventional entropy-based land use mix index; WLUM: weighted land use mix index.
Note: Bold LUM is higher than another LUM.
Summary statistics.
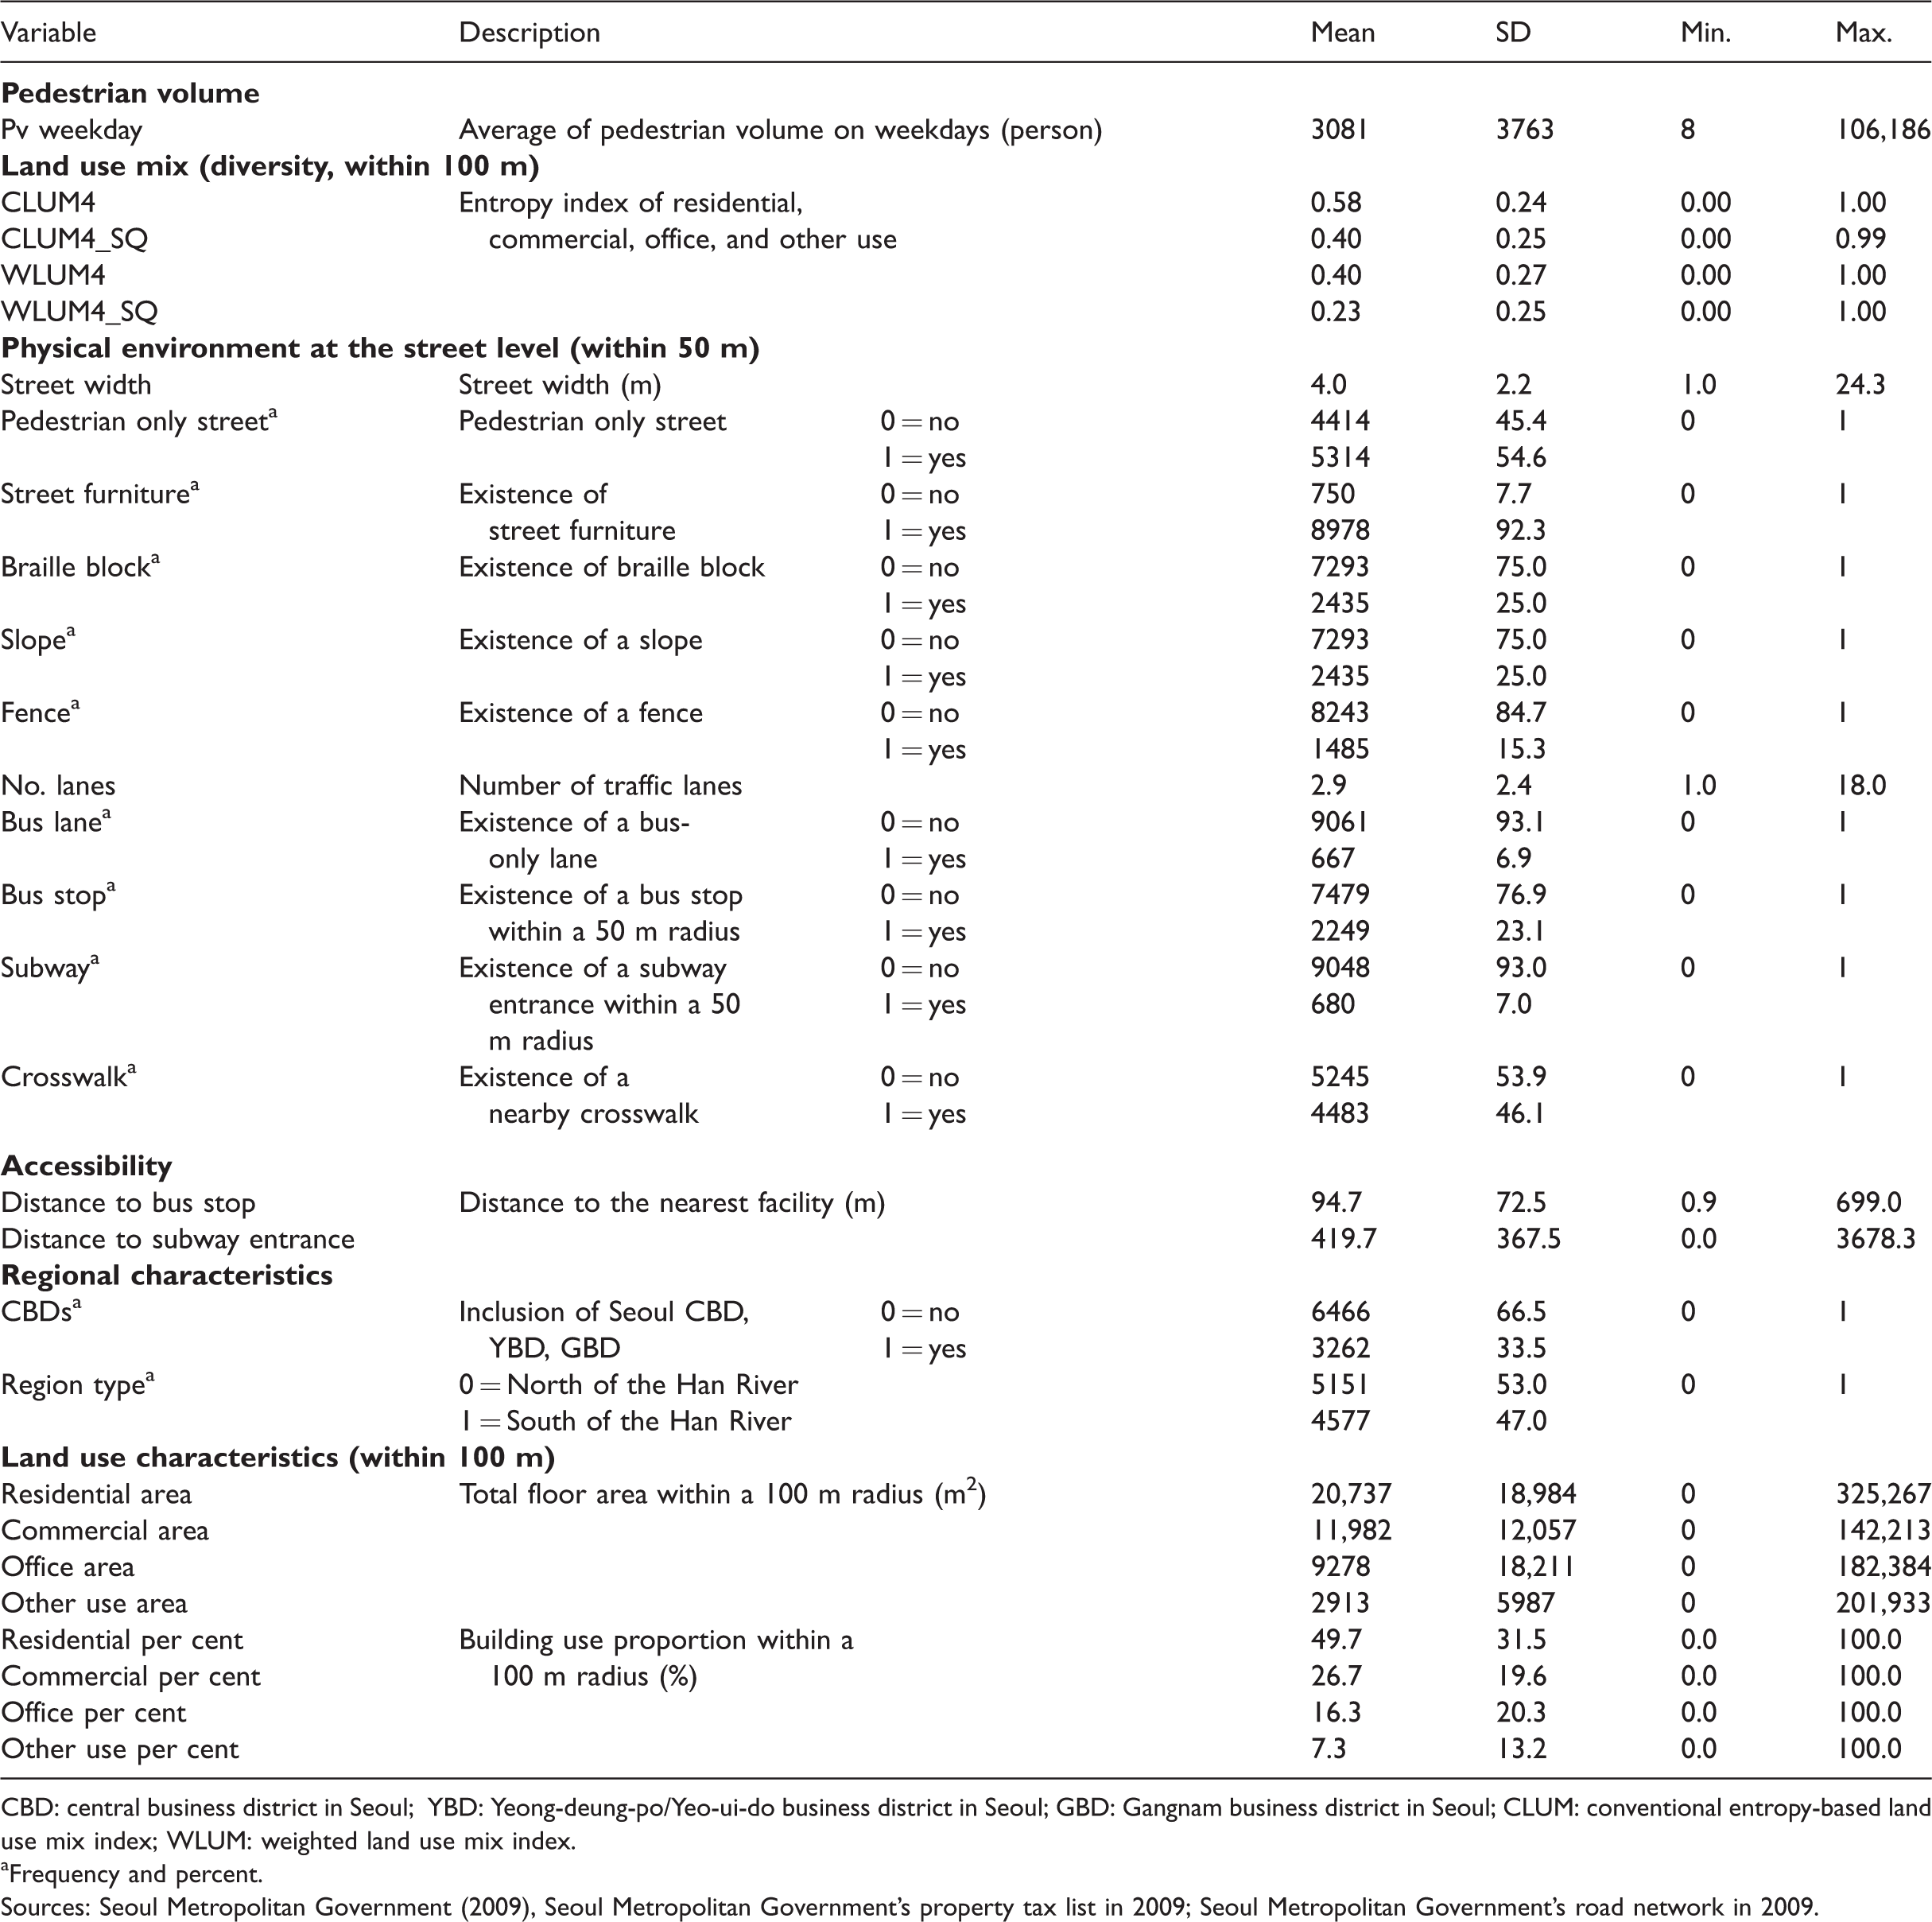
CBD: central business district in Seoul; YBD: Yeong-deung-po/Yeo-ui-do business district in Seoul; GBD: Gangnam business district in Seoul; CLUM: conventional entropy-based land use mix index; WLUM: weighted land use mix index.
aFrequency and percent.Sources: Seoul Metropolitan Government (2009), Seoul Metropolitan Government’s property tax list in 2009; Seoul Metropolitan Government's road network in 2009.
Table 1 shows a comparison of the values of CLUM4 and WLUM4 at the top 10 and bottom 10 spots in terms of pedestrian volume. In the top 10 locations, the proportion of residential use is almost zero. At eight points, WLUM4 is higher than CLUM4, and the commercial use ratio is very high. Two spots are observed for which the latter is higher than the former. In these cases, office use is more than 50%, indicating a strong business district. These top 10 points must be included in the hidden part of Figure 1, as pointed out by Im and Choi (2019).
In the bottom 10 spots in terms of pedestrian volume, the proportion of residential area exceeds 90% in seven spots, while in the remaining three, the proportion of office or other use is high (see Table 1). Compared to the top 10 spots, we can see that the values of CLUM4 are higher than those of WLUM4 overall. In addition, CLUM4 has a relatively high value of 0.2 or higher at four spots.
From Figure 4 and Table 1, it can be inferred that, compared to CLUM4, WLUM4 is a better indicator of the correlation between land use diversity and pedestrian volume. However, these estimates cannot be confirmed, because other variables may affect the pedestrian volume. Therefore, in the next section, we will build an analytic model that includes these as control variables and discuss the usefulness of WLUM.
Verification of the relationship between pedestrian volume and WLUM4 as well as CLUM4
Descriptive analysis of pedestrian volume and LUM indexes
The average pedestrian volume at the survey sites on a weekday was 3081, with a standard deviation of 3763. This study used CLUM4 and WLUM4, respectively, as diversity indicators, and it sought to verify their effects by reflecting them in each model. The mean value of CLUM4 was 0.58 and that of WLUM4 was 0.40 (see Table 2).
The average street width at the survey spots was 4.0 m, with a standard deviation of 2.2 m. The average number of traffic lanes was 2.9. Survey spots with bus stops within a 50 m radius were 2249 (23.1%) and those having subway entrances at the same distance numbered 680 (7.0%). The average distance to each bus stop was 94.7 m, and for subway station entrances, the average distance was 419.7 m. CBDs represented 33.5% of the research sample, and 53.0% of the sample was selected from north of the Han River. Among total floor areas in the research sample, average residential use included 20,737 m2 and average commercial use was 11,982 m2. Residential building use proportion was 49.7%, commercial was 26.7%, and office was 16.3%.
Regression analysis of pedestrian volume using CLUM4 and WLUM4
Logically, CLUM4 has a nonlinear relationship with pedestrian volume and WLUM4 has a relatively linear relationship, as shown in Figure 2. In the descriptive analysis, it is hard to be certain whether the relationship with pedestrian volume is clear. This is because the empirical data also show that, in some spots, CLUM4 and WLUM4 both appear to affect the pedestrian volume, but in other areas, the relationship is not consistent.
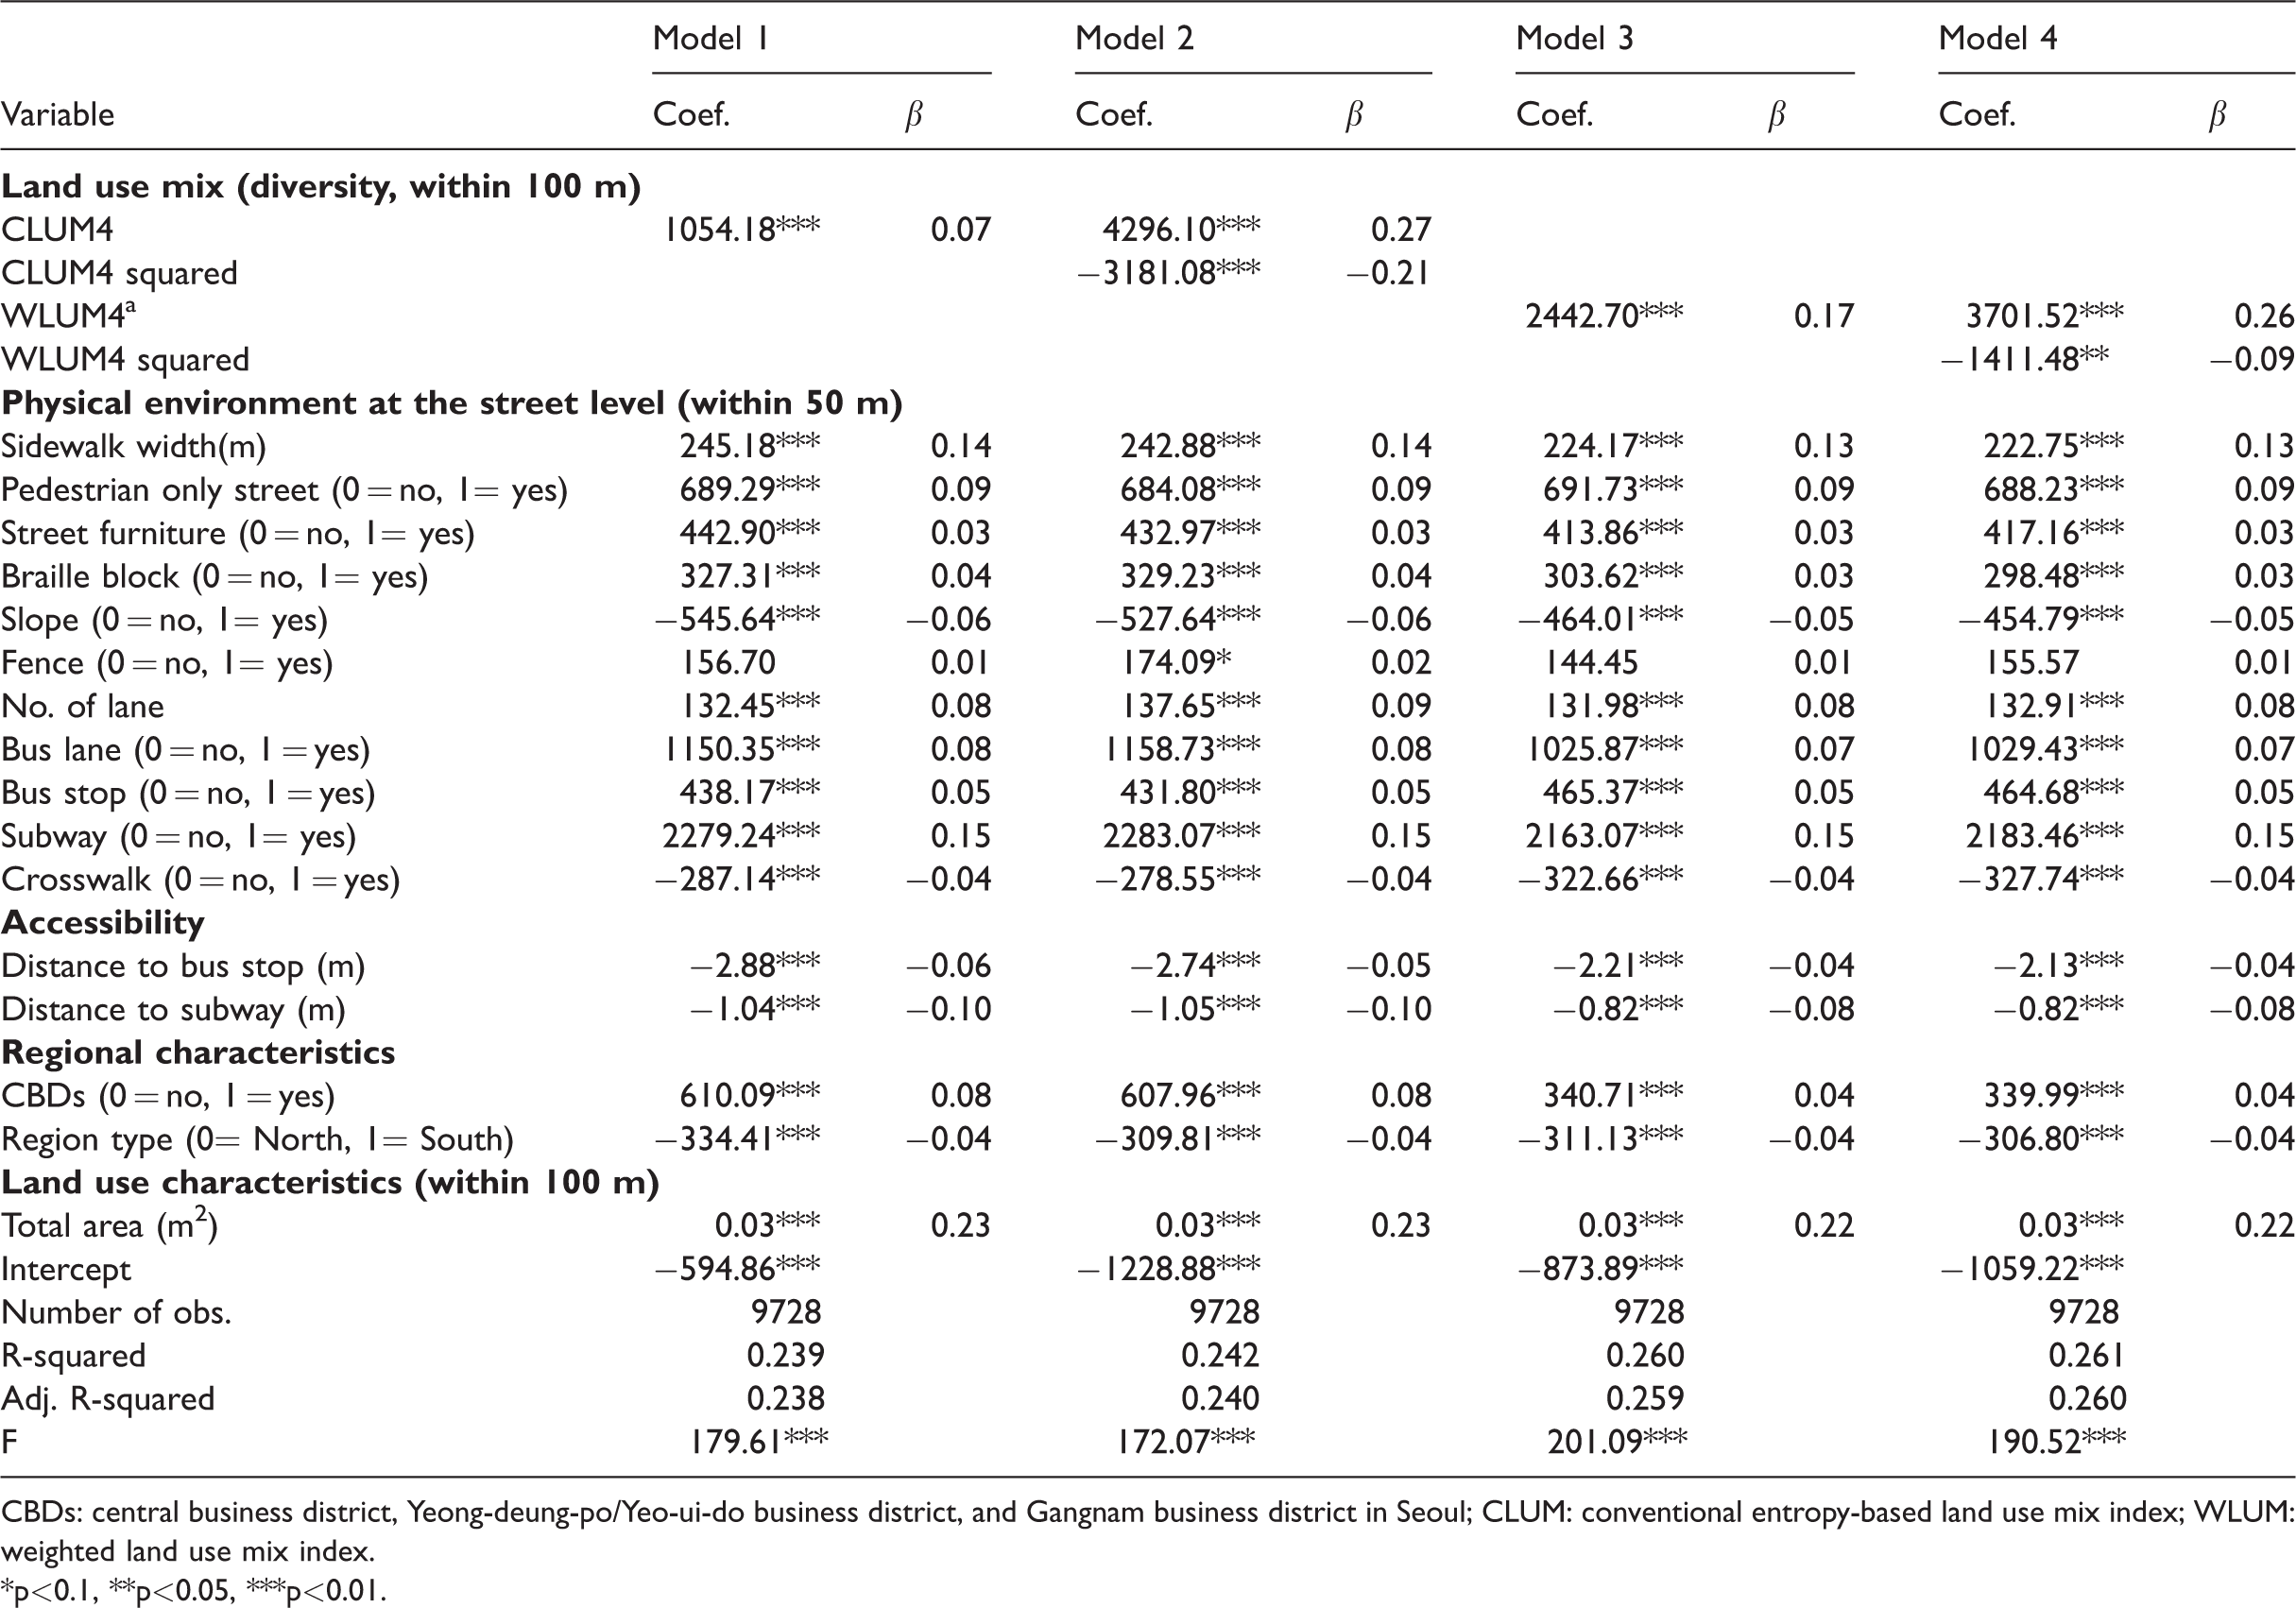
This study uses regression analysis to control other dependent variables and builds four different models to compare CLUM and WLUM (see Table 3). Some models in Table 3 also include a squared value of LUM as well as general LUMs as variables, because Im and Choi (2019) suggested that it is logically valid and empirically appropriate to use both CLUM and CLUM squared in whole city models. All models are statistically significant and show a slight difference in adjusted R-squared. The directionality of the LUM indexes and the change in the explanatory power of the models show that the weighted value of WLUM that this study suggests is better than the conventional same value calculation for CLUM. Model 2 with CLUM4 and CLUM42 together has a higher adjusted R-squared than Model 1 with CLUM4 only, because CLUM4 in Model 2 may act as a control variable and also because many selected survey spots were in residential areas. CLUM42 has an n-shaped relationship with pedestrian volume, as Im and Choi (2019) found.
Regression analysis of pedestrian volume with CLUM4 and WLUM4.
CBDs: central business district, Yeong-deung-po/Yeo-ui-do business district, and Gangnam business district in Seoul; CLUM: conventional entropy-based land use mix index; WLUM: weighted land use mix index.
*p<0.1, **p<0.05, ***p<0.01.
Compared to the models with CLUM4, Models 3 and 4 with WLUM4 show a better adjusted R-squared and consistency of variables. Model 4 with WLUM4 and WLUM42 shows better adjusted R-squared than Model 3 with only WLUM4. 5 The empirical results in Table 3 confirm that, compared to CLUM, WLUM is more stable and consistent in estimating the pedestrian volume, and this study also confirmed that WLUM is more logical than CLUM in estimating the pedestrian volume. These logical and empirical results suggest that a model with WLUM and WLUM squared should be used to calculate the pedestrian volume of the whole city.
Most variables included as control variables also have statistically significant effects on pedestrian volume, maintaining directional consistency in all models (see Table 3). Street maintenance and safety factors such as pedestrian-only streets, street furniture, and braille block width as well as traffic-related factors such as sidewalk width, number of road lanes, and the presence of bus stop and subway entrances have consistently positive relationships to pedestrian volume in all models. Slope at the survey spots negatively affects pedestrian volume. Distance to bus stop and subway stations shows a negative relationship to pedestrian volume. Compared to other areas, survey spots in CBDs and the north of the Han River have higher volumes of pedestrians. Higher density around the survey spots increases volume. Coefficient directions of most of the control variables are reasonable, as expected.
The explanatory power of the models presented in this study (R-squared) is relatively low (0.239–0.261). This is presumed to be because this study focused on WLUM as an alternative to CLUM, took control variables related to the built environment, which is the main consideration of urban design, and analysed samples from the entire urban area studied. For example, Liu and Griswold (2009) added variables related to population and employment, and the explanatory power ranged from 0.743 to 0.754. Lee and Koo (2013) targeted specific commercial and business areas, and therefore, their model showed a higher explanatory power than the model in this study. In a future study, socioeconomic variables such as population and employment may be added, or the model’s explanatory power might be further improved by adding variables that reflect the characteristics of the region.
Conclusion
Recently, in urban planning and design fields, which emphasize and try to achieve diversity of land use, the issue of how to measure such diversity has been both an academic and a practical concern. When the number of land use categories is more than three, the problem is not easy to solve. As a solution, Cervero and Kockelman (1997) developed the entropy-based land use index – in this study, CLUM – which is a representative index used in various fields to study built environments. Although previous studies have pointed out the limitations of this index, they have not been able to present an appropriate alternative.
The purpose of this study was to address the problem of the entropy-based concept while reflecting the characteristics of each use in the CLUM index. This study was conducted to calculate the weighted values of the differences in effects of each kind of land use on pedestrian volume, a subject which has garnered increasing attention as of late.
The study examined the CLUM and the WLUM to see how they relate to pedestrian volume. The study used regression analysis to assess the relationship between pedestrian volume and the two indexes in 9831 spots in Seoul. This study controlled the design and accessibility factors that would affect pedestrian volume and confirmed that the models with WLUM, as opposed to CLUM, estimated the pedestrian volume more effectively. Based on the empirical results, the WLUM showed a consistent relationship with pedestrian volume compared to the CLUM, and the explanatory power of the regression models that included the WLUM was higher. Thus, when estimating pedestrian volume in the future, it would be preferable to use the WLUM index rather than the CLUM.
Despite this achievement, the study has several limitations. Specifically, it does not offer a method to measure accurate weighted values. The method of measuring weighted values used here is not efficient in terms of cost and time. In addition, the study considered pedestrian volume as the only dependent variable. Future research is necessary to more thoroughly investigate whether the weighted method proposed here would be applicable to an analysis of behaviour mode choice, walking distance and time, and health-related issues. Exact integration effects of different land use types were not discussed in this study; only the effects of individual uses were presented. Future studies should more precisely measure the impact of individual land uses on a dependent variable and analyse the additional effects of the combination and mix of these land uses. They must be more variables than this study.
Footnotes
Acknowledgements
The part of this article was presented in 2017 American Association of Geographers’s annual meeting in Boston, Massachusetts, and in 2017 Asian Planning Schools Association’s congress in Beijing, China. The authors thank Hyunggun Sung at Chungbuk University, Sugie Lee at Hanyang University, and Sang Hyun Cheon at HongIk University for their valuable advice on developing WLUM, as well as two anonymous reviewers for their thoughtful comments and suggestions to improve this article’s clarity.
Declaration of conflicting interests
The author(s) declared no potential conflicts of interest with respect to the research, authorship, and/or publication of this article.
Funding
The author(s) disclosed receipt of the following financial support for the research, authorship, and/or publication of this article: This research was supported by Basic Science Research Program through the National Research Foundation of Korea(NRF) funded by the Ministry of Science and ICT(NRF-2016R1A2B4010260).
Notes