
Abstract
The urban fabric is a fundamental small-scale component of urban form. Its quantitative analysis has so far been limited either in its geographical extent or in the diversity of components analysed. Moreover, the planning approach has traditionally privileged an aerial perspective. A new approach integrating the pedestrian point of view is proposed. Spatial analysis procedures are implemented with a twofold objective: identifying urban fabrics and studying their spatial organization within a large metropolitan area. The former is achieved through multiple fabric assessment, a three-step protocol using a network-based partition of urban space: (i) a set of skeletal streetscape indicators is implemented on each spatial unit, considering different constituents of the urban fabric; (ii) spatial patterns on the street network are identified, applying geostatistical analysis to each indicator; and (iii) spatial patterns with Bayesian clustering are recombined, allowing the identification and characterization of urban fabric types and subspaces within the city. This methodology is tested on the French Riviera metropolitan area, where nine families of urban fabric are identified. Disentangling the spatial organization of urban fabrics represents the second objective of this paper: the geographical distribution of urban fabrics is investigated, applying mathematical morphology and variography while considering network-constrained topological contiguities.
Keywords
Introduction
Since Jacobs (1961) defended the idea that modern planning did not take into account the needs of city-dwellers, academics and practitioners have increasingly worked on the importance of pedestrian perspectives in urban studies, policies and planning. This is also true in the study of the physical form of the city, as pioneered by Lynch (1960). The pedestrian point of view is thus integrated into the analysis of urban spaces, focusing more specifically on the study of streetscapes. Both physical and qualitative aspects have been studied by urban designers (Ewing and Clemente, 2013) and computer-aided techniques are enriching the description of the physical streetscape. Nevertheless, streetscapes are not the only feature of urban form, and their morphological characteristics need to be put into the urban context where they are measured.
Urban morphologists proposed to study urban contexts through the analysis of the urban fabric, which is defined as a specific combination of local patterns made up of buildings, streets and plots and considered as the original and unique outcome of conscious and unconscious design of the physical city (Caniggia and Maffei, 1979). In turn, different types of urban fabric must be understood in the context of morphological regions (Conzen, 1960), revealing the multi-scale structuring of urban form. Thanks to the ever-growing availability of data and powerful geoprocessing tools, new methodologies have been developed to analyse the urban fabric by quantitative approaches. Specific goals underlie each procedure and result in different methodological choices. However, they barely consider the pedestrian point of view. In contrast, configurational approaches like Space Syntax (SSx) capture the pedestrian perspective, but do not focus on the urban fabric as defined by urban morphologists. The potential and constraints introduced by the pedestrian perspective of the urban fabric require specific methodological and conceptual considerations. These have been overlooked in traditional and more recent procedures.
Innovative approaches from other disciplines could bring several solutions that would allow traditional urban fabric analysis to fully integrate the pedestrian perspective. In particular, quantitative urban geography is well positioned to study urban form and design (Talen, 2011). Moreover, geographers have already adapted several geostatistical approaches to network-constrained space, being aware of its importance for the study of human activity in the city (Okabe and Sugihara, 2012).
The main goal of our paper is to present a new computer-aided methodology for the study of urban fabric, which is capable of integrating the pedestrian point of view. Geoprocessing, geostatistics and artificial intelligence (AI)-based clustering are implemented in a new procedure to analyse and combine ‘geometry and geography’ (Batty, 2007): from the geostatistical detection of urban fabric types to the study of their spatial organization within the urban space. A real-world case study of the size of an entire metropolitan area is used to test the method and evaluate the quality of the results obtained.
The paper is organized as follows. The next section provides an overview of computer-assisted methods available to analyse urban form, highlighting issues related to the pedestrian point of view. ‘Case study’ section introduces the study area of the French Riviera. ‘Urban fabric identification: A new methodology ’section describes multiple fabric assessment (MFA), a new three-step procedure for the identification of different urban fabrics. ‘Results: Identification of the urban fabric families’ section presents MFA results for the area studied. ‘Spatial organization of urban fabrics’ section shows how further geographical approaches might be applied to MFA outcomes to analyse the spatial organization of urban fabrics and to identify settlement boundaries. A discussion pertaining to future developments concludes the paper.
Computer-aided approaches to urban morphology
The classical analysis of urban fabric
Defined as the study of the urban form, urban morphology deals with the analysis of the physical layout and design of a city, a town or an urban fragment within these. Urban morphology involves the study of patterns of its components and the processes of their formation and transformation (Vernez-Moudon, 1997).
Literature on the analysis of urban form has its origins in the seminal works of urban geographers of the early 20th century, in German-speaking countries (Hofmeister, 2004). The works of the Conzenian and Muratorian schools after Second World War jointly developed the concept of the urban fabric. This is defined as a typical pattern of buildings, parcels and streets, characterizing the form of the physical city in a given historical and cultural context, at the scale of an urban fragment (Conzen, 1960; Muratori, 1959). The concept of the morphological region is also proposed to describe urban sectors characterized by consistent extents of a single urban fabric and to produce more global schemes of the morphological organization of the city. Despite efforts to develop systematic approaches for the analysis of the urban fabric, these methodologies relied heavily on manual measurements, treatment and interpretation of calculus. This has limited the extent of case studies (Allain, 2004; Borie and Denieul, 1984; Caniggia and Maffei, 1979). Morphological regions could be identified in small cities like Alnwick, Northumberland (Conzen, 1960), or in medium ones like Versailles (Castex et al., 1980), but have only been hinted at for big cities. Furthermore, the approach of classical urban morphologists to study the urban fabric left little space for the pedestrian perception of the physical city. Meanwhile, Lynch’s (1960) seminal work established little link between the perception of cityscapes and the analysis of the urban fabric.
The configurational approach
Starting from the late 1970s, technologies allowed the implementation of computer-aided quantitative approaches for the analysis of urban form (Kruger, 1977; Steadman, 1983). Graph analysis played an important role in these early models. Paralleling the development of social network analysis (Freeman, 1977), configurational approaches to urban street networks were proposed. SSx (Hillier, 1996; Hillier and Hanson, 1984) proposed the most innovative reconceptualization of urban form analysis by focusing on the open space available for pedestrians and by building on the theory of natural movement within this (Hillier et al., 1993). The urban open space is partitioned into convex polygons approximated with visual axial lines. Topological measurements of centrality are carried out on the resulting graph, which is a dual representation of the axial line network. A similar approach is the multiple centrality assessment (MCA, Porta et al., 2006; Sevtsuk and Mekonnen, 2012), which develops centrality measurements on the primal representation of metric street networks. Links represent street centrelines while nodes correspond to their junctions. Hybrid approaches have also been proposed between SSx and MCA (Cutini et al., 2005; Turner, 2007).
The use of visual lines and the natural movement theory might be considered as an integration of the pedestrian perspective applied to the analysis of urban form, and in SSx this is even truer than for MCA. But the final goal of configurational approaches is to study the organization of public space, open to pedestrian through-movement and to-movement. Such methods open the way to a deeper understanding of the relationship between urban form and pedestrian movement. Seeing them as a computer-aided implementation of the analysis of the urban fabric, as suggested by Lévy (2005), is thus questionable. Important components of the urban fabric (buildings, plots, site), and their dimensional and geometrical relationships, lie outside of the scope of configurational analyses. Work is presently being carried out to combine urban fabric and configurational metrics in the description of urban form (Gil et al., 2012; Ye and Van Nes, 2014). However, Kropf (2017) highlights the need to reconceptualize urban fabric analysis when combining these different approaches. Our paper goes in this direction, leaving the integration with a configurative description of urban form as a future endeavour.
Computer-aided analysis of the urban fabric
One of the main motivations of our paper is the development of new computer-aided methods to analyse both the form of the different urban fabrics, as defined by classical urban morphologists, and their organization in morphological regions within the city. Thus, we will turn our attention to the different methods that have been developed in this direction during the last decades. We propose to renew these by integrating the street-based pedestrian point of view. This will allow us to bridge the gap with works on streetscape perceptive analysis and to open the way for future convergence with other street-based analyses, like configurational approaches.
Following the founding concept of urban fabric, the reviewed methods aim to describe in different ways the arrangements of buildings, plots and streets. While configurational studies built their strength around a small number of shared methodologies, within this second group more goal-oriented procedures have been developed. All the methods considered integrate geoprocessing approaches to analyse the multidimensional character of the urban fabric. Different degrees of computer-aided automation allow the study of vast settlements at the fine grain scale of the single urban constituent (street, building, plot). The urban block represents the spatial unit of urban morphologists’ traditional analysis: its historical permanence allows an easier diachronic analysis of built-up forms included in its limits. It is thus privileged in many geoprocessing methods as in Berghauser-Pont and Haupt (2010), Puissant et al. (2010), Bernabé et al. (2013), Gil et al. (2012), Vialard (2013) and Hermosilla et al. (2014). Other spatial partitions like regular grids have been adopted in the study of urban form for climatological purposes (Long and Kergomard, 2005). Despite differences in the final goal and spatial unit choice, these methodologies share a similar multivariate approach based on the cross-analysis of different dimensions of urban form components, like their density and geometrical properties. Typo-morphologies of city blocks represent the main outcomes of these methodologies. Another important phase in geoprocessing of the urban fabric is the computer-aided algorithms used to identify different empirical typologies of city blocks: spacematrix diagrams (Berghauser-Pont and Haupt, 2010), k-means (Bernabé et al., 2013; Gil et al., 2012; Vialard, 2013) and decision trees (Hermosilla et al., 2014).
The integration of the pedestrian point of view in the analysis of urban form is nevertheless absent from all the aforementioned methods. First, streets are normally considered as the limits for spatial partitioning, rather than as the core of a fragment of the urban fabric. Second, typo-morphologies of urban blocks are identified through clustering approaches, applied to individual spatial units, considering their local geometrical descriptors without any reference to their spatial relations to neighbouring units that could be explored by pedestrians. Spatial analysis is limited here to an a posteriori visual/qualitative study of the clusters identified.
The skeletal streetscape
Contrary to geoprocessing methods in urban fabric analysis, the impact of street design on human perception represents the main focus of environmental psychology studies of urban form. Within this domain, recent developments might present valuable insights for our study. Harvey and Aultman-Hall (2016) define and measure the streetscape of a simplified 3D model of the street for the study of human perception. More specifically, they focus on the skeletal streetscape, defined as the main geometric characteristics of buildings and trees along the streets (size, spacing, frequency, etc.). The skeletal streetscape provides the structural support onto which the skin, made of design details, is fitted, completing the description of the streetscape. The authors propose a set of indicators implemented through a geoprocessing approach describing the geometrical organization of façades along the streets. Like in geoprocessing of the urban fabric, streetscape indicators are combined for classification purposes. Once again, the spatial distribution of the identified patterns is assessed qualitatively by analysts.
The quantitative measurement of the skeletal streetscape allows the study of aspects related to the street–building interface, highlighted and debated by several architects and urban designers (Alexander et al., 1987; Gehl, 2010; Lynch, 1960). More recently, innovative procedures have been proposed to measure further constituents of streetscapes like vegetation (Dubey et al., 2016), sky view (Leduc and Chauvat, 2015) and façade colours (Nguyen and Teller, 2017, etc.). In conclusion, streetscape analysis, whether limited to the skeletal structure or extending to include other constituents, focuses on the street–building interface and ignores both the content of buildings and the urban fabric as a whole.
Indications for a new computer-aided and human-centred analysis of the urban fabric
We have discussed the main computer-aided methods for the analysis of urban form, focusing on those aimed at the form of the urban fabric. We also highlighted their conceptual and methodological limits when it comes to integrating the pedestrian point of view. The methodological challenges underlying the goal defined in the ‘Introduction’ section are now pointed out.
Our first need is to define a new spatial unit putting the street at the centre of the analysis. From the street, pedestrians can perceive the surrounding elements of the urban fabric (buildings, open spaces, plots, trees). Urban form indicators should be conceived and redefined from this perspective. Measurements of skeletal streetscapes as proposed by Harvey and Aultman-Hall (2016) seem to be an interesting starting point. Nevertheless, other important aspects of the urban fabric, well-identified by classical urban morphology schools, should be integrated into the approach, always including the pedestrian point of view. Finally, the urban fabric will be defined as a morphologically attentive urban streetscape.
Moreover, the pedestrian perspective to define the urban fabric should not simply be reduced to the capacities of human vision. It is by moving from one street to another that pedestrians can experience the spatial variability or homogeneity of urban fabric characteristics. Each indicator, describing a geometrical aspect of urban form within a spatial unit, should be evaluated considering its spatial distribution and variation. Geostatistical analysis on street networks might then provide methodological solutions for the study of spatial heterogeneity/homogeneity of perceivable morphological characteristics and serve as the input for subsequent clustering models. Thus, the street network becomes the underlying spatial support, as in street-based configurational approaches, but with a different role in the very nature of ensuing analyses.
Finally, types of urban fabric defined as morphological streetscapes might be characterized by specific sub-groups of morphological patterns, which may vary from one subspace to another. The homogeneity of a whole set of morphological descriptors, which is imposed by traditional classification methods (k-means, hierarchical clustering, etc.), might represent a methodological limitation.
Bearing in mind these indications, we will show in the following sections how well-established methodologies from geoprocessing, geostatistics and AI might converge in a new protocol of analysis of the urban fabric to provide a more appropriate integration of the pedestrian point of view.
Case study
In order to evaluate the new methodological protocol, we will test it on a real-world case study: that of the French Riviera metropolitan area, in southern France (see Supplemental Appendix Figure S1). With a population of more than one million inhabitants over 1500 km2, this space represents a unique conjunction of natural and urban landscapes. First, the topography, with an elevation ranging from sea level up to the 1700 m of the pre-Alps (passing through differently sloped hills and valleys). Second, the socio-political and historical influences on urban planning. Traditional villages and suburban developments are spread around three high-density urban areas. From east to west, we find: Monaco and its skyscrapers, the most densely populated sovereign nation in the world; the urban agglomeration of Nice with a regular meshed core inspired by the Turin model (Graff, 2013) surrounded by hilly and less tightly planned areas; the urban agglomeration of Cannes–Grasse–Antibes characterized by land irregularity together with the car-centred sprawling development of the last 50 years. The combination of all these elements produces a sequence of urban centres and peripheral areas of different sizes and morphologies. This study area will give us the opportunity to test our method and to identify different urban fabrics by a bottom-up approach.
Urban fabric identification: A new methodology
MFA is a new methodology for the identification and characterization of different urban fabrics within a large study area (see Supplemental Appendix Figure S2). After defining appropriate goal-specific spatial units (1), it can be summed up as follows: (2.a) geoprocessing protocols to calculate a matrix of morphological indicators of the urban fabric; (2.b) identification of spatial associations of indicator values (local patterns) on a network constrained space; (2.c) clustering of local patterns through Bayesian methods. The outcomes of MFA allow the identification of urban fabrics in large study areas (3.a) and the study of their spatial organization (3.b).
A new spatial unit partition of urban space: The pedestrian point of view
As discussed in the first part of this paper, when analysing urban fabrics through geoprocessing, we first need to define the base spatial unit. In order to analyse the skeletal streetscape, Harvey and Aultman-Hall (2016) selected the proximity space on the two sides of each street centreline, where the relative disposition of the built-up façades is measured. In her study of the block-face, Vialard (2013) also proposed a morphological description of elements within a one-sided buffer, going from the street-edge to the block interior. Here, centrelines and street-edges assume a major value of geometrical reference for the description of the urban fabric. The interface between streets and buildings/plots is the starting point to measure specific street-based indicators like corridor effects, façade alignments, setbacks, etc. Other representations of the public space overlook this specific aspect and focus on different criteria (e.g. convex spaces of axial maps and derivatives), losing this geometrical reference. Hermosilla et al. (2014) also recognized the need to integrate morphological descriptors of street-related spaces to characterize different urban fabrics, but their analysis was still centred on the urban block, which encompasses the descriptors of its surrounding streets.
As highlighted in previous sections, Harvey’s approach allowed a local description of streetscapes disregarding their spatial relations. Spatial contiguities between these street-centred fragments of urban space should be reintroduced to explore their spatial variability. Studying different issues from urban form, Okabe and Sugihara (2012) proposed a similar partition of urban space, namely network-based Thiessen tessellation, with the intent of redistributing socio-demographic data on the street network.
Inspired by these studies, we propose a new division of urban space. A generalization of Thiessen polygons is created around each street segment, to identify the portion of planar space conventionally served by each segment. Only the closest space to street-edges can be observed by pedestrians. A double-sided buffer approximating to visible space is selected from the Thiessen partition (Figure 1). The resulting partition, the proximity bands (PBs) considers different visual depths, depending on the specific aspect of the urban fabric under analysis (‘Decomposing urban fabric components’ section). Moreover, the connectivity of the underling street network is transferred to PBs, allowing the implementation of network-constrained spatial statistics (‘Spatial patterns on networks: ILINCS’ section). Finally, their small size variability reduces the potential bias induced by the modifiable area unit problem in statistical analysis. In our study area, 99,562 PBs were identified with street segment lengths of between 4 and 300 m and an average conventional surface of 4680 m2 when a 20 m band of visible space was considered (see Supplemental Appendix Table S1).
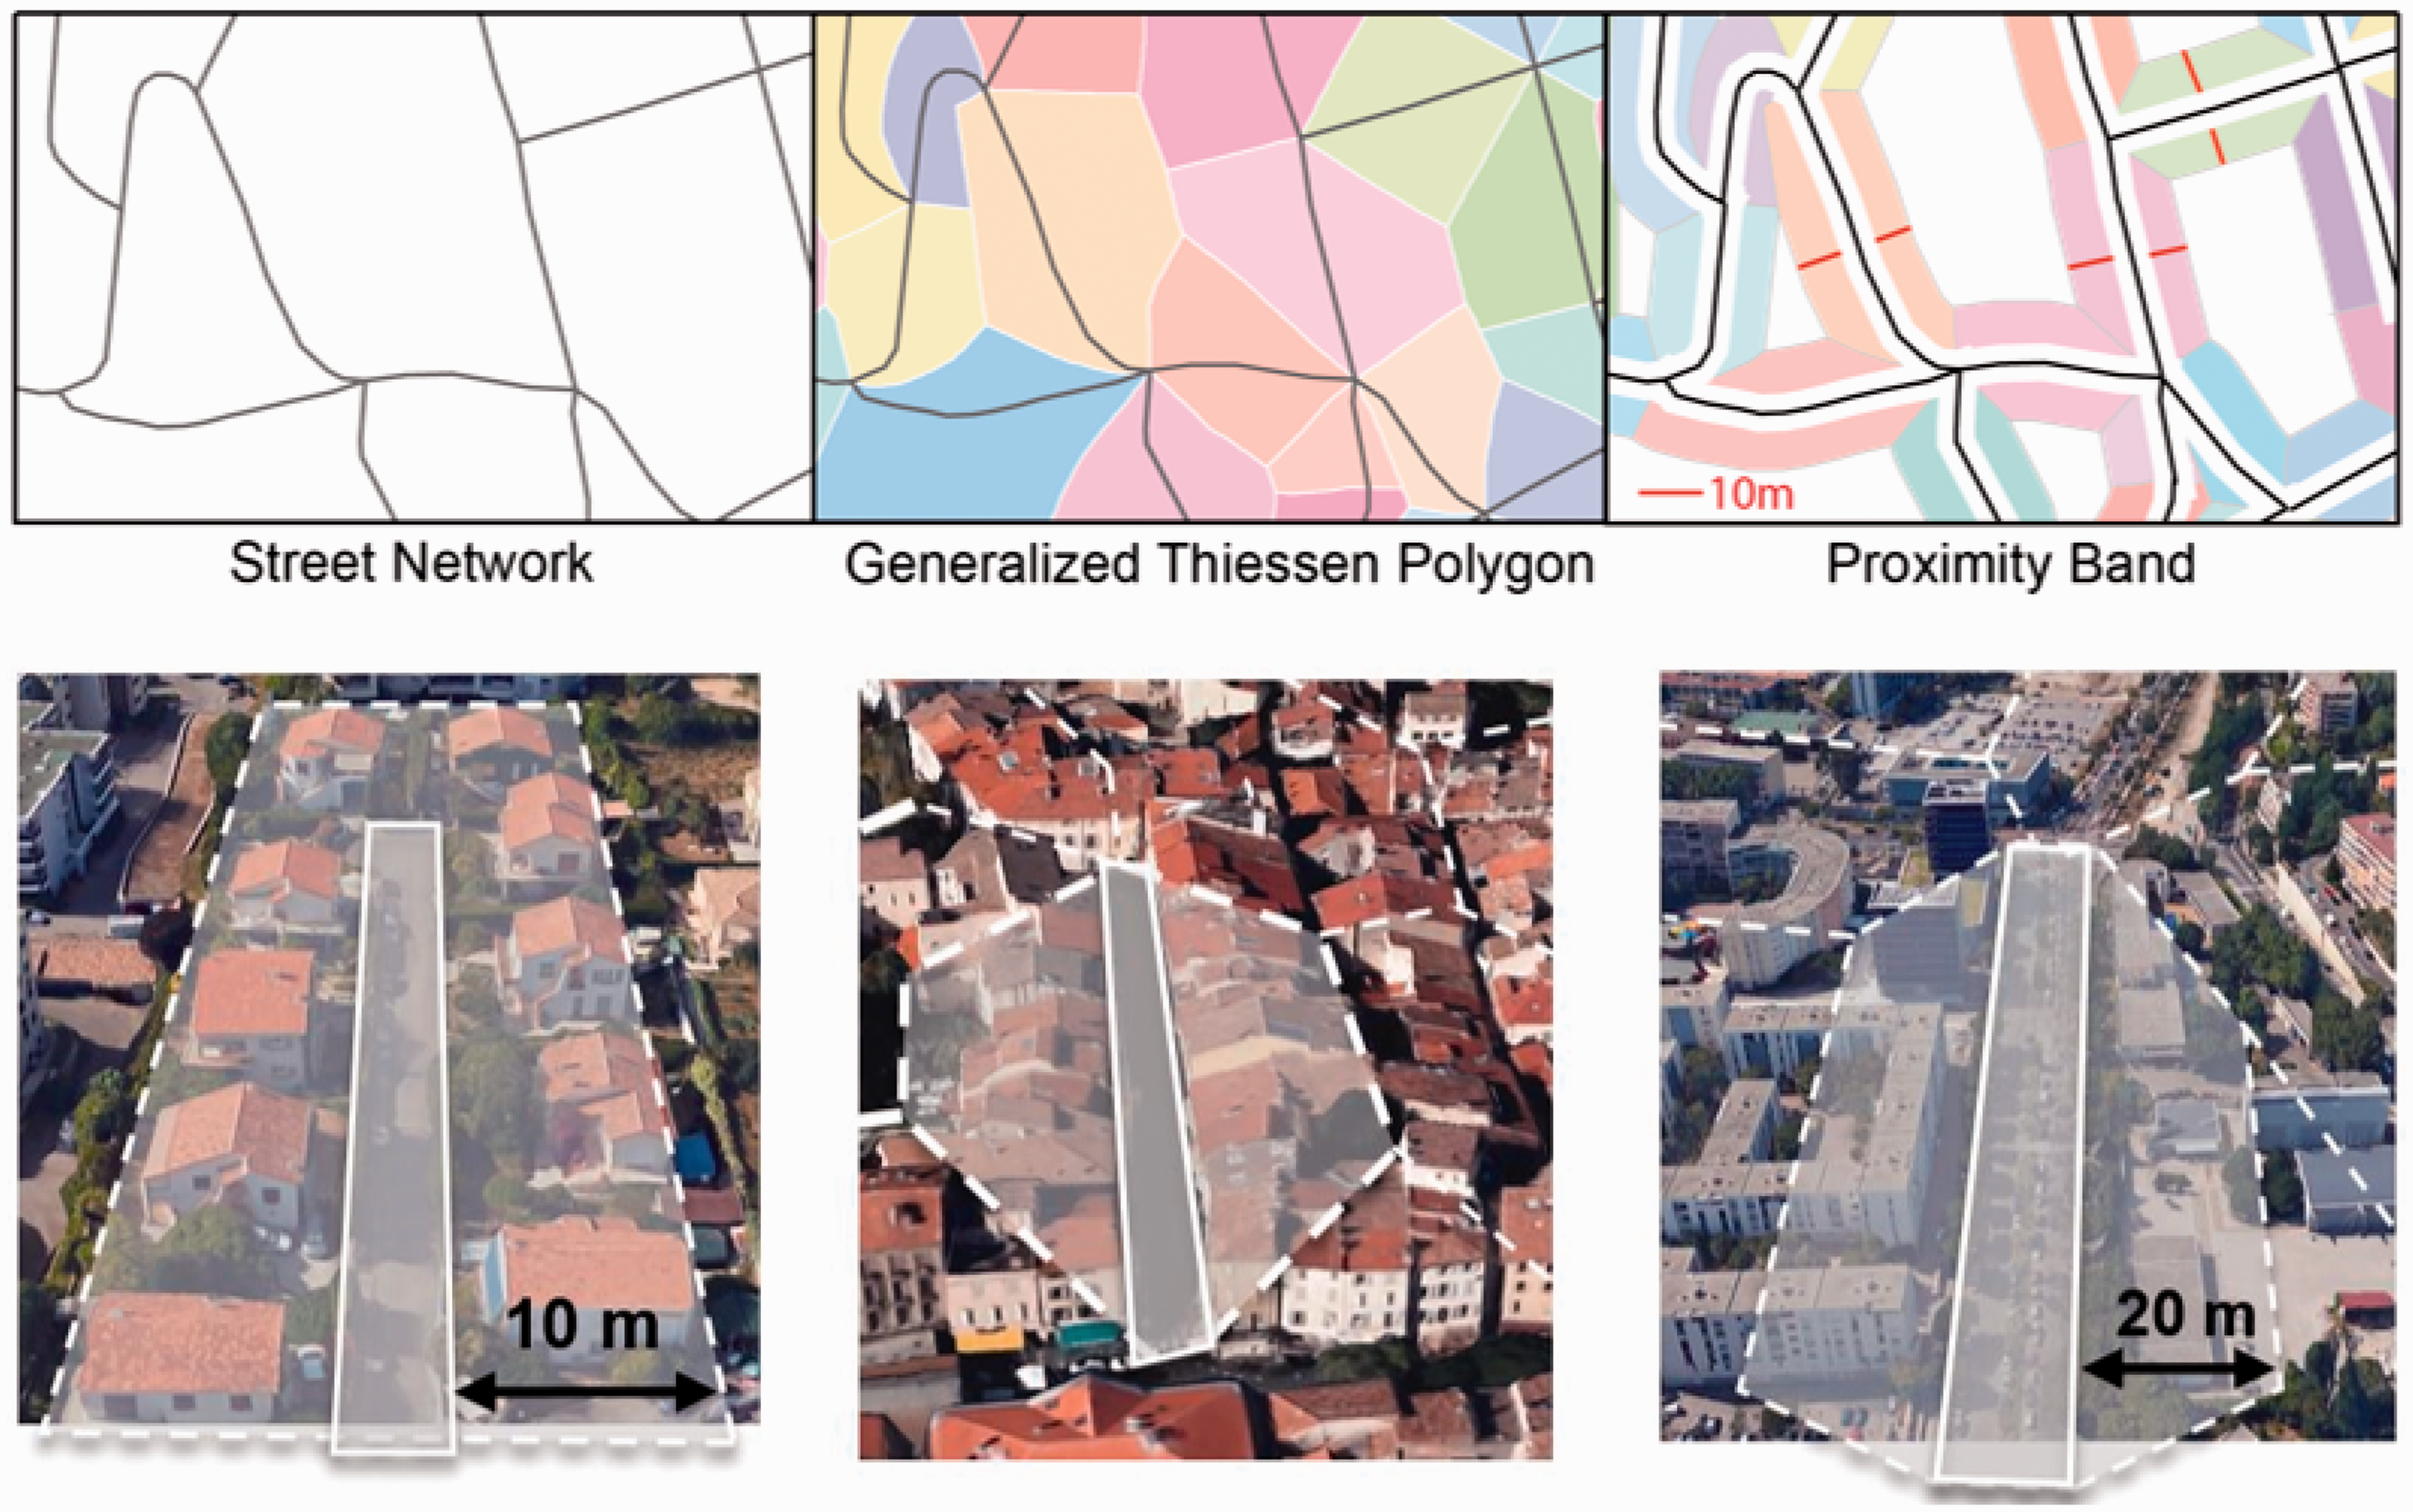
From the Street Network to the PB implementation (above): some examples (below).
Decomposing urban fabric components
Twenty-one indicators obtained through geoprocessing in GIS were calculated for each PB. Selection criteria of indicators are the relevance and complementarity of the information carried by each of them when describing the urban fabric following the theory of urban morphology analysis (Borie and Denieul, 1984) reinterpreted from the pedestrian point of view 1 (see Supplemental Appendix Figure S3).
The 21 indicators matrix for urban fabric morphology.

PB: proximity band.
Spatial patterns on networks: ILINCS
The local value of an indicator for each spatial unit is not adapted to describe the wider spatial patterns that are typical of the urban fabric, the latter being characterized by the arrangement in space of urban components with consistent morphological values. Spatial continuity and aggregation are key factors for their significance, especially if we adopt the pedestrian point of view. Several authors have suggested clustering spatial units using the raw values of morphological indicators, for example through k-means (Bernabé et al., 2013; Gil et al., 2012; Vialard, 2013). Spatial relations between adjoining spatial units are then overlooked and clustering of spatial units does not necessarily lead to the identification of urban fabrics. Through Geo-SOM, Hamaina et al. (2013) introduced spatial constraints into clustering, but their use of Euclidean distances between buildings is not coherent with our pedestrian viewpoint of the street network. We thus propose a preliminary phase of the detection of patterns for each morphological indicator, considering the spatial distribution of its values.
Local indicators of spatial association (LISA; Anselin, 1995) characterize the spatial autocorrelation of values around each unit using a local computation of Moran’s Indicator. We propose the application of their network-constrained version (ILINCS, Yamada and Thill, 2010) to morphological indicators at the street level. For each spatial unit i, 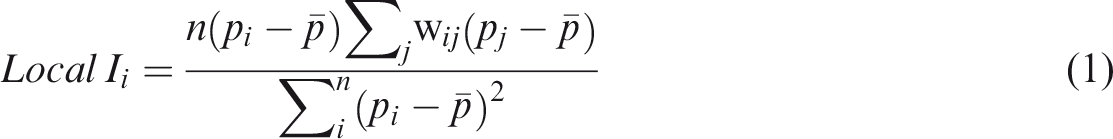
Through these network-constrained geostatistical analyses, we pass from a collection of morphological values for each spatial unit to statistically significant spatial patterns that correspond to hot- and cold-spots of given morphological characteristics, using the usual categories of LISA analysis (High–High, Low–Low, Low–High, High–Low and Not-Significant, see Supplemental Appendix Figure S4). These geostatistical classifications are the result of the analysis of the values of each PB, considering the local neighbourhood connected through the street network, with a topological depth of 3 units.
Recomposing and characterizing urban fabrics: Bayesian clustering
Our geostatistical analysis produced 21 sets of significant spatial patterns. The next step consists of studying how these overlap to yield specific combinations. The urban fabric from the pedestrian point of view is precisely the perception of persistent co-occurrences of given morphological characteristics upon exploring urban space. At the same time, a few key characteristics could identify a given urban fabric even in the presence of a certain variability of other morphological aspects. For example, a specific compact and dense traditional urban fabric could be characterized by consistently high building coverage ratio, street corridor effect, building contiguity and height/width ratio, while some heterogeneity of building types and network connectivity is seen. Clustering approaches aiming to achieve high intra-cluster homogeneity based on variance minimization of the values of all the indicators (like k-means, SOM and geo-SOM) are not well fitted to this task.
Bayesian clustering is applied here. This methodology is based on the Bayes’ Theorem and it allows each spatial unit PBi to be described with a set of probabilities of belonging to each Urban Fabric class UFj considering its description given by the set of attributes 

Two main reasons led to this choice: first, Bayesian clustering allows the identification of groups of individuals sharing a few key characteristics among the set of attributes
The combination of ILINCS and Bayesian clustering is a key feature of MFA. Instead of grouping streets depending on the similarity of their internal geometrical profile (row indicators on spatial units), we will thus perform Bayesian clustering of categorical values (HH, LL, HL, LH, NS), 4 which, in turn, summarize the statistical significance of morphological spatial patterns defined on a street network.
Results: Identification of the urban fabric families
Using eight different random seeds, 1000-step random walks explored the solution space to obtain optimal Bayesian clustering of spatial units. The search constraints were a minimum cluster content of 1% of the spatial units, a minimum average probability of 0.9 for the assignment of units to each cluster and a maximum of 20 clusters. The optimal solution is obtained by minimizing Akaike’s (1974) information criterion, which combines the log-likelihood of the clustering solution given the data with penalization for the increasing number of clusters.
Within our eight random-walk searches, the nine-cluster solution was always found to be the optimum. A successive refining phase of the nine-cluster solution was carried out by imposing this fixed number of clusters to eight new random-walk searches. The results obtained were almost identical and the best one showing a contingency table fit score of 59.4%.
The projection of the 21 variables (resulting from geostatistical analyses) in mutual information space (see Supplemental Appendix Figure S5a) shows little redundancy among morphological indicators. Variables are well separated, with the exception of Building Coverage Ratio, Building Contiguity, Height/Width Ratio and Building Frequency. The latter also have the highest mutual information with the cluster variable (Table 2 – left). However, their redundancy does not play an important role in the clustering results. When asked to select the 10 collectively (rather than just individually) most informative variables for each spatial unit, the Bayesian classifier identifies the indicators listed in Table 2 – right, in descending order of frequency, and obtains a clustering accuracy of 93.14%. Height/Width Ratio and Building Coverage Ratio are thus normally coupled with Street Acclivity, Building Frequency, Street Length and the presence of Small Buildings, and identify the same urban fabric cluster obtained with all 21 indicators. Table 2 – right also tells us that the last five morphological indicators are seldom needed to correctly predict the cluster variable. The clustering results are relatively robust in terms of sensitivity to input data. The use of the 10 most informative variables on 10 test sets obtained in a 10-fold cross-validation schema produces a mean clustering accuracy of 92.62%, just half-a-point less than the one for the model learned on the whole data set.
Indicator mutual information with cluster variable (left) and frequency of observation among the 10 collectively most informative variables (right).
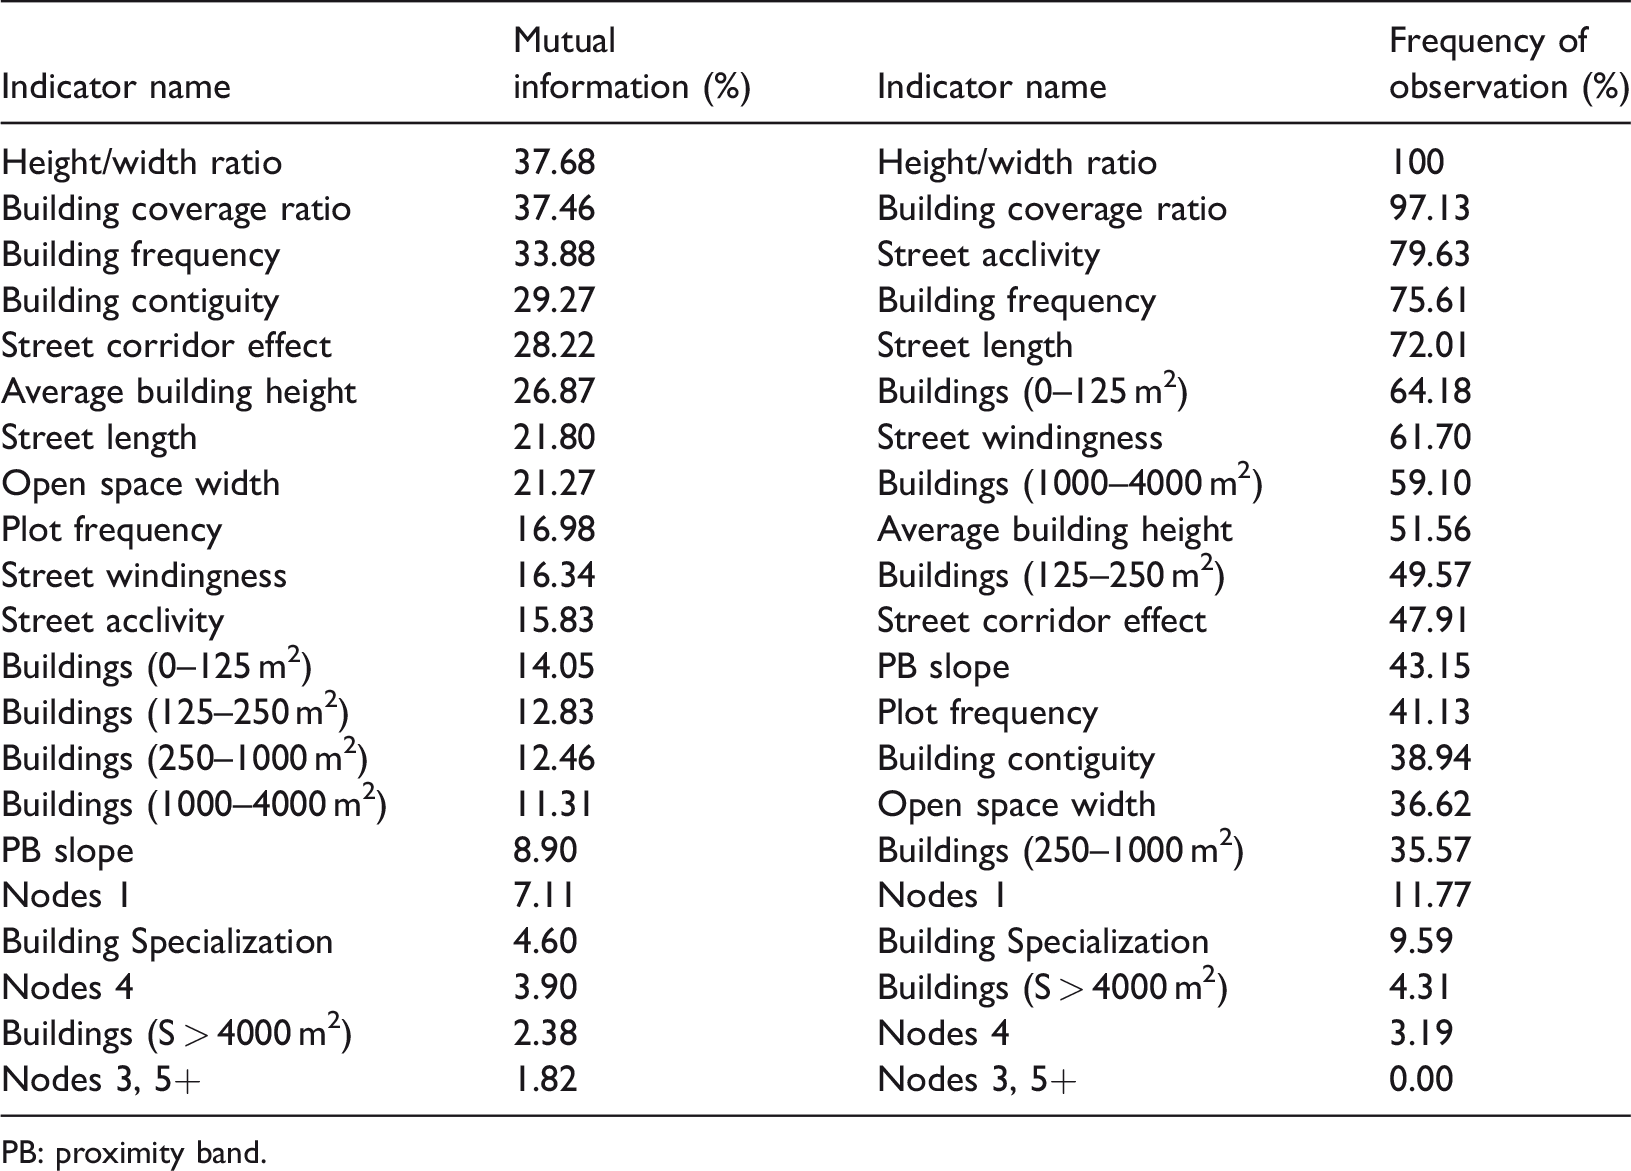
PB: proximity band.
Nevertheless, even the indicators that have the lowest mutual information with urban fabric clusters in general (Table 2 – left) or that are seldom used as the most informative variables (Table 2 – right) can have a non-negligible role in characterizing a given urban fabric, like the PB slope for cluster 6 or the frequency of Nodes 4 for cluster 2 (see Supplemental Appendix Table S2).
Even more clearly, the projection of the clustering solution (see Supplemental Appendix Figure 5(b)) shows nine well defined clusters of urban fabrics (identified as UF1, UF2, etc.). Their interpretation in terms of urban fabric characteristics (given by the Bayesian network in terms of probabilities, see Supplemental Appendix Table S2, Figure S6) goes beyond the scope of this methodological paper. We will briefly say that clusters 1, 2 and 3 correspond to the urban fabrics of the traditional compact city, cluster 4 to the modern discontinuous urban fabric, clusters 5 and 6 to residential suburban fabrics, clusters 8 and 9 to non-urbanized areas with sparse buildings and cluster 7 to a very specific connective artificial fabric, with sparse specialized buildings, bonding modern and suburban fabrics together to the traditional urban ones. Above all, when they are projected in geographic space, the clusters identify well-defined spatial patterns of connected spatial units defining the spatial extent of a given urban fabric type. Figure 2(a) represents the area around the city of Antibes. Street segments are assigned to the most probable class to which they belong. The old city centre is clearly distinguishable on the right, in a brown colour (UF1), surrounded by the traditional urban fabric of the late 19th and early 20th (UF2). More peripheral urban sectors belong to clusters 3 and 4, whereas vast suburban areas (UF5) border the city to the north and south, corresponding to the Antibes Cape. The traditional fabrics of smaller cities (here Vallauris) are islands within suburbia. Finally, the connective artificial fabric corresponds to retail developments around extra-urban roads and to the technical space around the port of Antibes. Similar results are found for the cities of the French Riviera (see Supplemental Appendix Figure S7) and these are consistent with expert knowledge of the study area (Graff, 2013). The contrast is striking with the nine-cluster solution being obtained with raw values of morphological indicators (see Supplemental Appendix Figure S8). Lacking any spatial constraint, the clustering procedure produces a mere typology of spatial units and fails to recognize that specific spatial arrangements of these typologies could be characterized as a unique urban fabric.
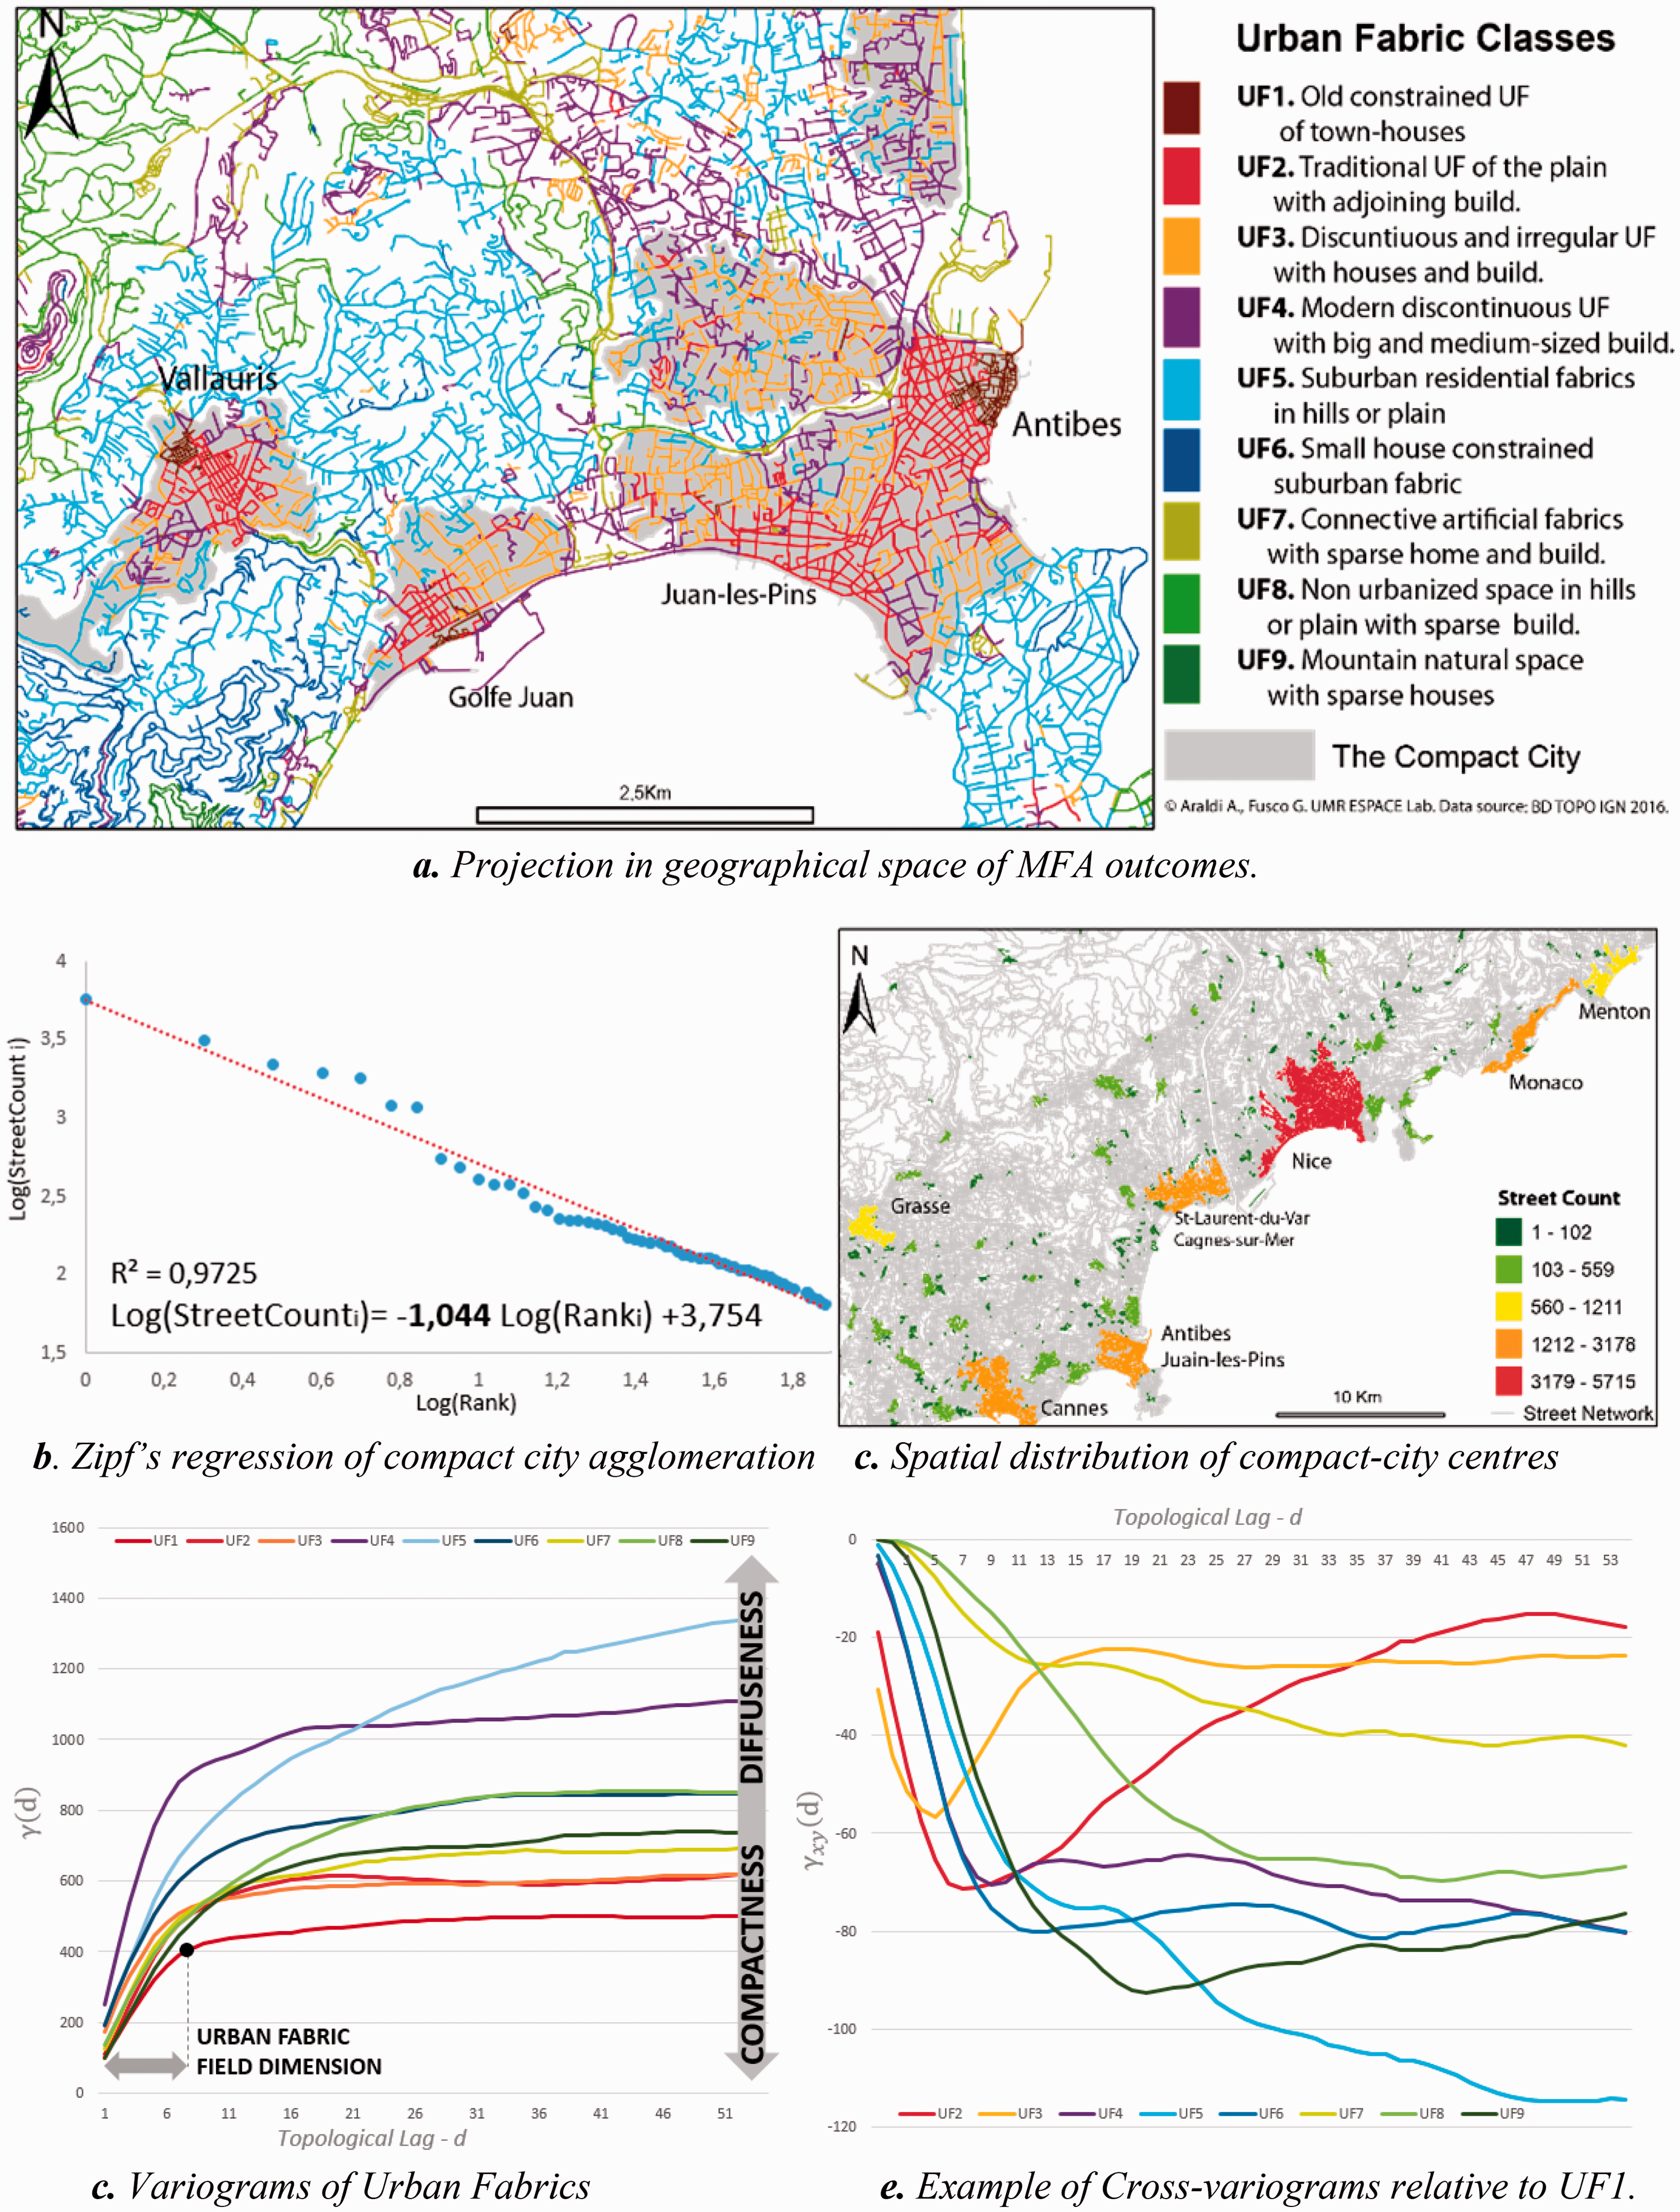
MFA outcomes and quantitative analysis of their spatial arrangement. (a) Projection in geographical space of MFA outcomes, (b) Zipf’s regression of compact city agglomeration, (c) spatial distribution of compact-city centres, (d) variograms of urban fabrics and (e) example of cross-variograms relative to UF1.
As we already mentioned in ‘Computer-aided approaches to urban morphology’ section, different objectives lead to different methodological choices in the analysis of urban fabrics. We assess the results obtained for the cities of the French Riviera as being particularly satisfactory with respect to the objective of identifying different urban fabrics potentially perceived by pedestrians moving on a street network, at the scale of a whole metropolitan area (Fusco and Araldi, 2017).
Spatial organization of urban fabrics
In the previous section, the probabilistic results of Bayesian clustering were used for the identification and description of each class of urban fabric. In what follows, new insights about urban fabric organization within settlements are disclosed through the analysis of the spatial distribution of these probabilistic outcomes. These analyses provide quantitative support to the visual exploration of outcomes of urban form clustering. Moreover, they reveal the multi-scale nature of urban form upon passing from the street level (skeletal streetscape), to the neighbourhood level (urban fabric) and to the spatial organization within a metropolitan area.
Where does the city end? Settlement boundaries and uncertainty
In the last few decades, several studies investigated indicators and techniques for measuring characteristics of settlements such as sprawl, compactness and contiguity. Nevertheless, a general consensus does not exist for the definition of urban boundaries and morphological agglomerations (Chaudhry and Mackaness, 2008; Parr, 2007; Tannier et al., 2011). Methods based on population distribution and density (Rozenfeld et al., 2008) or socio-economic administrative partitions (Parr, 2007) mainly consider functional factors. If urban morphology is considered independently, other procedures have been proposed: a dilation-erosion procedure applied to the building footprint (Chaudhry and Mackaness, 2008) or fractal approaches applied to both raster and vector representation of the building surfaces (Longley et al., 1991, 1992). A dilation method is the starting point of both these approaches: Minkowski dilation for Tannier et al. (2011); morphological mathematics in Benediktsson et al. (2003), Chaudhry and Mackaness (2008). The former investigates the variation in the number of aggregated elements at each dilation step in the overall space study, while the latter combines the dilation procedure with subsequent erosion. Both methods are applied to a Euclidean space and to elementary components (buildings, built-up pixels, etc.) without any semantic characterization of their urban content.
We were motivated by the same underlying principles as described in ‘Computer-aided approaches to urban morphology’ section and propose here the application of the aforementioned dilation-erosion procedure to the MFA probabilistic outcomes, while respecting network contiguities. MFA results are used for the delineation of the boundaries of the traditional compact city. We will first use the semantic information of our urban fabric types and select clusters 1, 2 and 3 as sharing similar characteristics specific to the traditional urban compact environment. We will filter PBs for which p(UF1)+p(UF2)+p(UF3)≥0.8 to focus on those elements that were assigned to the compact city with relatively low uncertainty. Applying topological dilation-erosion to networks of selected spatial units, we can identify urban spaces where compact city characteristics might be considered as belonging to the same urban continuum, thus defining compact city borders (Figure 2(a) to (c)).
Moreover, the count of the number of street segments in each resulting aggregation describes the hierarchy of compact urban settlements within the French Riviera. Zipf’s regression on log(Si)−log(Ranki) shows a regression coefficient of 1.04 with a R2 value of 0.97 (Figure 2(b) and (c)). Despite the different implementation technique used, this value is close to the 1.095 obtained at the national scale by Oliveira et al. (2018). This observation seems to endorse the universal validity of Zipf’s Law as defended in Jiang et al. (2015). A discussion of the validity of Zipf’s Law for urban settlements transcends the goal of this paper. What we intended to show here is how MFA results could be used to identify and study borders of traditional settlements within a wider metropolitan area as well as their spatial organization at the regional scale with a network-based morphological approach.
From quantitative outcomes to the archetype model
Correlography and variography represent quantitative approaches that are usually applied in geology and ecology for the analysis of the spatial organization of phenomena under study (Legendre and Legendre, 1998). The former investigates and tests the presence of significant spatial autocorrelation in the data set, while the latter allows the description of its spatial organization and the observed structure to be related to hypothesized generation processes.
‘Spatial patterns on networks: ILINCS’ section described the adoption of autocorrelation analysis to identify statistically significant spatial patterns for each morphological indicator. The classification outcomes identify subspaces with a specific combination of spatial autocorrelation values by construction. Variography is adopted in this section, to quantitatively describe the spatial arrangement of urban fabrics throughout the network.
Within the Regionalized Variables Theory, empirical semi-variograms (called variograms for simplicity) are geostatistical functions conceived by Matheron (1965) to describe spatial phenomena combining the structural factor with a random noise component. In this theory, fluctuations of spatial distributions are considered to be a characteristic of the phenomena with a specific structure at a given scale, rather than statistical noise. Variograms quantify the similarity between the value observed at a point i and those observed at increasing distances within its surrounding area. The final aim of these functions is to quantify the zone of influence of a phenomenon. Variogram function 
The application of variograms could reveal the spatial structures of the study field, the presence of nested structures, discontinuities, anisotropies and the size of the influence zone of phenomena (Dauphiné and Voiron-Canicio, 1988). An interesting variation of the variogram is the cross-variogram, which focuses on the co-variance of two phenomena in space. Equation (1) is reformulated as

Here, we will use the probabilistic outcomes of Bayesian clustering as an input of variography in order to disentangle the complex spatial arrangement of urban fabrics. A network-constrained topological variogram is implemented where yi represents the probability that a PB will be associated to a UF of class j, p(PBi = Classj), while the weight matrix W is determined by network topological contiguities.
From empirical variograms applied to each probability distribution (Figure 2(d)), two pieces of information can be retained: the range is the distance at which data are no longer correlated. This informs us about the extent of each urban fabric field (similarly to the concept of urban field in Longley et al., 1991), which could be used to characterize homogeneous morphological regions made up of a single urban fabric type. The sill is calculated as the limit of the variogram tending to infinity distances and informs us about the relative compactness/dispersion of the spatial distribution of each urban fabric in the metropolitan area. Higher γ(d) values detect strong dissimilarities between association probability values at a given distance d and they characterize those morphological regions with larger extents combined with spatial fluctuations (namely suburbs made of urban fabrics 5 and 6 but that integrate fragments of different types). Vice versa, smaller, compact spatial distribution are identified by lower γ(d) values (as for UF 1, 2 and 3).
γxy cross-variograms inform us about the spatial co-variation of two urban fabric types at increasing distances. As Bayesian probabilities add up to one for each street segment, the resulting function
The information extracted by variograms and cross-variograms helps analysts in the generalization of urban fabric organization of the study area. This results in a proposal of the archetypical model of urban settlements in the French Riviera (see Supplemental Appendix Figure 9; see Fusco and Araldi, 2017 for a more detailed description).
Conclusions and perspectives
This paper presented MFA, a new methodology for the analysis of the urban fabric, and showed how to exploit MFA results in the study of a vast metropolitan area. MFA is characterized by three main methodological innovations. First, the definition of morphological indicators for PBs, integrating the pedestrian point of view of the urban fabric. Second, geostatistical analysis is used to transform quantitative local measurements in categorical network-based patterns that are later used as inputs for clustering. Third, unlike more traditional approaches, Bayesian clustering considers specific subsets of indicators for each class identified. The method proved successful in the identification of urban fabrics and their spatial arrangements in the real-world case of the French Riviera metropolitan area.
Bayesian calculus was also used to assess the capacity of optimal subsets of morphological indicators to produce the same clustering results. The calculus cannot be used to identify missing variables. Only a qualitative assessment of results can provide hints in this direction. For example, the integration of vegetation into the characterization of urban forms could allow finer distinctions within urban and suburban fabrics. Another advantage of Bayesian clustering is its probabilistic content, which has been exploited in this analysis of spatial structures within the metropolitan area. Probabilities could also be used to assess uncertain characteristics of some urban fabrics and/or the uncertain assignment of street segments to urban fabrics.
The use of street PBs to study the urban fabric might bring new perspectives to the analysis of pedestrian-related phenomena. The contextual information resulting from MFA could represent the input for further analysis such as geographically weighted regression, hedonistic and multilevel modelling that is traditionally implemented in domains like walkability, retail, crime or environmental psychology.
The combination of geostatistics and Bayesian clustering represents an innovative procedure which is not limited to our definition of spatial units. These two approaches could also be applied to other spatial partitions, more appropriate for other research goals (i.e. block-, plot- or building-based partitions). This would allow traditional urban fabric analysis to integrate both the study of spatial heterogeneity of morphometric indicators and their specific combinations in defining urban forms.
In the second part of the paper, mathematical morphology and variography, both adapted to urban street networks, were implemented on MFA outcomes. These methods represent two valid procedures for a quantitative analysis of the spatial organization of urban fabrics. Several topics could be investigated, like compact city limits, urban fabric fields and arrangements within settlements. Through these procedures, MFA makes a contribution to the long-felt need for more clarity in the identification of morphological regions (Larkham and Morton, 2011).
In our analyses of the physical city’s form, we drew a careful distinction between the study of the urban fabric and that of the configurational properties of street networks. MFA is devoted solely to the former. We envisage the convergence of the urban fabric analysis and configurational analysis as a future research perspective to better understand urban space. After all, streets represent ‘the strongest and most familiar connection’ between these two approaches of urban morphology studies (Kropf, 2017). The street network-based partition of MFA shares the same primal representation as MCA in configurational studies. Their combination is therefore easily achievable. Some adaptation is needed when results from MFA and SSx are combined. This convergence could also be the most promising perspective in the study of form–function relations in urban space.
Supplemental Material
Supplemental material for From the street to the metropolitan region: Pedestrian perspective in urban fabric analysis
Supplemental Material for From the street to the metropolitan region: Pedestrian perspective in urban fabric analysis by Alessandro Araldi and Giovanni Fusco in EPB: Urban Analytics and City Science
Footnotes
Declaration of conflicting interests
The author(s) declared no potential conflicts of interest with respect to the research, authorship, and/or publication of this article.
Funding
The author(s) disclosed receipt of the following financial support for the research, authorship, and/or publication of this article: This research was carried out thanks to a research grant of the Nice Côte d'Azur Chamber of Commerce (CIFRE Agreement Number 2015/1478 with UMR ESPACE).
Notes
Supplemental material
Supplemental material for this article is available online.
References
Supplementary Material
Please find the following supplemental material available below.
For Open Access articles published under a Creative Commons License, all supplemental material carries the same license as the article it is associated with.
For non-Open Access articles published, all supplemental material carries a non-exclusive license, and permission requests for re-use of supplemental material or any part of supplemental material shall be sent directly to the copyright owner as specified in the copyright notice associated with the article.