
Abstract
Seoul, the capital city of South Korea, has diverse urban forms developed through its complex history. Previous studies show limitations of strong subjectivity and difficulty in scalability in identifying typical Seoul urban forms with expert knowledge. Data-driven approach offers an opportunity to address those challenges, but previous studies often focused on direct applications of clustering algorithms to a given area with diverse methods and workflows, lacking a systematic framework. This study addressed these issues by developing a new form clustering framework to systematically identify form typologies at a large scale and demonstrated its application in Seoul. With a 500 m × 500 m grid as the basic spatial unit and twelve urban form attributes as learning features, 14 clusters were identified using the Gaussian mixture model. These clusters were further translated into form typologies following a semantic typology naming system, with representative form samples identified. The resulting typologies were then verified and validated through comparisons with previous studies. Their relationships with zoning classes were also examined, emphasizing their role in urban planning and design. Results suggest this new framework is an effective and promising way to identify urban form typologies in complex urban environments to better support urban planning and management.
Keywords
Introduction
Understanding complex urban form in Seoul
Seoul is the largest city in South Korea, the country’s capital, and a major megacity in East Asia (Joo, 2018). Its rapid urbanization has seen urban areas developed with diverse patterns, forming a highly heterogeneous urban form evident in Seoul today (Chu and Yang, 1991; Seoul Metropolitan Government, 2017). Differences among urban form patterns reflect their respective diverse socio-economic, cultural, historical, and regulatory characteristics. Urban planners and policymakers in the city have, therefore, continuously formulated targeted and effective policies for highly diverse urban patterns (SDI, 2009).
To simplify the complexity in urban form and better support policymaking, urban form typology approach was adopted to classify these patterns into several groups (Yeo and Byun, 2010). Most studies focused on individual urban form typologies and the transformation of their street and plot patterns; these studied typologies include the downtown area (Sohn and Han, 1996; Baek and Ahn, 2012), grid residential areas (Park and Choi, 2003; Yeo and Cho, 2010), apartment complexes (Lee, 2012), and superblocks (Jung and Kang, 2012). See the Individual Urban Form Typologies in Seoul section of the Supplementary Material for details.
Aside from those studies on individual typology, Seoul’s urban forms have been classified as typologies more comprehensively by two studies. Kim (2003) identified seven typologies for eight 500 m × 500 m areas based on typicality, density, and housing type. Among the typologies, two are in city centers, and five in mid or high-density residential typologies. In the other study, Seoul Development Insititute (SDI) identified seven urban form typologies from 30 area samples according to their morphologic forms, development method, and development periods (SDI, 2009). While these studies provide helpful reference for planning and policy, both were based on researcher expertise and their study areas only covered a tiny proportion of the entire city.
Expert knowledge-based and data-driven urban form typology studies
Urban form typology is an important concept in urban morphology studies to understand spatial structures and urban development evolution (Scheer, 2016; Moudon, 1997). Scholars in other fields of urban studies, including urban sociology (Vaughan et al., 2005), urban climate (Stewart and Oke, 2012), energy (Quan et al., 2020), and transportation (Frank et al., 2008), also applied similar typology concepts to classify distinctive urban areas. In urban studies, direct examination of urban form over a large geographic area is often a challenging task because of complex urban forms. The urban form typology method reduces urban form to only several form groups, often named typologies where these urban forms are similar. The identified typologies provide a succinct representation of complex urban forms for more straightforward analysis.
Two major approaches have been mainly adopted to identify urban form typology in previous studies: expert knowledge-based and data-driven approaches. In the first approach, urban form typologies are generally determined using expert knowledge and experience for analysis of different topics, such as urban morphology (Kropf, 2018; Moudon, 1994), energy use (Rode et al., 2014), solar energy potential (Chatzipoulka et al., 2016), and microclimate (Tsoka et al., 2017). However, identifying the typologies is mostly subjective and depends on researchers’ expert knowledge. When the urban form of interest is highly complex, processing the large and diverse form information and subsequently providing synthesized solutions become difficult for researchers (Alexander, 1965). Moreover, this approach often requires a significant amount of manual work, which prevents it from being applied to a large urban area. Hence, previous works mostly focus on a few neighborhoods instead of an entire city.
In the second approach, urban form typologies are usually directly identified using urban form data. While data collecting and processing are not immune to subjectivity and bias (Bender et al., 2021), the data-driven approach nonetheless does not rely heavily on expert knowledge and experience in identifying urban form typologies. This allows it to better handle complex urban form and large-scale implementation based on formal data analysis, and is more scalable and generalizable. This advantage has made this method increasingly popular, especially with the growing availability of big urban data.
The data-driven approach was applied in identifying urban form typologies in urban contexts in Europe (Berghauser Pont and Olsson, 2017; Bobkova, 2019; Gil et al., 2012; Schirmer and Axhausen, 2016), North America (Song et al., 2013; Vialard, 2013), and Asia (Asami and Niwa, 2008). These studies have diverse definitions of the basic spatial unit (BSU), form components, and clustering methods. Their adopted BSUs usually include a buffered building footprint (Schirmer and Axhausen, 2016; Song and Knaap, 2007), a plot (Asami and Niwa, 2008; Bobkova et al., 2019), a buffered plot (Berghauser Pont et al., 2019), an urban block (Gil et al., 2012), a neighborhood (Song et al., 2013), and a grid (Jochem and Tatem, 2021; Jochem et al., 2021; Heris et al., 2020). In these studies, the urban form was studied mostly as a whole consisting of buildings, plots, and streets; with only a few cases focusing on a specific individual component.
Clustering algorithms in most studies are the k-means (Gil et al., 2012; Berghauser Pont et al., 2019; Schirmer and Axhausen, 2016) and hierarchical clustering (Song et al., 2013; Asami and Niwa, 2008). Other studies adopted other clustering algorithms, such as the k-medoids (Schirmer and Axhausen, 2016), fuzzy c-means (Berghauser Pont and Olsson, 2017), latent class analysis (Schirmer and Axhausen, 2019), Bayesian clustering (Araldi and Fusco, 2019), and the Gaussian mixture model (GMM) (Jochem et al., 2021).
Major limitations in data-driven typology studies
While data-driven studies showed great potential in finding urban form typologies in cities, they often focused on the direct application of specific clustering algorithms to a given area, with a limited discussion about integrating domain knowledge into the process. A general and systematic framework is often lacking in the field, which connects urban data, clustering algorithms, and interpretation of resulting typologies to streamline the process and better support planning and design practice. Specifically, aside from routine steps such as the data preprocessing, the necessary steps should contain the definition of BSU, the measurement of urban form, the selection of clustering algorithm, the identification of typical urban form, and the verification of resulting typologies. However, previous studies on form clustering mainly focused on the steps before clustering and had limited consideration of the post-clustering steps to interpret and verify the typologies—even in the preparation steps for clustering, there was a general lack of justification for selected methods.
The limitations in the five steps present corresponding challenges in the further development of form typology studies. The diverse BSU definitions in previous studies, ranging from a building to a neighborhood, were decided based on the purpose of the studies. However, these are too hinged on specific areas and have difficulty supporting comparative studies across cities. For urban form components, many previous studies selected components for clustering without sufficient justification. In this critical step, where urban form information is extracted from raw data, domain knowledge about the urban form structure should be carefully considered to properly measure urban form characteristics and reach meaningful clusters as urban form typologies.
The choice of clustering algorithm is also a major challenge. Previous studies applied different types of clustering algorithms which can be generally grouped into three categories: partitional clustering, hierarchical clustering, and model-based clustering algorithms (Abdullah and Hamdan, 2015). While some studies compared a few clustering algorithms, a general comparison focusing on the suitability for urban form studies is lacking, therein rendering the choice of the clustering algorithms less well founded. Among the three clustering algorithm categories, partitional clustering algorithms usually determine clusters in a single partition by minimizing the sum of the squared distances within clusters against overall clusters (Hartigan and Wong, 1979).
However, partitional clustering algorithms often have strong assumptions that often do not apply in complex urban forms. For example, the widely used k-means in this category assumes equal cluster size and attribute variance, which are often far from the case in actual urban environments. Hierarchical clustering algorithms work differently: these determine clusters in hierarchical relationships in agglomerative or divisive modes based on a proximity matrix (Jain, 2010). However, these are often criticized due to their lower accuracy in clustering high-dimensional data. The third category, model-based clustering algorithms, is characterized by modeling data with a finite mixture of probability distributions instead of proximity between data points (Raftery and Dean, 2006). Common algorithms herein include latent class analysis, Bayesian clustering, and GMM.
Among the three categories of clustering algorithms, the model-based clustering algorithms seem to be the most suitable for clustering urban forms due to their better handling of high-dimensional data with different scales in dimensions and certain underlying distributions (Vermunt and Magidson, 2002; Dahl, 2006). Particularly, GMM (Mohamed et al., 2016) is widely used in many fields due to its advantages of high interpretability and straightforward implementation based on the assumption of Gaussian distributions in data (Bouveyron and Brunet-Saumard, 2014). These characteristics are very important in urban form studies; hence, GMM has been receiving more attention in recent urban form typology studies (Jochem et al., 2021; Jochem and Tatem, 2021).
The interpretation challenges for found clusters include the naming of form typology in each cluster and the identification of the representative form for each typology. Naming resulting clusters is critical as it translates clusters used in the statistical language to typologies used in the language of design and policy. Despite this, most previous studies named clusters as form typologies based on observations and conventions without clear rules, often resulting in omissions, overlaps, and conflicts in the semantic meanings of cluster names. A naming system is hence required to better interpret clusters. Once typologies are defined and named, the identification of the representative form, a typical sample in each typology, can help greatly in understanding the corresponding typology, which still contains forms with variations. However, most previous studies did not provide such an illustration—even among a few studies having representative forms, those typical samples were selected without clear and systematic criteria (Song and Knaap, 2007; Schirmer and Axhausen, 2016; Colaninno et al., 2011; Berghauser Pont and Olsson, 2017). This remains a research gap to fill.
The typology verification and validation were generally neglected in previous studies, with only a few studies validating their clustering results through visual inspections (Berghauser Pont and Olsson, 2017; Schirmer and Axhausen, 2016, 2019) or comparisons with predefined typologies (Gil et al., 2012). Verifying and validating resulted typologies are critical in evaluating the effectiveness and avoiding the bias of the data-driven method. However, they remain a challenge because there is no “ground truth” for urban form typology coupled with the very few manually defined typologies existing in cities for comparison.
Contribution of this study
This study aims to address these gaps in the research by developing a new urban form clustering framework and applying it to identify urban form typologies in Seoul. Different from previous studies, this framework defines a systematic workflow, including the definition of BSU, selection of form attributes, implementation of the clustering algorithm, interpretation of resulted clusters, and verification of identified typologies. Following this framework, the domain knowledge and the data-driven method are integrated to identify meaningful urban form typologies. The framework was applied in Seoul to identify 14 urban form typologies, which were then compared with previous Seoul form typology studies using the expert knowledge-based approach to verify and validate the results. These results were further compared to zoning classes to highlight the potential complementary role of form typologies in urban planning and management.
Methodology
A new Gaussian mixture model-based clustering framework
A new clustering framework was developed to identify urban form typologies in a large urban area. This framework is based on GMM, a widely used clustering algorithm able to handle complex urban forms and is straightforward for interpretation. The framework has five steps: the definition of BSU, the measurement of urban form attributes, the application of the clustering algorithm, the interpretation of clusters as typologies, and the verification and validation of resulting typologies. Through these steps, the new framework streamlines the workflow to connect raw urban data, the domain knowledge in urban form, and analytical models to systematically identify urban form typologies.
Study area and data
Seoul has an area of approximately 605 km2, with the Han River flowing through the city center, and four major mountains surrounding the city. Its population is approximately 9.9 million, with a population density of about 16,000 people per km2.
This study collected GIS data on Seoul’s buildings, streets, plots, water features, and green areas in 2018. The building construction, street, water body, and elevation information data were provided by the National Geographic Information Institute (2019). The building age information and plot data were provided by the Ministry of Land Infrastructure and Transport (2018; 2019). And the green space information was provided by the Seoul Metropolitan Government (2019).
Grid as BSU
While there have been discussions about different BSU definitions in urban form studies (Fleischmann, 2019; Ma et al., 2021; Quan and Bansal, 2021), this study adopted the grid as BSU as it provides consistent scale comparisons for urban forms within the same city and across cities. The BSU of a grid also allows integration with other spatial data, such as raster-based remote sensing data (Jochem et al., 2021). This makes it a promising approach in urban data management with increasing applications in recent years (Heris et al., 2020; Jochem and Tatem, 2021; Jochem et al., 2021).
Here, the basic grid structure was generated as a North-South orthogonal grid starting from the bottom-left corner of the bounding box of the city boundary. The grid size was determined by referring to the urban tissue, neighborhood scope, and previous form typology studies in Seoul. The BSU of urban form typology acts as an urban tissue to reflect the local form structure, usually containing a few blocks. Therefore, the grid size is defined as bigger than 100–200 m, given the average block size of 9490 m2 with a standard deviation of about seven times that average size.
The BSU was also made to correspond to the typical scope of neighborhoods and local communities. In Seoul, a neighborhood unit is often defined with a diameter of 500 m based on the walking distance, public facility management, and community levels in Seoul (Yang, 1993; Gye and Cheon, 2000). Therefore, a 500 m grid size is plausibly aligned with the neighborhood development. Additionally, the BSU size of 500 m defined by experts in previous form typology studies in the same city is an important reference. After comprehensively considering these factors, a grid size was decided as 500 m.
Because the study focuses on the built environment, grid cells with an entirely natural environment, which refer to areas with no buildings, streets, or plots, were excluded from the study (Figure S1 in the Supplementary Material). The final study area comprised 1701 grid cells (see Figure 1).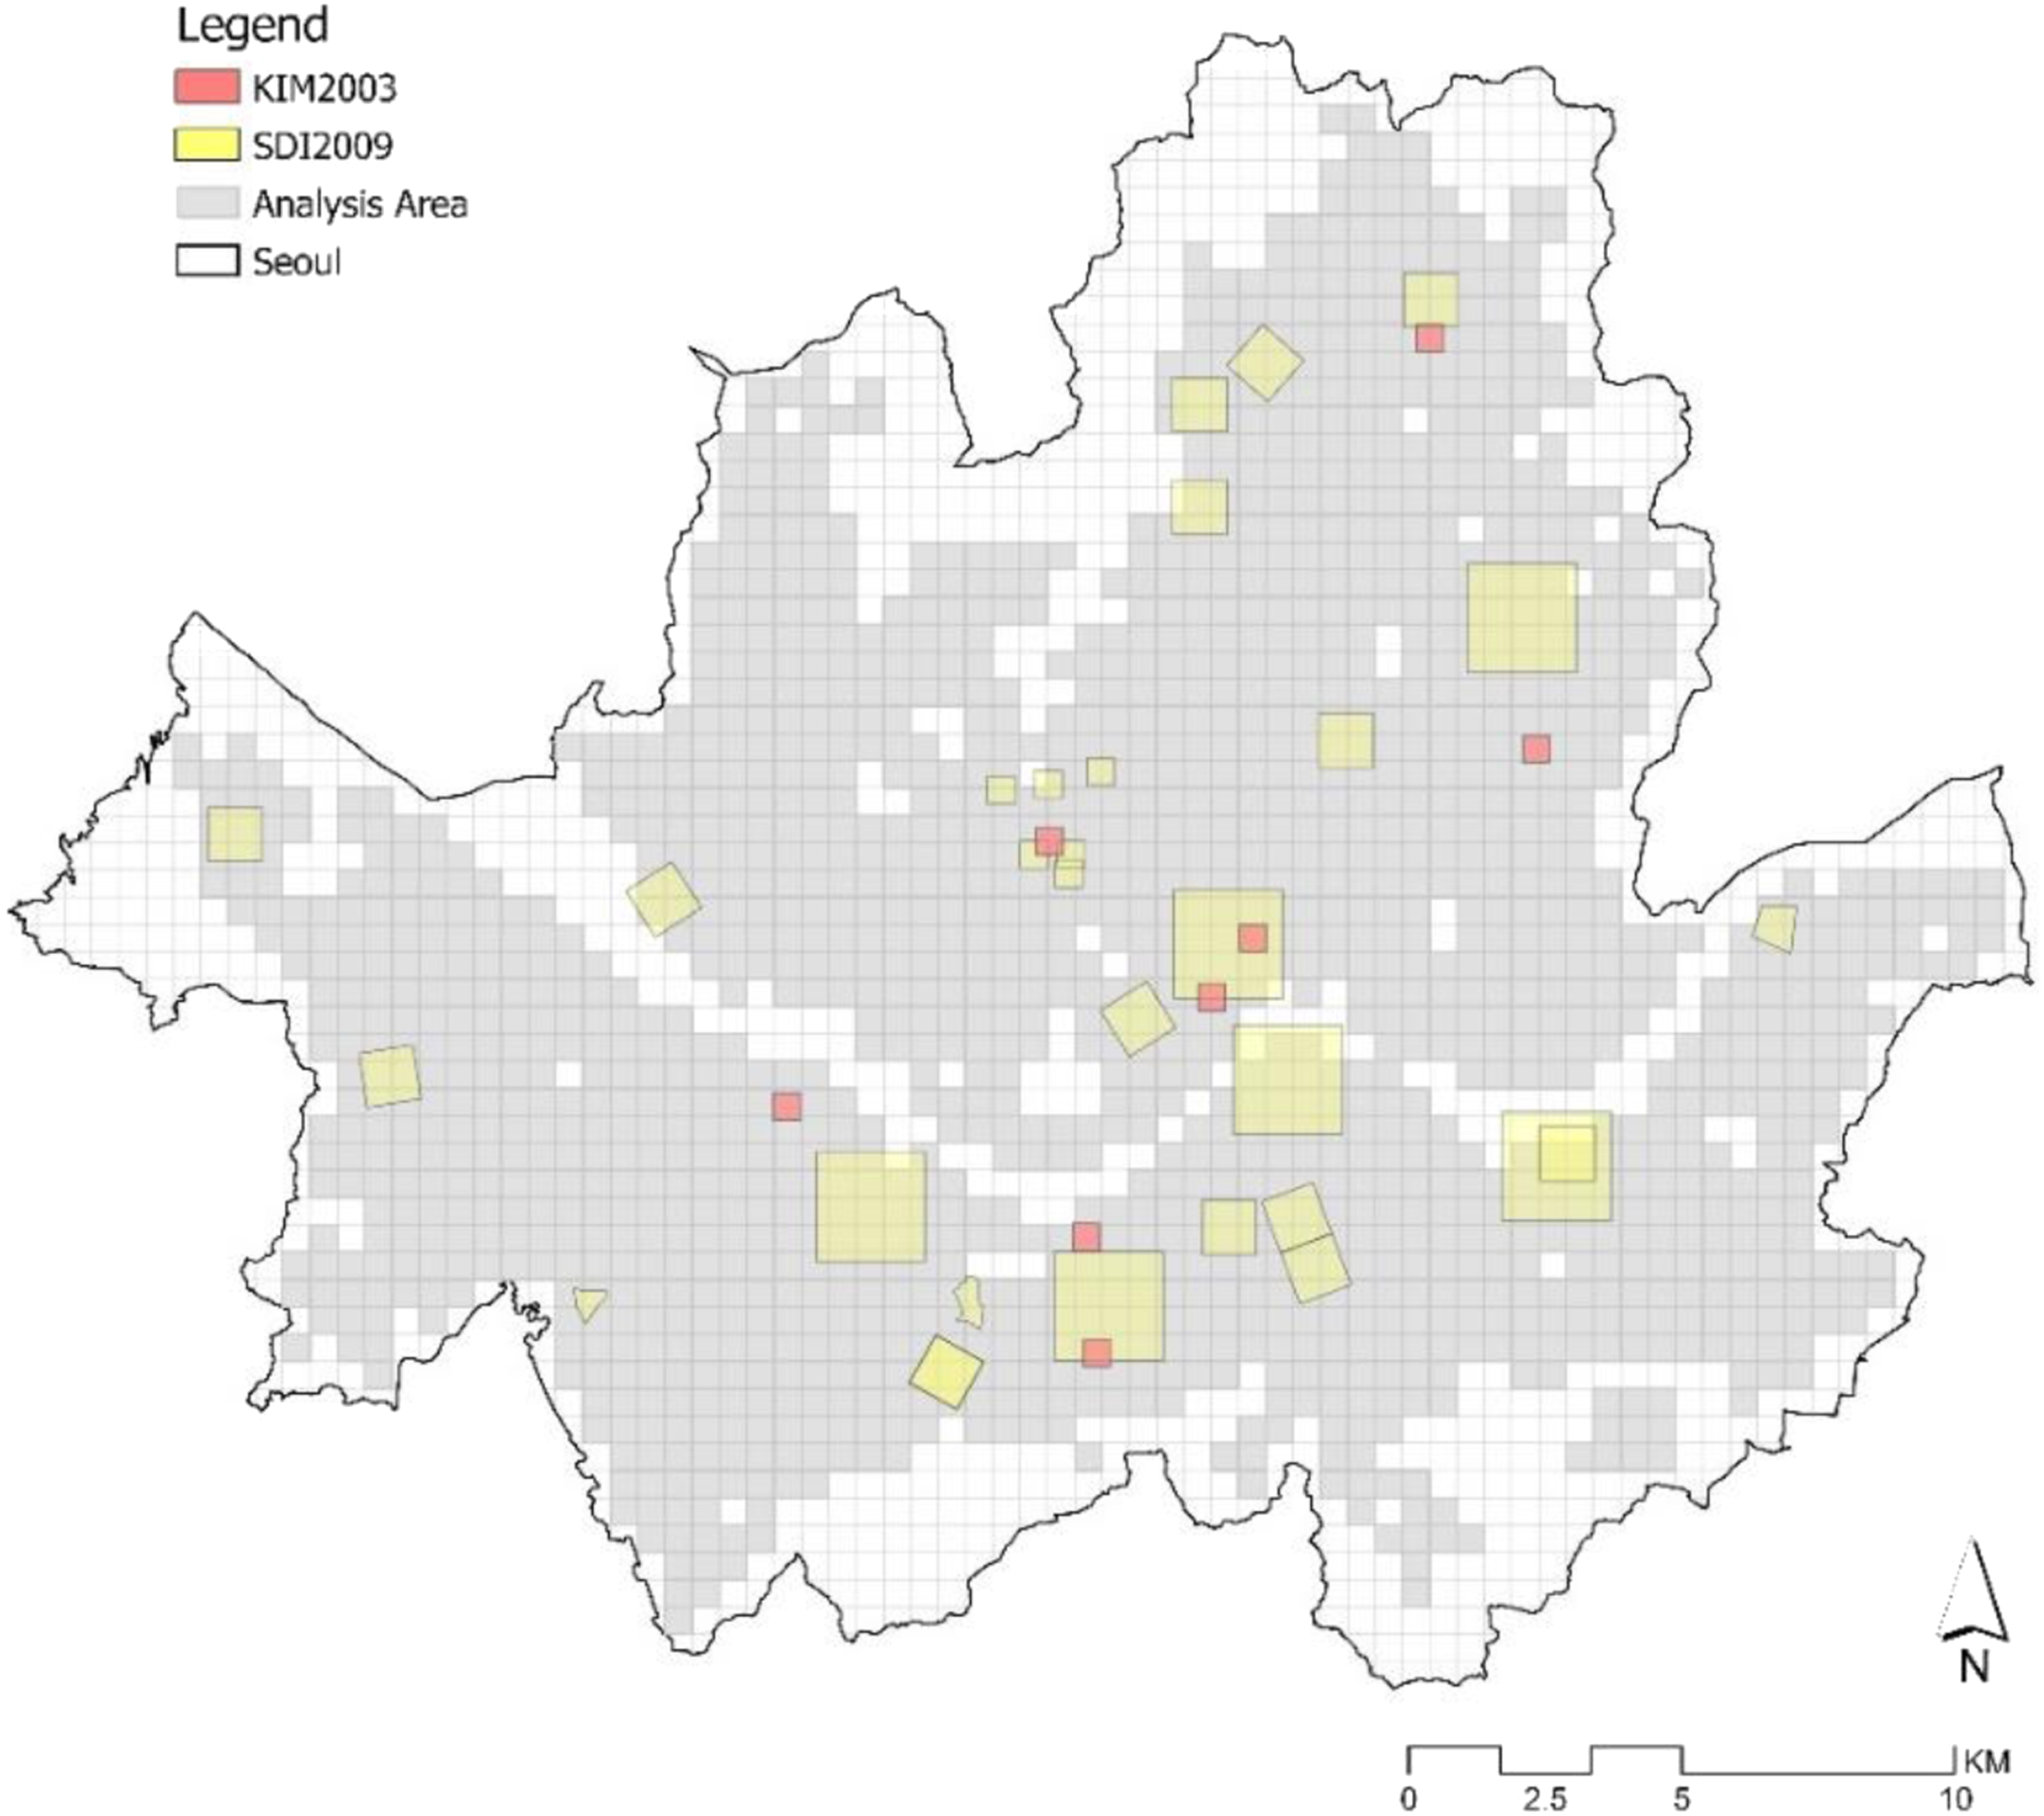
Urban form attributes
The choice of urban form attributes followed the structure of urban form elements (see Figure 2). The structure was developed following studies in urban morphology (Moudon, 1997, 2019; Kropf, 2018). Twelve attributes were selected to measure those elements (Table 1) based on previous studies (Schirmer and Axhausen, 2019; Berghauser Pont et al., 2019; Gil et al., 2012; Berghauser Pont and Olsson, 2017; Kropf, 2018). For simplicity and consistency, attributes values for each grid cell were estimated in ArcGIS based on the whole or parts of urban form elements in the grid cell, the latter being applied when the grid boundary cuts across the form elements. Structure of urban form elements. Urban form attributes used in the analysis of Seoul. Note: N: Number.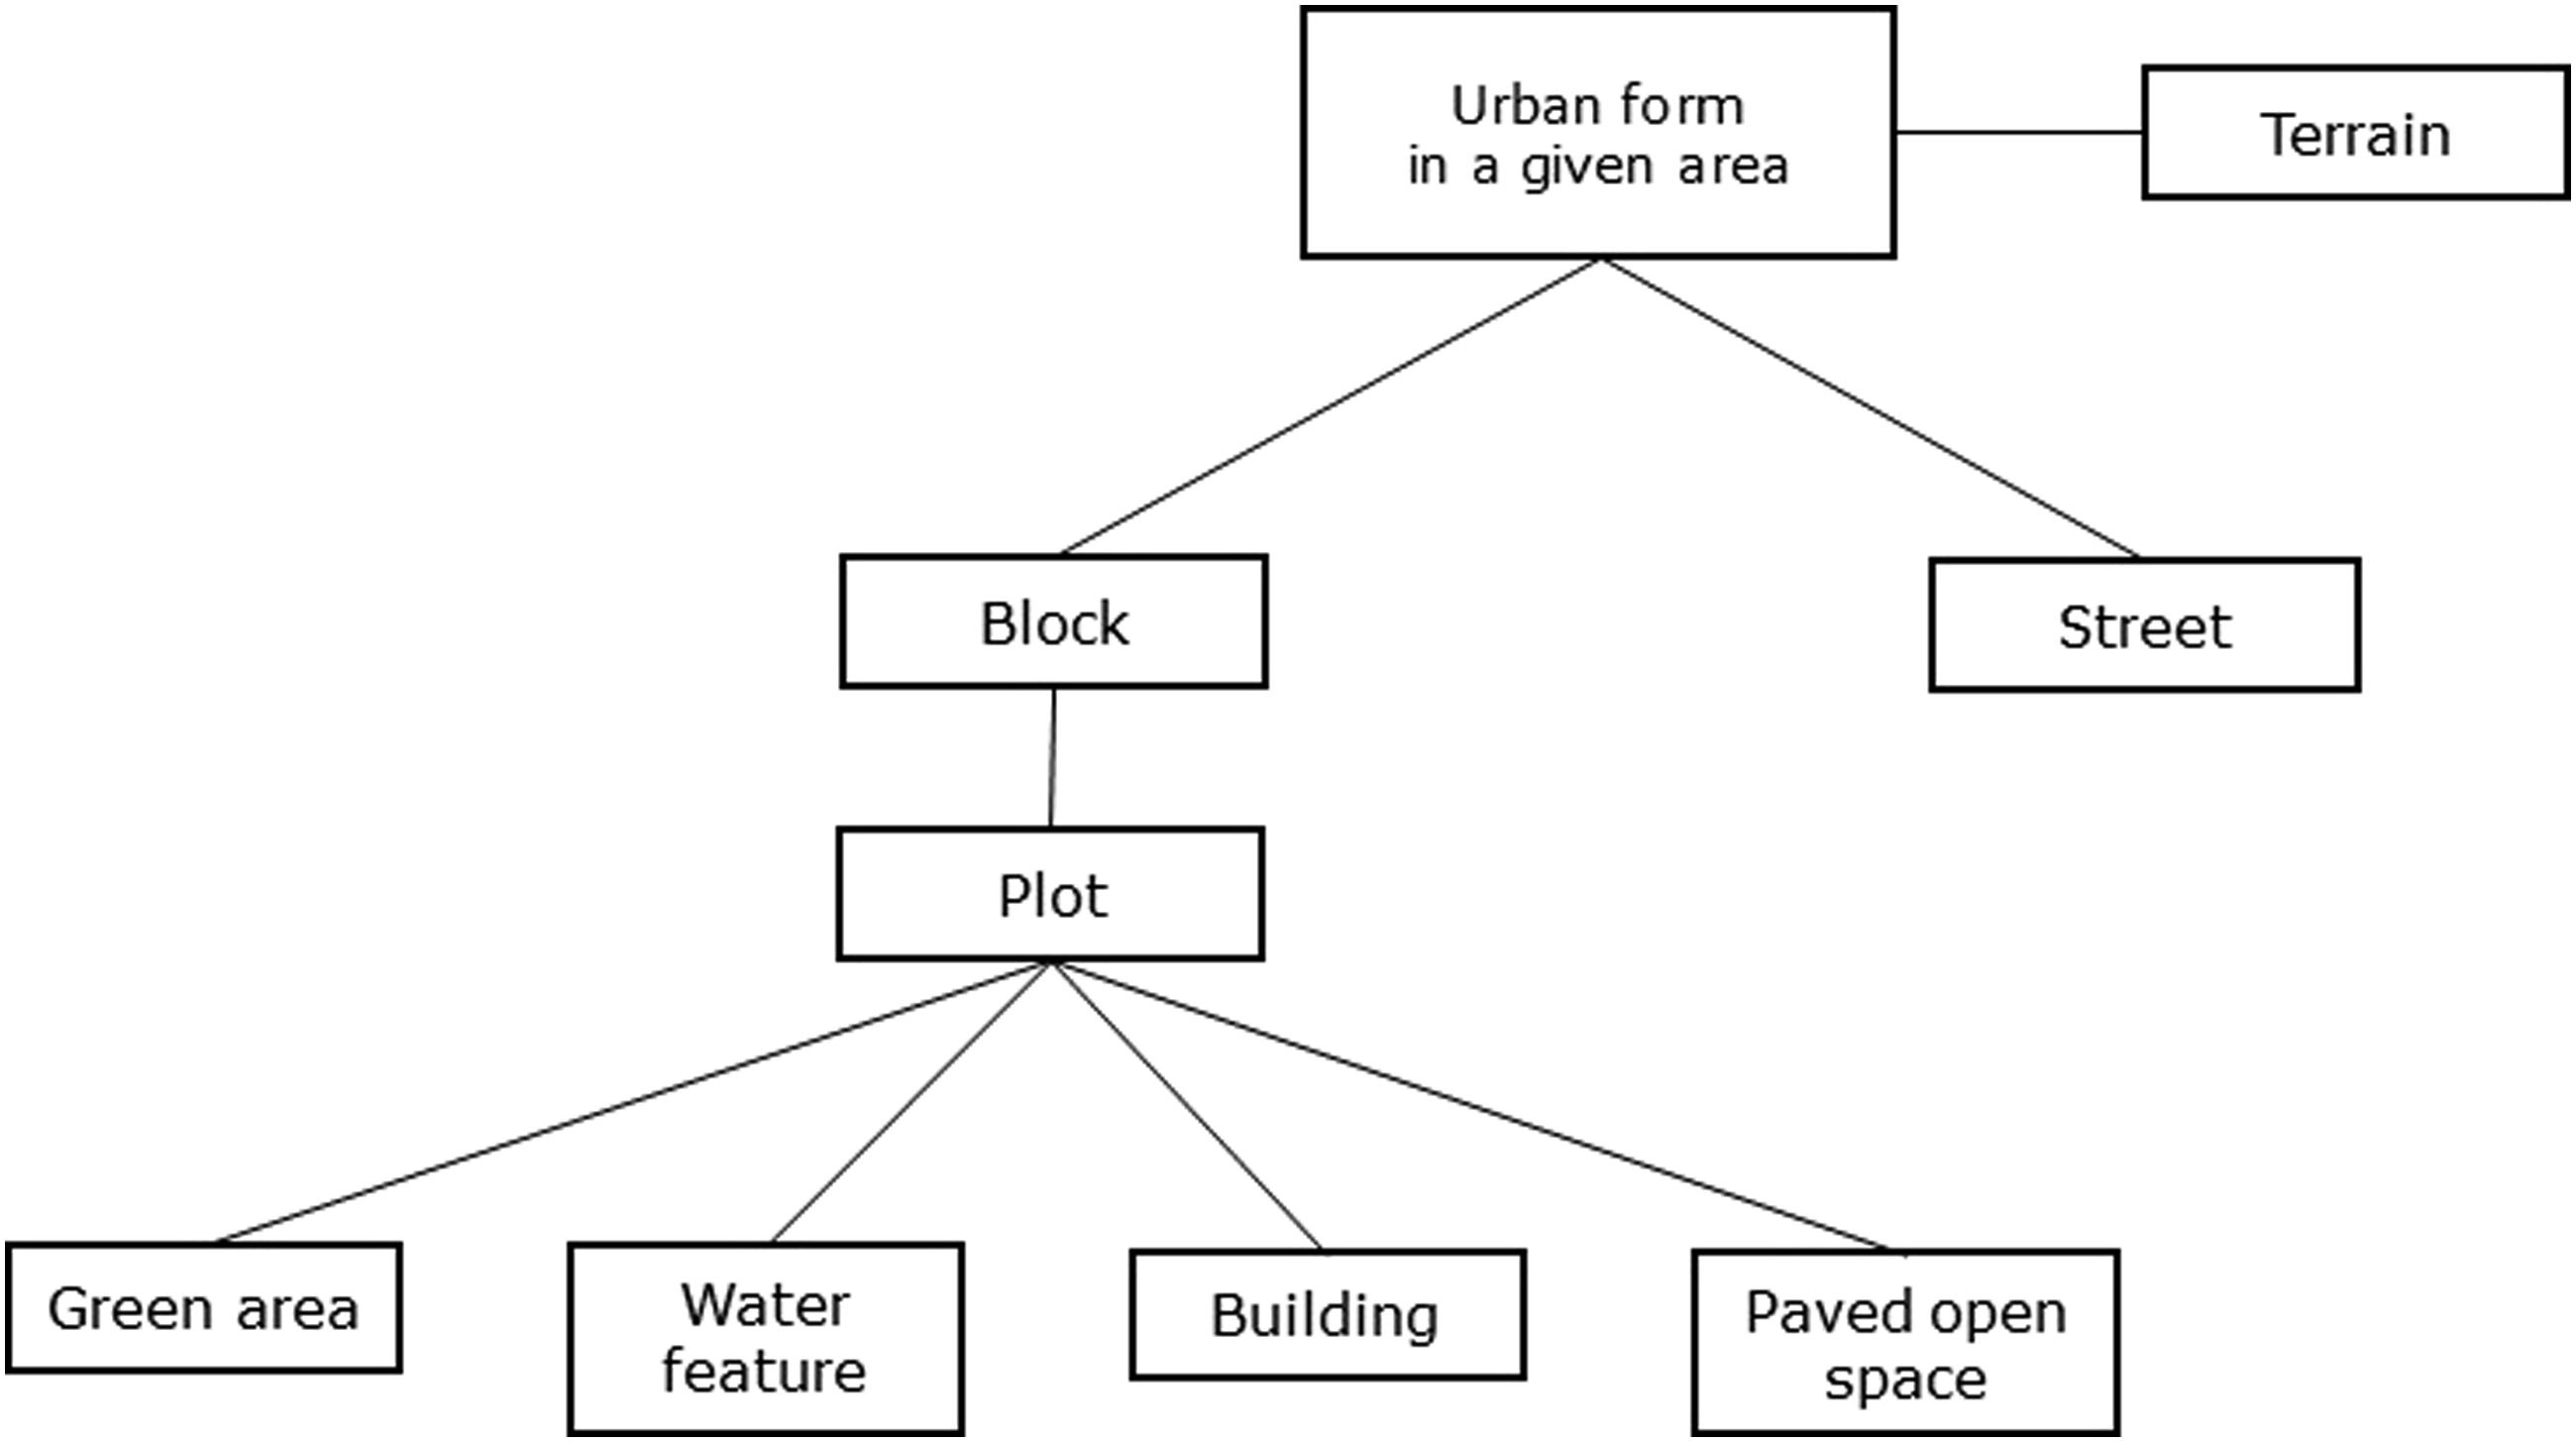

Gaussian mixture model clustering algorithm
Here, the GMM algorithm was used to cluster urban forms. GMM assumes that the sample set is a mixture of k Gaussian distributed observations (Figure S2 in the Supplementary Material). Each Gaussian distribution is called a “component,” which has its mean vector, covariance matrix, and mixing coefficient. The expectation-maximization (EM) algorithm was applied to estimate these parameters for the components from the sample set through iterations (Rasmussen, 1999). The Bayesian information criterion (BIC), a penalized log-likelihood measure, was used to measure the clustering performance (See Appendix A for details on the EM algorithm).
GMM models with varying k values from 2 to 30 were applied to the study area, and their BIC values were compared to decide k . For each k value, GMM was repeated 50 times with random starts because the EM steps may get stuck in sub-optima with specific random initializations (Kinnunen et al., 2011; Kwedlo, 2015). The best model was then chosen based on the BIC value for each k for further comparison. Each model run was capped at 1000 iterations. This study used sklearn.mixture, a function in the sklearn library in Python (Pedregosa et al., 2011), to implement the GMM algorithm.
An initial examination of attribute values in the grid cells suggested a highly skewed distribution pattern of the water body area ratio due to the sharp contrast between river-covered areas and other development areas in Seoul; the latter having 80% of the grid cells. Such a distribution seems to have a high chance of violating the Gaussian distribution assumption of GMM, thus becoming a big concern over GMM’s direct application to the data. To avoid this possible clustering issue, the study area was divided into groups of 1364 and 337 cells, with the former having a water body area ratio of less than 0.02 and the latter as the remaining. The GMM algorithm was then applied separately to the two groups.
Interpretation of clusters as urban form typologies
This study further named the clusters from the GMM analysis as urban form typologies. A representative urban form sample was then identified for each typology. These provided interpretations of the results from the data-driven approach for better understanding from the perspectives of urban design and policymaking.
A semantic typology naming system was developed in this study. In this system, mean values (namely, mean samples) of the clusters are used to translate the numerical attributes into semantic descriptions with morphological meaning using the data discretization method (Witten et al., 2017). The system contains three incremental steps: in the first step, the mean samples of clusters identified from cells and with water body ratio of more than 0.02 had “river-side” in their names. Next, four quantiles of each of important urban form features, namely, the building coverage, average building height, average building age, green area ratio, and elevation difference were generated to categorize and name the mean samples. Only the fourth quantiles of the latter three features were used for naming because they provided necessary and novel information. Last, an additional feature (average plot size) was used in naming to further distinguish clusters. Succinct typology names with at most three feature descriptors were generated following the abovementioned system (Table S1 and Table S2 in the Supplementary Material).
Representative forms were identified as those with the smallest distance to the mean samples, following that within the parameter space, the closer the samples, the more similar they are. The Mahalanobis distance (MD) based on the Gaussian assumption instead of the simple Euclidean distance as in k-means was adopted as the distance measure. Specifically, the MD is the distance between sample data x and a specific distribution, which is calculated based on the mean and covariance matrix of the distribution (Eq. B.1, Figure S3 in the Supplementary Material). Identified representative forms are supposed to describe the typologies' general characteristics.
Resulting typologies were spatially joined to the grid in ArcGIS, and their adjacencies were calculated based on Rook’s contiguity, considering only edge sharing to define cell neighbors (Figure S4 in the Supplementary Material).
Verification and validation of identified typologies
Visual inspections were used to verify the identified typologies and their representative forms. Additional form samples were examined to find whether important features were learned in the clustering and how diverse urban forms are within each typology. The choice of those form samples was based on the MD value ranking (Suzuki et al., 2008), representing the similarity level with the representative form. Ten form samples were verified in each typology, including the top and bottom five in the MD value ranking.
The typologies herein were also compared with those of Kim (2003) and SDI (2009) based on a manual approach. Typologies from both studies were overlapped in ArcGIS and then analyzed. Identified typologies were then further compared to zoning classes in Seoul following the same method to examine their similarities and differences.
Results
Clustering results
Numbers of cells, percentages in all cells, and mean values of urban form attributes in 14 clusters.
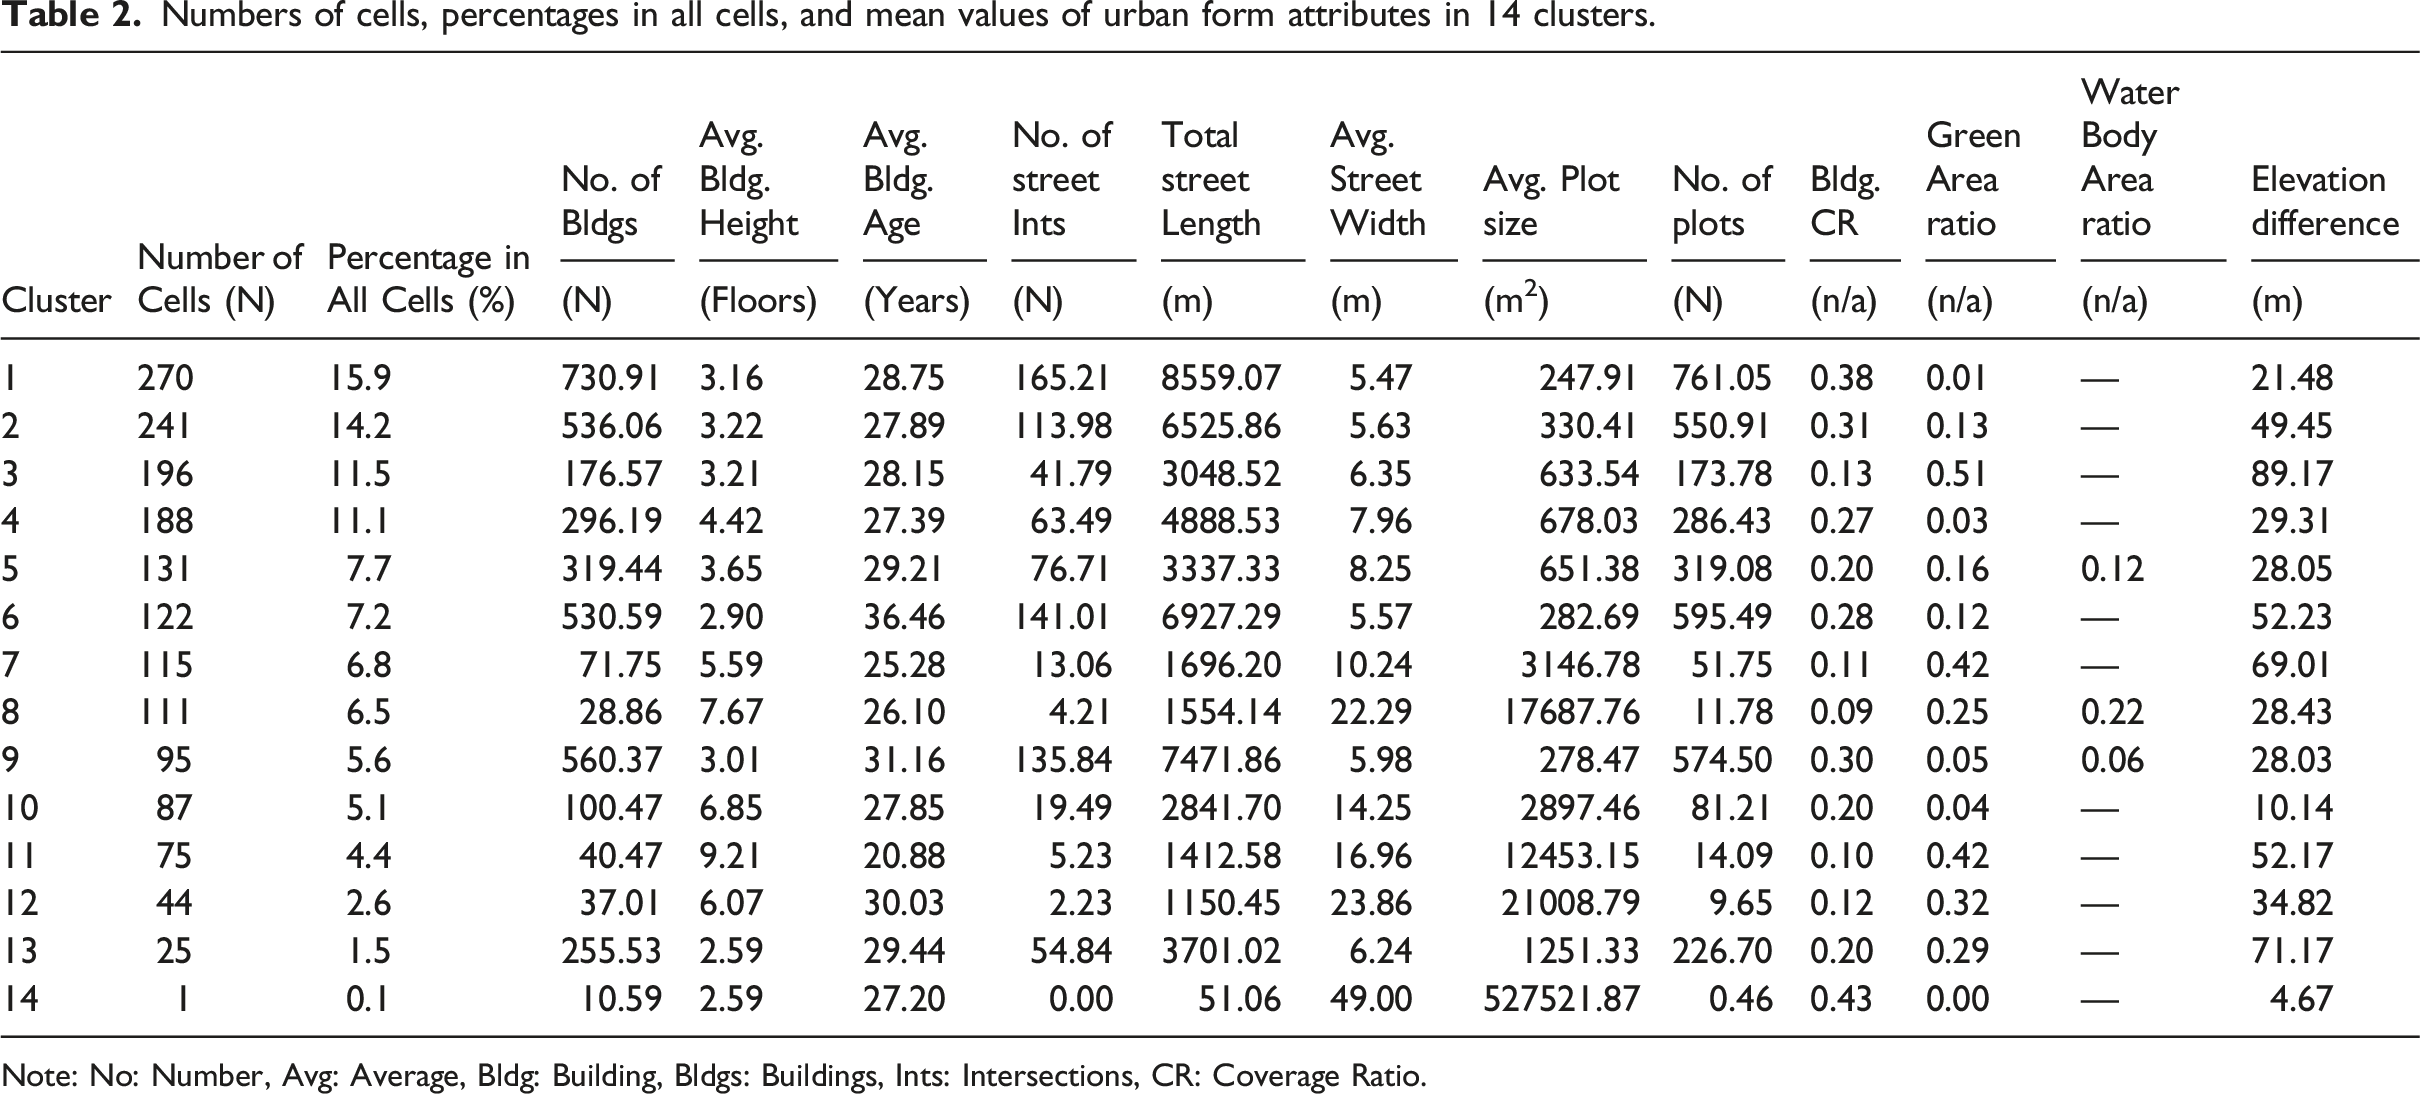
Note: No: Number, Avg: Average, Bldg: Building, Bldgs: Buildings, Ints: Intersections, CR: Coverage Ratio.
Urban form typologies and representative forms
The 14 clusters were given semantic names as 14 form typologies following the semantic typology naming system, with a representative form identified for each typology (see Figure 3(a)). Typology 1, named the small-plot compact mid-rise typology, is characterized by a high building density, the smallest plot size, and mid-rise buildings. Typology 2, the compact mid-rise typology, has the same patterns as Typology 1, except it has slightly larger average plot sizes. Typologies 3, 11, and 12 similarly have large green areas, but due to the differences in other patterns, they are named mountain-sited low-coverage mid-rise, green open high-rise, and old open mid-to-high-rise types, respectively. a) Representative samples of 14 urban form typologies; b) mapping of urban form typologies in Seoul.
Typology 4, or the high-coverage mid-to-high-rise typology, is typified with a high building coverage ratio and a mixture of mid-rise and high-rise buildings. Typologies 5, 8, and 9 reveal common river-side development patterns in Seoul, although Typologies 5 and 9 have mid-rise buildings, while Typology 8 has high-rise buildings. Typology 6 is characterized by old neighborhoods with low-rise buildings. Typologies 7 and 10 share similar mixed patterns with mid-rise and high-rise buildings where high-rise buildings are predominant, but they differ in other urban form attributes. Typology 13, the mountain-sited low-coverage low-rise typology, has a large elevation difference, a large green area ratio, and diverse plot sizes. Unlike other urban forms, Typology 14 has only one sample area that contains a massive wholesale market, an important heritage site in Seoul. Therefore, it stands out as one typology because of its historical and morphological uniqueness.
Spatial distribution of urban form typologies
Urban form typologies and their representative form samples are mapped in Seoul (see Figure 3(b)). Visual and analytical results suggest three major spatial distribution patterns: first, more than half of the urban form typologies have an adjacent ratio of less than 0.25, indicating that various urban forms are mixed and small-scale developments have occurred (Figure S7 in the Supplementary Material). Second, specific typologies often appear next to each other, especially among the small-plot compact mid-rise, compact mid-rise, old high-coverage low-rise, river-side open high-rise, and old river-side compact mid-rise. Third, some typologies are often located next to topography features, for example, the low-coverage mid-rise types are mostly found close to large green, mountainous and river-side areas. These three observations align with Seoul’s corresponding urban development patterns: historical development, rapid and large-scale urbanization, and interactions between urban development and natural environments.
Verification and comparison
Verification of urban form typologies
The top five form samples (with lowest MD values) and bottom five (with highest values) were selected for each typology (Table S3 in the Supplementary Material). Generally, the similarity with the representative sample is discernible for the other top four but less so for the bottom five. This suggests that characteristics of peripheral samples are more likely to exhibit a mixture pattern between their belonging and neighboring clusters. Extreme cases are found in the mountain-sited low-coverage low-rise typology, where the bottom five samples differ considerably from the representative sample. Regardless of the sample difference, there is a generally clear separation between the typologies based on their building footprint sizes, plot sizes, and street patterns, indicating that this study’s data-driven approach can identify important and distinctive typologies.
Comparisons with expert knowledge-based studies
The results from clustering were compared with the two previous form typology studies in Seoul to understand their performance differences (Table S4 and Table S5 in the Supplementary Material). The study area of this study covers 70.2% of Seoul, while previous studies by Kim (2003) and SDI (2009) cover only a small proportion of Seoul: 0.3% and 6.9%, respectively. The overlap results show that the present study is more consistent with the study made by Kim (2003) than the study of SDI (2009), suggesting the good performance of this research since the study of the former was considered more systematic (Figure S8 in the Supplementary Material). A further scrutinization indicates that the identified typologies following the new framework in this study better reflect the actual urban form pattern and surrounding urban context than the study by Kim (2003) (Figure S9 in the Supplementary Material). Moreover, the typology names given in this study are more intuitive and systematic than two studies.
Comparison with zoning classes
Urban form in Seoul is regulated by zoning, which involves rules on land-use, development density, and building and street geometry. However, modern zoning has been criticized for its oversimplicity and lacking of grand vision in shaping good urban form (Talen, 2012). A comparison between zoning classes and actual urban forms can help better understand the impact of zoning on urban form development, which remains to be further explored in the field due to the difficulty in measuring and understanding complex urban forms. This study compared zoning classes and identified form typologies, and found a large discrepancy between the two (Figure S10 in the Supplementary Material). For example, the seven residential classes in zoning have clearly defined height differences, which were not generally reflected in form typologies that seem to be residential. This mismatch between zoning classes and form typologies suggests that the typology reveals the urban form structure from a different perspective and can be used as a complementary method in urban planning and management.
Discussion
The new urban form clustering framework developed in this study is a general framework to apply to different cities. However, most steps require consideration of local characteristics. The definition of BSU is based on the local neighborhood size. The selection of form features should be adapted to urban form structures and data availability. The detailed implementation of the clustering algorithm depends on the data distribution. The validation also heavily relies on previous studies in the same area.
Moreover, a general issue exists in aggregating spatial data in urban form clustering studies, often known as the modifiable area unit problem (MAUP) (Jelinski and Wu, 1996). Two experiments were performed to understand the effect of the grid size on the clustering result and decide the best grid size. In the first experiment, a grid sensitivity analysis was conducted by varying the grid size from 200 to 800 m, where significant differences in the number of clusters were observed (Table S6, Figure S11, Figure S12 in the Supplementary Material), thus indicating a significant MAUP. The second experiment used the method of basic optimal zoning to reduce the MAUP (Jelinski and Wu, 1996). The optimal grid with the size of 500 m was identified within the range from 500 to 800 m that is considered a neighborhood scale, by minimizing intra-cell variation measured as the mean standard deviation of five important form features (Table S7 in the Supplementary Material). This result confirms the choice of the grid size herein.
Conclusion
Classifying complex urban environments into urban form typologies has been explored in two expert knowledge-based studies to support urban development and policymaking in Seoul. Paralleling other expert knowledge-based form typology studies, both studies suffered from subjective judgment and manual analysis, which prevented them from being feasibly applied on a larger scale. Another school of urban form typology studies used a data-driven approach, usually with the clustering method, to achieve better objectivity, scalability, and generalizability. However, many studies in this school focused on the direct application of clustering to urban form patterns without a systematic framework to connect domain knowledge and data analytics for implementation.
This study addresses these gaps in the research by developing a new urban form clustering framework and applying it to identify urban form typologies in Seoul. The framework defines a systematic workflow consisting of five steps: the definition of BSU, selection of form attributes, implementation of the clustering algorithm, interpretation of resulted clusters, and verification of identified typologies. For Seoul, a 500 m × 500 m grid was used as the BSU. Twelve features were selected based on the spatial structure of the urban form. They were used as learning features in GMM, a clustering algorithm widely used for complex datasets such as the urban form dataset, to identify clusters based on their similarities. Semantic names were then given to the clusters to translate into 14 form typologies following a newly developed semantic typology naming system. A representative form was identified for each typology based on the measure of MD. These 14 typologies are considered to best represent the complex urban forms in Seoul. Their spatial relationships were also analyzed to understand how Seoul’s complex urban forms and spatial structures developed over time.
Identified typologies were further verified and validated through the examinations of form samples with different MD values, comparisons with the previous expert knowledge-based form typology studies in Seoul, and comparisons with zoning classes. Results suggest a general consistency and high capacity in representing complex urban forms of the identified typologies, suggesting their important complementary role in urban planning and design in addition to zoning.
Urban form typologies were formed through complex processes in their unique socio-economic, cultural, and regulatory contexts and, therefore, can be seen as a representation of different complex system types. The introduction of urban form typology into urban development and management helps develop policies more targeted at local contexts and better reflecting urban complexity. In addition, the urban form typology also provides simple but effective representations of such complex urban systems, with the prototyped examples as references in urban planning and design practices. Compared to the traditional expert knowledge-based and other data-driven typology studies, the new urban form clustering framework developed in this study allows for a more systematic, reasonable, and interpretable urban form typology identification at a larger scale. This allows it to act as an important and effective policy support tool for urban planning and management.
There are still limitations in this study, including the BSU definition and GMM assumptions. These issues may be examined in future research.
Supplemental Material
Supplemental Material - Identifying urban form typologies in Seoul using a new Gaussian mixture model-based clustering framework
Supplemental Material for Identifying urban form typologies in Seoul using a new Gaussian mixture model-based clustering framework by Na Li, Steven Jige Quan in Environment and Planning B: Urban Analytics and City Science
Footnotes
Acknowledgements
We would like to express our gratitude to Haylin Kim for her help in proofreading.
Declaration of conflicting interests
The author(s) declared no potential conflicts of interest with respect to the research, authorship, and/or publication of this article.
Funding
The author(s) disclosed receipt of the following financial support for the research, authorship, and/or publication of this article: This work was supported by the Creative-Pioneering Researchers Program through Seoul National University (SNU) the National Research Foundation of Korea (NRF) grant funded by the Korea government (Ministry of Science and ICT) (No. 2018R1C1B5043758; No. 2022R1C1C1004953), the Seoul National University AI Institute through the Data Science Research Project 2018, and the National Research Foundation of Korea (NRF) grant funded by the Korea government (Ministry of Education) (No. 5120200113713).
Supplemental Material
Supplemental material for this article is available online.
Author Biographies
References
Supplementary Material
Please find the following supplemental material available below.
For Open Access articles published under a Creative Commons License, all supplemental material carries the same license as the article it is associated with.
For non-Open Access articles published, all supplemental material carries a non-exclusive license, and permission requests for re-use of supplemental material or any part of supplemental material shall be sent directly to the copyright owner as specified in the copyright notice associated with the article.