




Abstract
The polycentric idea has recently been reinvigorated in many rapidly urbanising countries, but the paucity of reliable and disaggregated data has so far made it almost impossible to understand the policy feedback there. This paper capitalises on official statistical data, novel online data, and proprietary digital data, and builds a dynamic spatial equilibrium model for understanding the past lessons and future options for developing new urban sub-centres. Following the post-2010 situation of a negative sign of monocentric bid-rent curve and physical polycentric growth, we assemble, corroborate, and validate multi-source data sets within the model to explore possible polycentric development scenarios (2010–2035). The data analysis and model tests show that over time, the balance between jobs and housing provision appears to have been lost, and it is insufficient job opportunities in the planned sub-centres rather than any lack of housing development that has led to the loss of this balance. Localised circumstances have also played a role in this overarching pattern of evolution. The insights are cogent for current decision making regarding polycentric planning and growth, especially in developing countries.
Introduction
The field of urban morphology has been extending its cultural, historical, and geographical investigations and incorporating economic forces (Moudon, 1997). The physicality of the built environment in turn shapes transactions and flows (Alexander, 1965; Jiang and Ren, 2018). In particular, the polycentric urban form, co-driven by market forces and government interventions, has long been considered a recipe for relieving overcrowding in historic cores, spreading prosperity to peri-urban areas, and decreasing excessive commuting in-between for transport-related environmental benefits.
This polycentric idea has recently been reinvigorated in many rapidly urbanising countries, especially China. Over 110 new municipal level centres (which are known as municipal ‘sub-centres’) have been promoted in those Chinese cities with a population of over five million. 1 However, there has been little official data, let alone assessment of the extent to which the polycentric policies are shaping the cities. The paucity of reliable data sources and disaggregated information in developing countries has so far made it almost impossible to make investigative progress, but emerging new data sources are making the analysis more viable. For instance, land sales and traffic speed data in China are increasingly made public for large cities as part of the open government initiative or to improve urban living.
Against this backdrop, this paper presents a novel method for developing countries without reliable structured data to measure the realities and aspirations of sub-centre development with planned intervention. We first tap upon retrospective data to understand supply and prices in the property market (as ‘realities’), and then design different normative sub-centre development scenarios (within the framework of the local comprehensive plan) for comparing the potential urban futures (as ‘aspirations’). Specifically, a comprehensive range of urban data sets (i.e. official statistical data, novel online data, and proprietary digital data) is used to build and empirically validate a theoretical dynamic spatial equilibrium (SE) model (2000 and 2010), which is adopted to make future trend predictions (2010–2035). The method developed in this paper can also support regular monitoring of progress going forward.
This paper contributes to both the polycentric literature and practical urban sub-centre development. First, a new perspective of integrated policy dimensions has been introduced to understand polycentricity, which simultaneously takes account of population distribution, rental market change, and commuting patterns. Next, the quantitative results highlight the importance of interpreting the empirical data sets within a theoretical framework. Many data sources on their own cannot be directly used for investigating urban form. But it is possible to cross-validate and carry out data infills, and thus make effective use of all the sources in studying land use, built form, and travel. Finally, the proposed method is applicable to a large number of developing country cities in Asia, Latin America, and Africa where there is reasonable access to online data sources (see, e.g. Wesolowski et al., 2013). Situation-cogent messages about the current stage of property market development should be disseminated in a timely manner to decision-makers and local planners.
The rest of this paper is organised as follows. The next section introduces the literature on property markets and polycentric development. We then describe how the multi-source data are processed and combined into the theoretical land use–transport interaction model. The recent history of polycentric development in Shanghai has been summarised with observed data sets, followed by a comparative scenario measurement of planned sub-centres within a dynamic SE model. The research concludes with empirical findings and proposed planning implications.
Property market theories regarding polycentric developments
For a traditional monocentric metropolis, the Alonso–Muth–Mills model describes the effects of distance from a central business district on land value as a bid-rent curve (Alonso, 1964; Mills, 1967; Muth, 1969). By introducing spatial aspects into general equilibrium, the land rent gradient is determined by the costs of transportation. This theoretical framework shows a good empirical fit for American cities before the 1960s (Clark, 2000).
However, as modern cities become more polycentric (Anas et al., 1998; Bertaud, 2004), the bid-rent theory has been extended to cover such cases. The traditional monocentric assumption in SE has been relaxed in two ways to account for the emerging patterns. One approach is to directly introduce more than one centre into the model (Papageorgiou and Casetti, 1971; Yinger, 1992), and the other is to replace pre-specified centres with endogenous polycentric structures (Fujita and Ogawa, 1982; Fujita et al., 1997). The latter approach allows for the emergence of new urban centres through a representation of the core market interactions in the process of urban growth.
Fujita and Thisse (2013), for instance, explain the emergence of secondary (price) centres as a result of growth in jobs – through, e.g. the investment of a large firm – in a location some distance away from the original core of a monocentric city. The equilibrium location choice of business and residents is the result of the interplay of two opposite forces, i.e. a dispersion force searching for lower wages and land rent, and an agglomeration force to achieve better productivity close to the centre.
The addition of sub-centres to monocentric bid-rent theories greatly enhances the explanatory power of empirical evidence of land development and market mechanisms since the late 20th century. Waddell et al. (1993) identified the relative location of residential plots to different city centres as a critical factor in creating reliable rent gradients. Wilson and Frew (2007) and Maciel and Biderman (2013) further proved that secondary peaks arising from the establishment of new centres have a statistically significant impact on surrounding land values. The cumulative effects of multiple sub-centres yield ridges on a typical negative curve; land rent decreases with distance from the original city centre, and then moderately climbs again when approaching the new sub-centres.
Anas et al. (1998) and Fujita and Thisse (2013) among others have made the case that the fundamental drivers for land rent under polycentric development remain a supply–demand relationship in production, residential, and land markets. Although it is possible for land rents to rise spectacularly in some newly planned centres due to future expectations or property speculation, it would be rare to find small increases in land rent in and around successful secondary centres. In other words, apart from the original core at the city centre, the extent to which these secondary crests grow will reflect market responses to the plans for the new sub-centres.
It is worth noting that the on-going academic debates on polycentric evolution have wide theoretical coverage, diverse definitions, and different levels of spatial foci (Van Meeteren et al., 2016). First, the emergence of complexity theory has given rise to numerous microsimulation models where the interactions between individual agents (e.g. developers, households, workers, etc.) or physical land cells are simulated to depict the polycentric growth trends collectively (Broitman and Czamanski, 2015; Wu, 1998). The adoption of the disequilibrium framework without fundamental supply–demand underpinning, however, tends to make the long-term forecast unstable subject to stochastic variations. Second, the polycentric development can be defined and measured differently by the features of the centres, the relations between the centres, and sometimes the political importance of the centres (Burger and Meijers, 2011; Liu and Wang, 2016). Third, the polycentricity has been unravelled respectively at the intra-urban, inter-urban, inter-regional, and global levels (Davoudi, 2003). Although recent work has introduced multi-scale analysis (Brezzi and Veneri, 2015; Liu et al., 2017), the polycentric literature focusing on employment and population centres, especially with institutional considerations, often falls into the intra-urban scale (see, e.g. Adolphson, 2010; Pan et al., 2018; Yang et al., 2019).
This paper focuses on the intra-urban spatial dimension (i.e. a metropolis/city with multiple centres), rests upon urban economic theories with a market clearing assumption (subject to planning regulation), and it explores the morphological (i.e. the size and distribution of sub-centres following the local plan), functional (i.e. commuting flows and rental changes as market responses), and political (i.e. planned sub-centres) polycentricity simultaneously.
Data and methods
Study area
Our analysis focuses on rapidly urbanising Shanghai Municipality with a total area of 6340 square kilometres, where the proportion of built-up area increases from 22.7% in 2000 to 36.9% in 2015. 2 Persistent investments have been made through local comprehensive plans and Socio-Economic Five-Year Plans in creating new sub-centres across the city region of over 25 million people. From the planners’ perspectives, 3.9 million residents (15.4% of the total population) are expected to live in the five new urban sub-centres according to the latest Shanghai Comprehensive Plan 2017–2035 (‘the 2035 Plan’), while there are only 8.9% of people living there in 2010. The polycentric process is stimulated with constant state intervention in the form of land allocation (for public uses such as transportation and amenities) and developable land quota distribution (for private uses such as residential and commercial developments) to the planned sub-centres. Zones of political importance can, therefore, attract and accommodate larger population growths and employment inflows. How the competitive property market responds to the planned system (particularly in the supply side) and what the realities of the polycentric policies are will be explored in the following section.
Figure 1 defines the areas of the conventional city centre, near suburb, sub-centres, and far suburb. The zonal division follows the sub-district (jiedao) boundaries in Shanghai to be consistent with the planning regulations and policy analysis. The transport centroid node of each zone represents where people or economic activities agglomerate. For city centres where entire zones have been developed, we use their geometric centroids; for the other partly developed areas, we adopt the local government’s location.
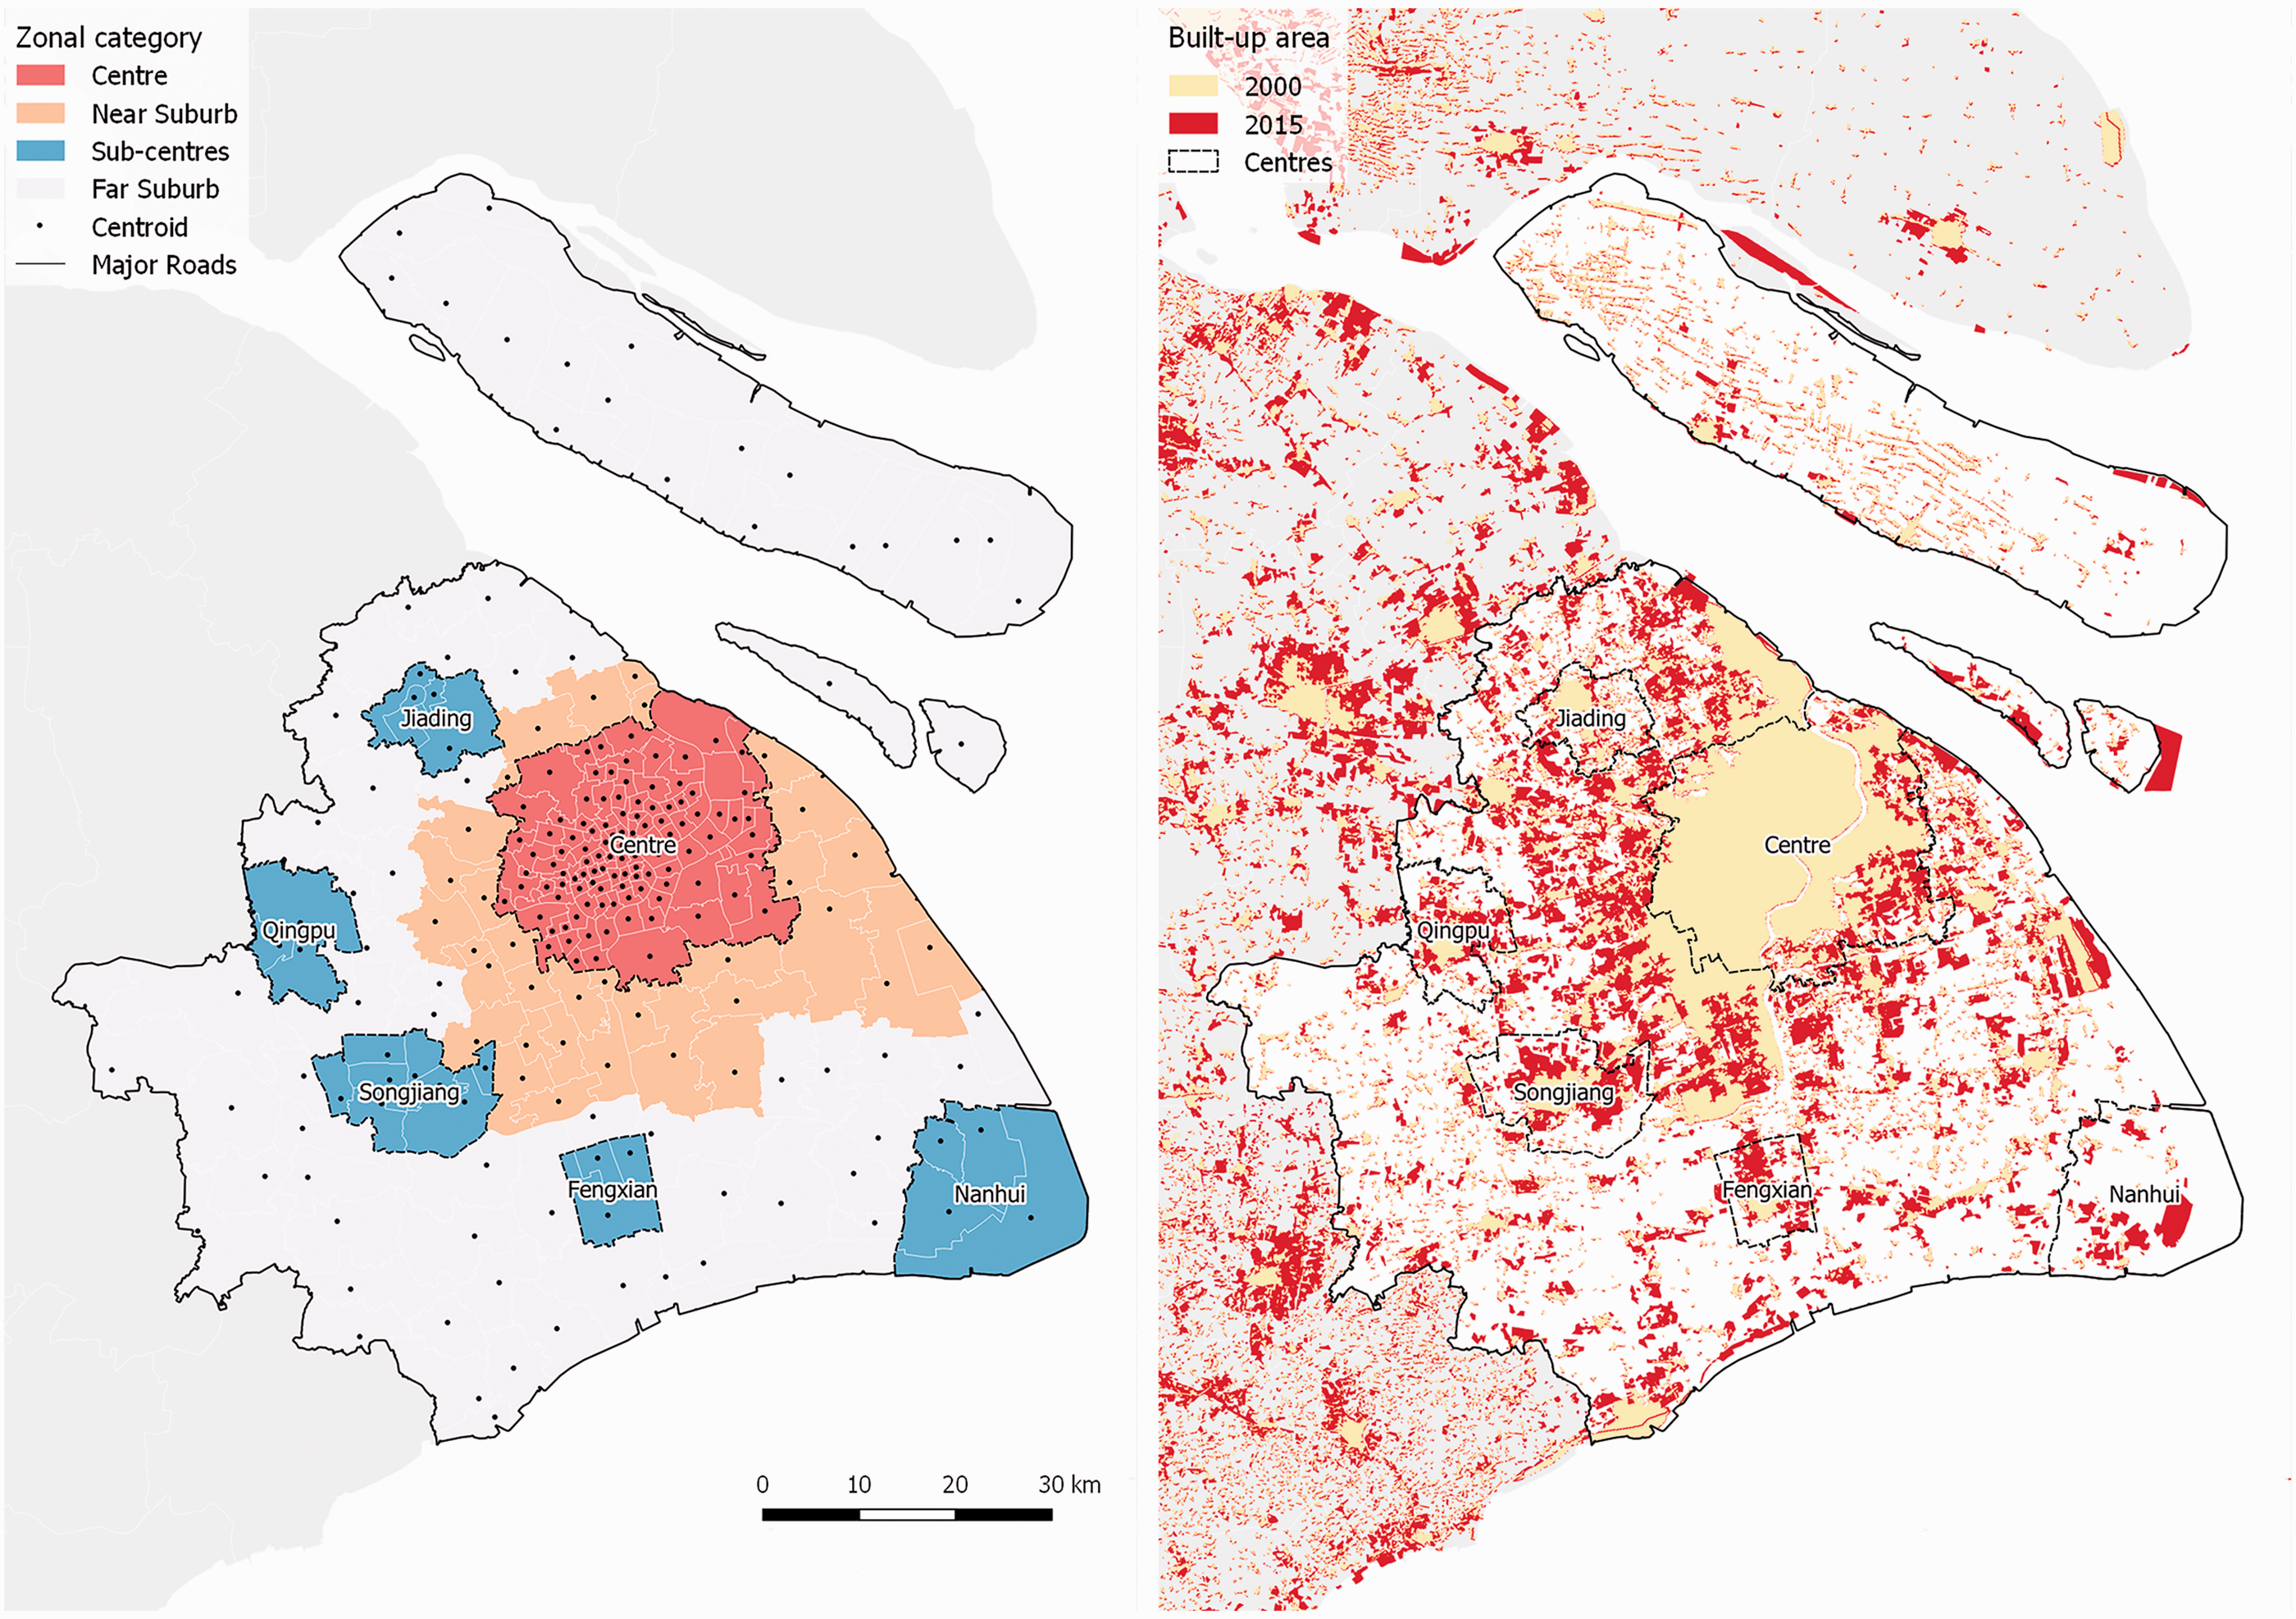
Zonal categories of Shanghai (left) and built-up area expansion (right).
Multi-source data fusion
This research assembles and integrates (1) official statistical data (e.g. population and economic census), (2) novel online data from government, research institutes, and leading companies (e.g. housing rents and commuting time matrix), and (3) proprietary digital data (i.e. mobile phone data). Linkages and comparisons are established to cross-check the reliability of the data sets and to aggregate or disaggregate the data sets into the corresponding modelled zones.
1. Official statistical data
As data discrepancies between different official statistical sources are non-negligible, a data adjustment has to be conducted. For instance, the employed data used in this paper are available from different official sources, such as the National Population Census, the National Economic Census, and the Shanghai Bureau of Statistics. Supplemental material 1 describes how we bridge these data mismatches.
2. Novel online data
To measure the evolution of urban form, particularly polycentricity, two main data sets have been acquired from online sources: (1) property market data (including land transaction records and housing rents) and (2) zone-to-zone travel time. The categorical land use transaction data are derived from a new online data source (China Land Market 3 ) originally published for land transaction administration purposes. A total of 2095 valid residential transaction records have been obtained for Shanghai between 2002 and 2017, containing information such as land use type, size, and price. The online housing rent records were obtained from Lianjia, 4 the largest real estate brokerage firm in China. After the exclusion of duplications, we obtained 802,198 transaction records from 2015 to 2017. Both data sets have been geocoded into zones, and the price levels have been set to the year 2010 by using official land and rent price indexes.
The travel time matrices were requested from two leading web mapping service companies for different travel modes in the local context. We acquired the commuting time and distance by car from the Google Maps Application Programming Interface (API) Directions Service, as this is the only source that can both consider the departure time (8 am on a normal Wednesday in this case) and the traffic conditions based on historical averages. The public transit time was achieved through the Baidu Maps API, a leading local company with more timely updates on the public transit routes.
3. Proprietary digital data
We utilised mobile phone data (MPD) as a reference to cross-check the commuting matrix generated by the model. The commuting patterns from the MPD records were extracted based on the accumulated time a user spends within the radius of a certain cellular network tower. The most frequently visited towers during the day (10:00–16:00) and night (20:00–06:00) were assigned to the locations of the workplace and home. Around 500 million records from over 15 million phones were generated within two weeks in March 2014. We then aggregated the data records at the zonal level and further generated the aggregated commuting flows.
Modelling and predictions
This research adopts a recursive spatial equilibrium (RSE) model proposed by Jin et al. (2013), which inherits the land use and transport model structure and rests on an economic foundation with the general equilibrium framework. On the one hand, urban development tends towards a general equilibrium state for overall utility maximisation across different urban markets, where the conventional spatial equilibrium (SE) model is able to simulate the interactions between labour, product, and land/property markets that are interconnected through a transport network (Arrow and Debreu, 1954; Burfisher, 2011). On the other hand, consumers and businesses are assumed to respond to changes in the markets through their decisions, subject to lumpy, non-equilibrium land use or infrastructure changes, which can be captured by the recursive dynamics (RD) model that takes the planning interventions into account. The two sub-models (i.e. SE and RD) compose the RSE framework. Details on the model equations are reported as supplemental material in previous work (Ma and Jin, 2018).
The key inputs of the model are the changes in the macro-environment (e.g. GDP growth rate), infrastructure (i.e. planned building/land stock and transport improvement), and employment (i.e. jobs amount and distribution). The key outputs include changes in the property market (e.g. building/land rents), demography (e.g. population distribution), and urban flows (e.g. commuting trips).
In this paper, we first separately calibrated two SE models (2000 and 2010) with observed data sets. As the end state of one time period in the model serves as the start of the subsequent one, a cross-year validation process (2000–2010) was conducted by using the 2000 SE model and the 2000–2010 RD model. Upon the reliability of the reproduced 2010 results, we used the 2010 SE model and the 2010–2035 RD model to forecast the planning results with various scenario inputs.
Model calibration and validation: The use of retrospective data 2000–2017
Supply and prices in the property market
The overall land and housing development differences among categorical zones were investigated from 2000. An interesting phenomenon with two extremes has been unfolding regarding the relationship between estate supply and property price.
Due to the limited available land resources in the city centre, the release and transaction of residential land outside central Shanghai has been exceptionally active (Figure 2(a) and (b)). The urban periphery has witnessed significant development along with the planned growth of several new sub-centres. The expansion trend dominated between 2002 and 2010, whereas sub-centre land development took over from 2011. A similar pattern can be observed in terms of the housing units’ annual growth rate.
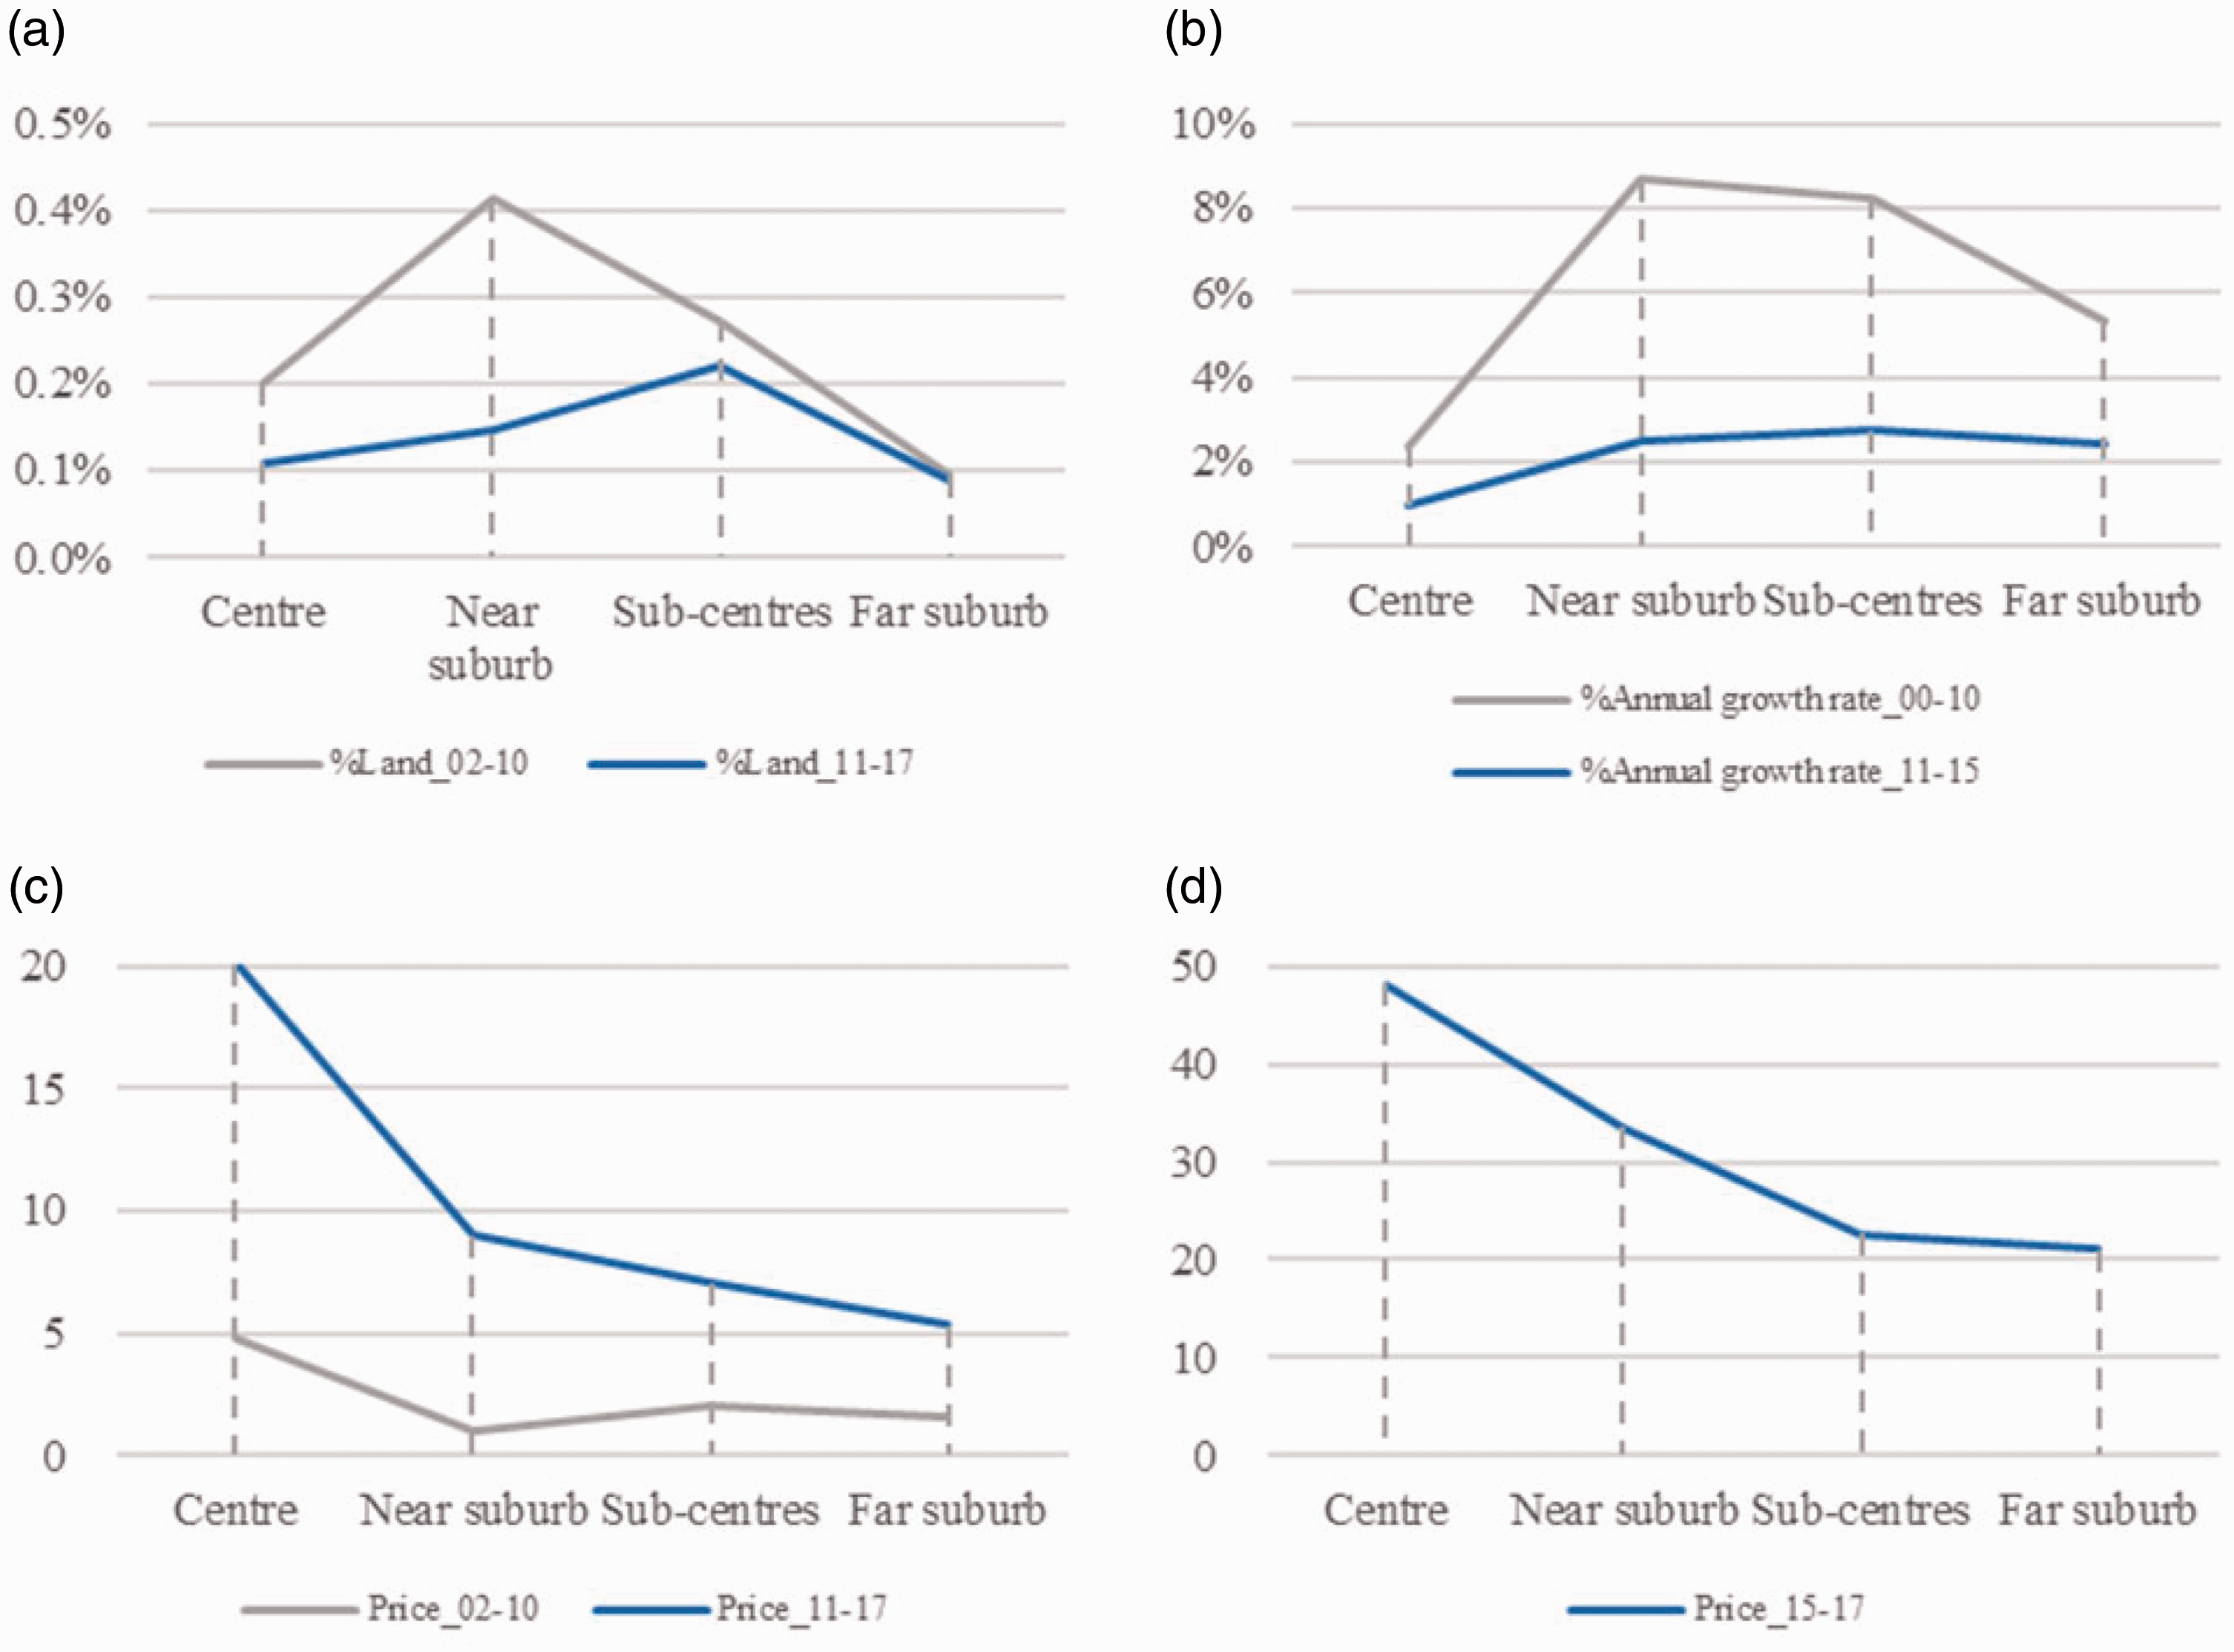
(a) Residential land transaction volume by administrative area (%/year), (b) changes in dwelling units (%), (c) residential land unit price (1000 ¥/m2 in 2010 prices), and (d) dwelling unit rents (1000 ¥/unit in 2010 prices).
However, property price displays a reverse pattern in Figure 2(c) and (d). A secondary residential land price bump can be identified in urban sub-centres before 2010, and the sub-peak faded away afterwards. With the continuous high supply of residential land, the bid-rent curve again reflects a conventional monocentric trajectory between 2011 and 2017. Housing rent data, though only available from 2015, also corroborate the monocentric argument where price correlates strongly with the physical distance to the city centre.
In general, sub-centres in Shanghai have been undergoing successive and massive ‘physical’ construction in recent decades. There was a good sign in Shanghai’s quest for polycentric development prior to 2010 judging from the economic sub-peak, but it diminished greatly and was finally taken over by the monocentric curve. Although we limit our discussion to residential development, a complementary picture of abundant supply and low demand for commercial land use rights has also been revealed in Shanghai sub-centres by Murakami and Chang (2018). It is not possible to explain the changes in the price pattern currently, but a well-structured and calibrated model can help to answer the questions: What might cause the changes in the local rental market? And how can polycentric growth be facilitated?
SE model calibration and cross-validation
The model parameters need to be calibrated to reflect the observed reality. In this paper, we mainly calibrate the categorical zonal housing rent (for 2010 only) by online data (Figure 2(d)) and home-to-work commuting flows by the MPD data set as described in supplemental material 2.
A cross-year validation process (2000–2010) was conducted following the method from Wan and Jin (2017). With the location of jobs and the number of housing units as the main inputs, the predicted residents’ location in 2010 has a good fit with the observed one, as the r-square reaches 0.94. The validated predictive capabilities serve as the foundation for the 2010–2035 run in the next section.
Model applications that explore alternative futures
Dispersion, mono- and polycentric scenarios
Informed by the 2035 Plan, a series of scenarios on sub-centre development has been explored to quantify the possible property rent (housing rent in this case) appreciation, to simulate the location of employed residents, and to understand the change in commuting flows. All the scenarios share the same macroeconomic and population growth trends at the city-regional level, incorporating the key long-term goals reflected in the 2035 Plan. Specifically, all the scenarios have the same expected population of 24.8 million 5 (assuming the employment rate remains 50% as in 2010), the same regional housing floorspace stock of 11.2 million units, 6 and the same transport improvements whereby the average travel time to and from the sub-centre areas is decreased by 5 minutes.
Among the wide spectrum of spatial planning and infrastructure investment options in Table 1, Scenario 0 (Trend) depicts a continuing dispersion and suburbanisation trend with concentric growth, as observed over the past decades. To make the different scenarios more comparable, we impose zero growth in the city centre following the 2035 Plan in scenarios S0, S1, S2, and S3. This helps to better reveal the differences between dispersion (trend) and polycentric strategies, especially in terms of sub-centre growth. For the trend growth (S0), Scenarios 0a (job decentralisation) and 0b (job centralisation) serve as additional explorations to test the extreme possibilities of suburbanisation (with job losses in the centre) and monocentricity (where the centre and near suburbs monopolise job growth). As for the polycentricity, Scenario 1 (housing supply increase) represents a pure emphasis on real estate development in sub-centres, while Scenario 2 (job provision) is focused on the channelling of employment growth. Scenario 3 (coordinated jobs and housing growth) is most consistent with the local comprehensive plan where both employment and housing supply are added to the sub-centre areas. Supplemental material 3 summarises the model inputs by zonal category.
Policy scenarios (2010–2035) in the forecast model.
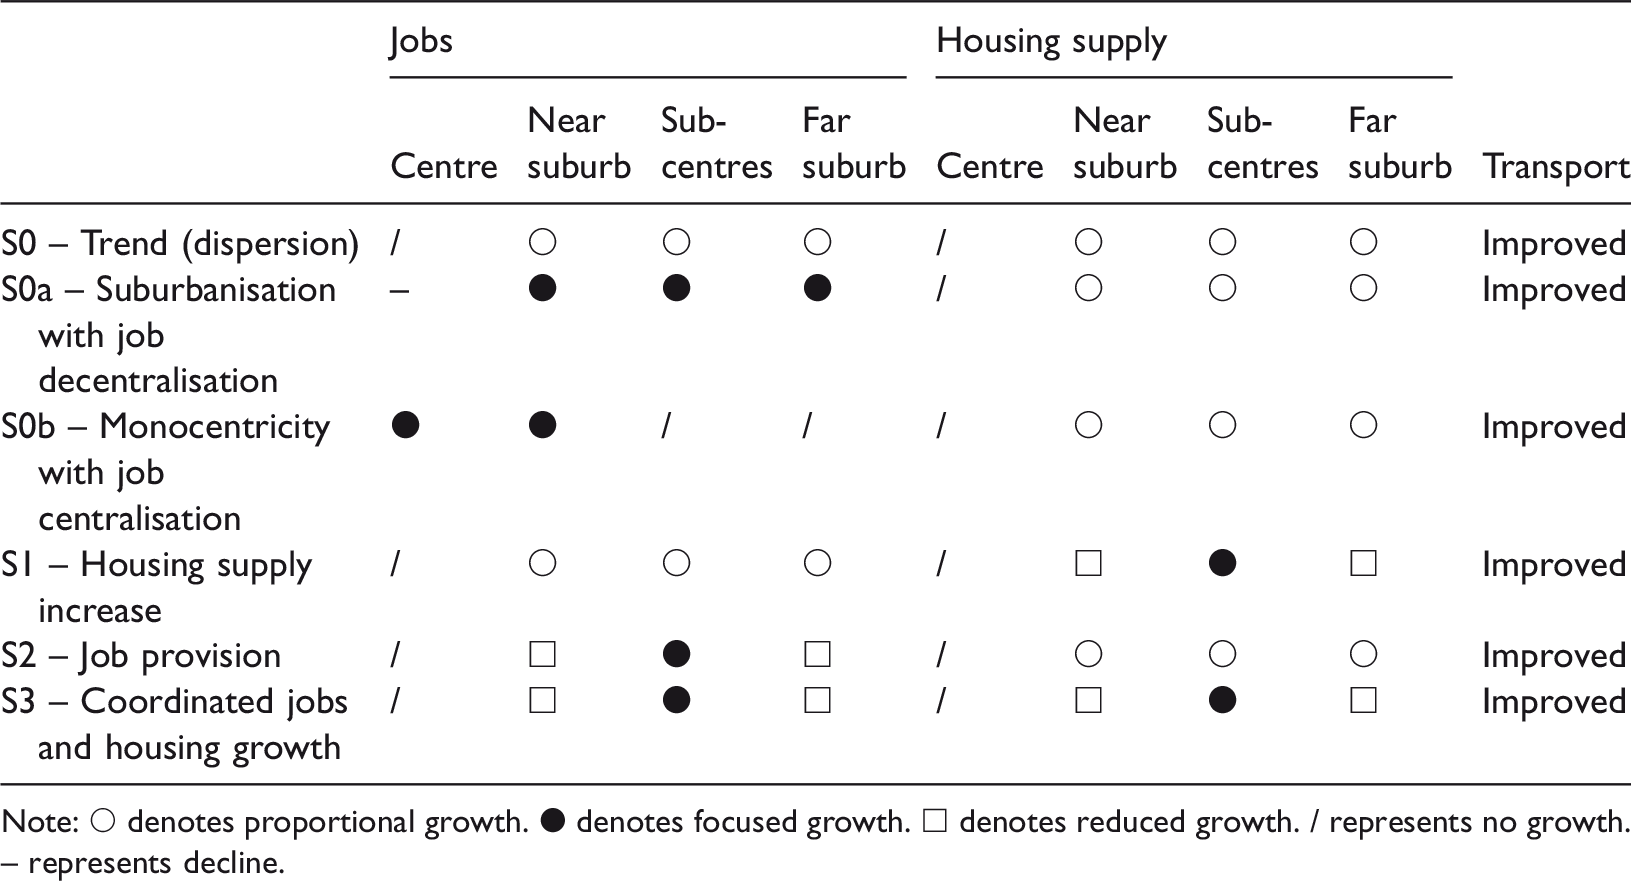
Note: ○ denotes proportional growth. ● denotes focused growth. □ denotes reduced growth. / represents no growth. – represents decline.
Geographical variations in planning outcomes
Either the addition of jobs or the increase in housing supply results in larger employed residents’ (and the population’s) inflows into the sub-centres, as S1, S2, and S3 all produce a higher sub-centre growth rate compared to the trend (see Figure 3).

Employed residents’ annual growth rate (left) and housing rent average annual growth rate (right) between 2010 and 2035.
However, the rental growth pattern varies greatly by zonal category. Due to the assumption that the proportion of spending on housing remains unchanged across scenarios, the overall housing rent annual growth rate remains the same. In the trend scenario (S0), the pro rata increase in housing units leads to higher rental growth in the near suburbs compared with the other areas. Based on S0, the continuous rise in jobs in the conventional centre (S0b – monocentricity) creates obviously higher rent patterns in the city centre and near suburbs, strengthening the monocentric curve. The development-oriented scenario (S1) reflects the housing over-supply in the sub-centres, where local rental prices experience stunted growth. By contrast, the rent growth in the sub-centres in S2 largely outweighs the others through polarised provision of jobs. A combined supply of jobs and housing generates intermediate annual rental growth due to a more balanced supply–demand relationship.
Figures 4 and 5 map the employed resident’s density and housing rent variations in detail. The distribution of employed residents (or population as a proxy) displays a polycentric pattern in the trend scenario (S0). The increase in housing stock scenario (S1) has a relatively smaller impact on residents’ relocation choices to sub-centres than the provision of the jobs scenario (S2). The incorporation of both aspects leads to a more polarised population clustering pattern. Although Shanghai’s sub-centres have been studied in terms of population attraction (Chen et al., 2018) and housing/jobs provision (Tian et al., 2017), respectively, the quantitative findings here build up the causal relationship in-between through the recursive general equilibrium framework.

Employed resident’s density and its variations between scenarios.
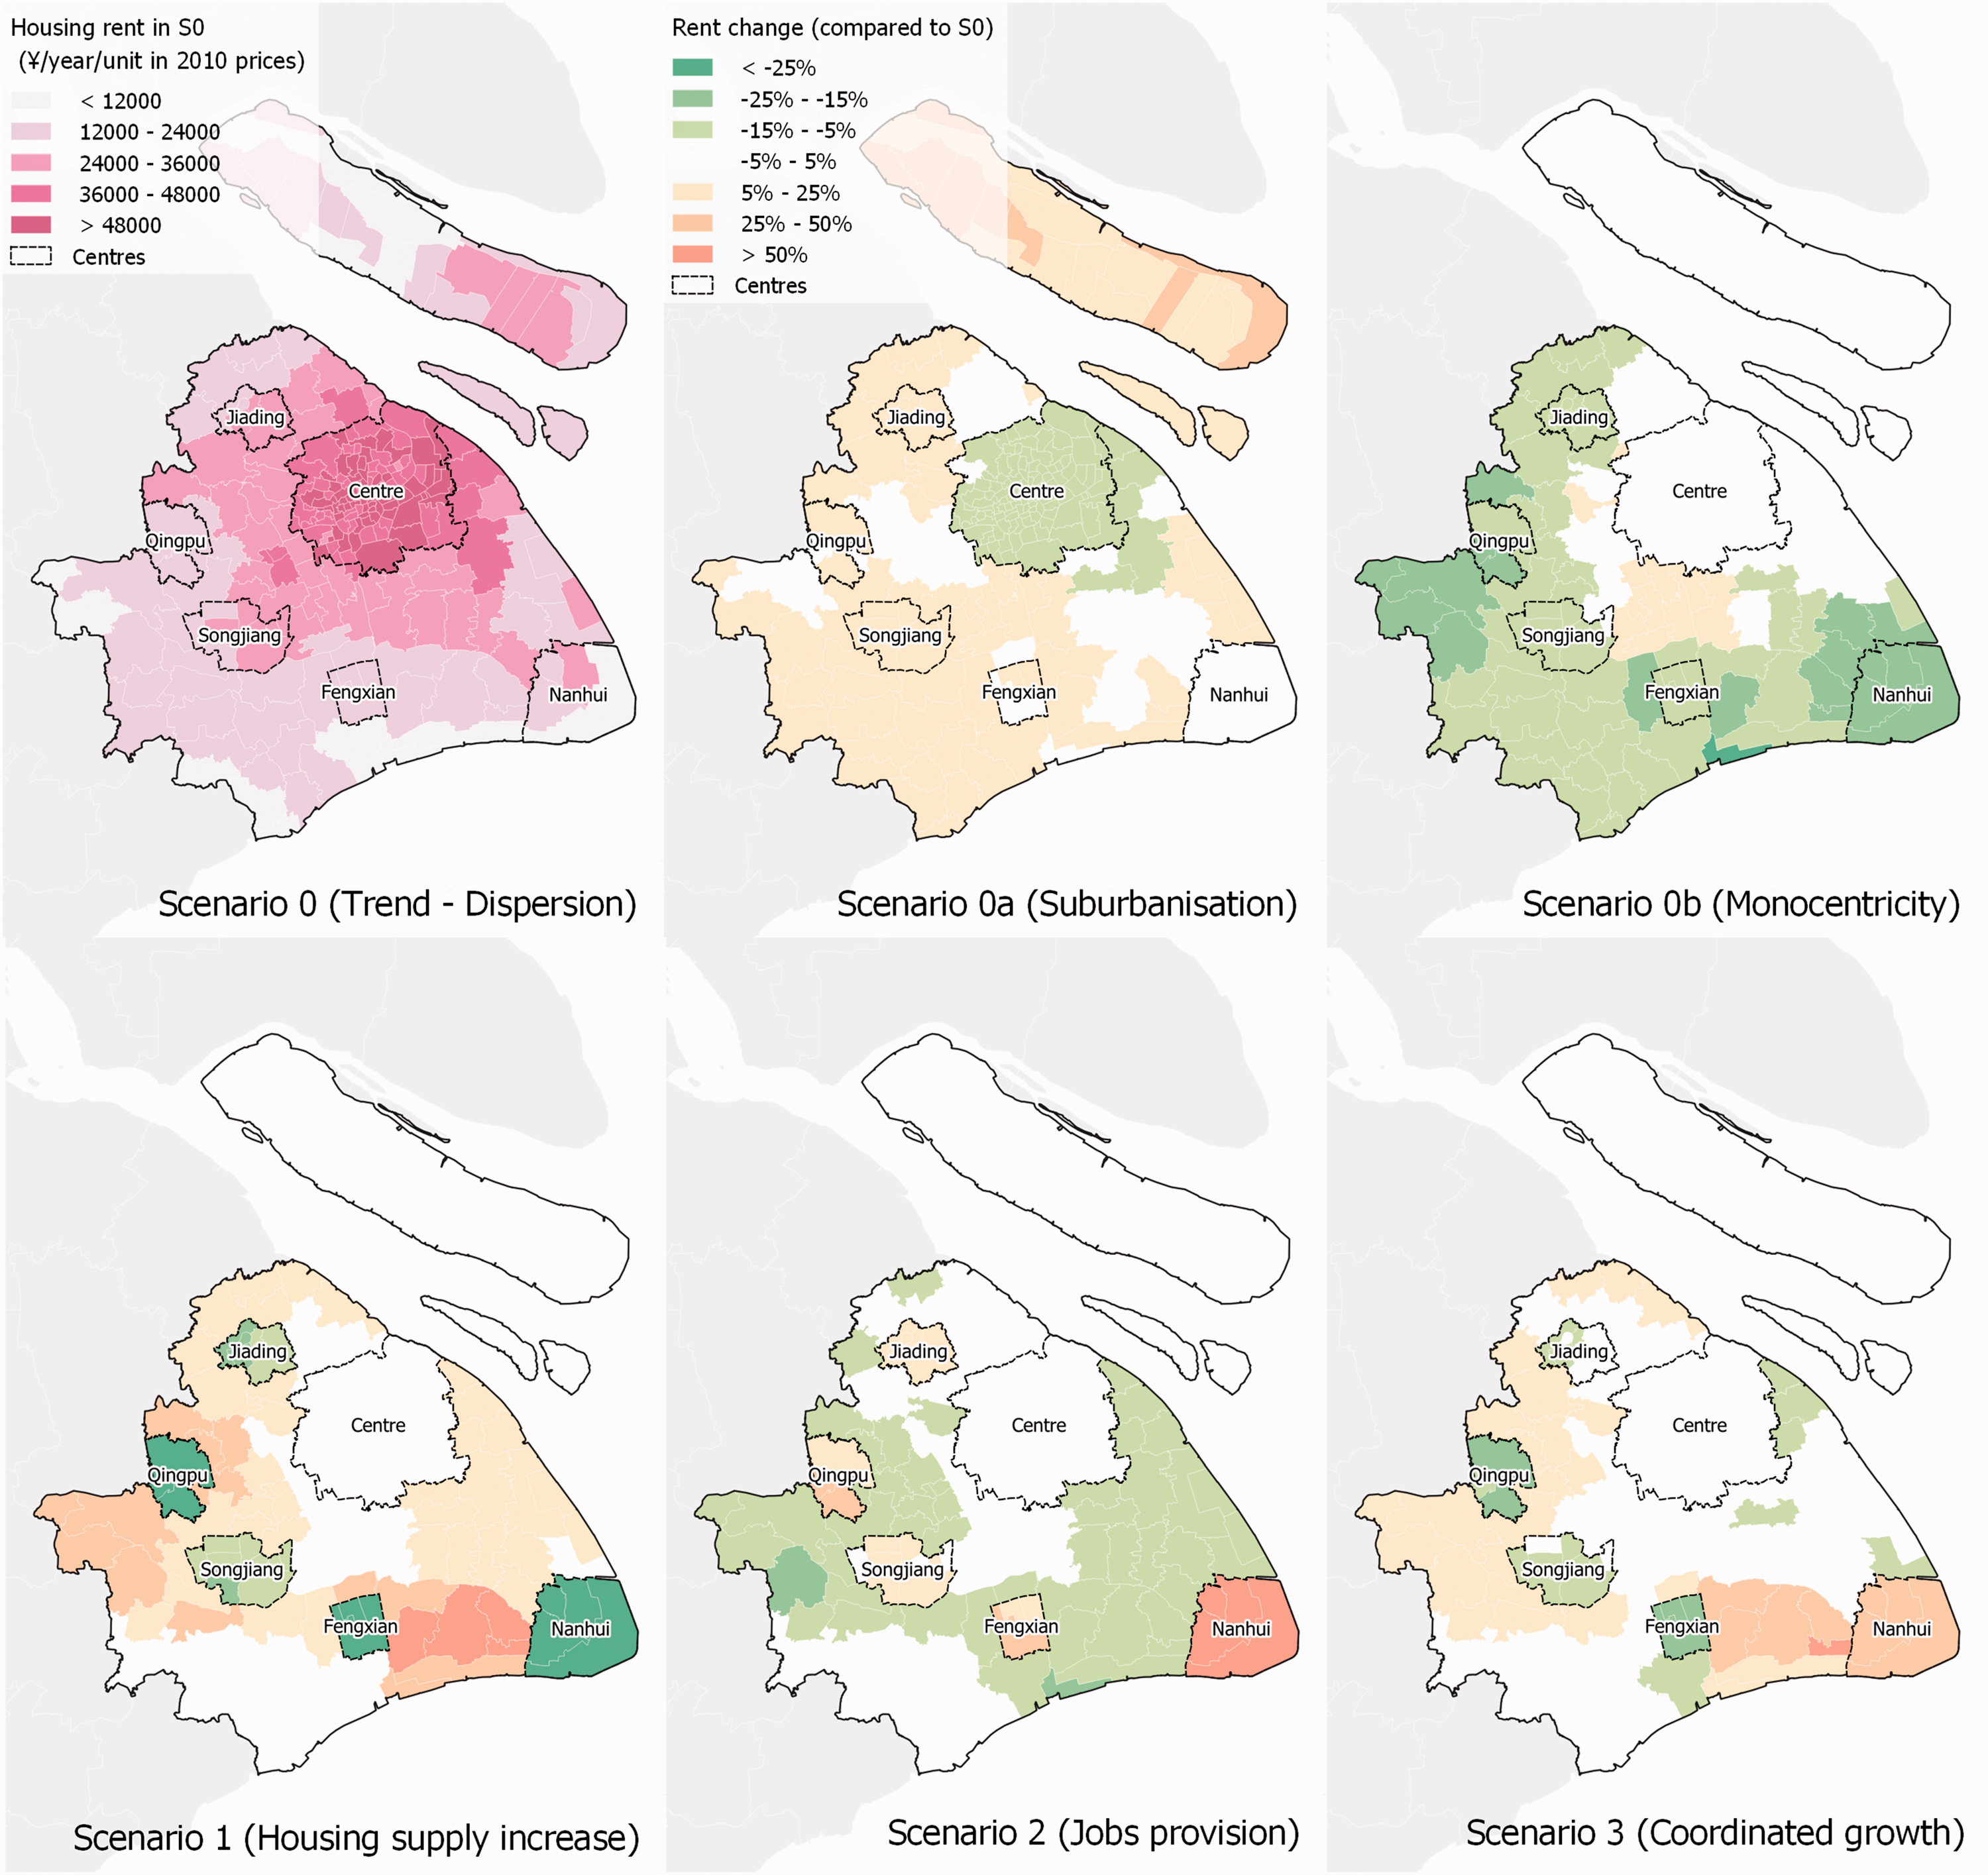
Housing rent and its variations between scenarios.
Regarding housing rent, the trend scenario (S0) extends the current property value growth trend where rent decreases centrifugally. Further to the previous analysis, S1 lowers housing rents in all five sub-centres with an excessive supply of dwelling units from the planning side. Comparatively, S2 pushes up the local rents by adding more employment opportunities; Nanhui sub-centre produces the highest growth as its current job shortage can be addressed to the largest extent. S3, as a combination of S1 and S2, generates rental declines in four out of the five sub-centres compared with S0. The value decrease from an excessive supply of housing could outweigh the rent rise generated by the provision of jobs. However, this requires a further examination on the local jobs–housing ratio change, as different centres are in various stages of development (Hu et al., 2019).
Table 2 summarises the average commuting distance. Compared with the trend growth (S0), the decrease (S0a) or increase (S0b) of jobs in the city centre introduces a large variation of commuting distance change. Suburbanisation with fewer jobs in the centre helps to reduce the central in-commuting, while the monocentric development with job centralisation results in the opposite. This confirms the empirical findings, especially in the Chinese context, where central expansion lengthens the overall average commute time and distance (Yang et al., 2012), and worsens the environmental effect with longer vehicle miles of travel (Ma et al., 2015; Zhao and Lu, 2011).
Average commuting distance in kilometres (2010–2035).
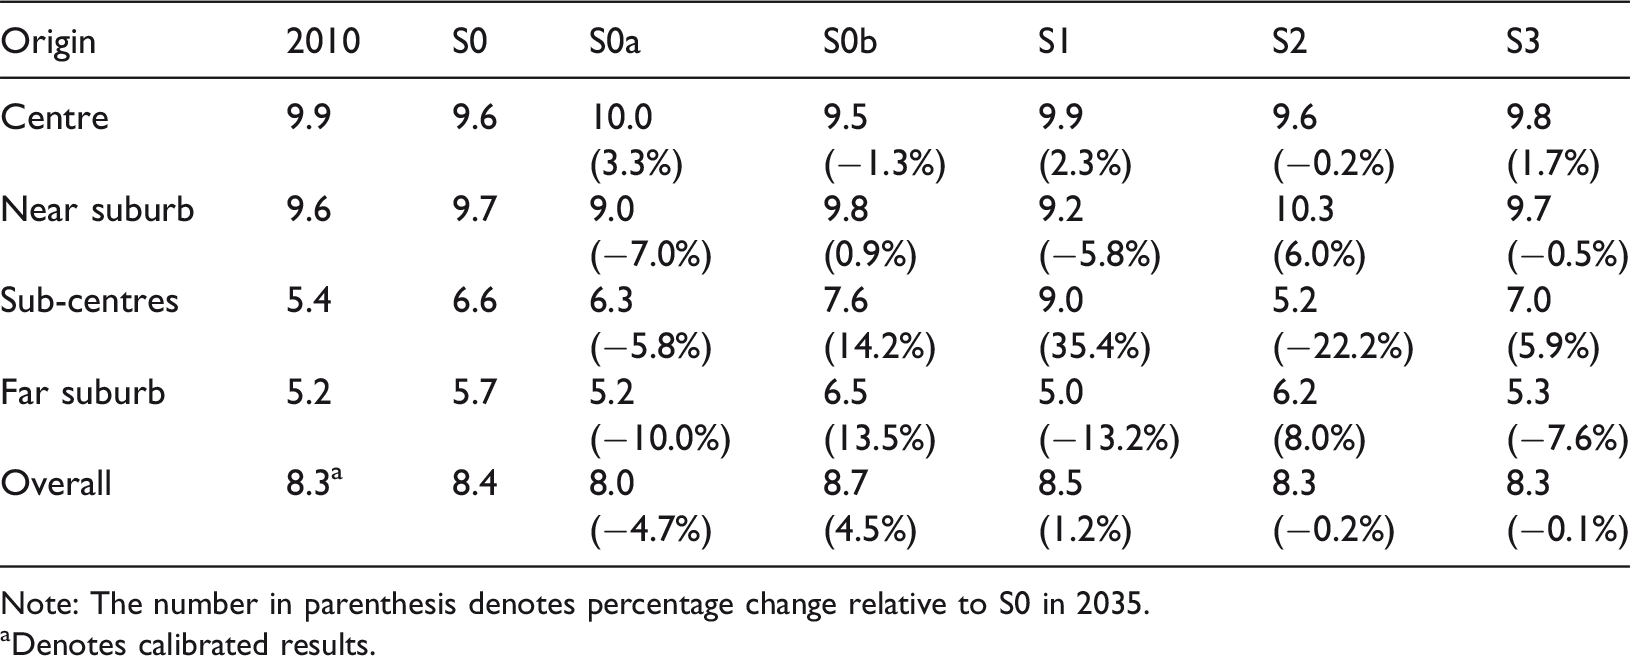
Note: The number in parenthesis denotes percentage change relative to S0 in 2035.
Denotes calibrated results.
S1 tends to be a representative polycentric case in terms of its negative planning outcomes where the average commuting distance from the sub-centres increases most due to a widened mismatch between jobs and housing provision. Although S2 and S3 share the same job distribution patterns, the average commuting distance in the sub-centres differs in the opposite directions. The over-supply of housing units in S3 pulls rent down and, therefore, attracts more residents relocating to the new sub-centres. The disruption of the jobs–housing balance then leads to excessive commuting. Our findings link to and further extend the literature that the jobs–housing balance can reduce travel. Specifically, living in or close to self-sustained sub-centres reduces commuting (see, e.g. Hu et al., 2018) and decreases transport-related carbon dioxide emissions (see, e.g. Wang et al., 2014). Furthermore, we introduce the market effects that explain the reasons why and to what extent the jobs–housing balance will be disturbed due to careless planning.
Conclusions
The paucity of reliable and disaggregated data in developing countries has made it almost impossible to assess polycentric policy effects comprehensively. This research assembles, integrates, and analyses urban data sets that differ in the characteristics of dimensionality, domain, and time to provide a quantifiable platform for measurements and predictions of urban polycentric development in a rapidly growing megacity.
The retrospective study (2000–2017) suggests that the delineation of sub-centres has a great influence on land development and housing unit distribution, which is in accordance with the findings from Li (2011) and Li et al. (2010). But a close examination of the land price and housing rent reveals that the positive elements of polycentric market growth (pre-2010) have faded away in recent years. This can be partly explained by the dramatic rental price increases in the central area. The low market expectations for the new sub-centres as reflected in the monocentric bid-rent curve should be noted as a warning to local planners, but what contributed to the changes and how to reverse this trend remain unclear.
In this case, we acknowledge that many emerging data sources (i.e. online and proprietary data) appear to have significant and untapped potential for identifying patterns of urban development and changes in the property market in a timely way. However, it is worth noting that novel data sets on their own merely reflect the planning outcomes and market responses in a pro-development stage. Despite numerous institutional factors in the estate property development process, the efforts to create sub-centres will ultimately correspond to the underlying theory of a supply–demand relationship in production, residential relocation, and estate property markets (see, e.g. Glaeser, 2008; Wegener and Spiekermann, 2018).
We, therefore, make effective use of multi-source data, either as known inputs for a dynamic SE framework or as a reference to conduct model calibrations. The calibrated and cross-validated model is then used to explore the performance of dispersion, mono- and polycentric development (2010–2035) under different policy scenarios. The comparative analyses indicate that the monocentric development (S0b) enjoys lower market expectations outside the traditional centre and yields longer commutes. The trend dispersion of future employment growth (S0) alone cannot bring about significant positive changes, whereas a further decentralisation of existing employment locations (S0a) in the city core has potential for decreases in the overall commuting distance and carbon emissions.
Keeping the employment rate and housing constant in the city centre, the polycentric scenarios show that, over time, the balance between jobs and housing provision appears to be lost, and there are insufficient job opportunities in the planned sub-centres rather than any lack of housing development that leads to the loss of this balance. Planners and decision-makers should be aware that the pure development of dwelling units stimulates larger resident inflows but stagnates the property value growth; the overall bid-rent curve displays a mono-centric pattern, as has recently been observed (post-2010) in Shanghai. Even worse, fewer residents choose to move out of the traditional centre due to the unevenly distributed housing stock patterns outside, making the ‘physical’ polycentric development (S1) an undesirable choice in the decentralisation of population.
The rules of thumb of simultaneous growth in population and the property market are the decentralisation of existing central jobs (S0a) and the introduction of more employment opportunities to sub-centres (S2). Coordinated jobs and housing growth, though often highlighted in many comprehensive plans, have a negative performance on rental growth in most sub-centres. The proper proportions between housing supply and job provision require careful consideration and scenario testing by phases in the local context.
We note that this paper considers Shanghai as a closed economy where no inter-regional interaction is involved. As most of the sub-centres are in the peripheral areas of Shanghai, it is necessary in the next steps to incorporate inter-city commuting, especially with the rapidly developing high-speed rail system. This requires urban data sets with larger coverage of geographical zones and more urban flow-related information to calibrate the model. As the model has the capability of regular monitoring of urban development progress, it is also critical for the modellers to continuously update the cross-year data settings with the policymakers in the implementation of local comprehensive plans.
Expanding the market in urban peripherals and stimulating the market in core development zones, in part through determined planning frameworks by the local government and the joint process of privatisation and investment, is becoming a universal trend. The extent to which the planned urban spatial structure is supported by the local market often relates to the success or failure of policy objectives. Long-term appraisals derived from the analytics underpin the identification of two key influences, namely housing supply and the provision of jobs, on property value uplift over specified time horizons. Urban planners, land developers, and decision-makers would all benefit from understanding the revealed relationships among spatial planning, property development, and market feedback while optimising sustainable and efficient urban development schemes through timely decisions.
Such an approach with quantitative modelled results can plug a gap in current intra-city sub-centre development decision-making processes and introduce a new thread of conversation of multi-source data into examining polycentricity. This is useful in many developing countries with the emergence of online data sources, particularly the patterns of residential rents (from online property listings) and the commuting time in morning traffic (from Google Maps) that have been used as two key sources for the model calibration. It is worth noting that data mismatch does exist even in the official statistics (e.g. census) requiring further modifications based on observations and data cross-check. Although fine-scale analyses are possible, it is necessary to initiate the model with more aggregated zones where the data are more accessible and reliable while the modellers and users are more familiar with the local context. In the current stage, not all developing countries have these data sets readily available, but the number of those with widely spread data sources (i.e. rents, traffic, and census) is likely to grow in the near future.
Supplemental Material
Supplemental material for Aspirations and realities of polycentric development: Insights from multi-source data into the emerging urban form of Shanghai
Supplemental Material for Aspirations and realities of polycentric development: Insights from multi-source data into the emerging urban form of Shanghai by Tianren Yang, Ying Jin, Longxu Yan and Pei Pei in EPB: Urban Analytics and City Science
Footnotes
Declaration of conflicting interests
The author(s) declared no potential conflicts of interest with respect to the research, authorship, and/or publication of this article.
Funding
The author(s) disclosed receipt of the following financial support for the research, authorship, and/or publication of this article: This research was supported by C. Lowell Harriss Dissertation Fellowship (Lincoln Institute of Land Policy), Grace & Thomas C H Chan Cambridge International Scholarship, Capco Future Cities Fellowship, and the Cambridge-UC Berkeley-National University of Singapore University Alliance project ‘Smart Design’.
Notes
Supplemental material
Supplemental material for this article is available online.
References
Supplementary Material
Please find the following supplemental material available below.
For Open Access articles published under a Creative Commons License, all supplemental material carries the same license as the article it is associated with.
For non-Open Access articles published, all supplemental material carries a non-exclusive license, and permission requests for re-use of supplemental material or any part of supplemental material shall be sent directly to the copyright owner as specified in the copyright notice associated with the article.
