




Abstract
Standard address data are essential geographical information that play an important role in urban management. However, due to the complex structures of Chinese addresses, poor address quality has long been a problem in China. Although several measures were established to improve the address quality, nonstandard address data are still common in new urban areas. To investigate the potential causes of the geographical disparities in address quality, in this paper, we hypothesize that the sprawling urban form caused by rapid urban expansion in China has hindered the generation of standard addresses in new urban areas. To test this hypothesis, the spatial pattern of address quality in Shenzhen, China, is analyzed, and the potential causal paths relating urban expansion, urban form, and address quality are examined using structural equation modeling. The results indicate poorer address quality in new urban areas in Shenzhen. Rapid urban expansion has an indirect negative relation with the address quality. In addition, both road compactness and land use compactness have a direct positive effect on address quality, but the latter is insignificant. In this case, to facilitate improvements in address quality, a plan with dense and small blocks is suggested in the planning of new urban areas.
Introduction
Address quality refers to the proportion of standard address data in a certain geographical region (e.g., a city, state, or country), where a standard address is one that points to the correct geospatial location (i.e., spatially accurate) and at the same time employs a standard address model that is specific to a certain house number, or at least a building number (i.e., structurally accurate). Standard address data can convey precise location information using simple human-understandable language and therefore can significantly facilitate the efficient urban management (Coetzee and Cooper, 2007; Njoh, 2010, 2012) and delivery services (van Duin et al., 2016) as well as promote equal access to health care (Krieger et al., 2002; Ouma et al., 2018). However, although there have been multiple use of address data over the past few decades, the retrieval of standard address data in China still remains a challenge. Nonstandard address data are increasing the difficulty of georeferencing (Tian et al., 2016). Therefore, it is urgent to improve the address quality in China.
To date, several measures have been proposed to improve the address quality in China. First, specific address standards have been proposed to normalize the format of Chinese addresses. For example, a national address standard, the Platform for Geo-information Common Services Data Specification for Geo-entities, Geographic Names and Addresses, defines a general Chinese address model and regulates the structure of a standard address in China (State Bureau of Surveying and Mapping (China), 2011). Another standard, the Classification, Description and Encoding Rules for Geographical Names and Addresses in the Common Platform for Geospatial Information Services of Digital Cities, specifies the rules and methods for naming and coding the address data (State Bureau of Surveying and Mapping (China), 2007). Second, agencies in charge of address registration, such as the Place Name Office, have been established nationwide. Third, several address standardization algorithms have been developed, including address feature hierarchical models (Peng and Wu, 2013) and the natural language processing approaches (Küçük Matci and Avdan, 2018; Lin et al., 2019). Although the above-mentioned measures have made progress towards improving the address quality in China, they still have some limitations. One major gap in these measures is that they mainly focus on the improvement of address models and address matching algorithms, but pay little attention to how to conduct effective address management in the urban planning process. Address allocation and update are two important tasks that should be handled in urban planning; therefore, address quality is closely associated with the planning policies. As a city grows, different planning policies may be adopted, which could result in an uneven spatial pattern of address quality in the city (Avanasi et al., 2016; Bonner et al., 2003; Chow et al., 2016; Inkoom et al., 2017). Notably, some places may have much poorer address quality than that in others. The geographical disparities in address quality have greatly limited an equal access to high-quality address services in the city.
Previous research has identified generally low address quality in new urban areas (i.e., peri-urban and suburban areas) (Chow et al., 2016; Dearwent et al., 2001; Hay et al., 2009; Zandbergen, 2009). Considering that China is now experiencing a rapid urban expansion, most of the new urban areas are transformed from rural areas in a short time (Cohen, 2004). A rapid but not well-planned urban expansion may have a negative impact on the urban form of the new urban areas and may even lead to a sprawling development (Liu et al., 2016; Seto et al., 2011). A sprawling urban form is characterized by a scattered, leapfrog, single-use, and low-density pattern of development in the city (Ewing and Hamidi, 2015) and is responsible for several problems in urban development (Rahman et al., 2008). The address quality could be affected by such a change in urban form. Because address data usually serve as the geographical labels of buildings, address allocation is influenced by the complexity and consistency of buildings or building groups (Zandbergen, 2008). For example, in many cities in the United States, a grid plan is often adopted in urban planning, where the shape of blocks is often a grid, and buildings are arranged in arrays (Marcuse, 1987). In this case, the addresses of these buildings can be easily assigned by the interpolation of building numbers. As the urban form shifts to sprawling, it would be more difficult to describe a specific geo-location with a standard address; instead, ambiguous and nonstandard addresses are often assigned. Therefore, it is plausible to investigate the relationship between rapid urban expansion and address quality.
In this study, we propose a hypothesis that the sprawling urban form resulting from the rapid expansion of urban built-up lands is responsible for the poor address quality in new urban areas. To validate this hypothesis, we first quantify the address quality in each subdistrict of Shenzhen, China, and then determine if there is an uneven spatial pattern of address quality. Next, we investigate the correlation between rapid urban expansion and address quality and apply structural equation modeling (SEM) to test this hypothesis.
This paper is organized as follows. The upcoming section introduces the study area of this paper as well as the data employed, and explains our methods to measure the spatial pattern of address quality and identify its link with rapid urban expansion. The experimental results are presented in a further section. The penultimate section analyzes and discusses the potential reasons for the results. The conclusions are drawn in the final section.
Materials and methods
Study area
Shenzhen (22°27′–22°52′N, 113°46′–114°37′E), one of the most bustling cities in China, is situated in the Pearl River Delta north of Hong Kong. Since Shenzhen was designated as the first of the four special economic zones in 1980, it has soon developed from a small village into a metropolis, reporting an average gross domestic product growth of 10% per year since 2012. Driven by the fast-growing economy, Shenzhen has experienced massive urban expansion over the past three decades. Formerly known as the Bao’an County, Shenzhen now has direct jurisdiction over 10 administrative districts, including Bao’an, Longgang, Nanshan, Futian, Luohu, Yantian, Guangming, Pingshan, Longhua, and Dapeng. The location and administrative division of Shenzhen are mapped in Figure 1, where districts are classified into two categories according to the year they were established. This study was conducted at the subdistrict level. There are 57 subdistricts in Shenzhen, and all of them with no missing data were included in the following analysis.

Location and administrative division of Shenzhen, China.
Data
As is shown in Figure 2, three types of data were employed in this study: address, road network, and land use data. Their sources and processing procedures are introduced as follows.

Data and their retrieved years, sources, and preprocessing procedures. SZ-UPLRC: Shenzhen Municipality (Municipality Oceanic Administration of Shenzhen); SAR: standard address ratio; FLAASH: Fast Line-of-sight Atmospheric Analysis of Spectral Hypercubes.
Address and address quality
The address data were applied to measure the address quality in the city. The data were acquired from the 2011 Building Census of Shenzhen, which includes the address records for 608,305 surveyed buildings in Shenzhen, China. The address data were then classified into two types: standard and nonstandard addresses. The classification steps are as follows.
Baidu Maps utilizes a standard address database for its geocoding service, and this database stores the address data with a standard Chinese address model “administrative region (country/province/city/county/township) + areal limit (street/lane/residential community/village) + point location (house number/building number).” This is also a large-scale database that covers most of the urban address data in China. The address matching approach adopted by the Baidu Maps Geocoding API is to compare the respective address elements based on their hierarchical relations until there is an unmatched element, which is popular and has been recognized to achieve a high accuracy. In this case, the classification results are considered reliable.
After sorting the standard and nonstandard addresses, we quantified the address quality of each subdistrict in Shenzhen with the standard address ratio (SAR). This metric is defined as
Road network
The road network data were used to quantify the urban form of Shenzhen. The data were obtained from the Urban Planning, Land & Resources Commission of Shenzhen Municipality (Municipality Oceanic Administration of Shenzhen) (SZ-UPLRC). The topological errors in the road network data were fixed using ArcGIS 10.2.2. The modifications included: (1) removing the overlaps of roads, as the same road cannot lie on the same course more than once, and (2) removing the roads that were extremely short and not connected with other roads, as these segments are the result of digitization errors that occur in the map production process (Theobald, 2001).
Land use
The land use data were applied both to quantify the urban form and to measure the urban expansion rate of each subdistrict in Shenzhen. Specifically, the land use data from 2011 were directly retrieved from SZ-UPLRC, and the data from 2001 were interpreted from the Landsat TM images.
Three Landsat TM images were used to create the land use data for 2001. First, the images were preprocessed with radiometric correction to reduce and correct the radiometric errors. Then, the image mosaicking technique was applied to align these three images and obtain an image containing the entire study area of Shenzhen. Next, the land use map from 2001 was generated by supervised classification using the maximum likelihood method (Sahana et al., 2018). The land classes included bare lands, wood lands, water areas, and built-up areas. The region of interest separability report showed that both values of the Jeffries-Matusita distance and the transformed divergence index were high (>1.9), which indicated that reliable classification performance was achieved (Poth et al., 2001).
To facilitate the calculation of the urban expansion areas, built-up areas class was used to represent the urban areas in Shenzhen (Li et al., 2018). The built-up areas were extracted from the land use maps of 2001 and 2011 and the urban expansion areas were then obtained using the erase function (i.e., extracting the areas that did not overlap between the two maps).
Methods
First, the address quality of 57 subdistricts in Shenzhen was mapped, and the univariate local Moran’s I metric was applied to determine whether the spatial pattern of the address quality in Shenzhen was uneven. Second, the correlation between the address quality and urban expansion rate was investigated using the Pearson correlation coefficient. Finally, the SEM was used to investigate the potential causal paths relating rapid urban expansion and address quality. A flow chart is given in Figure 3 to illustrate the methods and their purposes in this study. Further details of the local Moran’s I and the SEM are provided as follows.
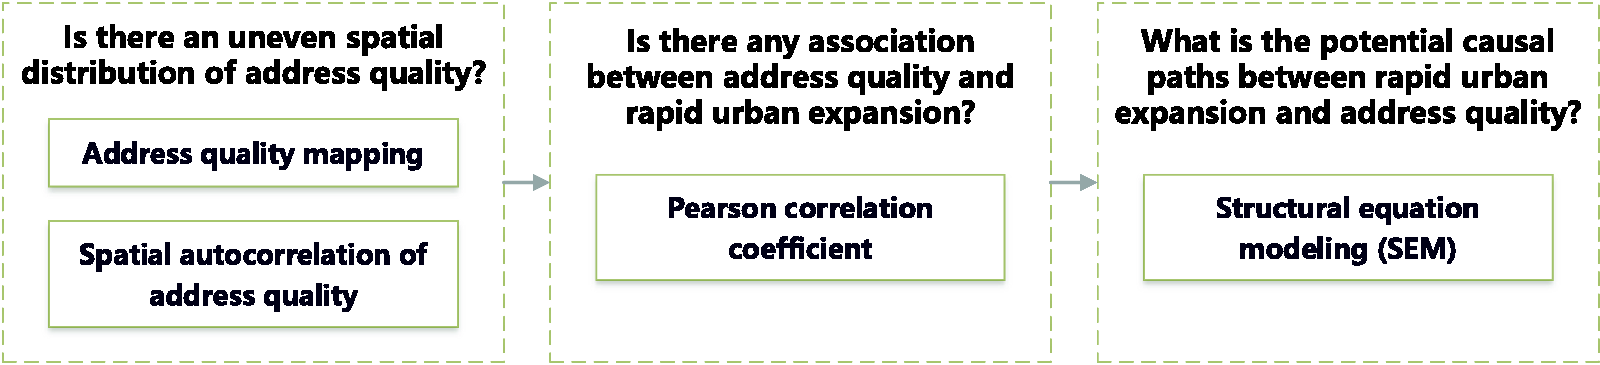
An overview of the adopted methods and their corresponding purposes in this study.
Spatial autocorrelation analysis
The univariate local Moran’s I was used as the local indicator of spatial association (LISA) (Anselin, 1995) to reveal the spatial pattern of address quality in the city. This metric reflects the local spatial autocorrelation pattern by identifying the local spatial clusters and outliers in the spatial pattern of urban address quality. Specifically, this indicator can be expressed as
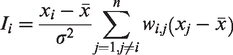
The results distinguish between high-high and low-low clusters, and high-low (i.e., a region of high SAR surrounded by a low-SAR neighbor) and low-high (i.e., a region of low SAR surrounded by a high-SAR neighbor) outliers.
Structural equation modeling
Based on the background knowledge introduced in Introduction section, we proposed the hypothesis that the sprawling urban form caused by rapid urban expansion in the new urban areas has led to poor address quality. SEM, a statistical method that has been widely used in social and environmental sciences (Bollen and Noble, 2011; Tallavaara et al., 2018), was then applied to test this hypothesis. SEM is composed of a set of structural equations that can be used to evaluate the direct and indirect effects of both endogenous (observed) and exogenous (latent) independent variables on a certain process and to establish and test causality models in multiple pathways.
The causal path diagram for SEM in this study is presented in Figure 4, in which the rectangles are used for endogenous variables and the ovals are used for exogenous variables. Here, we quantified the urban form under rapid urban expansion with the variable “compactness” (Chen et al., 2008; Tsai, 2005). A compact urban form is in contrast to urban sprawl and denotes a high-density and walkable urban environment (Barnett, 2003; Farr, 2008). Because addresses are usually the labels of buildings, with planning and design schemes closely associated with the road network (Hillier, 1989) and land uses (Farr, 2008), we further divided “compactness” into two categories: road compactness and land use compactness. These two variables were then used as the exogenous variables in SEM. Based on Ewing and Hamidi (2014), we then selected three endogenous variables (the average block size, percentage of small blocks, and road density) for road compactness and two endogenous variables (the building density and proportion of built-up lands) for land use compactness.

The causal path diagram of SEM.
Road compactness: The indexes of the average block size and percentage of small blocks indicate the average scale of blocks formed by streets. The road density index indicates whether the road network is sparse or dense. A compact road system should be characterized by good accessibility and connectivity, with more small blocks than large blocks and a high-density road network.
Land use compactness: The building density index indicates the relative proportions of urban open space and the spaces for buildings within built-up areas. The index of the proportion of built-up lands indicates the overall built-up density with respect to other types of land use. A compact land use system should have high residential and built-up densities.
The definitions and descriptive statistics of the variables used to quantify urban land expansion, urban compactness, and address quality are shown in Tables 1 and 2. Particularly, all the endogenous variables were standardized to the range of 0 to 1 before executing the model (including the average block size, the only negative variable).
The measures and variables used in SEM.

Descriptive statistics of the original values of each variable.

SEM model also provides statistical measures to assess the model fit, which help indicate whether the hypothesis is validated. Such measures include Chi-square, CFI (comparative fit index), RMSEA (root mean square error of approximation), and RMR (root mean square residual). The acceptable values of these measures for a good model fit are given in Table 3.
The estimated and acceptable statistics of the SEM fit.

Results
Spatial pattern of address quality in Shenzhen
Figure 5 illustrates the spatial pattern of the address quality in Shenzhen and the corresponding LISA clusters. The choropleth map in Figure 5(a) was generated using the natural breaks classification method. The figure shows that there has been an uneven spatial pattern of address quality in Shenzhen and that the gaps in address quality among different districts are distinct.
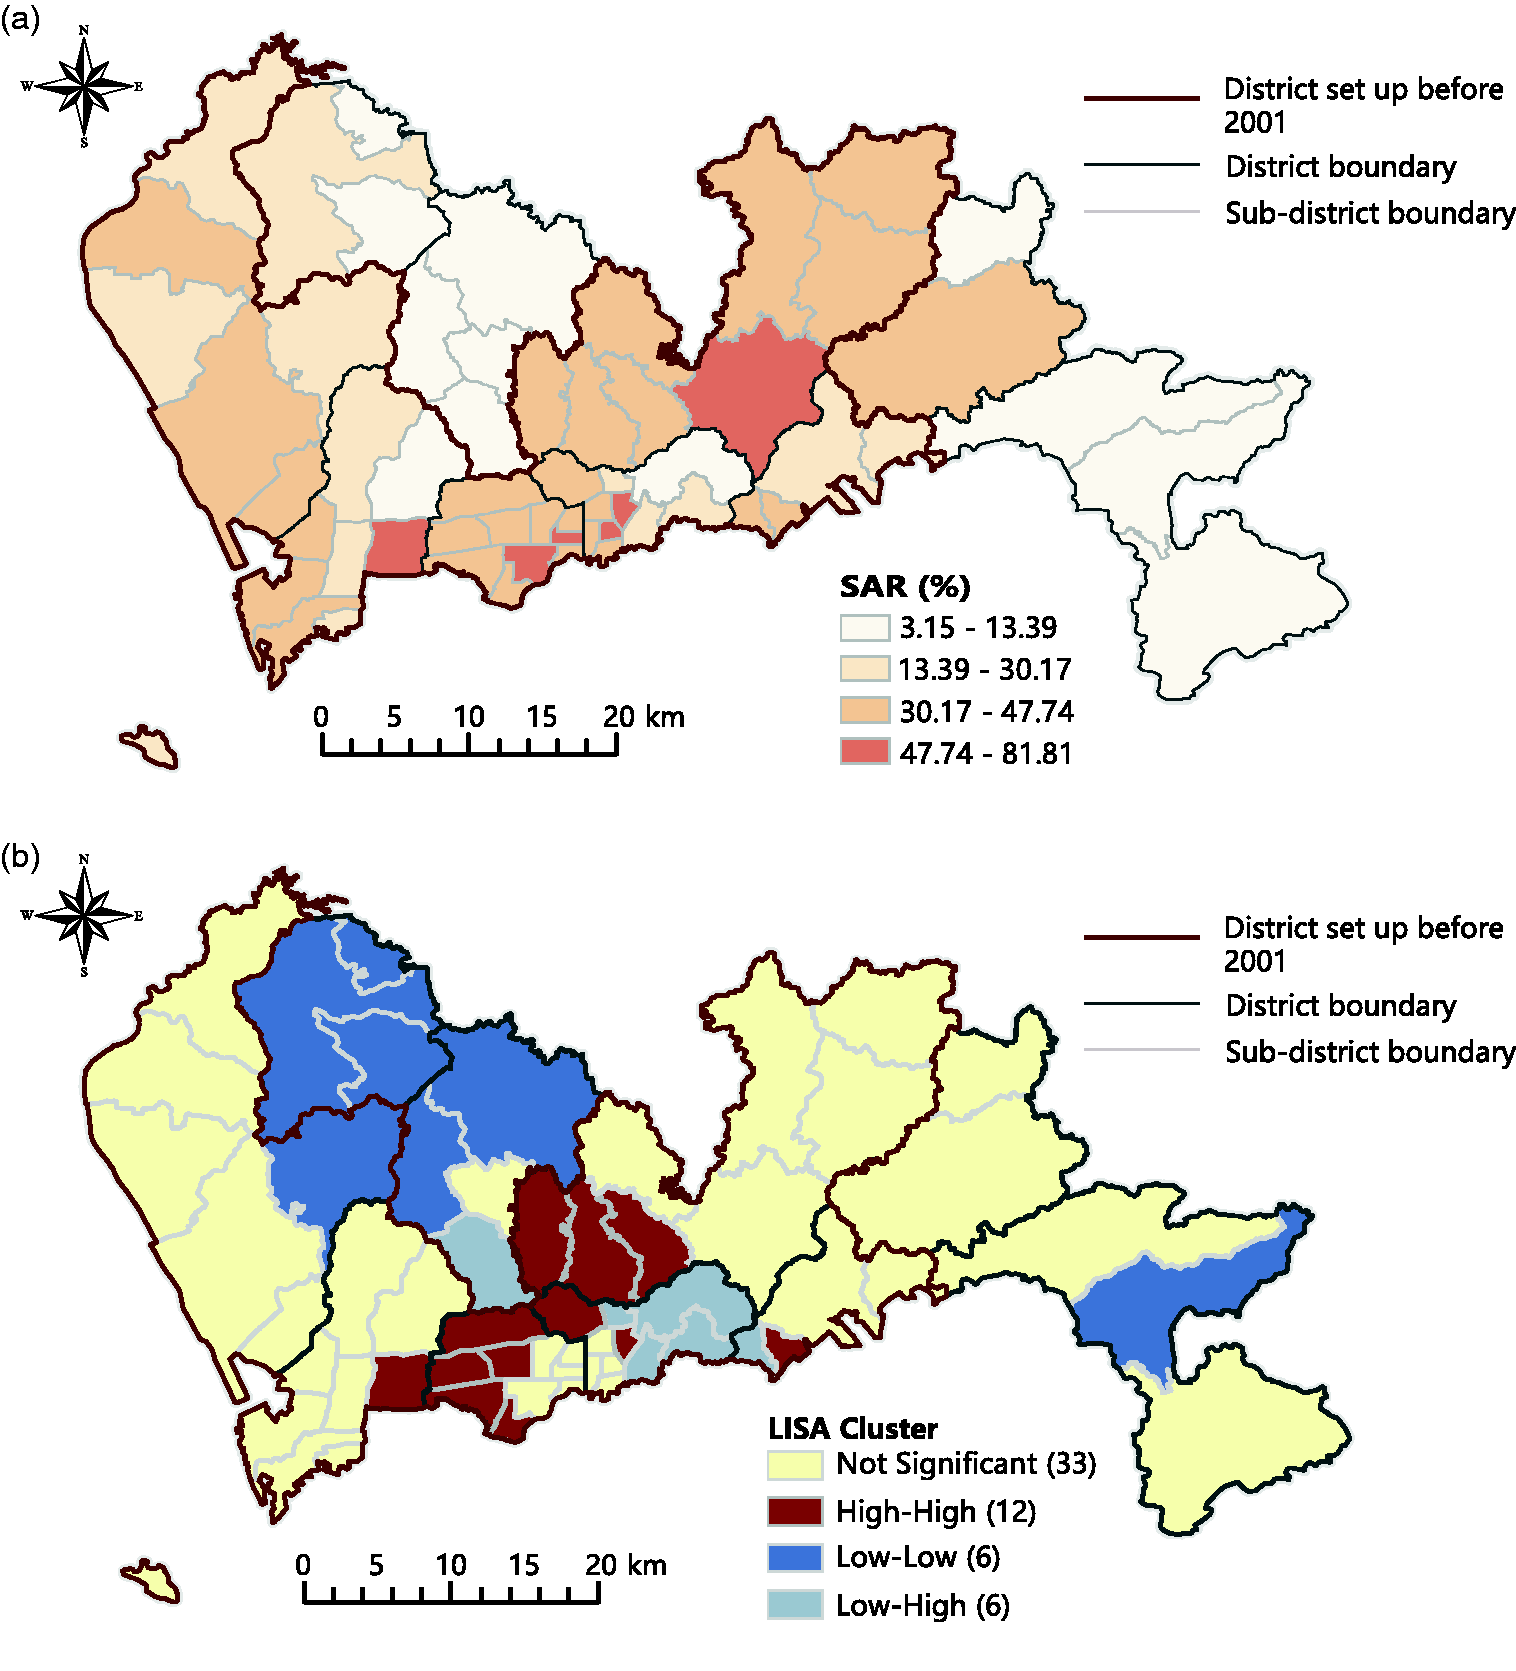
Spatial pattern of address quality in Shenzhen, China and the LISA clusters of SAR. LISA: local indicator of spatial association; SAR: standard address ratio.
As shown in Figure 5, high-high spatial clusters are observed in Longgang, eastern Nanshan, Futian, and a small region of Luohu and Yantian. Particularly, although few subdistricts have an SAR over 52.76%, almost all of them lie in Longgang and Nanshan, which further indicates a high address quality in these areas. In addition, the low-high clusters in Luohu and Pingshan suggest that compared to their neighbors, there is a significantly lower address quality in southern Pingshan and eastern Luohu, which have an SAR below 13.39%. The low-low clusters are mainly in Guangming, Dapeng, Bao’an, and Longhua; these areas have generally low SARs below 13.39%, reflecting poor address quality. Generally, the average address quality of the new districts established after 2001 (i.e., Guangming, Pingshan, Longhua, and Dapeng) is much lower than that of the other six older districts.
Correlation between rapid urban expansion and address quality
Both urban expansion area and urban expansion rate in each subdistrict of Shenzhen are mapped in Figure 6; the correlation between urban expansion rate and SAR is mapped in Figure 7. Figure 7(a) is a bivariate thematic map. The urban expansion rate in Shenzhen was mapped with a sequential color scheme using the natural breaks classification method, and the SAR is represented by the graduated symbols. Figure 7(b) illustrates the Pearson correlation between the urban expansion rate and SAR. Because the distribution of the urban expansion rate is right skewed, we performed a log-transformation before the Pearson correlation analysis.
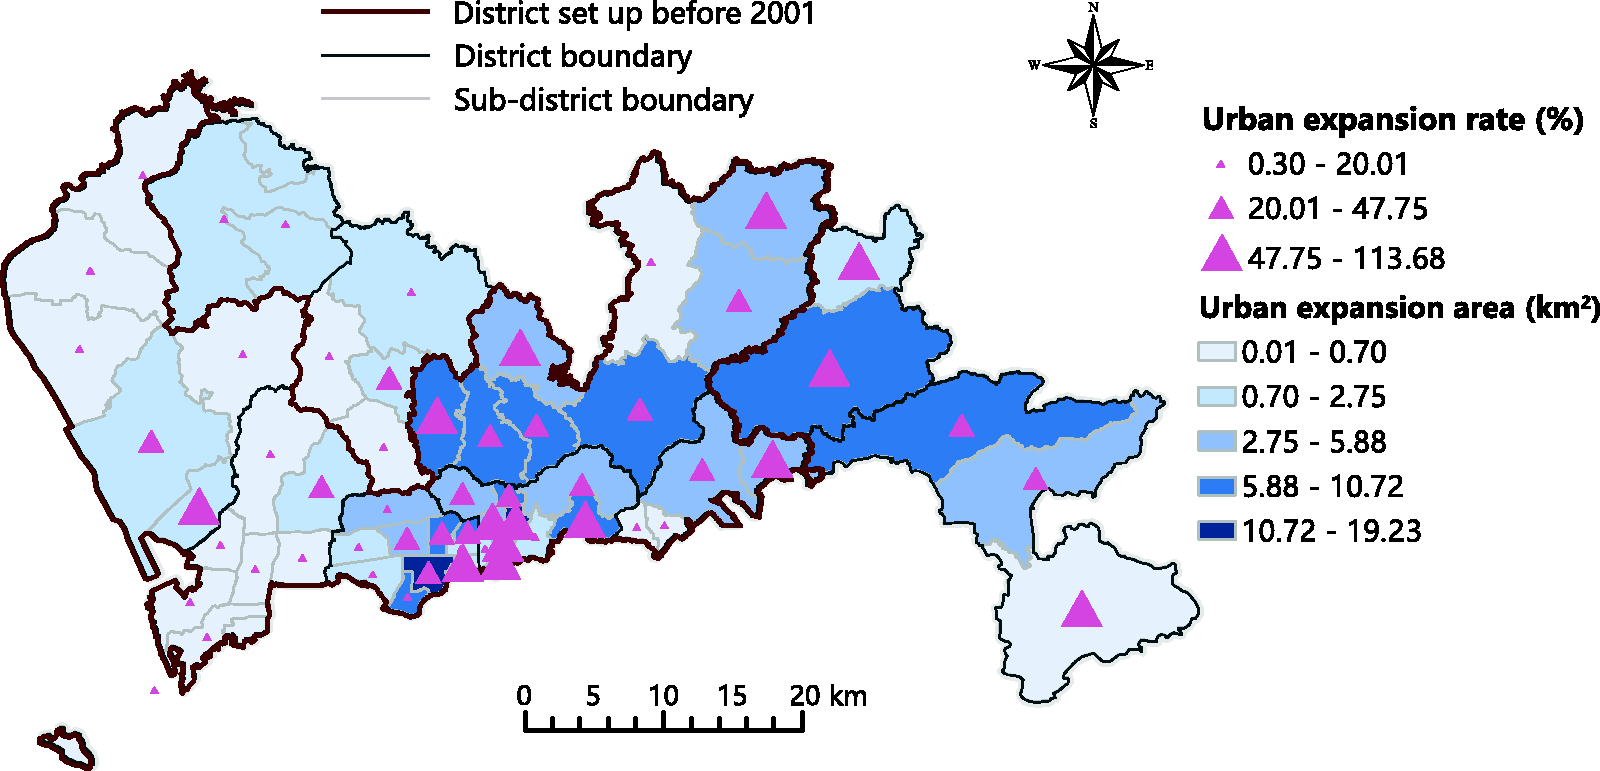
Urban expansion from 2001 to 2011 in Shenzhen.
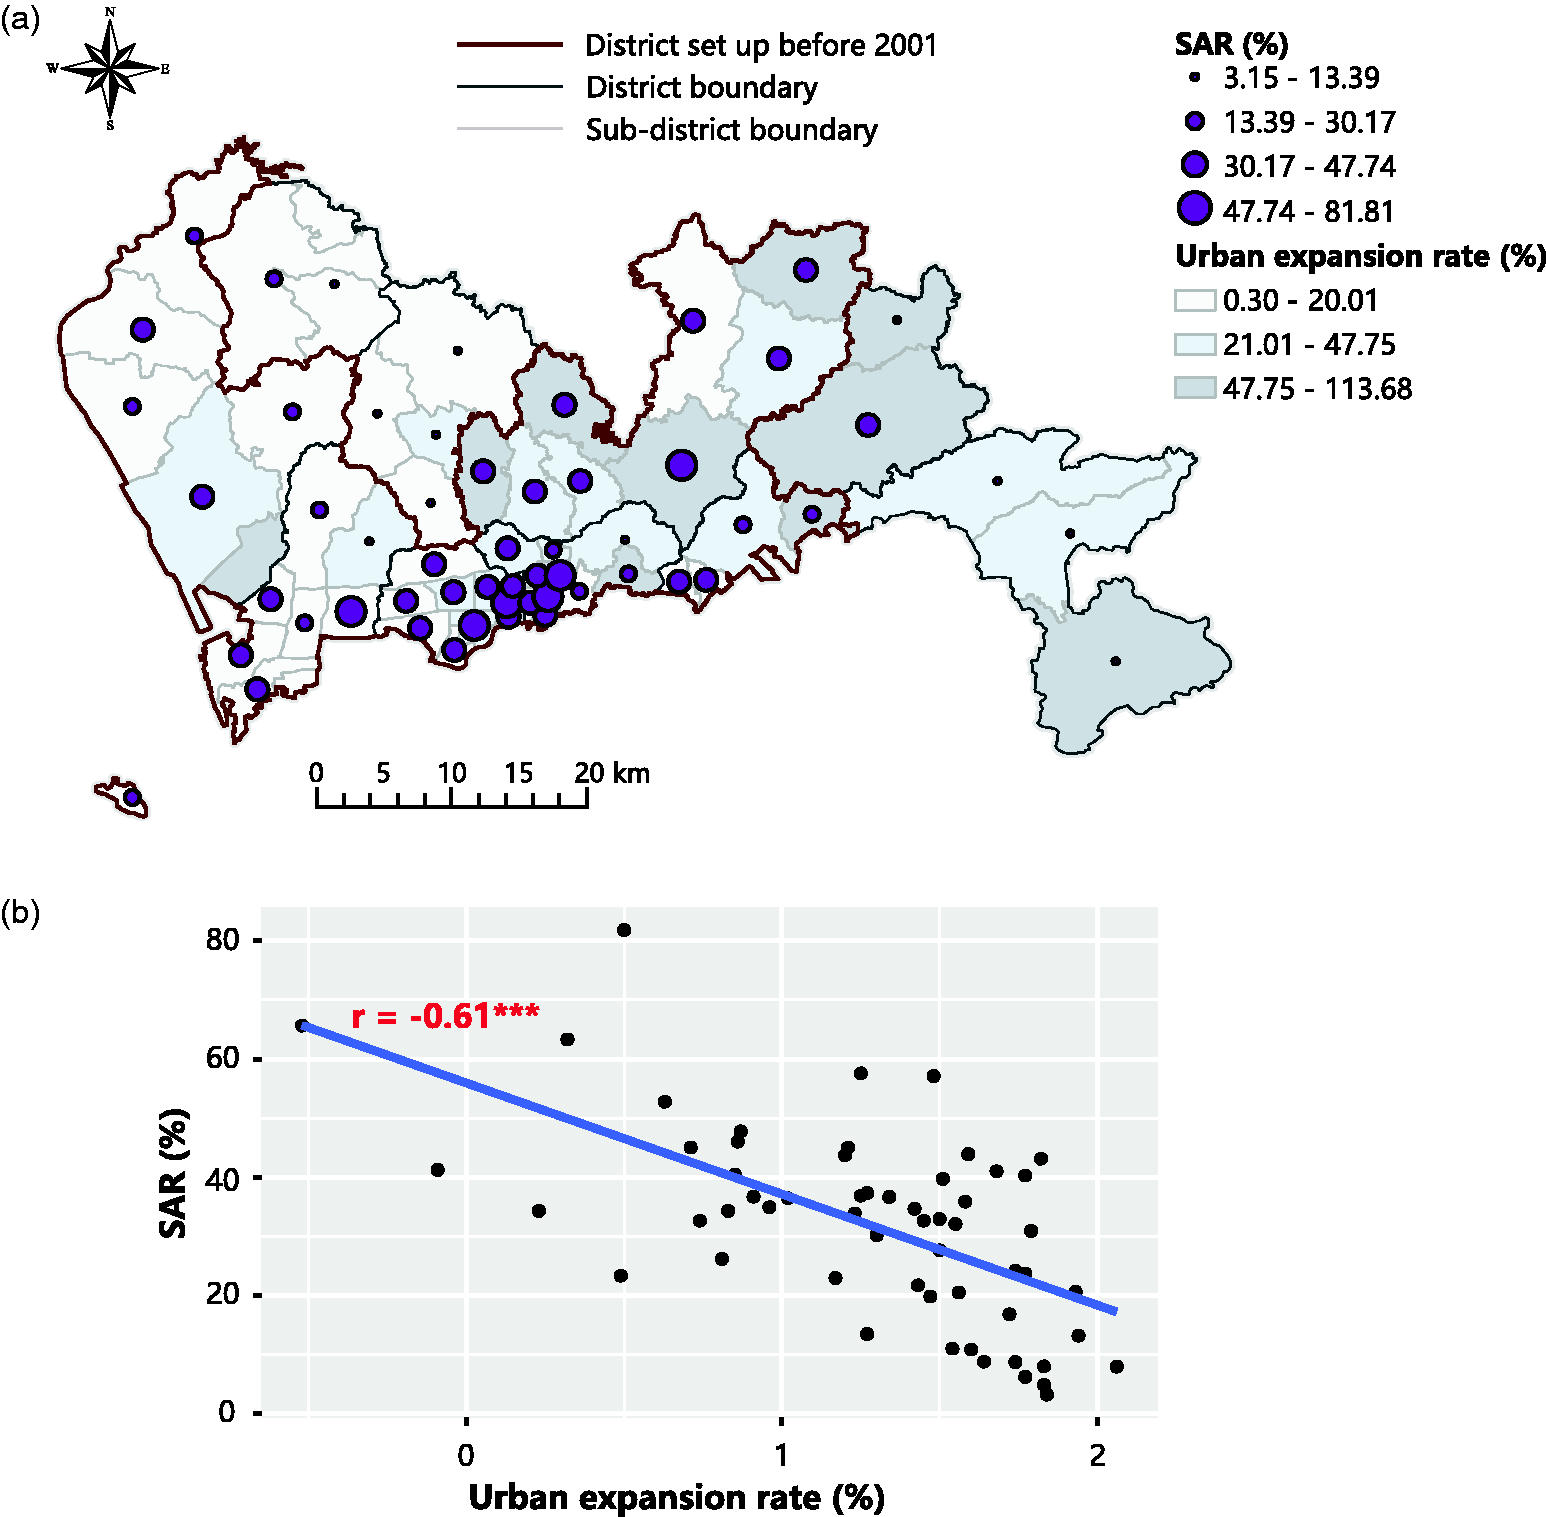
The urban expansion rate and its correlation with the SAR. SAR: standard address ratio.
As shown in Figure 6, for the districts established before 2001 such as Bao’an, Nanshan, Luohu, and Futian, the original urban areas (in 2001) of most subdistricts accounted for a large proportion of the district land use, and the expansion of these urban areas in the following 10 years was relatively small. In contrast, for those districts established after 2001, especially Guangming and Longhua, rapid urban expansion occurred from 2001 to 2011, with a majority of the subdistricts having urban expansion rates above 47.75%.
As shown in Figure 7, the result of the Pearson correlation analysis indicates a significantly high negative correlation (r = –0.61***) between the urban expansion rate and the SAR. This result suggests a substantial association between the address quality and rapid urban expansion, that is, those subdistricts that experienced rapid urban expansion from 2001 to 2011 are more likely to have a poorer address quality than are other subdistricts.
Potential causal paths linking rapid urban expansion and address quality
Table 3 presents four fit statistics used to assess the SEM fit and the results indicate whether the model can effectively validate our hypothesis. As shown in the table, all the values of the examined statistics, including Chi-square, CFI, RMSEA, and RMR, are within the acceptable thresholds, which signifies a good model fit and verifies the model accuracy.
Table 4 displays the regression coefficients and validation indicators including the standard error (S.E.), critical ratio (C.R.) and p-value for all the direct paths in the causal path diagram. Most of the direct relationships between variables are strongly significant (p < 0.001). Specifically, urban expansion has a significant direct negative relation with both road compactness and land use compactness, and the relation with land compactness is slightly greater than that with road compactness. The direct relationships between the five endogenous variables and both land use compactness and road compactness also display strong significance, and because we standardized both positive and negative variables before we ran the model, all endogenous variables are positively related to urban compactness. The results above suggest that regions that experienced the rapid expansion of urban land tended to experience a more sprawling development, forming large blocks that lack street connections, and having more areas of bare land. In addition, we found that road compactness is significantly positively related to the SAR, which indicates that areas with small and well-connected blocks are more likely to enjoy better address quality than other areas. It should also be noted that although land use compactness also has a positive relationship with the SAR, the relationship between these two variables is not significant (p = 0.330 > 0.05).
Estimated coefficients, standard error (S.E.), critical ratio (C.R.) and p-values for the direct paths in SEM.
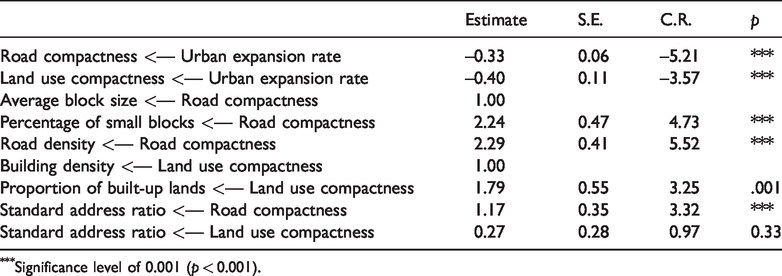
Significance level of 0.001 (p < 0.001).
Table 5 indicates the direct, indirect, and total effects of urban compactness and urban expansion on the address quality. Urban compactness generally has a positive effect on the address quality and compared to that of land use compactness, road compactness has a stronger direct effect on the address quality. In addition, by mediating urban compactness variables, rapid urban expansion has a negative indirect effect on address quality, which suggests that rapid urban expansion does lead to poorer address quality in the new urban areas.
Direct, indirect and total effects of endogenous and exogenous variables on urban address quality.

Discussion
Standard address data are an essential element of multiple GIS (geographic information system) applications and can help identify the geographical locations. Although there have been multiple efforts to improve the address quality in China, spatial disparities in address quality are still existent in many cities. In this context, this study contributes to filling the research gap related to the spatial pattern of address quality in China as well as its potential causes. In this paper, we discover an uneven spatial pattern of address quality in urban areas and investigate the corresponding relationship with rapid urban expansion. In a case study of Shenzhen, China, we analyze the spatial pattern of address quality using spatial autocorrelation analysis and identify how rapid urban expansion in China can impact address quality using SEM. The results indicate a poor address quality in the new urban areas of Shenzhen and reveal that this is because of the sprawling urban form resulting from rapid urban expansion. Furthermore, the results also signify that a road network system with good accessibility may be of greater significance than a dense land use system to improve the address quality.
Road compactness is closely related to block size because the roads form the boundaries of urban blocks (Vanderhaegen and Canters, 2017). For the regions with a high road compactness, small blocks are usually present, and the length of each side of a block is relatively short. In this situation, the buildings in a block are usually aligned along the four edges, and this pattern is more likely to generate orderly building groups (Katz et al., 1994). Because the address data are generally associated with buildings, the management of addresses is generally efficient with this approach, and it is easier for planners to add, delete, and update new addresses. Therefore, the allocation of addresses could be more consistent and meet the relevant address standards. For regions with a low road compactness, however, there is generally a prevalence of large blocks, or even superblocks, with each side over 1 km and buildings randomly scattered within them (Lu et al., 2016; Wolff et al., 2017). In this case, the building numbers are allocated randomly, and the address quality is often poor.
There might be two main reasons for the formation of large blocks during rapid urban expansion in China. One major cause is the poor planning of road networks in new urban areas. Previous research found that since the Chinese Economic Reform, core cities in China are now experiencing increasingly rapid urban expansion, and the expansion is often extensive and sprawling (Chen et al., 2008). The sprawling development characterized by scattered and low-density urbanization has resulted in a poorly accessible road network system in the new urban areas, where roads are difficult to enclose (Gao et al., 2019; Zhao et al., 2010). In these areas, large and irregular blocks are often generated.
Specifically, in China, in addition to inappropriate transportation planning, there is another possible reason for the large blocks that result from the rapid urban expansion. Since the land reform in the late 1970s, China has established a dual land ownership system consisting of state-owned urban lands and collective-owned rural lands (Zhang and Xu, 2016). The urban expansion process transforms rural agricultural lands into urban built-up lands, which are monopolized by local governments (Lin and Ho, 2005). In developed countries, with the private ownership of lands, land parcels that are sold are generally of small size, even in areas of relatively rapid urban expansion. In China, however, it is more common for local governments to sell large parcels to developers to accelerate the urbanization process, which might lead to huge blocks in new urban areas (Liu et al., 2014). The regions with relatively low expansion rates in a city are more likely to be highly developed areas (such as the Futian and Luohu districts in Shenzhen), where agricultural lands are limited, and the land parcels for sale are relatively small and fragmented. In these regions, small blocks are more likely to be generated when new expansion occurs.
Conclusions
This study examined the spatial pattern of address quality in Shenzhen, China, and an attempt was made to identify the potential causal paths between the rapid urban expansion and the address quality using SEM. The results suggest that the geographical disparities in address quality in Shenzhen are distinct and that the address quality is negatively correlated with the urban expansion rate. Due to unplanned transportation development and extensive land use policies in China, rapid urban expansion might be responsible for the large block size in new urban areas and would consequently impede the generation of standard addresses in these regions. In this case, to eliminate the spatial disparity of address quality in China, a country currently experiencing massive urban expansion, more attention should be paid to the optimization of the urban form: urban planners should consider a system of small and dense blocks to facilitate the allocation and updating of addresses in the urban expansion process. A road network system with high connectivity and accessibility should be adopted, and local governments should be responsible for restricting the size of each land parcel for sales to developers.
However, there are some limitations of this study. First, we only considered the land expansion from an urban perspective, and several other factors (e.g., the population) that may reflect the magnitude of urban expansion were not examined. Second, because the registration of rural addresses is different from that of urban addresses, we only discuss the spatial pattern of urban addresses in this paper and do not consider the rural addresses. Therefore, in the future, we aim to integrate demographic data and further explore the links between address quality and urban expansion in subsequent studies. In addition, efforts will be made to extend this research from urban addresses to rural addresses.
Footnotes
Acknowledgements
The authors acknowledge Qingyun Du, Tao Liu, and Xuesong Kong for their valuable suggestions on the revisions of this article. The authors also appreciate the insightful comments from the editor, Daniel Arribas-Bel, and all the anonymous reviewers.
Declaration of conflicting interests
The author(s) declared no potential conflicts of interest with respect to the research, authorship, and/or publication of this article.
Funding
The author(s) disclosed receipt of the following financial support for the research, authorship, and/or publication of this article: This article was supported by the National Key Research and Development Program of China (2017YFB0503500).
