



Abstract
New mobility services that facilitate multimodal options are important for strategic urban transport systems planning. Part of this strategy is municipal investment in urban mobility hubs to increase access to mobility services. We present a new evaluation framework and algorthim to locate and assess the sustainability and equity impacts of hubs in cities. Scenarios are used to evaluate hub investment strategies in different cities that prioritize (1) current mode split, (2) high transit capacity, and (3) multimodal services. From an equity perspective, high transit capacity and multimodal hub strategies include more low-income areas than current mode split, which covers middle-income areas most. Travel times to access the nearest hub in Portland by low-income households is ∼20–40 min compared to high-income households requiring ∼25–30 min. Seattle and Vancouver perform better requiring ∼15–20 min for low-income compared to ∼25–35 min for high-income households. Multimodal hubs are the most efficient requiring ∼15–20 minutes to reach compared to ∼15–30 minutes for high capacity and current mode split scenarios. From a sustainability perspective, ∼10%–50% of the population cannot reach a hub within 30 minutes by public transit compared to <10% by car, and travel time to reach the nearest hub in all three cities by car is <20 min compared to ∼20–40 min by public transit. Between all cities, low-income households representing ∼2%–15% of the total population have no access to a hub by public transit within 30 min compared to high-income households representing ∼1%–3% of the total population. Only in Portland are there low-income households not able to reach a hub by car, and in each city, all high-income households can reach at least one hub by car within 30 min. Our results show how municipalities can strategically invest in public transit and multimodal options to increase the frequency, quality, and overall mobility for low- and medium-income households and improve access to essential amenities for more vulnerable citizens. Municipalities can use our hub evaluation framework to explore alternative transport investment scenarios and spatially locate urban hubs to meet future travel demand, increase adoption of multimodal services, and improve equitable access for all citizens.
Introduction
A fundamental challenge for urban planning is transitioning people away from private car use and encouraging adoption of cleaner alternative transport modes. With shorter distances in cities, improved public transit, and new mobility services, people are increasingly combining car sharing, transit, cycling, and walking to meet individual travel needs. This flexible use and combination of different transport modes is known as multimodality (Dacko and Spalteholz, 2014). Multimodal transport systems characterized by new investments (public transit), business models (ridesharing), and technologies (autonomous vehicles) are challenging existing transport planning practices. Cities are now trialing new ways to improve multimodality by integrating services (ticketing), information (journey planning), and infrastructure design (physical access) (Monzón et al., 2016). While public authorities promote multimodality as a key part of their urban mobility strategy, the benefits for the public and transport operators have barely been investigated (Ambrosino et al., 2016). Importantly, there is poor understanding of the factors and conditions that encourage multimodal transport use, thereby limiting design improvements of these systems (Gebhardt et al., 2016). These new multimodal ways of traveling are widely available in many cities, but transport planning evaluation frameworks (Ambrosino and Sciomachen, 2006) and modeling have not kept up with these rapid changes (Botea et al., 2013). This can result in ineffective deployment of new mobility services, causing continued reliance on private vehicle use, leading to more congestion and environmental impacts.
New planning strategies for urban mobility hubs
As cities expand or are built, a structured approach is often taken with increasing density around transport hubs such as major rail stations. Colocating multiple transport services and facilities in this way is theorized to improve efficiency and thus reduce travel times (Danilina and Teplova, 2018). As transportation services, infrastructure, and amenities are evolving rapidly, mobility hubs present an opportunity to integrate different sustainable transportation options to enhance connectivity across a region. Hubs can provide travelers with access to local and regional transit and support higher density, mixed use land development (Monzón et al., 2016). Moreover, as cities aim to protect the environment and support sustainable transportation choices, mobility hubs have the potential to become a catalyst to prioritize low-emission transportation options that support existing regional planning goals. The hub concept has become an important pillar in the mobility strategies of many municipalities around the world. Thus, public authorities view hubs as an opportunity to further invest and increase multimodal options as a key part of their overall mobility strategy. Municipalities are now seeking new strategies to improve the design of multimodal urban hubs to achieve more seamless interconnections and improve the overall travel experience (Behrends, 2012).
Advanced simulation and data-driven methods have focused on multiple challenges arising from new mobility services including transportation network representation, traffic flow forecasting, traffic signal control, and autonomous vehicle impacts (Nguyen et al., 2018). However, an important aspect of transport infrastructure that has not been comprehensively studied is the impact of urban mobility hubs on network connectivity and accessibility. Hubs can be billion-dollar capital projects making it critical to plan and design for seamless integration of public and private mobility services while enhancing user experience. However, ineffective siting, design, and operations of hubs has resulted in underutilized services and stranded assets costing tax payers millions of dollars (Jonuschat et al., 2015). There are also critical gaps in our knowledge of the long-term accessibility and economic and environmental impacts of urban hubs (Farhani et al., 2013).
Yet limited work has been done on developing decision support tools for planning urban mobility hubs (Chow and Djavadian, 2015). There are important gaps in our understanding of how to site, design, and evaluate the functional and investment performance of urban hubs. This knowledge is also important to guide urban policy goals to accelerate adoption of sustainable transport modes and improve mobility for all citizens especially the most disadvantaged. There is need for new planning tools and models to spatially locate existing hubs, assess potential sites to build new hubs and explore alternative policy and investment strategies such as expanding transit ridership capacity, or prioritizing multimodal options, and develop multicriteria performance metrics to assess the performance of hubs over time.
Complex networks for multicriteria evaluation of urban hubs
The research field of complex networks based on statistical physics and driven by the explosion of new data focuses on the structure, dynamics, and functioning of large-scale networks. Continuing research indicates that complex networks can be complimentary to existing engineering methods such as flow routing and optimization typically based on transport costs (Ducruet and Lugo, 2013). For example, Barthelemy and Flammini (2006) demonstrated early on the potential of network theory for transit network optimization, with complimentary work by Derrible and Kennedy (2010). Zhong et al. (2014) used movement data to identify travel patterns and urban spatial structure to detect hubs and centers of socioeconomic activity in Singapore, while Ding et al. (2018) used multilayered networks to assess the growth in urban traffic focusing on the spatial distribution and clustering of vehicle use. Additional studies have deployed complex network theory to understand urban traffic network management (De Montis et al., 2007), road congestion (Holme, 2003; Tan et al., 2014), evaluate potential areas for future transport land investment (Li et al., 2015), and understand the change and impact of travel behavior (Wu et al., 2017).
Conventional transport models abstract from the transport network to estimate vehicle flows and then load flows back onto the network to assess fleet operations, but dynamical changes to the network itself have not been extensively analyzed in transportation modeling (Ducruet and Lugo, 2013). Urban hubs will likely impact the structure and functioning of the overall transport network, yet there has been limited research on this in urban transport planning. The hub location problem (HLP) is a relatively new extension of classical facility location analysis and not typically addressed in urban transportation models. The HLP was originally posed by O’Kelly (1992) and has since been refined with various techniques. HLPs are typically analyzed by mathematical optimization generally focused on profit maximization or cost minimization. A comprehensive review by Farhani et al. (2013) indicates that multicriteria decision making has not been considered extensively in previous studies. Specifically, the authors indicate that assessing the social and environmental impacts of hubs in addition to economic concerns is an important future area of research.
The importance of highly connected hub nodes for network function has been confirmed by many studies and can be seen in a large variety of networks (biological, social, and technical) (Wise et al., 2017). Analysis has also focused on the structure of highly connected hub nodes for transport networks including airline networks and freight shipping, but limited research has been done on urban transport hubs (Farhani et al., 2013). There is considerable opportunity for complex network theory to further inform transportation planning especially in the context of urban mobility hubs, which due to increasing availability of extensive geospatial asset data can be readily analyzed with network statistics. The aim of this paper is to present a novel methodological framework for planning multimodal urban transport hubs. Specifically, we leverage new data science and complex network theory for (1) geographical siting and (2) multicriteria evaluation of urban mobility hubs. We demonstrate the transferability of the methodology by applying it to Vancouver, Seattle, and Portland, the three largest cities in the Cascadia Corridor located in the Pacific Northwest America.
Theory and methods
Mobility hub data evaluation framework
For this study, we define accessibility as a function with which a hub can be reached and measured by travel time, location, and mode. Equity and inclusivity are then evaluated based on different levels of access based on household income. We focus on access to transportation hubs recognizing the fundamental role that mobility has for reaching essential services (healthcare) and socioeconomic opportunities (jobs, education), which in turn influence quality of life for people in the city. Access to transport hubs is based on three categories: (1) private passenger vehicle, given the prevalence in North America, (2) public transit (bus, rail, tram combined with walking) since many specific population segments (seniors, youth, low-income households, etc.) rely on these options, and (3) new multimodal services (bike and car share) since these are considered more sustainable modes of transport. Figure 1 summarizes the data integration framework and workflow used in this study.
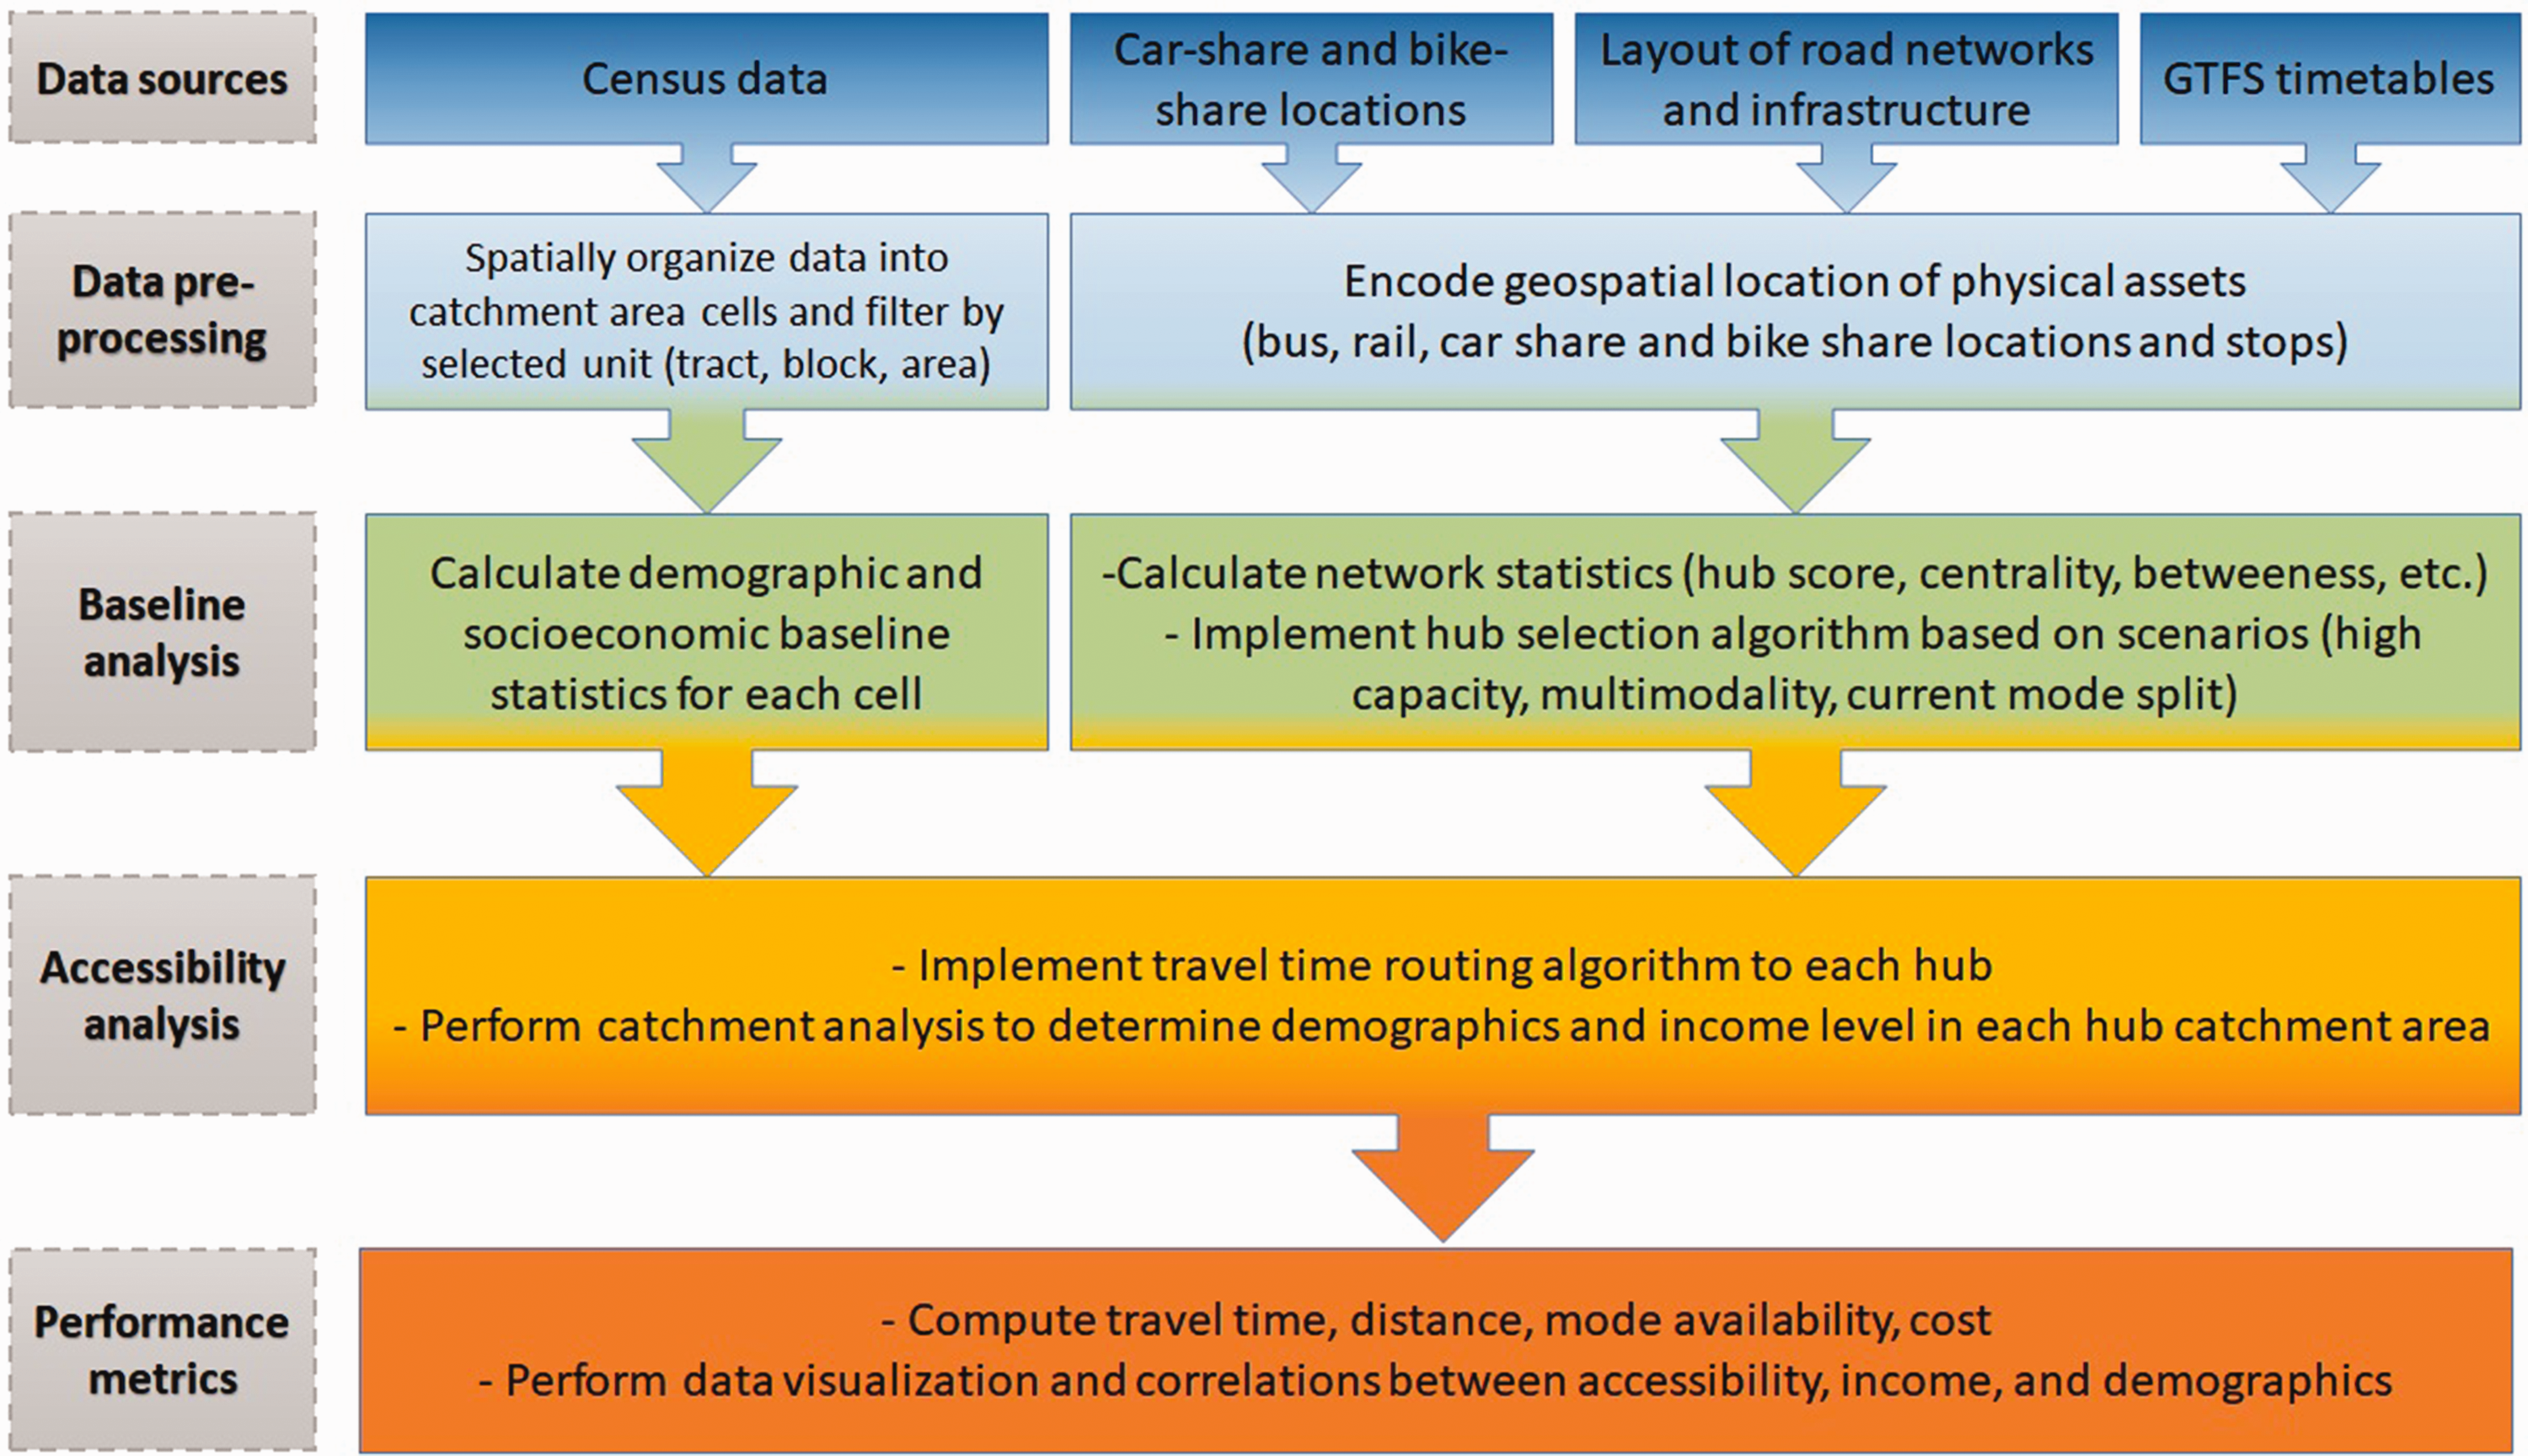
Mobility hub data integration framework and evaluation workflow to assess the links between physical transport network properties, accessibility to transportation hubs, and sociodemographic and income distribution in cities. Note: transport cost analysis has not been included in the current work, but data collection is underway and will be part of follow-up research.
Data sources and preprocessing
The cities of Vancouver, Seattle, and Portland have been selected as case studies due to similar populations and transport demand profiles but differing geographic areas and urban morphologies that influence each city’s transport network characteristics and performance including mean commute times and distances (Supplementary Table 1). Data preprocessing included spatially organizing socioeconomic and demographic data into catchment area cells that were filtered by the smallest geographic census unit for each city and geospatially encoding and mapping all physical networks and asset data for each city. These data formed the basis for (1) calculation of network statistics, (2) implementing a new hub selection algorithm, and (3) performing catchment area analysis based on executing a door-to-door routing algorithm to compute travel times to hubs. A complete description of data sources and data preprocessing is provided in Supplementary Materials.
Data analysis
Calculating network statistics
Transportation systems are commonly represented using networks as an analogy for their structure and flows and belong to the broader category of spatial networks because their design and evolution are physically constrained. A transport network can represent physical links (e.g. roads, rail, and canals) or scheduled services (e.g. airline, public transit, train). It can be extended and abstracted to cover various types of links and services along which mobility occurs. The technical and economic performance of a network is often related to its connectivity (Rodrigue and Ducruet, 2020). We can formally define an undirected graph G as consisting of the set of nodes N and the set of edges E, which are unordered pairs of elements of N as follows

The formal definition of a directed graph is similar, and the only difference is that the set E contains ordered pairs of elements of N. In network science, an unweighted network of N nodes without multiple connections can be represented by an N × N adjacency matrix A, where the component

Among the simplest measures to assess the structure of a network is the degree of the node which measures how many connections the node has, where the degree k of a node i is the number of edges E connected to the node. In terms of the adjacency matrix A, the degree for a node indexed by i in an undirected network is



The total degree of the node is the sum of its in- and out-degree

We can obtain further insight into the network structure by counting how many nodes i have each degree k, which is the degree distribution

Real-world networks usually have very different degree distributions, where most nodes have a relatively small degree, but a few nodes can have very large degree k. These large-degree nodes are often referred to as hubs. In the context of a network, a hub is a node with a large degree, meaning it has connections to many other nodes. The presence of hubs gives a long tail degree distribution and can be explained by scale-free networks with a power-law degree distribution following Barabasi and Albert (1999)

For transport networks, connecting airports and train stations with many connections or scheduled services to many other nodes are hubs. To compute the network hub theory for multimodal transport networks, we use the HITS (Hyperlinked-Induced Topic Search) algorithm implemented in R following Kleinberg (1998). The HITS algorithm was initially used to examine web pages, where hubs were expected to contain catalogs with a large number of outgoing links, and authorities would get many incoming links from hubs, presumably because of their high-quality relevant information. The HITS algorithm is implemented by the authority vector,



The initial values of the iterations are
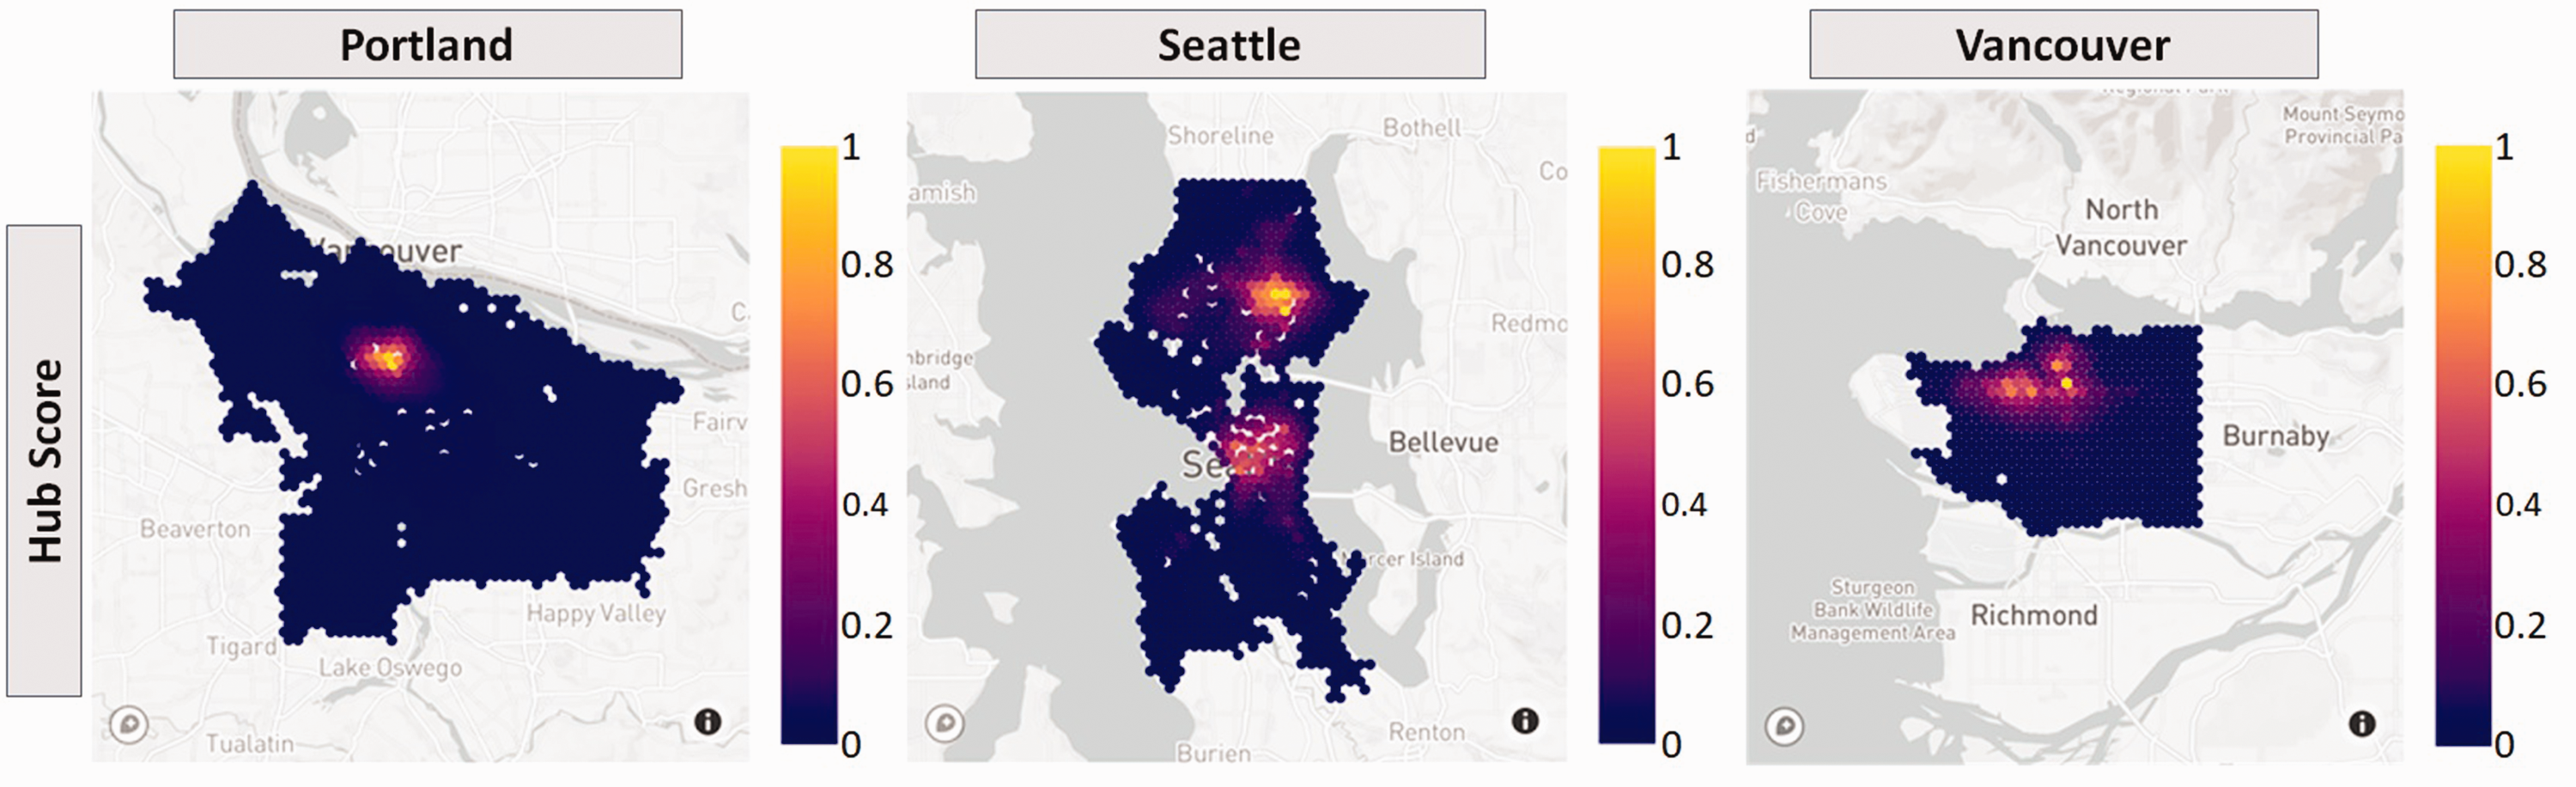
Baseline analysis of network hub scores for public transit networks for each city. Higher values between 0 and 1 are increasing hub scores representing higher transit connectivity. Note this does not include multimodal options such as car and bike share availability.
Implementing a hub selection algorithm: Computing hub scores and scenarios
Using the network statistics (number of links, hub scores) as data input for transit nodes, our final selection of transportation hubs was defined using a clustering approach that combines all multimodal (car and bike share) transportation options: First, using the OpenstreetMap (2019) dataset, we calculated a matrix of distances from every transit/bike/car station to every other in each city. Second, we clustered all the data points according to their relative distances using a hierarchical clustering approach using the R “hclust” function based on the Ward (1963) method and implementation code by Wishart (1969) and Murtagh (1985). The resulting dendrogram shown in Supplementary Figure 1 was then cut to a specified height of 175 m, which corresponds to a circular buffer of 350 m which specifies the maximum distance a user would have to walk between two stations belonging to the same cluster. This equates to ∼5 minutes at normal adult walking pace. Third, we calculated centroids for each individual cluster based on the arithmetic mean of their constituent stations. Sensitivity analysis was performed by varying the dendrogram cutoff height from 100 m to 300 m, where the vast majority of patterns identified in each city were robust to our chosen distance of 175 m.
After the clusters were identified, we performed a capacity weighting and score normalization procedure to identify 10 “transportation hubs” in each city. For this study, we selected 10 hubs assuming this would provide sufficient geographical coverage and allow for a diversity in the types of hubs that could emerge (i.e. some with high public transit throughput, and others with a high contribution from bike and car share facilities). The absence of a hub also highlights areas in a city that currently have poor accessibility to hub transport options.
The weighting for each hub scenario is based on a normalized capacity score where the total number of incoming and outgoing transit links, car and bike share slots are counted in each cluster (node degree). Transit links were merged into a single score by weighting each transit mode by the average theoretical capacity stated on the websites of the regional transit operators (TriMet, King County Metro, and Translink): 400 passengers per subway train, 140 per tram, and 50 passengers per bus. We currently use theoretical capacity because actual usage figures are proprietary to the transit operators. Ideally, the capacity weighting would be based on actual boardings for each mode in each hub but can be included in future work. Two-way streets and single-occupancy use was assumed for bike and car share options since we do not have actual ridership data, but passenger counts could be included in future work as more data becomes available.
Therefore, each transport mode

The score for each transportation mode was normalized by dividing it by the highest score Max that occurred in any individual cluster, denoted as a hub H in each city (i.e. giving a score between 0 and 1). Therefore, the normalized score for each transportation mode is

A total normalized score

The weighting between these three modal categories allows us to prioritize different transport options in our selection of a hub, where, for example, a cluster that has high public transit connectivity but no car or bike share options can only score a maximum 1 out of 3, thereby prioritizing hubs that have multimodal options. An example calculation of our hub selection algorithm is provided in Supplementary Figure 2.
The hub scores were then ranked for each city, and we selected the top 10 as the final transportation hubs for each city. The latitude and longitude of the hub centroids were used as destinations when constructing origin-destination (O-D) matrices for our catchment analysis. By changing the weighting to prioritize specific modes, the hub selection algorithm allows us to develop policy scenarios to evaluate trade-offs between different transport investment strategies that cities may pursue. The top 10 hubs in each city were selected for the following three scenarios: (1) High capacity—select top 10 hubs weighted for highest possible theoretical capacity; we expect this to be dominated by existing high-capacity public transit; (2) Multimodality—select top 10 hubs weighted for prioritization of multimodality, where a hub is selected based on the occurrence of multiple modes including all forms of public transit, car share, and bike share; (3) Mode split—select top 10 hubs using a weighting that reflects the mode split as a proxy for current usage patterns in each city. For this scenario after the scores for each transportation mode were normalized, the scores were weighted by multiplying them with the mode share of commuting trips in each city, without the contribution of private vehicles and walking to the most split. This allows us to give more or less importance to each mode depending on how often it is used by commuters in each city. See Supplementary Table 2 for mode split data.
Catchment analysis and travel time calculations
Catchment area analysis is based on determining the number and sociodemographic makeup of households and their travel times to reach the nearest hub. This is done by computing the latitudes and longitudes of the centroid for each census unit (Census Block for Portland and Seattle, and Dissemination Area for Vancouver) used as origin cells and hub centroids used as destination cells forming an O-D matrix. Travel time estimates for all combinations of driving or public transit plus walking were computed between every pair of grid cells of the O-D matrix using OpenTripPlanner (2017), an open-source routing engine called within the travel time matrix algorithm of Pereira (2017). The OpenTripPlanner routing engine does not account for traffic congestion levels, but these could be incorporated into the methodology in the future using GPS data (e.g. Wessel et al., 2017).
To calculate the number of residents who can theoretically access a hub facility, we applied a cumulative opportunity measure (Wachs and Kumagai, 1973), which estimates active accessibility from the perspective of the origin cell, in this case, the number of households in a census unit that can reach a hub within a predefined travel time threshold. Active accessibility for each census unit origin cell (for a total


An important limitation of the cumulative opportunity measure is that it relies on defining arbitrary time thresholds for access to a service, which can vary depending on travel mode, socioeconomic status, and lifestyle factors (Neutens et al., 2010). For simplicity, we chose a time threshold of 30 minutes for this study, which aligns with various metropolitan transport plans that use time thresholds of 30–40 minutes when considering accessibility to other essential serves such as hospitals via public transit (Boisjoly and El-Geneidy, 2017). However, our framework will allow for multiple time thresholds to be considered in future research. The time of day for which the O-D matrices are calculated is also important to consider, because service levels and transit departure times vary throughout the data. While Pereira (2019) calculated average travel time matrices based on travel at regular intervals throughout the day, Boisjoly and El-Geneidy (2017) showed that calculating accessibility for travel at 8 a.m. only was a reliable indicator of relative accessibility at other times in Toronto. Given our study examines accessibility to hubs, we consider Boisjoly and El-Geneidy’s (2017) single-time approach to reliably reflect commuting dynamics in our study cities. We therefore calculated door-to-door travel times as beginning a journey at 8 a.m. on a typical working day (Tuesday, 19 September 2017). Another important limitation is that there is evidence that people’s usage of public transportation is shaped by factors such as affordability (El-Geneidy et al., 2016), gender (Akyelken, 2017), age (Ryan et al., 2015), and physical disability (Casas, 2007). We did not explicitly consider these factors in our accessibility analysis due to data limitations and the scope of our study, which we acknowledge does not account for accessibility inequality in its fullest extent (Neutens et al., 2010).
Results and discussion
Figure 3 shows the results for Portland, Seattle, and Vancouver. The top 10 hubs for each city are overlain on top of the socioeconomic data layer indicating low (blue), medium (purple), and high (pink) income areas for each city. A first observation is that each scenario results in different hub locations in terms of distances between hubs and overall spatial patterns, which has important implications for which households can access different transport options. In Portland and Seattle, hub scenarios that prioritize high capacity and current mode split have similar locations (Panels a, b, g, h) that are centrally concentrated in the city compared to a multimodal hub scenario (Panels d, e) that have greater spatial coverage and able to reach a higher number and diversity of households.
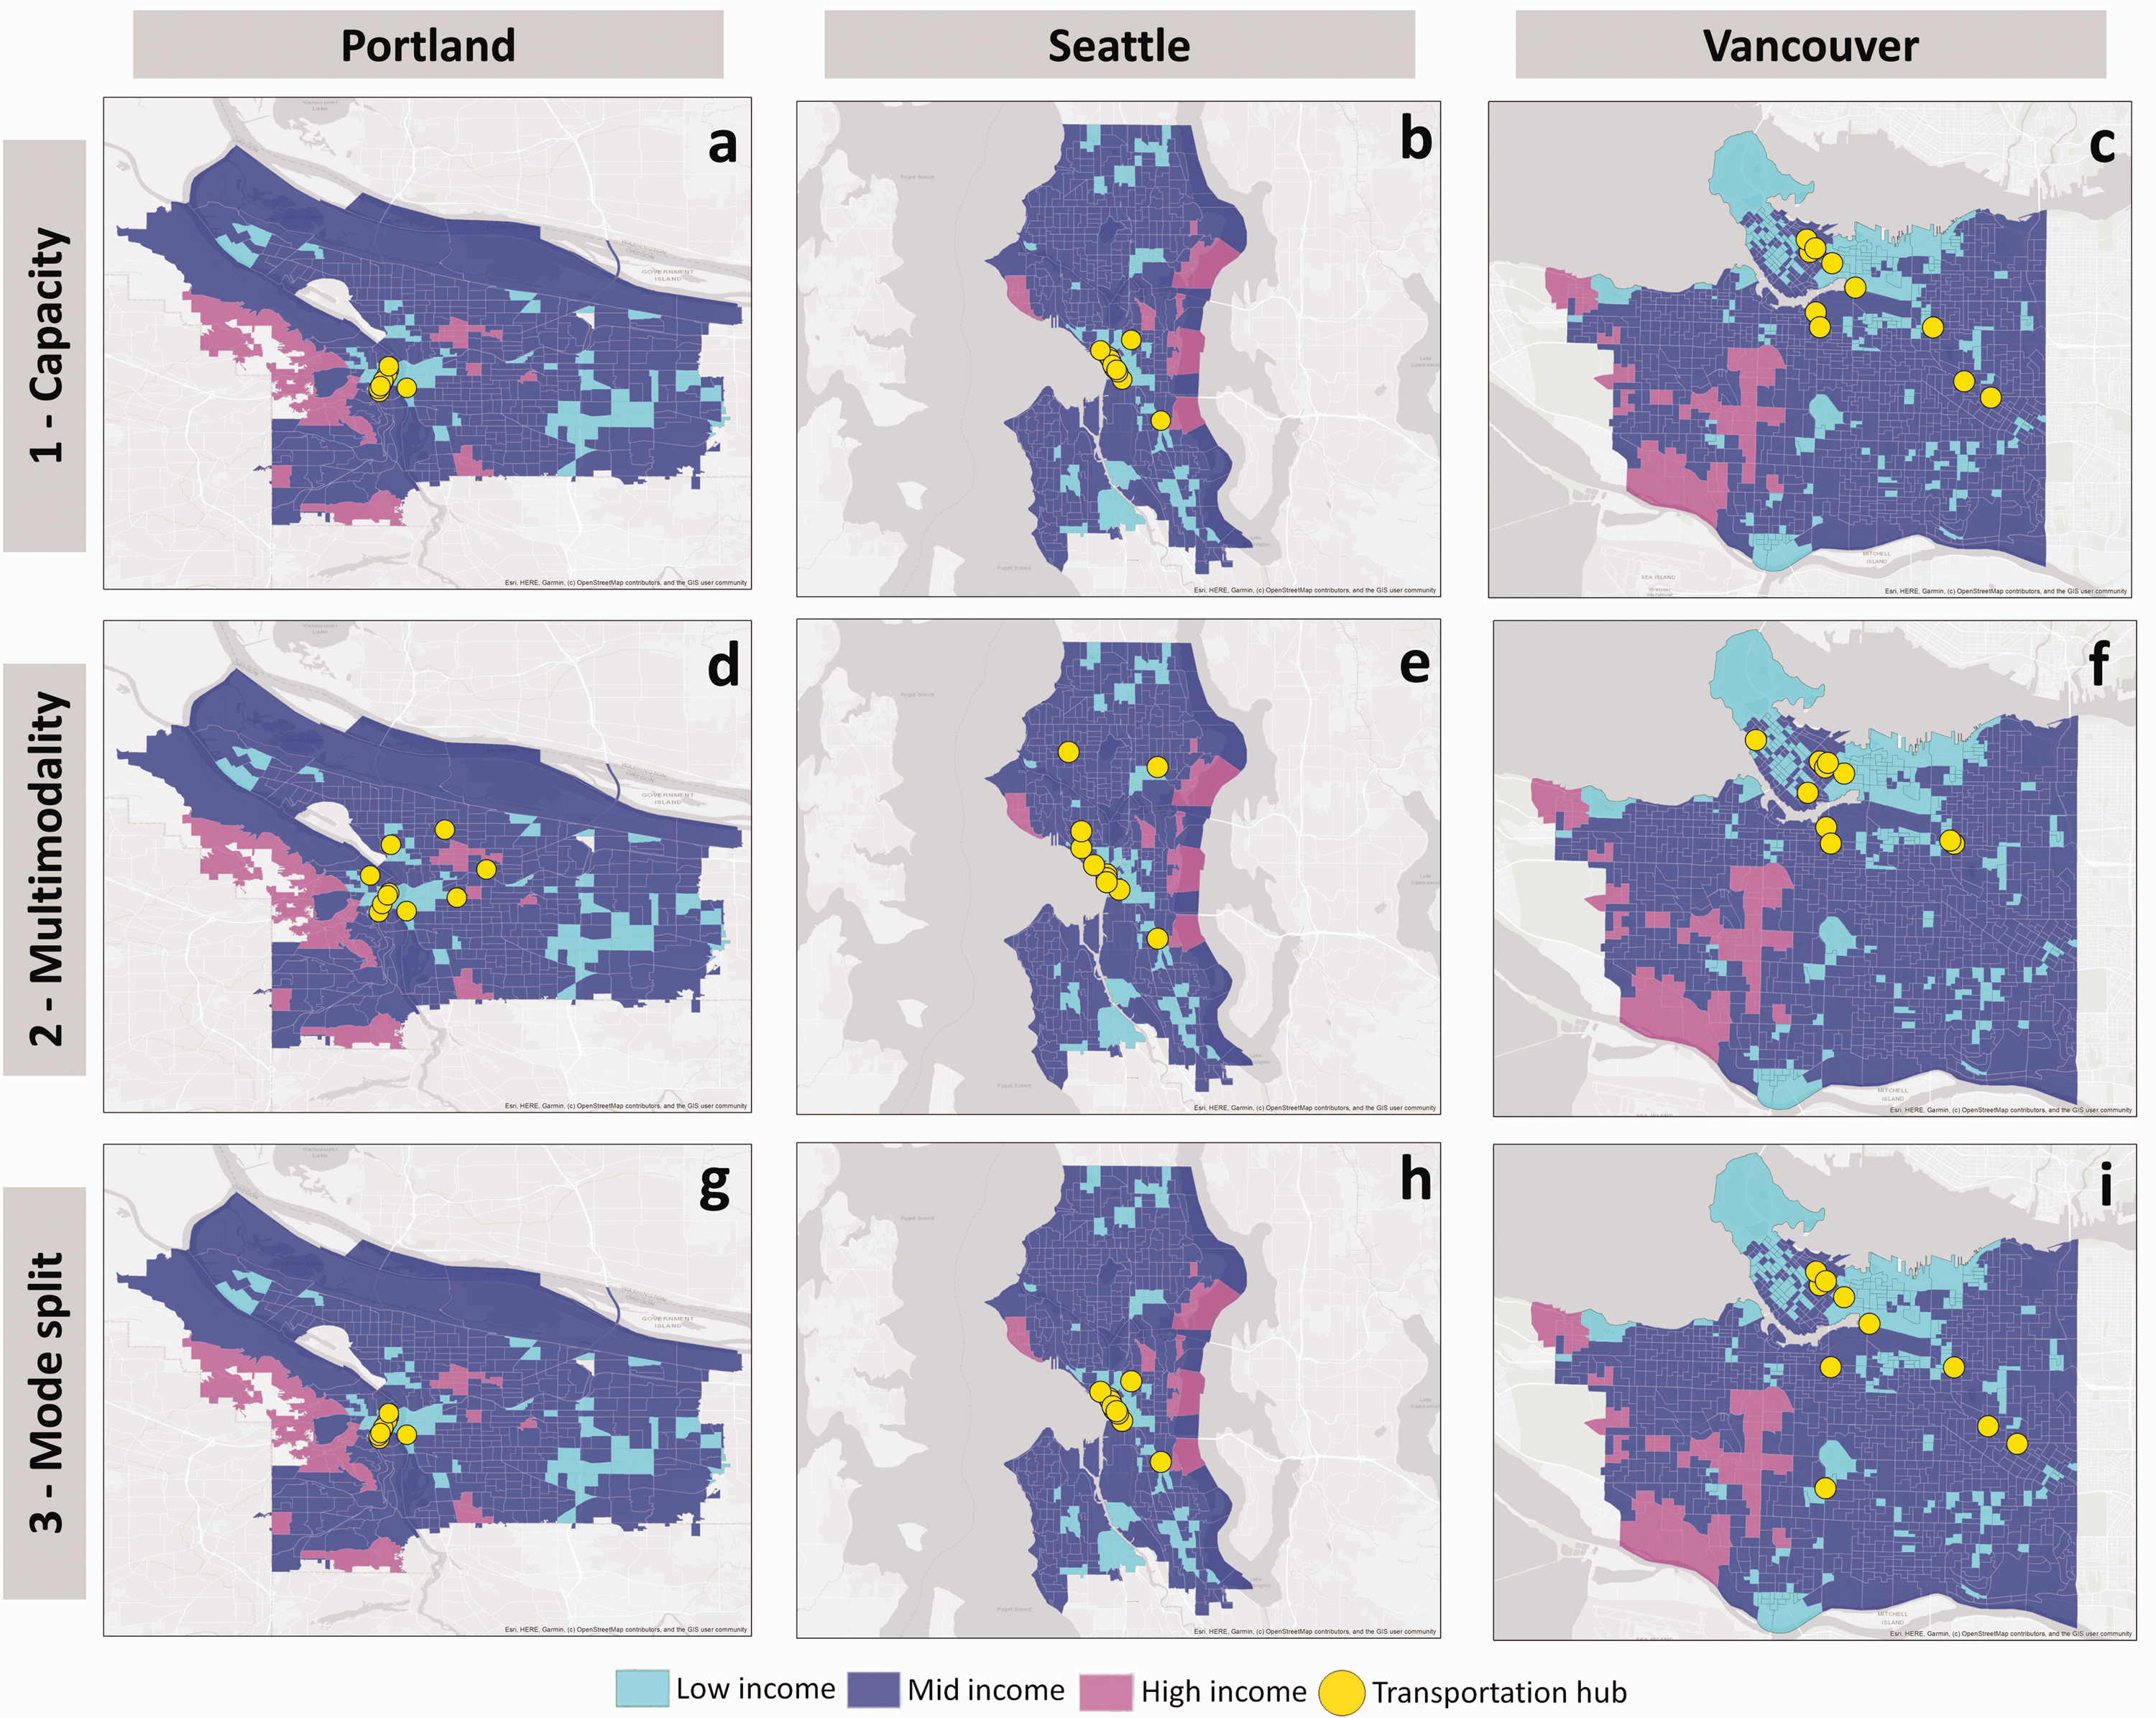
Hub scenarios for Portland, Seattle, and Vancouver based on high capacity which favors mass transit options (Scenario 1), multimodality which gives equal weighting to public transit and car and bike share availability (Scenario 2), and mode split which reflects current transport usage patterns in each city (Scenario 3). Note: Median income for each census unit is used and converted to local currency in 2019 and income bandings (high, medium, low) based on Canada and U.S. Statistics (see Supplementary Materials).
Conversely, in Vancouver, an investment strategy that prioritizes multimodal hubs (Panel f) has less spatial coverage compared to high capacity (Panel c) and mode split (Panel i), thereby excluding large areas of the city. In Vancouver, there are also less multimodal hubs in medium-income neighborhoods, which typically have the highest number of potential early adopters of new mobility services (Axsen and Sovacool, 2019). Therefore, the current location of multimodal hubs and lack of coverage to potential early adopters does not support Vancouver’s current policy to increase adoption of multimodal services. Interestingly, the prioritization of current mode split results in a single hub in south central Vancouver that provides access to a large area of the city with limited multimodal options. This hub is also in close proximity to a large cluster of lower income households in the south that currently have limited transit services.
From an equity perspective, across all hub scenarios, the best overall coverage of low-income areas is in Portland (18 hubs) and Vancouver (18 hubs) followed by Seattle (14 hubs). For low-income households, the high capacity (21 hubs) and multimodal (22 hubs) scenarios are more equitable than the mode split (7 hubs) scenario which represents the current baseline conditions in each city. However, for middle-income households, current mode split (23 hubs) performs the best. The location of hubs has important impacts on low-income households since they tend to rely more on nonprivate vehicle use to access jobs and other essential services (Clewlow and Mishra, 2017). Differential access to mobility hubs also has important implications for municipal transport planning, because currently there are gaps in our understanding of how people access hubs from varying distances where “first mile/last mile” transport options can be highly variable. In particular, transport authorities are exploring how to improve access to last mile transport options, which are less frequent, more expensive, and are often relied upon by lower income families that cannot afford to live closer to urban centers (Boarnet et al., 2017). Our current analysis does not explicitly account for households using car and bike share as access/egress modes but could be considered in future work. Our results can provide policy direction for each city on how to strategically locate and invest in current and future mobility hubs that can improve overall accessibility while also evaluating trade-offs between alternative transport investment scenarios.
Another important equity measure for locating hubs in each city is the overall travel time to the nearest hub as a function of household income. Figure 4 shows travel time trends for each city correlated to median household income for each scenario. Here, we assess the trends based on low-income defined as $0–50k, medium income as $50k–$75k, and high income as $100k–$150k (Figure 4, right panel). Results indicate that overall the best performing scenario is multimodal hubs requiring on average ∼15–20 minutes to reach compared to ∼15–30 minutes for high capacity and current mode split scenarios. However, there are important travel time differences between cities and income groups. For example, across all three scenarios, low-income households in Portland require ∼20–40 minutes to reach the nearest hub compared to their high-income counterparts requiring ∼25–30 minutes. Conversely, in Seattle and Vancouver, low-income households fare better requiring ∼15–20 minutes compared to their high-income counterparts requiring ∼25–35 minutes to reach the nearest hub. This is promising for municipalities indicating the potential to expand and improve multimodal hub services without negatively affecting overall travel time on the network while also targeting investments in low- and medium-income neighborhoods, thereby reaching a larger market and potentially meeting untapped demand.
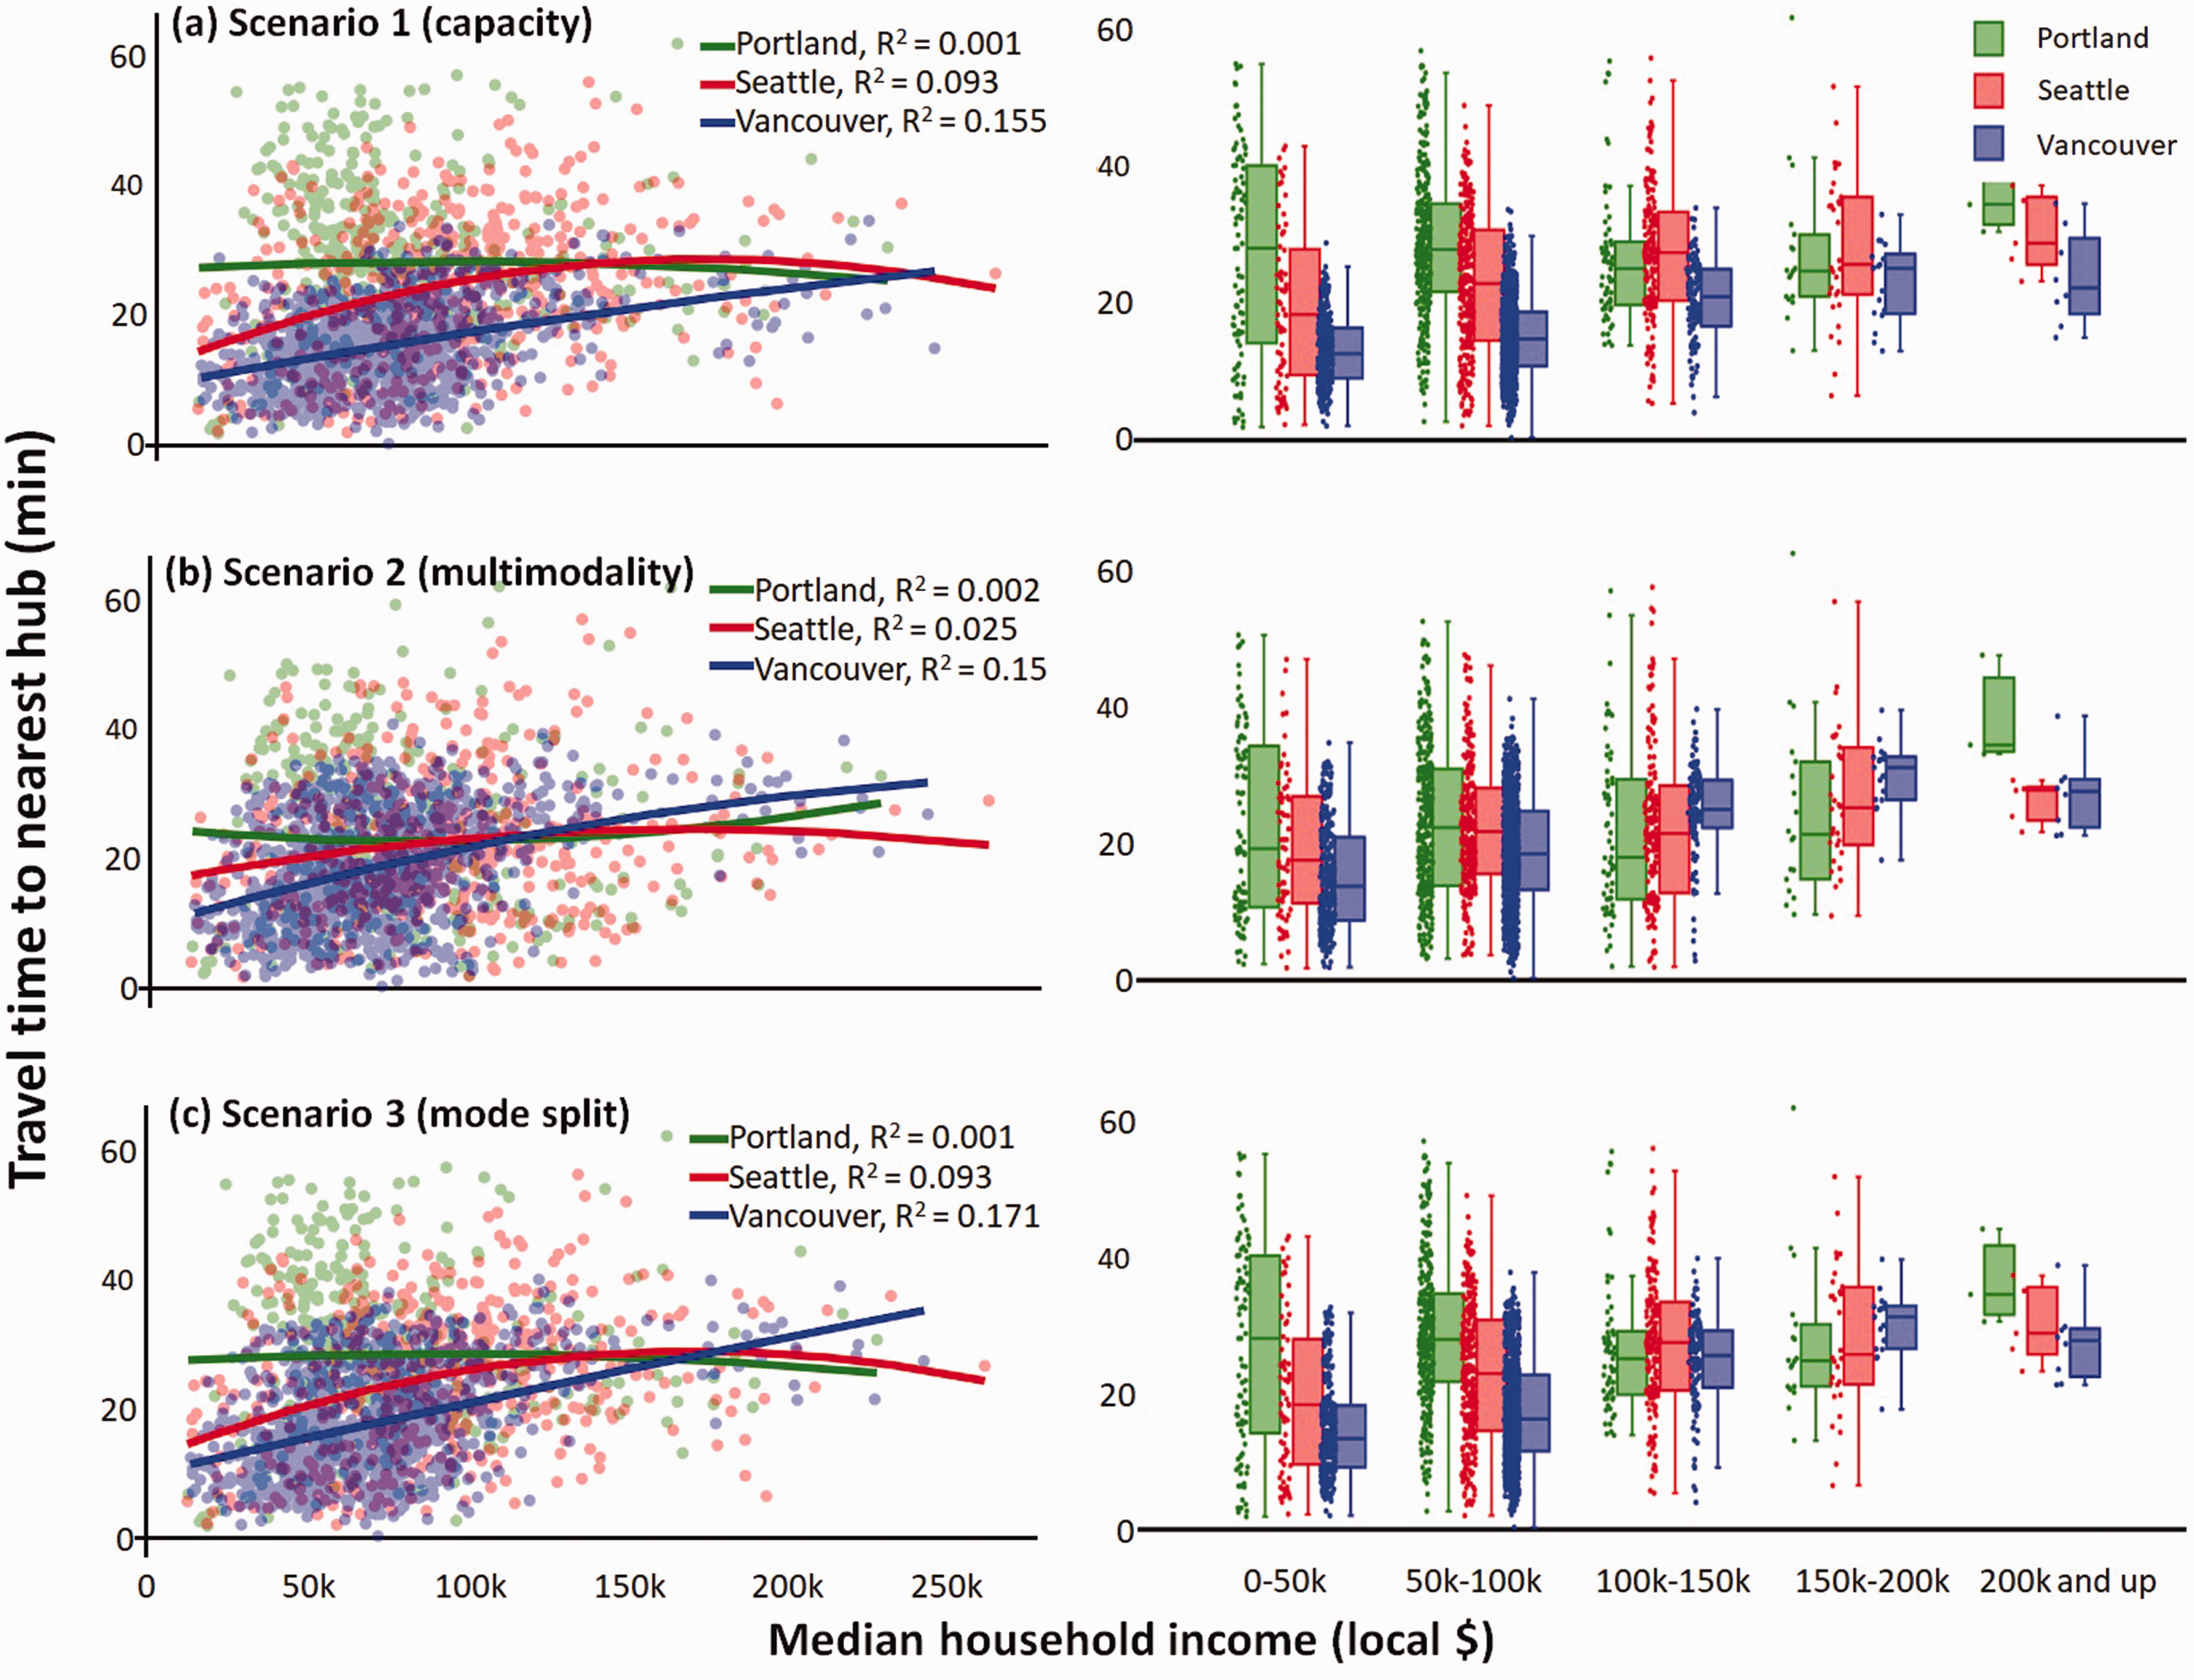
Correlations (left panel) and boxplots (right panel) showing trend lines and median travel times for transit and/or walking versus household income for each hub scenario in Portland, Seattle, and Vancouver. Incomes have been converted to local currency in 2019 for comparative purposes.
From a sustainability perspective, we compare access to hubs from public transit versus higher emissions personal car travel by income group. Figure 5 shows the results of our catchment area analysis and cumulative opportunity measure which computes the number of hubs that can be reached within 30 minutes by transit or car and disaggregated by household income for each scenario. Between each city and scenario, ∼10%–50% of the population cannot reach a hub within 30 minutes by public transit compared to <10% by car. Vancouver has the best relative access but still excludes 6k–67k people compared to Seattle excluding 140k–220k people and Portland that excludes 260k–350k people from reaching a hub by transit within 30 minutes. For Vancouver, the high capacity scenario excludes the least amount of people, but interestingly, for Seattle and Portland, the multimodal scenario has the best access by car and transit. Nevertheless, the overarching result is that the current situation in each city does not support their stated sustainable transport and climate mitigation policies.
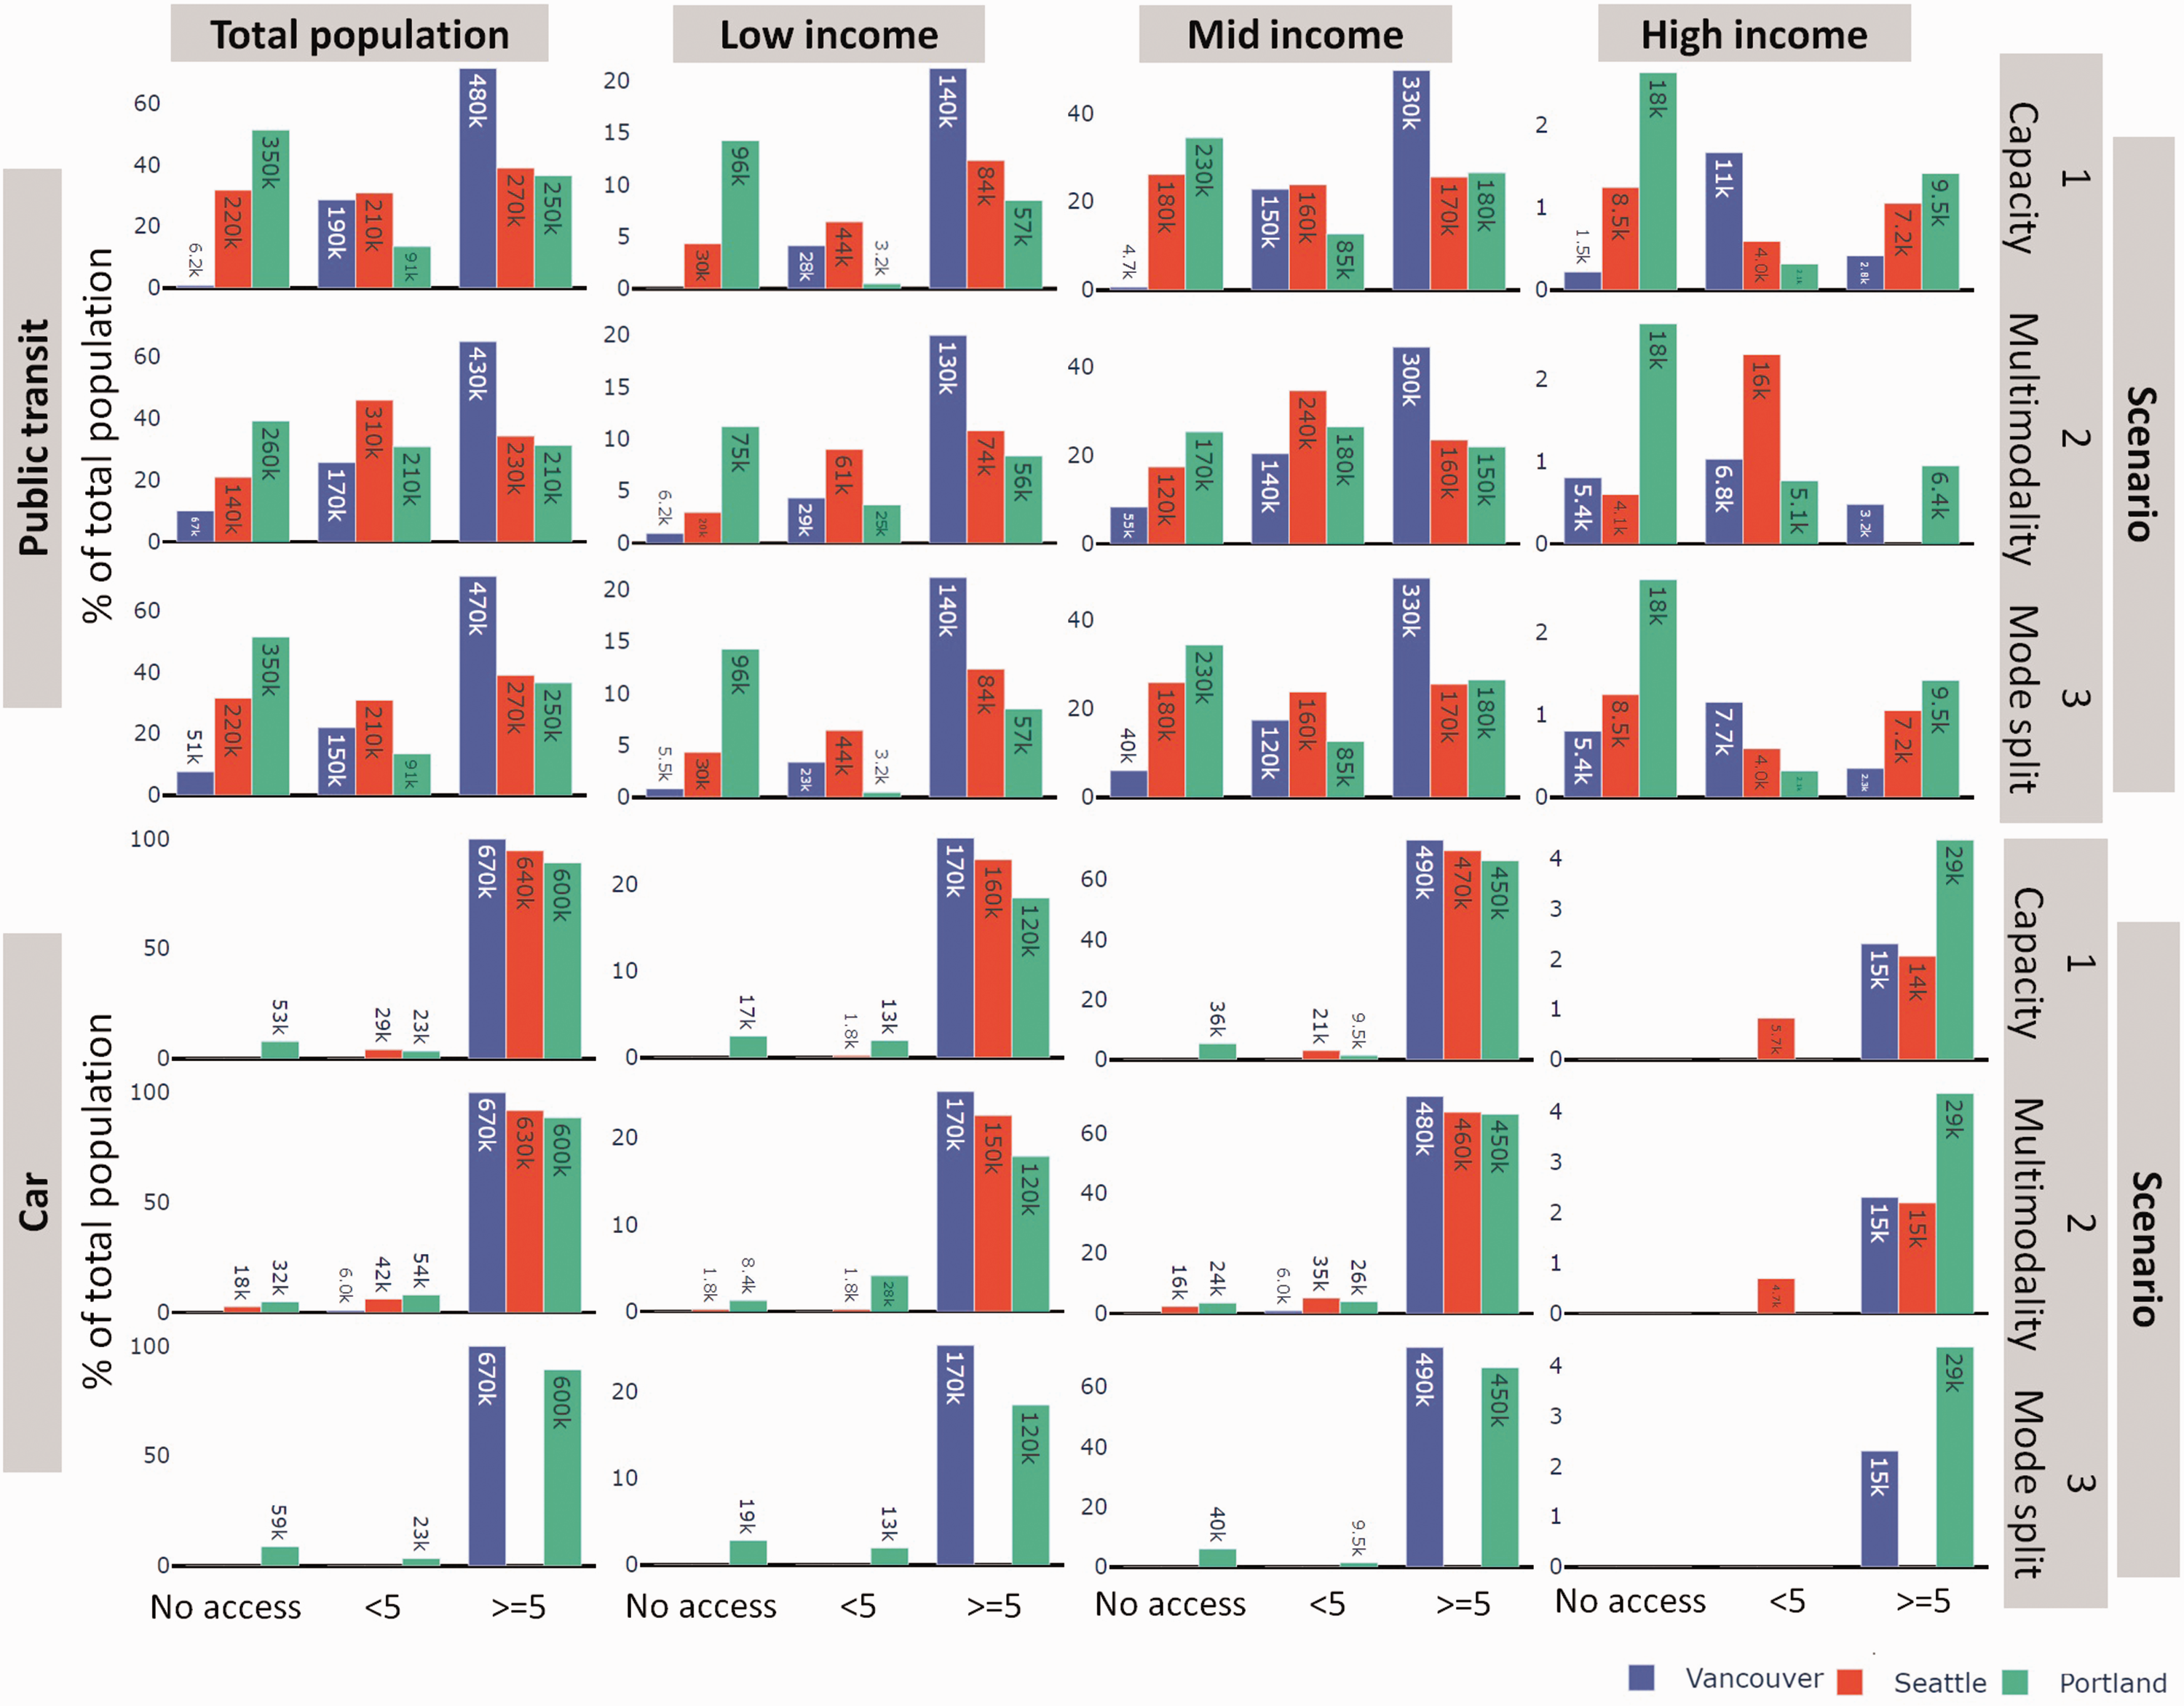
Results from catchment area analysis and cumulative opportunity measure showing the total percentage of the population and disaggregated by total number of households by income group that can access a hub by public transit or car for each scenario.
From an equity perspective, between each city and scenario, ∼5.5k–96k low-income households representing ∼2%–15% of the total population have no access to a hub by public transit compared to ∼1.5k–18k high-income households representing ∼1%–3% of the total population. Conversely, only in Portland, there are some low-income households (∼1.8k–19k) not able to reach a hub by car; and in each city, all high-income households can reach at least one hub by car within 30 minutes. In terms of inclusivity or access for the most people, high-capacity hubs perform the best in Vancouver compared to a multimodal hub strategy for Seattle and Portland. Our results indicate that there are important challenges from both a sustainability and equity perspective for improving transport systems in each city.
In most jurisdictions, transit subsidies are justified to provide a basic level of mobility to disadvantaged households. However, public transit is often used for only a small portion of travel, and those who use transit regularly have the lowest level of mobility in the population. Research also indicates dissatisfaction with public transit services, potentially resulting in continued low ridership (Giuliano, 2005). Moreover, for lower income households, car use is becoming more prevalent and often viewed as an important way to improve job opportunities to escape poverty (Blumenberg and Ong, 2001). This could place policies to achieve sustainable transport and inclusive mobility at odds with each other.
This reinforces the need for municipalities to invest in more public transit options to increase the frequency, quality, and overall ease by which low- and medium-income houses can access transport hub services, which may become underutilized by the majority of the urban population and by the population segment that may depend upon these services the most. Municipalities can use the methods presented in this research to more effectively spatially locate transport hubs, encourage the adoption of cleaner multimodal mobility services, and ensure more equitable access to all people.
Conclusions
An important gap in current research is limited understanding and methods for assessing the multicriteria performance of urban mobility hubs. This is critically important due to the large capital expenditures for urban hubs and the potential performance impacts upon the overall transport network. Hubs also have the potential to increase overall access to socioeconomic opportunities (jobs) and essential services (education, healthcare), but we currently have limited understanding of the longer-term societal impacts of hubs in the city. To fill this gap, we developed a novel methodology that integrates network science and urban data analytics to spatially locate hubs in a city and derive performance metrics including hub location, capacity, multimodal availability, travel times, and equity based on differential access to hubs by household income.
There are a number of limitations to our current work discussed in the supplementary material. However, our urban hub evaluation framework is sufficiently flexible for us to address current limitations as new data are acquired. Our approach is used to select urban hubs based on different weightings in our selection methodology in order to reflect different policy priorities. In doing so, we can evaluate the performance of hubs under different scenario conditions and provide the evidence base for infrastructure investment, servicing, and maintenance. By correlating hub location and travel times with household income, we can also assess the equity impacts of different hub scenarios to reflect different investment strategies. Our research builds on existing work and advances decision support tools to help cities plan, design, and deploy mobility hubs into current policy work, existing design guidelines, and planning station upgrades.
We also support broader initiatives to make urban analytics research more transparent and transferable and therefore exclusively make use of open data sources in this study. The goal is to demonstrate the utility of open-source urban data to provide the evidence base for urban planners to champion municipal-level investment in open data initiatives.
Supplemental Material
sj-pdf-1-epb-10.1177_2399808320987093 - Supplemental material for A data-driven complex network approach for planning sustainable and inclusive urban mobility hubs and services
Supplemental material, sj-pdf-1-epb-10.1177_2399808320987093 for A data-driven complex network approach for planning sustainable and inclusive urban mobility hubs and services by Martino Tran and Christina Draeger in EPB: Urban Analytics and City Science
Footnotes
Acknowledgements
We thank A. Nikbakht, X. Wang, J.R. Mayaud, and R. Nuttal for assistance with data collection and processing and M. Hallenbeck for insightful discussions on problem identification.
Declaration of conflicting interests
The author(s) declared no potential conflicts of interest with respect to the research, authorship, and/or publication of this article.
Funding
The author(s) disclosed receipt of the following financial support for the research, authorship, and/or publication of this article: We acknowledge funding support for this research from the Natural Sciences and Engineering Research Council of Canada (NSERC), the Cascadia Urban Analytics Cooperative (CUAC), Microsoft, and Mitacs.
Supplemental material
Supplemental material for this article is available online.
Author Biographies
References
Supplementary Material
Please find the following supplemental material available below.
For Open Access articles published under a Creative Commons License, all supplemental material carries the same license as the article it is associated with.
For non-Open Access articles published, all supplemental material carries a non-exclusive license, and permission requests for re-use of supplemental material or any part of supplemental material shall be sent directly to the copyright owner as specified in the copyright notice associated with the article.
