



Abstract
This study proposes a framework that delineates the mobility and place components of access to help identify areas potentially suffering from insufficient transit service, limited job opportunities, or both. The framework introduces Spatial Inequality of Transit Services (SITS) and Spatial Inequality of Opportunities (SIO) measures to guide the structural reform of transit development policies through the lens of equity, equality, and need. It is tested on transit access to employment opportunities at the block group level in the Washington Metropolitan Area. Three observations are perceived. First, mobility and place components of access should be untangled to tailor effective transit and land use plans and policies. Second, transit services are less equally distributed than employment opportunities and disproportionately serve the residents of core cities. Third, carless and low-income households disproportionally reside in areas with better transit services regardless of their proximity to employment opportunities, and African Americans are discriminated against the most by the unequal distribution of employment opportunities. The findings serve as an essential input for developing regional transit plans and may be utilized to evaluate and prioritize proposed interventions based on their potential to reduce observed access deficiencies. However, further targeted research on residential location choice is necessary to delve into the decision-making processes, understand underlying motivations, identify potential barriers in seeking alternative options, and determine if it is a result of self-selection.
Keywords
Introduction
The public transit equity dialog, regardless of its horizontal or vertical essence, revolves around the “Hobbesian question” of social comprehension and cohesion (Sampson, 1975). The decision of where to provide and expand services involves balancing the interests of beneficiaries (e.g., businesses and residents) and benefactors (e.g., federal and state governments and transit agencies) and becomes practically and politically complex around concerns upholding justice. Taking private property under eminent domain proceedings for public transit construction is an example. While one may argue that government intervention to demolish a property restricts the freedom of property owners, others may argue that eminent domain ultimately serves the public as a whole. It is a constant battle between utilitarian and libertarian philosophies. One values human “well-being,” gives equal weight to the welfare and interest of everyone, leads to the ethical foundation of cost-benefit analysis, and maximizes the net benefit of the majority. The other, however, values “justice in acquisition” and “justice in transfer,” prioritizes the liberties of individuals, and limits federal and state government interference. The dilemma of balancing individual liberties with the common good of providing public services poses a conundrum of whether the service is being provided for those who actually “need” them, how to identify these people to maintain “equity,” and how to fairly distribute the opportunities so that all people can benefit from “equal” opportunities.
Equity, equality, and need are all pillars of social justice that operate in different circumstances (Wagstaff, 1994). Need may have been preferred over equity and equality in some disciplines, yet the concepts are intertwined. How we define and respond to equity, equality, and need impacts the expected outcomes of the other. The mechanism of transit service distribution follows one of the basic tenets of equity: “When equity holds outcomes are an increasing function of inputs” (Harris, 1976). This means that when there is equity in transit service, providing more resources or inputs will result in better outcomes for all members of society. This could include increased access to opportunities, improved mobility, and reduced mobility-induced costs. Whether this concept is being practiced as the overriding principle of transport justice is debatable. Transit service expansion in areas simply due to a high concentration of opportunities may respond to the mobility “need” of that area. It, however, overlooks “equity” and poses mobility challenges for residents of underserved neighborhoods far from the justified need. This in turn conveys the idea of social justice as a complex group of principles forming the basic core of today’s egalitarianism for all members of society.
The Hobbesian phrasing of the issue directs us to macro-level concerns with societal cohesion and stratification, bringing attention to the principal notion of “distributive justice.” Theories of distributive justice specify the conditions under which the distribution of valued opportunities is perceived to be “fair” (Cook and Hegtvedt, 1983). They are beyond utilitarian and libertarian philosophies and are rationalized by egalitarianism and capability approaches. When applied to transit, this notion implies the idea of the equitable distribution of opportunities (equity in space) and transit services (equity in mobility) (Sheller, 2020). Space and mobility in tandem describe the notion of “access” when in reality neither opportunities nor transport services are distributed fairly or justly. It is not the distribution of opportunities and services per se that structure a just society, but rather people can physically get access to the service and use them. The former arises from land use planning and policies, and the latter is the issue of restricted mobility. Arguments about which form of distribution of opportunities and mobility services are socially preferable constitute the topic of equity of access.
The spatial distribution of opportunities and people’s ability to reach them profoundly impacts their lives and societal norms, resulting in benefits for some and burdens for others. Once we shift the focus from urban areas to communities and individuals, the problematic nature of how opportunities and services are spatially distributed becomes clear. For one, equality in access is an empirical impossibility, as access varies across space, time, and transport modes. Since equality of opportunities is a possibility at the aggregate level, access disparity analyses can sidestep this by measuring the gap between different transport modes (e.g., transit and automobile) across geographical spaces (Janatabadi et al., 2023; Maharjan et al., 2023). Yet, this approach falls short once the attention is directed to the places or travel modes per se. Differences in access inevitably become the problem of land use or transport service, challenging the dual nature of access, which is comprised of both without a clear distinction of their individual impact on access level. Common access measures are insufficient in capturing the relative contributions of mobility and place components to overall access. This oversight undermines the effectiveness of transport planning efforts aimed at promoting access and transit equity. A fundamental question that arises is: how can we disentangle the effects of land use from those of mobility to determine which component requires further attention?
The overarching goal of this study is to propose a framework that untangles the mobility and place components of access through the lens of equal transit access distribution. This helps tailor effective transport and land use plans and policies. Our framework is a four-step approach that includes (i) distributing the total number of opportunities evenly, (ii) measuring access to evenly distributed opportunities, (iii) calculating the Spatial Inequality of Transit Services (SITS) and Spatial Inequality of Opportunities (SIO) measures, and (iv) clustering areas using SITS and SIO measures. We employ our framework on transit access to employment opportunities in the Washington Metropolitan Area and offer two contributions. First, we argue that identifying areas in need of transit improvement necessitates untangling mobility and place components of access and measure the spatial inequality of transit services in offering access to employment opportunities in isolation from the inequal distribution of opportunities. This enables transit agencies to prioritize areas in need of improvement with targeted interventions. Second, we promote social justice by providing a population synthesis of clusters accounting for the needs of low-income, carless households, and disadvantaged communities. This helps urban planners and practitioners effectively tailor their strategies to augment transit equality and ultimately promote social justice. Our study responds to the mounting need of transit agencies to identify areas requiring transit service improvements to ensure equal access to opportunities. Relying solely on a general understanding of “access” provides limited insights and does not clarify whether a lack of access is due to insufficient transit services or a scarcity of opportunities. Our framework seeks to clarify these complexities.
Review of the literature
The importance of transport systems in enabling access to valued destinations framed access as a gauge of transport system’s efficacy in catering to community needs. Research began to advocate for the integration of access-oriented plans and indices in alignment with equitable transit planning principles (Golub and Martens, 2014; Ermagun et al., 2023). A prevalent approach emerged to assess transit access for marginalized communities. This approach includes measuring transit access to employment, schools, food, and healthcare services (Ermagun and Tilahun, 2020; Maharjan et al., 2022) for different income, race and ethnicity, vehicle availability, and mobility disability groups (Borowski et al., 2018). While considerable uncertainty remains on equity of access, three conclusions can be inferred. First, communities that are reliant on transit and face social, economic, or physical marginalization tend to experience decreased access to essential destinations. Second, racial and ethnic communities, especially African Americans in American cities, grapple with reduced levels of transit access. Third, a negative correlation exists between transit access and automobile ownership.
The focus of the literature on access disparities has been paralleled by similar developments in the practice of regional transport planning in the United States (Karner, 2016; Manaugh et al., 2015; Martens and Golub, 2021). Studies have revealed that metropolitan planning organizations have consistently compared different demographic and socioeconomic communities through their definition of advantaged and disadvantaged communities and different methods of measuring access. However, both the academic literature and planning practices on access disparities often fail to address the critical question of which normative principle should guide access equity analyses. While different equality principles (e.g., simple equality and proportionality) are typically used, there is often a lack of explicit and justified use of equity-related language. In their study, Lewis et al. (2021) noted this phenomenon and indicated that planning agencies rarely provide justification for their chosen equity principle(s). Martens and Golub (2021) suggested that metropolitan planning organizations seem to use equity standards in a “haphazard” and “opportunistic” way. While the equality principle is intuitively appealing and is often considered the default principle in social justice literature (Kolm, 1996), adopting a particular principle can have significant implications. Avoiding the issue is inconsistent with the fundamental purpose of equity, equality, and justice in transport analysis.
Despite varying standards of equity, equality, and justice, the disparity of access motivated both researchers and practitioners alike to tailor policies to enhance transit access and social equity. They emphasize that plans and policies should prioritize the mobility needs of transit riders, particularly those who are economically disadvantaged and transit-dependent, as opposed to pursuing a multitude of broad objectives that cater to more affluent riders. Proposed strategies often focus on bolstering mobility by means such as increasing vehicle ownership, enhancing service frequency, promoting ridesharing and active commuting, or reshaping land use patterns by fostering higher residential density, retail, and transit-oriented development. These suggestions, though might be effective in some cases, often lack robust evidence as to what extent mobility or land use contributes to the level of access. Effectively facilitating transit access necessitates a comprehensive understanding of the distinct contributions of mobility and land use to access levels within a specific locale.
Our review of the literature indicates that while the concept of access has become a popular tool for evaluating the impact of land use and transport strategies in urban planning and policy-making (Condeço et al., 2011; Omer, 2006), decision-making based on access analysis remains imperfect or underdeveloped. The dual nature of access complicates its assessments and impacts the subsequent decision-making. Researchers tend to focus on one aspect while often overlooking the other (Geurs and Van Wee, 2004; Geurs et al., 2010). As this oversight may lead to potential significant interaction effects that result in overestimations or underestimations of policy impacts (Wang et al., 2015), researchers developed models that consider both elements simultaneously (Badoe and Miller, 2000; Geurs and Van Wee, 2004; Geurs et al., 2010; Langford et al., 2008; Thill and Kim, 2005; Ermagun et al., 2023). However, in practical applications, further efforts to disentangle the effects of land use and transport on access to provide precise recommendations for relevant agencies are still needed.
Methods and measures
Here, we propose a four-step approach to disentangle the place and mobility elements of access. Assuming a study area composed of • Step 1: We measure the total number of opportunities in the study area and evenly distribute the total number of opportunities across the geographical region to demonstrate equal exposure to opportunities. This equal distribution can be zone-based, area-based, population-based, or density-based. • Step 2: We measure transit access to evenly distributed opportunities ( • Step 3: We calculate the Spatial Inequality of Transit Services (SITS) and Spatial Inequality of Opportunities (SIO) measures. • Step 4: We cluster areas using SITS and SIO measures to assess the impact of transit service and opportunity distribution on each area separately to develop tailored and effective policies and plans.
The detailed calculation methods for each step are presented in the following.
Access to employment opportunities
We applied the Cumulative Opportunities Measure, as defined in equation (1), to measure access to employment opportunities by transit at the census block group level. Employment data was extracted from the Longitudinal Employer-Household Dynamics (LEHD) Origin-Destination Employment Statistics dataset.


Transit access to destinations is calculated between 7:00 a.m. and 9:00 a.m. for a 45-min travel-time threshold. We picked the 45-min travel-time threshold as it is the closest travel time to the average commute time in the Washington Metropolitan area (SOC, 2019). Calculations are carried out using the Rapid Realistic Routing on Real-world and Reimagined networks (r5r) at the census block group level. Transit access measurement considers door-to-door travel-time estimates. This includes commute time to transit station, initial wait, on-vehicle, transfer, and egress times. Median access is then derived by calculating access for multiple departure times for every minute during the morning peak from 7:00 a.m. to 9:00 a.m. Computation of transit access between destination pairs requires three data extraction. First, detailed information on employment locations is extracted from the Longitudinal Employer-Household Dynamics (LEHD) Origin-Destination Employment Statistics (LODES) dataset. Second, the road network and pedestrian infrastructure data were acquired from OpenStreetMap (OSM) in osm.pbf format. Third, transit schedule data (e.g., public transit schedules, stops, routes) is obtained from the General Transit Feed Specification (GTFS). Transit access to employment opportunities is then integrated with demographics and socioeconomic data (e.g., age, ethnicity, income level, car ownership, disability, population density) extracted from the 2019 American Community Survey (ACS) 5-year estimate.
Spatial Inequality of Transit Services
The Spatial Inequality of Transit Services (SITS) is measured by calculating the disparity between the highest transit access value (

Spatial Inequality of Opportunities
Spatial Inequality of Opportunities (SIO) is measured by standardizing the difference between the highest number of available opportunities and the number of opportunities in each zone across the study region as per equation (4).

Bivariate local indicator of spatial autocorrelation
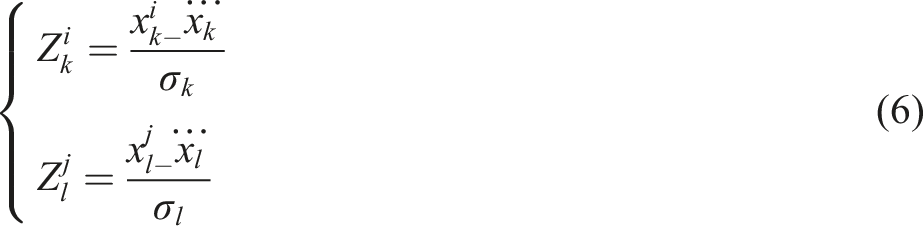
Developing land use and transit service plans and policies based solely on access values may not always be effective. For instance, areas with low access to employment may suffer from a lack of transit service, lack of opportunities, or both. To develop tailored and effective policies for different areas, it is important to comprehend how transit and land use contribute to access, both independently and in conjunction. Understanding their separate effects enables precise recommendations for planning and policy-making. We, therefore, cluster areas considering their SITS and SIO values by conducting a bivariate local indicator of spatial autocorrelation (BiLISA) using the GeoDa software (Anselin et al., 2009). The BiLISA helps identify the extent to which the values of one variable (

Results and discussions
Measuring SITS and SIO for the Washington Metropolitan area
We test the proposed framework in the Washington Metropolitan (DMV) area covering the District of Columbia, and parts of Maryland, Virginia, and West Virginia. The DMV area ranks 4th in greatest access to jobs by transit and 7th in total employment (Owen, 2020). The region has a long history of redlining and segregation, which has resulted in disparities in access to jobs, housing, and transport. However, the DMV area is characterized by a high level of diversity and engaged civic society, which has worked to promote inclusivity and equity in recent years. Considering the historical context and diverse communities, the DMV area presents itself as an appropriate choice for our analysis.
Figure 1 offers a snapshot of the study area encompassing the spatial distribution of the transit network (Figure 1(a)), average commute time (Figure 1(b)), spatial distribution of employment opportunities (Figure 1(c)), transit access to employment opportunities at a 45-min travel-time threshold (Figure 1(d)), and transit access to uniformly distributed opportunities at a 45-min travel-time threshold (Figure 1(e)). Figure 1(e) is an attempt to reduce employment opportunities clustering with an equal number of employment opportunities per block group regardless of block group size. With a total of 3,545 block groups, the DMV area harbors 3,038,953 employment opportunities, predominantly clustered in the inner core of the metropolitan area. The redistribution of employment opportunities results in a total of 857 employment opportunities per block group. One takeaway from Figure 1 is that commute times at the northern end of the region are influenced by its proximity to Baltimore, which borders the DMV. This is why the southern portions of the region experience the longest commutes. Another takeaway from Figure 1 is that the highest levels of transit access are concentrated in the central region of the metropolitan area. This arises from the interplay between job distribution and transit networks. Maps display (a) public transit network, including bus and train routes, (b) variations of average commute time across the study region, (c) the distribution of employment opportunities, (d) transit access to employment opportunities at 45 min travel-time threshold, and (e) transit access to uniformly distributed opportunities at the 45-min travel-time threshold.
By analyzing the distribution of employment opportunities, we can determine the values for spatial inequality of transit services (SITS) and spatial inequality of opportunities (SIO) and visualize them through maps. Figure 2 presents the results of our analysis, which shows that block groups with relatively good transit access are limited and concentrated around the public transit network, as indicated by their low SITS values. Conversely, the distribution of SIO is more diverse, with certain block groups in the southern and western regions of the metropolitan area benefiting from better access to opportunities. The disparity between SITS and SIO can be attributed to the changes in land use and economic growth within the region. The southern and eastern regions of the DMV area are witnessing substantial economic development and an increase in employment opportunities, particularly in the technology industry. These regions house prominent technology centers, such as Tysons Corner in Virginia and the University of Maryland’s College Park campus, attracting high-paying jobs and top talent. Additionally, several major employment centers (e.g., the National Institutes of Health, the Food and Drug Administration, the Department of Defense) contribute significantly to the region’s economic growth. However, economic development and employment opportunities decline as one moves toward the far west and east of the DMV area. Despite this, these areas still contain significant job centers, such as Dulles International Airport in the far west and Aberdeen Proving Ground in the far east. The thriving tech hub of Reston, Virginia, is also situated in the far west and has seen notable job growth in recent years. Although there is a gradual change in land use, public transit is struggling to keep pace with the increasing demand for transport in these regions. As a result, access to these job centers by public transit is comparatively lower than that in the central areas of the DMV region. Maps display (a) the variations of SITS over the study area measured at the 45-min travel-time threshold, and (b) the variation of SIO across the DMV area.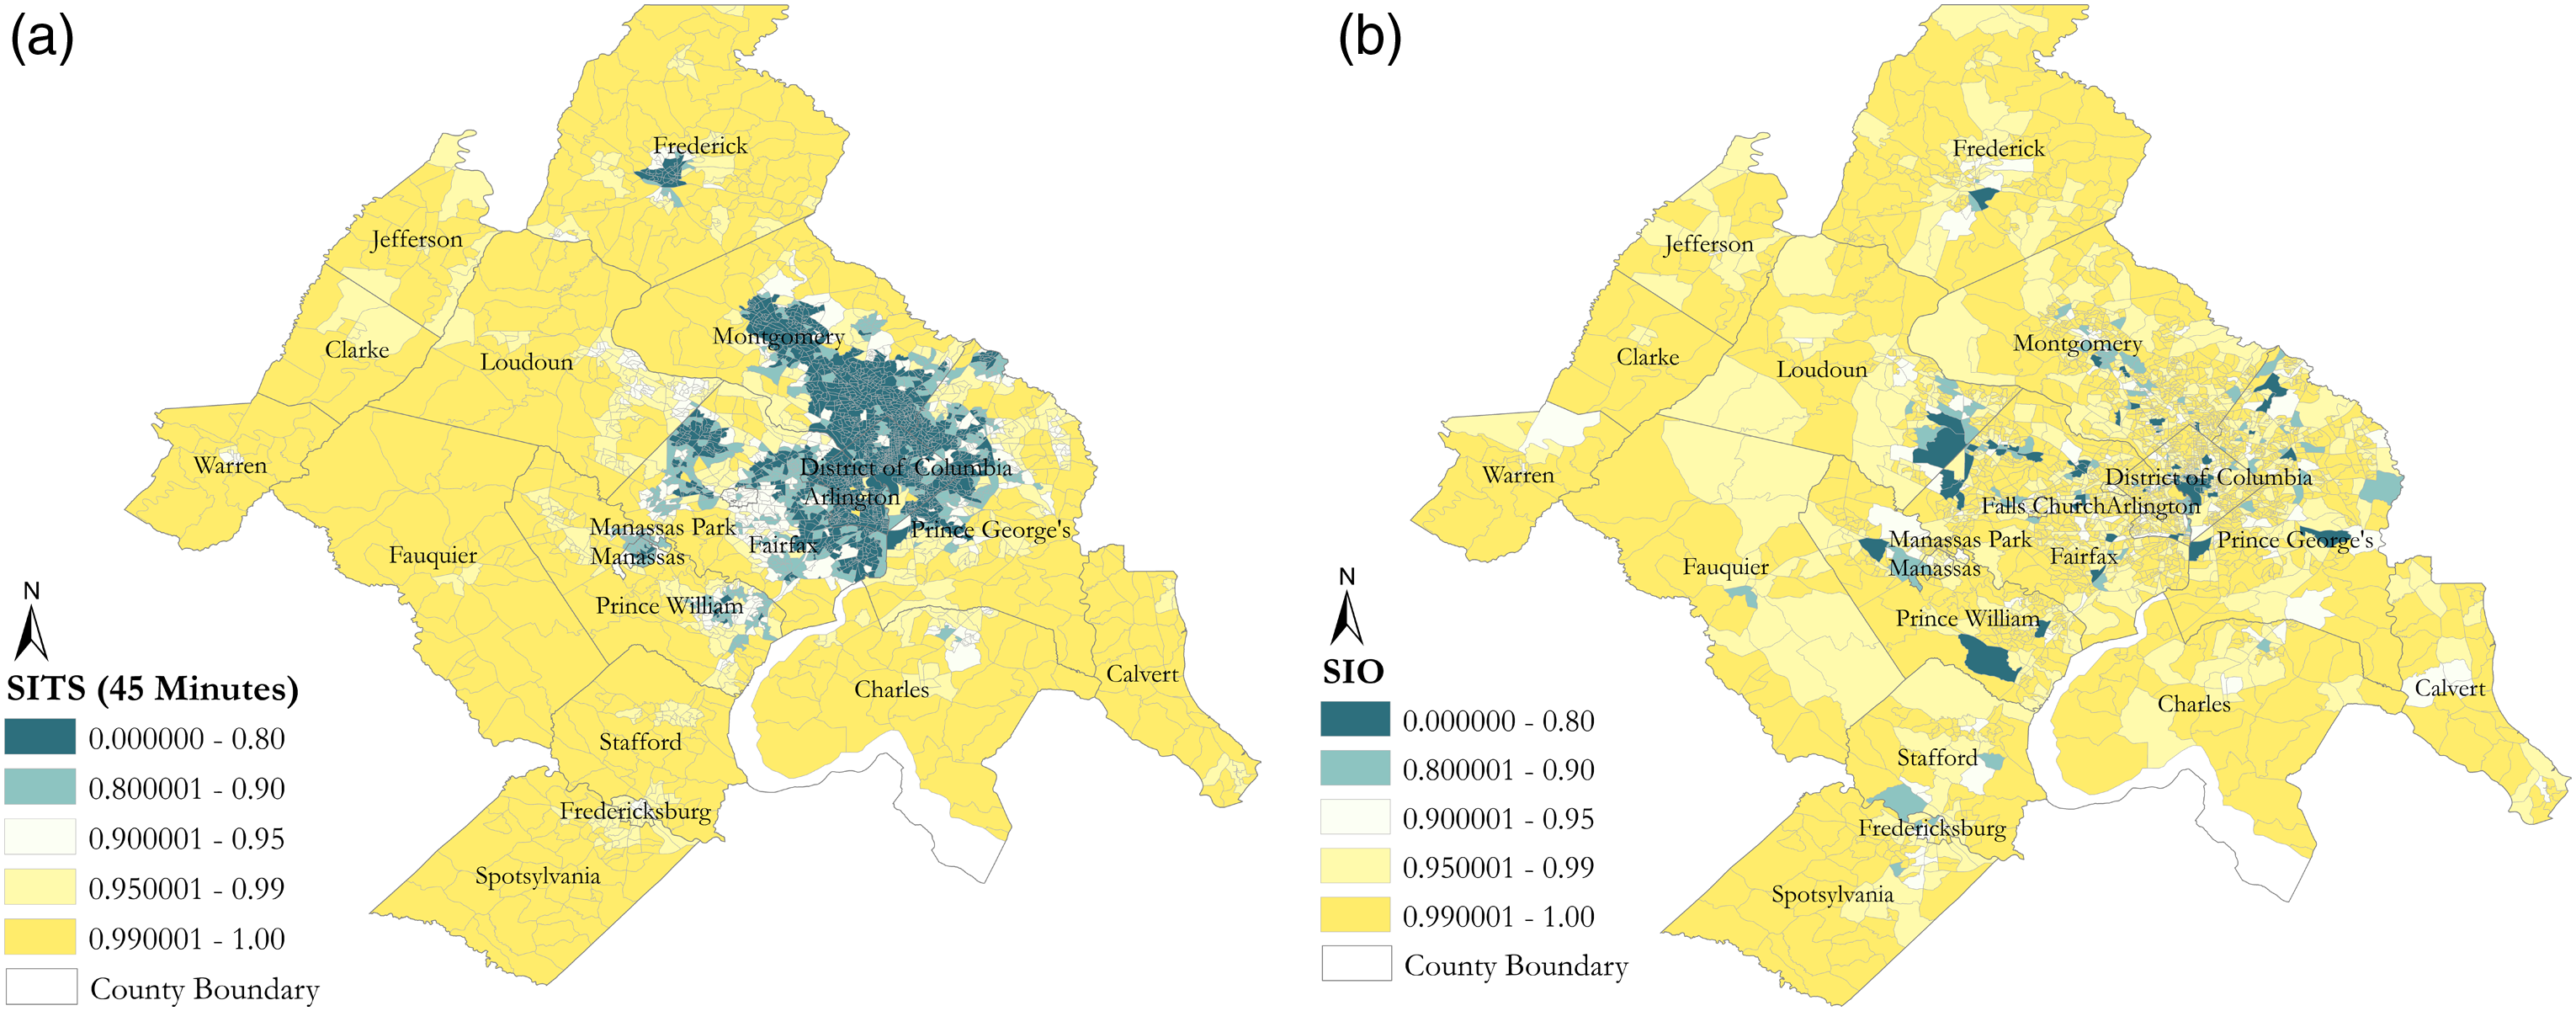
Decoding access: Disentangling space and mobility
Here, we exercise the BiLISA analysis to spatially cluster and visualize block groups of the DMV area impacted by the disparity of transit service (i.e., SITS) and disparity of employment opportunities (i.e., SIO) in the neighboring block groups under the “utopian city concept.” Figure 3 depicts the results. From a visual inspection, two observations are discerned. Spatial clustering of SITS and SIO.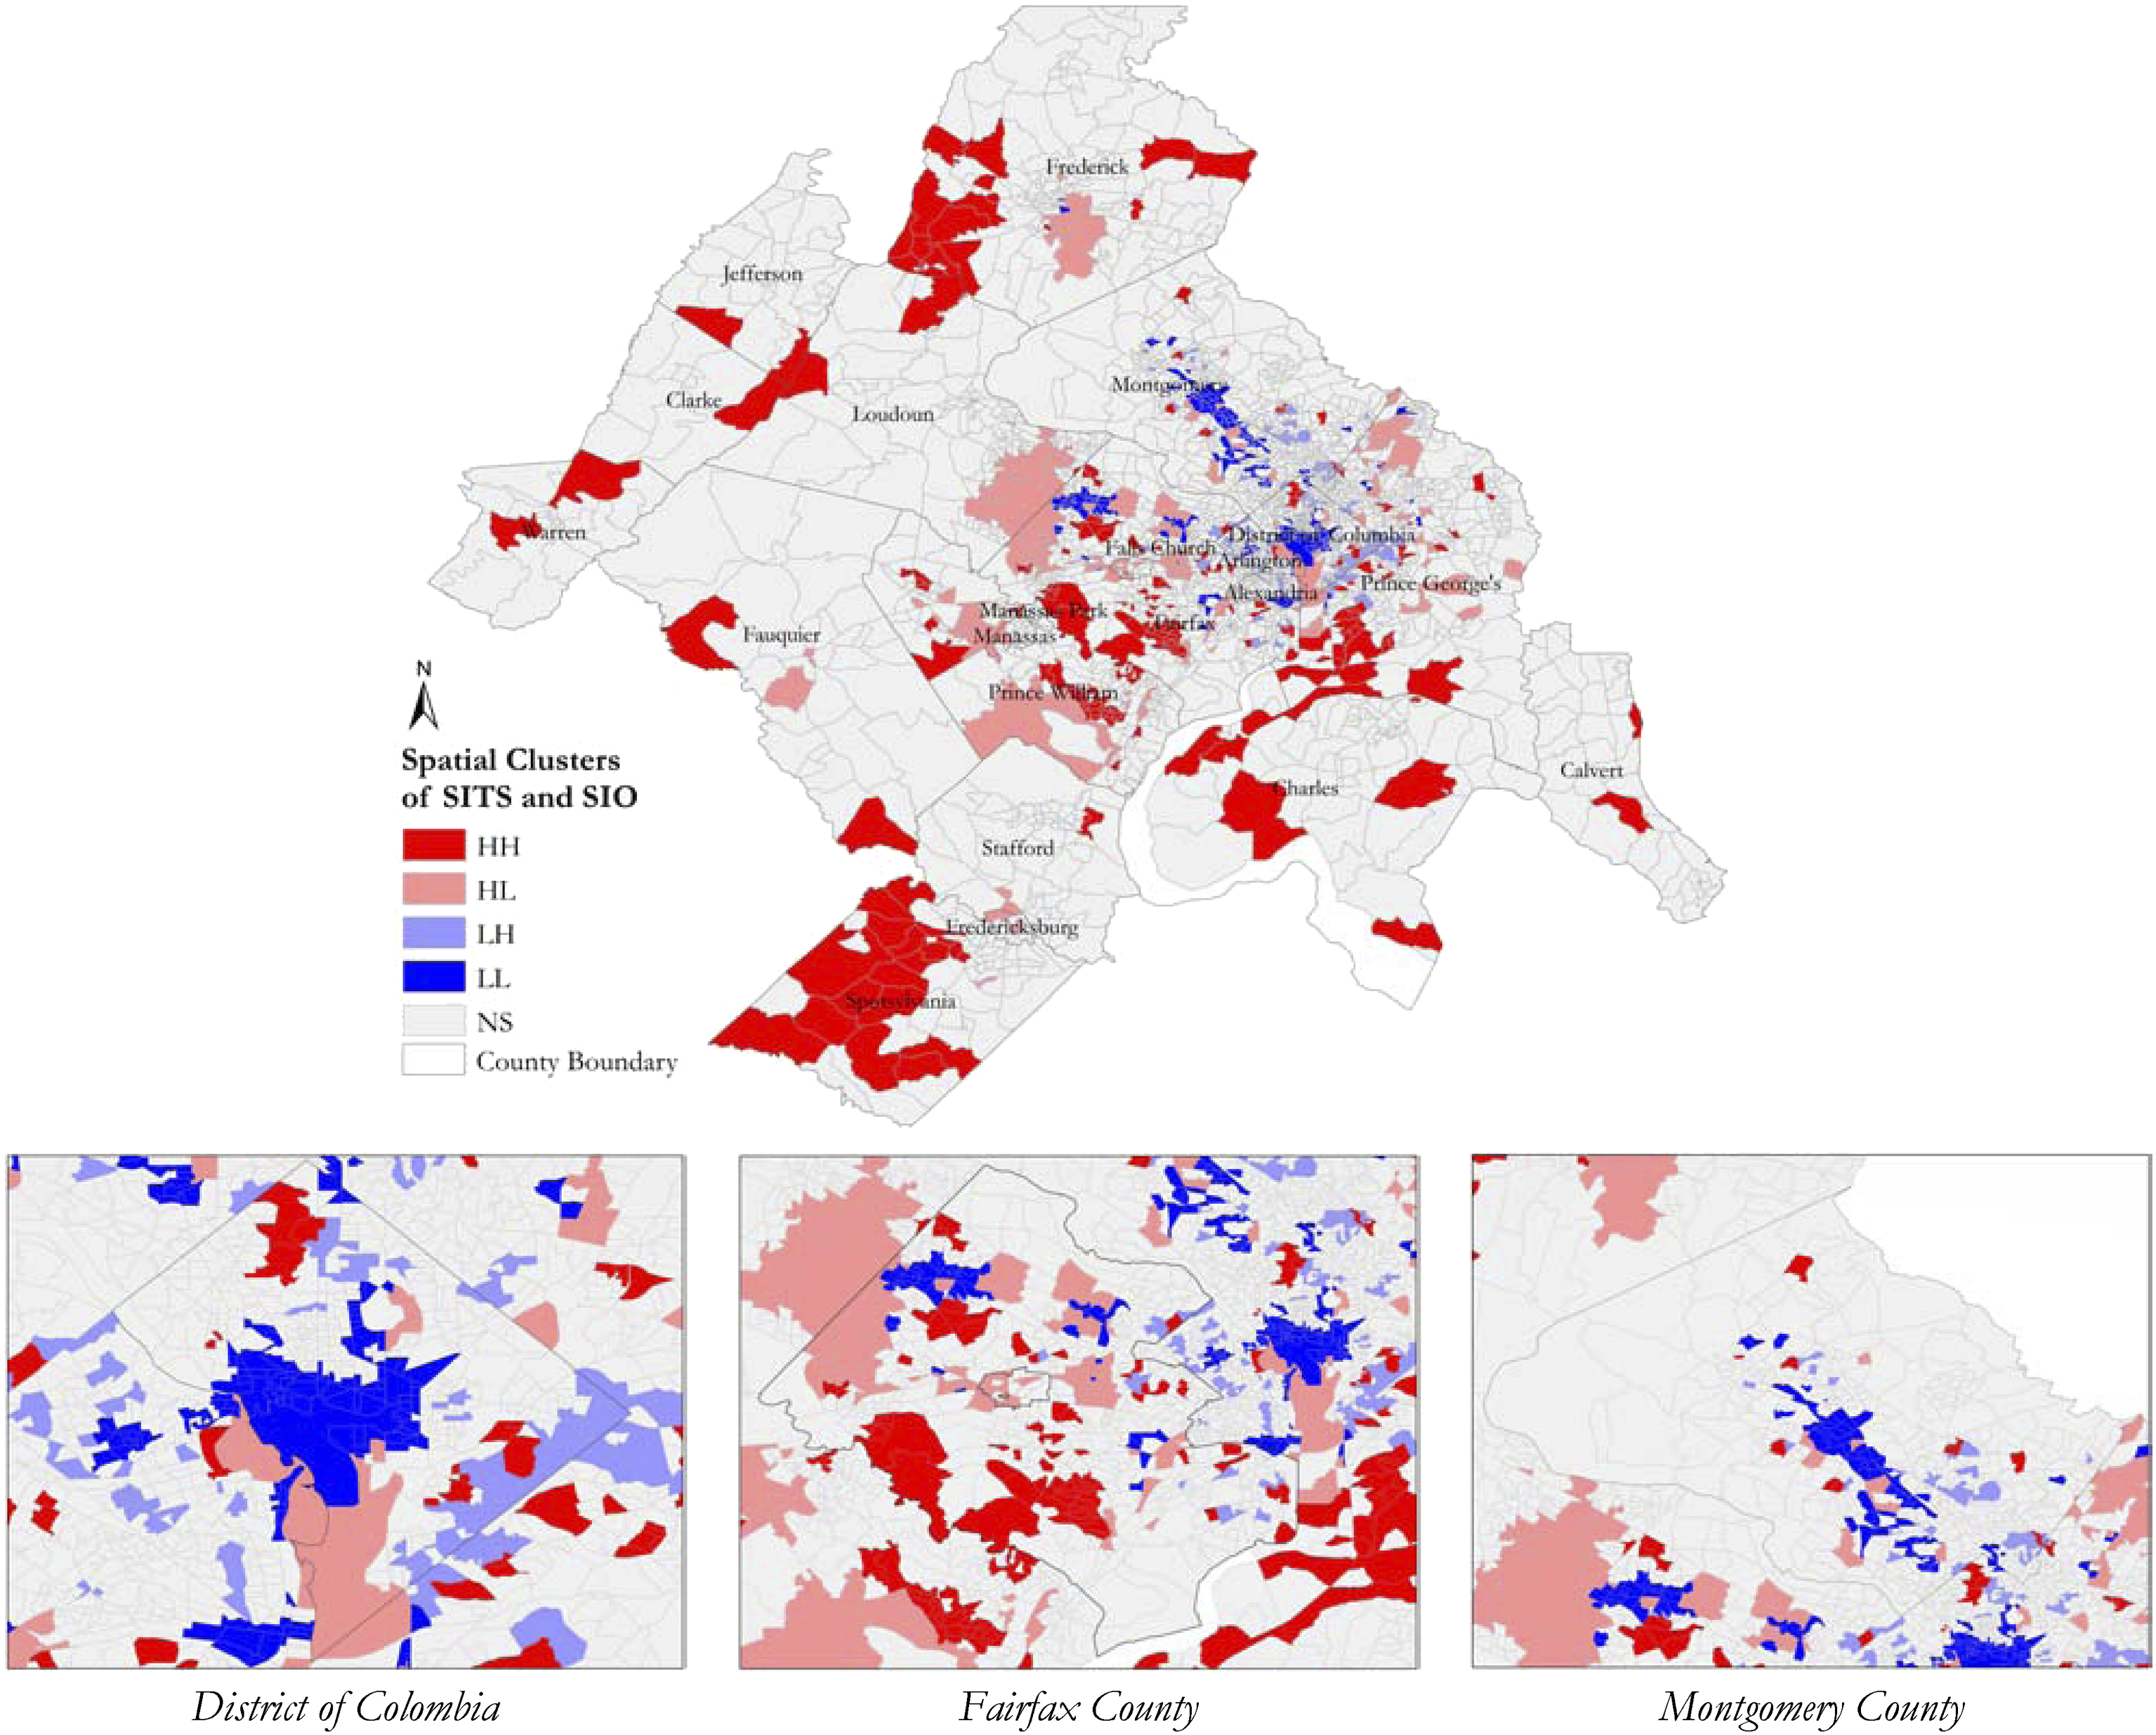
First, there is a bundle of HH clusters in the periphery. HH clusters characterized by high SITS and high SIO have poor transit service and are also deprived of enough employment opportunities. Residents in HH areas lack both transit services and employment opportunities. The periphery of the DMV area is generally characterized by lower land values compared to the inner suburbs and urban areas and is often home to more rural and agricultural communities. There are pockets of lower-income residents and neighborhoods with more affordable housing options in the outskirt areas. The characteristics of outskirts communities make them more in need of better transit services and opportunities. However, transport infrastructure in periphery areas is generally less developed. We speculate that this trend is partially due to historical patterns of discriminatory land use policies or public infrastructure funding rationale. When the “need” for transit services is low, areas may appear to be less economically feasible for transit investment. Consequently, residents living in these areas may lack access to employment and other opportunities, jeopardizing “equity” and depriving them of reaching “equal” opportunities.
Second, the central core of the metropolitan area, which is also the transit knot of the area, encompasses all four clusters but specifically displays bundles of LL and HL clusters. Residents of LL and HL areas benefit from transit services disproportionally while being surrounded by a plethora of employment opportunities. This trend is particularly evident in the three major counties of the DMV area: Washington D.C., Montgomery, and Fairfax. With relatively high land value and proximity to major urban centers, it is not surprising that these three counties benefit from both transit service and employment opportunities discerned by the concentration of LL clusters. The presence of HH clusters in more affluent counties indicates that these areas are not exempt from the issues of limited access to transit and unequal employment opportunities. This issue is not necessarily related to the “need” for investment in transit infrastructure but rather reflects the historical and systemic distribution of opportunities and services in the region.
Synthesizing spatial clusters: Demographic analysis
Clustering regions to identify areas that need transit service improvement or areas that lack employment opportunities or both, albeit necessary, is not enough. Here, we delve deep into the characteristics of communities per cluster. We specifically look into seven socially vulnerable cohorts: (i) people with disabilities, (ii) the elderly, (iii) carless, (iv) low-income, (v) Hispanics, (vi) Asians, and (vii) African Americans. Figure 4(a) breaks down the share of vulnerable populations living in clustered areas. A detailed comparison within each demographic category provides interesting insights. A significant portion of LH and HH clusters is comprised of African Americans. The presence of African Americans in the LH cluster, comprising 48% of the population of the LH cluster, indicates that one group of African Americans have relatively good transit access to employment, but they do not benefit from the equal spatial distribution of employment opportunities. The presence of African Americans in the HH cluster, comprising 27% of the population of the HH cluster, indicates that another group of African Americans have poor transit access and live far from employment opportunities. The two observations suggest that African Americans in the DMV area may face challenges in accessing employment opportunities, with some having the option to live in areas with better transit access to employment while others may not have the financial means to do so. Spatial inequality of opportunities can contribute to a lack of equity in access to opportunities and may perpetuate existing regional disparities. Asians, conversely, are disproportionately distributed in HL and LL clusters. The results for Hispanics do not reveal a clear trend. While the Hispanic population in the LH area is higher, the share of Hispanics in other cohorts is roughly the same. The same can be observed for the elderly population. (a) Population distribution across clusters by demographic and socioeconomic cohorts. (b) The ratio presents the percentage of the vulnerable populations living in each cluster to the same vulnerable group living outside that cluster, broken down by cohort.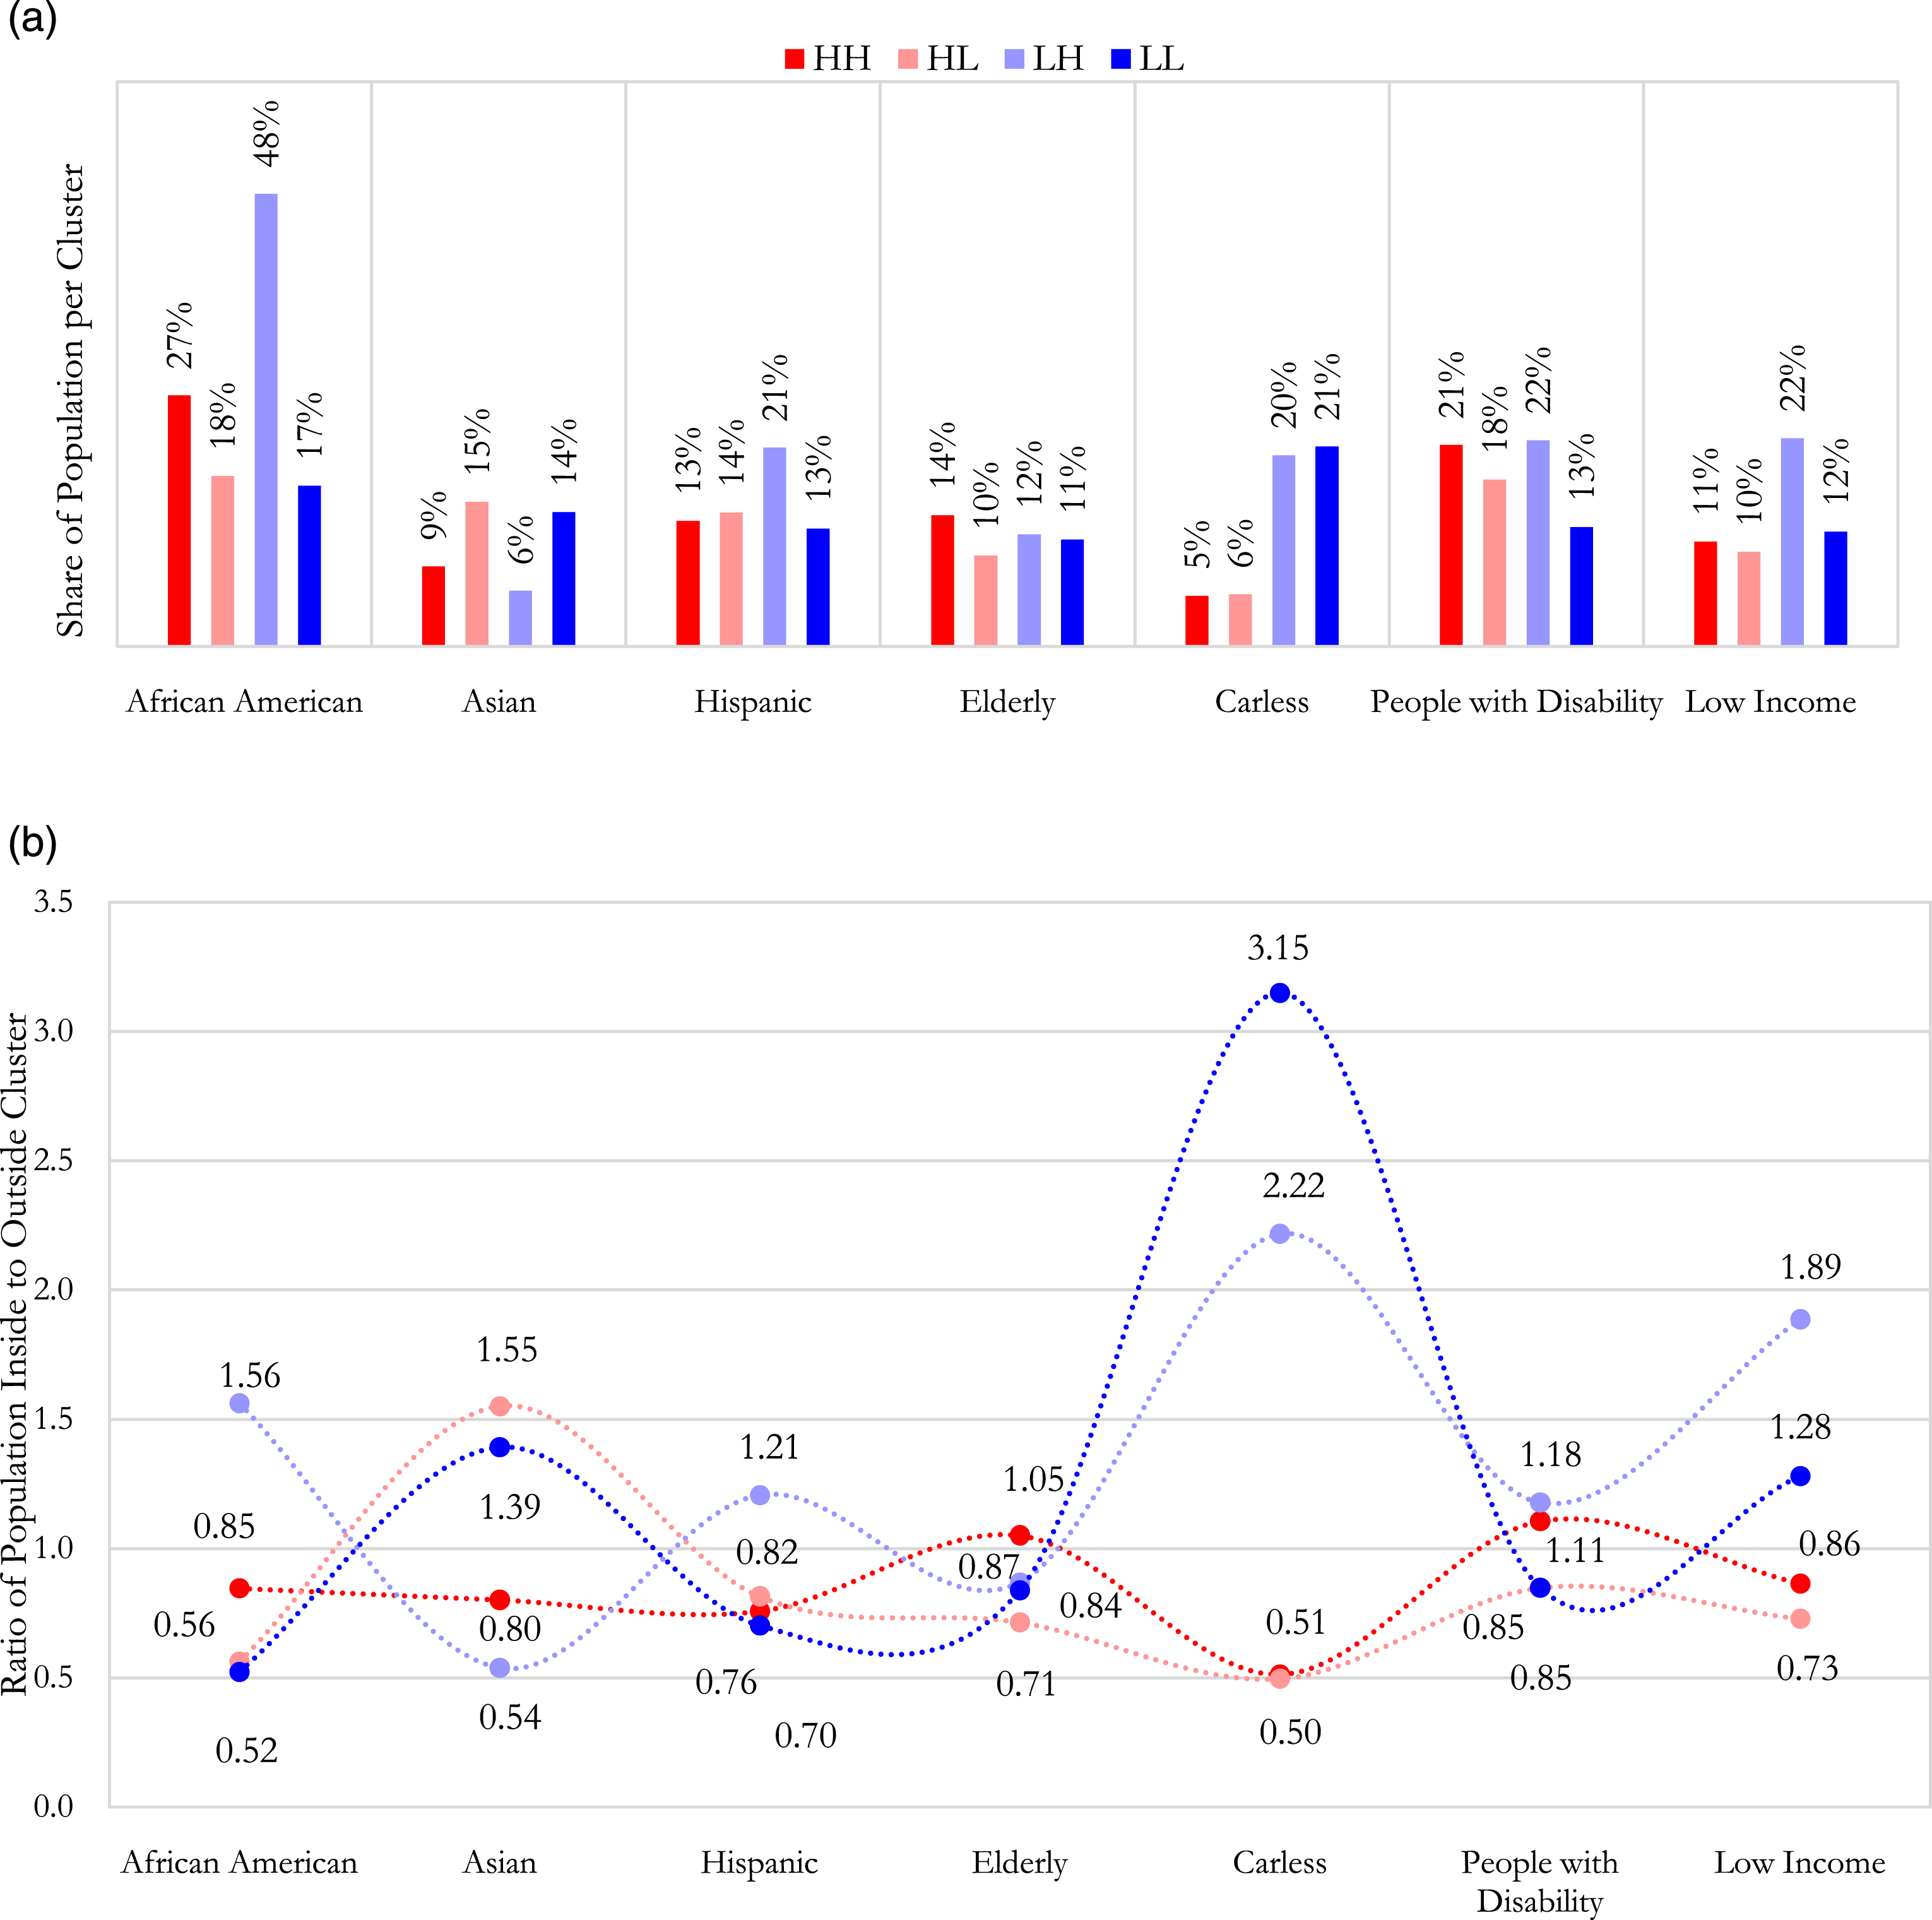
A detailed comparison within each socioeconomic characteristic of households also offers interesting insights. One notable finding is that carless populations are disproportionately distributed in LH and LL clusters in which transit offers better access to employment opportunities. This suggests that access to transit holds greater importance for carless households’ daily needs. Another notable finding is the high share of low-income households in the LH cluster. Their distribution across other cohorts is relatively uniform, however, this may be due to their limited affordable housing options. These households may be forced to prioritize affordability over other factors including proximity to employment opportunities and transit access. Further targeted research on residential location choice is necessary to delve into the decision-making processes, understand underlying motivations, identify potential barriers in seeking alternative options, and determine if it is a result of self-selection.
The purpose of Figure 4(b) is to measure a ratio that compares the percentage of a vulnerable community living in each cluster to the percentage of the same vulnerable community living outside that cluster. This approach helps normalize the effect of the population across communities and understand whether a higher share of each vulnerable community is concentrated in each cluster. A ratio greater than 1 indicates that the cohort is mostly concentrated in a particular cluster. Figure 4(b) provides a normalization factor to measure the concentration of vulnerable communities in each cluster, allowing for a better understanding of the distribution of these populations across the DMV area. We observe the higher population of elderly and people with disabilities living in the DMV area residing in the HH cluster. The high share of elderly and people with disabilities in HH clusters could be explained by the fact that these populations have a lower level of mobility and require social support. This makes access to transit and employment opportunities less of a priority for them. Therefore, the choice of measuring employment opportunities and access by transit may not fully capture the challenges faced by these vulnerable communities. Our analysis reveals a concentration of African Americans in the LH cluster, suggesting a preference for living in areas with better access to transit. This finding is consistent with our previous arguments about their reliance on public transit for mobility. The same trend applies to the Hispanic population. In contrast, Asians are mostly concentrated in HL areas, indicating their preference for living in areas with better access to job opportunities, even if it means lower transit access. Low-income households are more likely to reside in LH and LL clusters, potentially due to their need for better transit access to employment opportunities. Notably, carless households prioritize mobility over proximity to employment, which is reflected in their concentration in areas with better transit access, regardless of employment opportunities.
Overall, the demographic and socioeconomic characteristics of households in the DMV area have a significant impact on their choice of residential location and transit access to employment opportunities. Understanding these patterns can help policymakers and planners develop targeted strategies to address issues of economic inequality and improve access to transport and employment opportunities for all residents.
Final remarks
The concept of equality of opportunity is widely acknowledged as a fundamental aspect of distributive justice. To achieve desirable outcomes for all members of society, policies can be implemented to ensure a fair distribution of resources. Once a level playing field has been established, it is no longer a matter of justice to dictate which opportunities individuals should pursue from the available choices. The focus of public intervention should be limited to eliminating or compensating for pre-existing inequalities. In modern discourse, the economic concerns related to opportunity egalitarianism can be divided into two categories: (i) devising effective public policies for implementing the principle of equality of opportunity and (ii) determining the extent of opportunity inequality in society (Pignataro, 2012). This study aimed to address both in the context of transport access analysis. We outlined an approach for determining transport and land use planning and policy as an alternative paradigm for measuring equity and justice in the form of inequality of opportunities. We contend that transport planners must avoid solely committing to aggregated access if they are serious about achieving equity in the transport domain (Grengs, 2010). Instead of relying on the seemingly impartial disparity of access, these entities must adopt a clear standard that takes into account all pillars of social justice, including need, equity, and equality.
As equity, equality, and need are viewed as necessary components of social justice, they may be needed cumulatively but can also have inherent value on their own. As distributive justice requires fairness in outcomes, we must view all three pillars concurrently. In our study, we observed instances where the lack of all these three principles collided in the DMV periphery: lack of mobility resources, high proximity from equal opportunities, and social vulnerability of communities. We posit the transit projects recently being funded or developed in the DMV area do not necessarily adhere to these principles and are resulting in the distribution of opportunities and services among the more affluent. One recent transit project is the Silver Line extension. This $3.4 billion project expanded the existing line from its current terminus in Reston, Virginia, to Dulles International Airport and into Loudoun County, adding six new stations to “provide greater access to jobs, entertainment, and shopping destinations” (WMATA, 2022). Another transit project is the Purple Line, a 16-mile light rail system connecting Bethesda in Montgomery County, Maryland, to New Carrollton in Prince George’s County, Maryland. There are also proposed bus extension plans, including a Bus Rapid Transit (BRT) line along the Route seven corridor in Northern Virginia to connect Alexandria and Tysons. Many more similar projects are burgeoning, particularly after the passage of the $1.7 trillion federal spending law. The public transport projects should integrate needs of vulnerable communities who already lack access to transit and opportunities into plans. Rather, these projects aim to reduce congestion, improve travel times, and offer access to affluent areas, with the hopes that transit improvements will cause notable mode shifts—a theory that is debatable, if not wrong (Batty et al., 2015). Relying solely on conventional approaches to develop land use and transit service may not be effective anymore. The complexity of understanding people’s needs and trying to address them requires far more attention. Investments can be made in areas and for people who can use it to overcome mobility challenges and limited opportunities. Unfortunately, this has not been the case.
One way to loosen up our thinking about social justice is by paying greater attention to the history of injustice. Today, the legacy of redlining and segregation is visible in the unequal distribution of services and opportunities. The impact of these policies can be seen in the persistent racial wealth gap and disparities in education, health, and employment among Americans. Predominantly black and Latino neighborhoods continue to face disinvestment and neglect, leading to poor living conditions, limited access to quality education and healthcare, and higher rates of poverty and crime. Efforts to address these persistent inequalities require intentional policies aimed at redressing the historical wrongs. This includes investments in land use modifications and public transit in neglected neighborhoods, as well as policies to combat discriminatory practices in lending and employment. Only by addressing the ongoing impact of these policies can America truly move toward a more just and equitable society.
This study proposed a straightforward and transferable access-based framework for identifying and addressing transport and land use injustice at any location or geographic level. The framework can be used to systematically evaluate and prioritize proposed interventions based on their potential to reduce observed access deficiencies. The findings, however, are not comprehensive enough. The results of this approach can only serve as an essential input for developing regional transport plans. At a less ambitious level, the suggested framework may be utilized to evaluate and prioritize proposed interventions based on their potential to reduce observed access deficiencies. Additional research is required to elevate our understanding by investigating the underlying characteristics of individuals residing in each cluster, including their decision-making processes and motivations for living in specific areas, potential obstacles faced when seeking alternative options, and whether their selection of residential location was voluntary or involuntary. Conducting surveys designed to examine these issues is essential for practitioners to identify and address the unique needs of each cluster and to develop policies and interventions that can mitigate existing inequities. In addition, understanding the specific factors that contribute to inequitable outcomes can help inform evidence-based decision-making that is grounded in empirical data, ultimately leading to more effective and efficient policy interventions.
Footnotes
Declaration of conflicting interests
The author(s) declared no potential conflicts of interest with respect to the research, authorship, and/or publication of this article.
Funding
The author(s) received no financial support for the research, authorship, and/or publication of this article.
