



Abstract
This study attempts to formally quantify Jane Jacob’s notion of urban diversity and examine whether greater diversity actually contributes economic benefits to a neighborhood. Focusing on the number and types of stores at the street level, we use the Shannon–Weaver index to quantify commercial diversity. We then compare the obtained degrees of diversity with store sales volumes obtained through credit card transaction data aggregated in the neighborhood divided into a 200-m grid. The results of the analysis, performed on 50 Spanish cities, show that the greater the diversity in the grid, the higher the sales volumes of the stores, and this tendency is more evident in large than in small–medium cities. In addition, we found that the coexistence of different store types provides a positive environment for the emergence of hub stores. We specifically define a hub store in this paper as the store with the largest revenue within a grid, provided that the distribution of the sales revenue in a grid is statistically similar to the power law. We speculate that hub stores trigger exploration between different store types, and consequently, the sales volumes of highly diverse neighborhoods increase compared with those of less diverse neighborhoods. These results highlight the importance of urban diversity for economic prosperity, which can lead to an increased quality of life for city neighborhoods.
Introduction
Jane Jacobs (1961) states that urban diversity, defined as the property of having urban spaces with different combinations of land use and activities that enable a social and culturally vibrant environment, improves the quality of citizens’ lives. While this hypothesis has been widely accepted, its veracity has been underexplored and rarely validated using large-scale empirical datasets. Accordingly, this study discusses city diversity. In particular, we focus on commercial diversity at the neighborhood scale, defined in terms of the geographical distribution and types of commercial locations in a determined area. We aim to quantify this using the Shannon–Weaver diversity index (Shannon, 1948; Shannon and Weaver, 1949), which is well established in biology for measuring species diversity (Magurran, 2004). The question we address is whether greater diversity in a neighborhood can enrich the quality of life (QOL) in the area. More precisely, we explore its correlation with the amount of transactions generated by each retail store, aggregated in the corresponding area. Thus, we examine an interpretation of Jane Jacob’s statement (Jacobs, 1961) that the greater the urban diversity, the richer the citizen’s QOL in the neighborhood, with the caveat that we use an economic indicator as a proxy for QOL.
Diversity is a long-standing concept in the biological sciences, but in practice, biological diversity (“biodiversity”) can have different meaning for different groups of people (e.g., geneticists, conservation ecologists, governing bodies, and the public) (Primack, 2012). Even for defining species, which is considered a basic unit of biodiversity (Claridge et al., 1997), no commonly accepted agreement exists among biologists; this is known as the “species problem” (Hey, 2001). The current consensus is that biodiversity can be defined at the genetic, species, and ecosystem levels, all of which are important determinants of ecosystem functioning and the services provided to humankind and sustainability, or the so-called “biodiversity and ecosystem function relationships” (Naeem et al., 2009; Scherer-Lorenzen et al., 2005; Schulze and Mooney, 1994).
Diversity has also traversed into the humanities, for example, by playing a prominent role in urban planning, community design, and urban studies (Hester, 2006). Biological metaphors and analogies are widely used to explain the form and function of cities (Alexander, 1966; Geddes, 1915; Howard, 1902; Jacobs, 1961; Mumford, 1938), although the analogy of a machine was dominant during the 20th century (Batty and Marshall, 2017). Jacobs (1961) noted that the city is “organized complexity,” following Weaver (1948), an organic synthesis that emerges from the countless interactions between a variety of components. Arguing that “the generators of diversity” induce four conditions for the livability or decline of the community, Jacobs considered the presence of small–medium enterprises in the city as one source of diversity and innovation generation (Jacobs, 1961, 1970). Glaeser et al. (2001) discussed the “four particularly critical amenities” for the livability of a city, which, “first, and most obviously, is the presence of a rich variety of services and consumer goods” (Glaeser et al., 2001: p. 28).
However, few studies have attempted to quantify city diversity at the neighborhood scale, even though Jacobs claimed the importance of diversity at this level. In urban economies, most existing research on diversity has focused on the city, regional, national, and international levels (e.g., Duranton and Puga, 2000). From the viewpoint of urban ecology, Hester (2006) researched the relationship between urban morphology and diversity on different spatial scales, including the neighborhood; however, he did not focus on quantifying the concept of city diversity.
This study attempts to fill this gap, namely, to quantify city diversity at the neighborhood scale. Through the application of a species diversity indicator derived from biology (for a review, see Magurran, 2004), we examine whether a correlation exists between this diversity index and a QOL index at the neighborhood scale. While quantifying QOL is a very broadly defined and challenging task, in this study, we focus on a specific aspect related to the presence and vitality of a wide variety of commercial locations. More specifically, QOL is estimated by the revenues of surrounding stores in an environment, which could be one of the factors in creating an attractive and secure neighborhood environment. As we discuss in the remainder of this paper, hub stores, which are defined as stores with the largest revenue within a grid, are a key factor for the surrounding neighborhood because they can attract people from both nearby and faraway and promote neighborhood exploration, resulting in improved livability within the district. For this reason, investigating the presence and distribution of hub stores is a key methodological step in our analysis.
Regarding the species diversity indicator, several types of diversity indexes have been proposed in the literature to measure richness, evenness, and their combination in the ecosystem (Krebs, 1989; Magurran, 2004; Magurran and Mcgill, 2011). For example, MacArthur (1955) proposed applying the Shannon–Weaver information theory (Shannon, 1948; Shannon and Weaver, 1949) to biology, while Margalef (1957, 1963, 1968), arguing for stability and complexity, proposed applying information theory to ecology. Using these indicators, the relationship between the complexity (diversity) and stability of an ecosystem has been discussed in the biological sciences (Landi et al., 2018).
However, such discussions suffer from bias resulting from changing the sample size to be applied (Lande, 1996; Morishita, 1996). Overall, there seems to be a lack of agreement regarding which index is the most appropriate for measuring biodiversity because “there is no one metric that perfectly quantifies biological diversity” (Magurran and Mcgill, 2011: p2). Thus, “the most commonly used indices are used primarily because they have been used before, and not necessarily because they provide useful information” (Maurer and McGill, 2011: p55).
Within this framework and limitation, Rueda (1995, 2002) extended the idea of the species diversity indicator to the urban built environment by quantifying urban complexity in view of the set of urban organizations in a city (e.g., economic activities, institutions). While biologists quantify the evenness of species distribution in terms of type and individual numbers on a specific spatial scale, our study follows Rueda’s idea and focuses on urban economic entities in a spatially determined area of the city. Additionally, we compare the obtained results with the revenue of retail stores in the surrounding neighborhood. Thus, this application in the urban environment enables us to discuss the relationship between diversity and vitality at the neighborhood scale, similarly to how biologists research the structure and function of the ecological community as being composed of various species in nature. Thus, our contribution is to quantify and uncover how the degree of city diversity impacts the neighborhood in terms of economic prosperity. The resulting theoretical, empirical, and policy implications are the novel contributions of this study.
Materials and methods
We apply diversity metrics and concepts of natural communities to human ones, namely, cities. While biologists consider diversity as the combination of the numbers and types of species in a determined space (e.g., a forest), we aim to express the commercial diversity in a city in terms of the numbers and types of retail structures and ecosystem–functional properties such as economic activity.
Figure 1 presents the analytical framework of this study, which consists of three steps. Diagram showing the computation of a diversity index for biology (a), (b), and (c) and the urban environment (d), (e), and (f). Diagram of the hypothesis to be tested in this research: (g-i) whether the higher/lower density of the store environment could lead to the emergence of a hub store, (g-ii) whether the environment with/without a hub store could lead to a higher/lower sales volume, and (g-iii) whether the higher/lower diversity of stores could lead to a higher/lower sales volume.
First, we determine the spatial units used to collect the samples for our study. Figures 1(a) and (d) show the case for biology and urban settings (i.e., a park and a city district, respectively). Second, we collect samples, namely, the biological species (i.e., insect) for the former and the economic entities (i.e., retail stores) for the latter (Figures 1(b) and (e)). Finally, we translate each species type into a digital ID and count the numbers and types (Figures 1(c) and (f)). Based on these prepared datasets, we aim to • Apply a biodiversity indicator (Shannon–Weaver index) to quantify commercial diversity in the city; • Study the robustness of the indexes versus the spatial scale within the study area and identify the most appropriate ones for the urban context; and • Test whether a relationship exists between urban diversity and QOL through economic activity.
More precisely, we test three hypotheses as follows: (1) We analyze the relationship between stores’ highly densified locations and the presence of a hub store (see Figures 1(g) to (i)) to determine if the agglomeration of stores is likely to lead to the emergence of a hub store, or if the presence of a hub store is independent from environmental factors such as density. (2) We examine the relationship between hub stores and sales volume (see Figure 1(g)-ii) to determine if the presence of a hub store could increase the revenues of the surrounding stores, which would result in increased total sales volumes in the nearby environment. (3) Finally, we determine whether the heterogeneous or homogeneous distribution of store types in the neighborhood could increase sales volumes (see Figure 1(g)-iii) to clarify whether and to what extent greater diversity could contribute to higher sales volumes for nearby stores.
Diversity index
Considering this background, this study employs the Shannon–Weaver diversity index (H) to measure commercial diversity in the city. We use this index because it has been used in the urban planning and urban studies community. One of the earliest attempts was made by the Barcelona Urban Ecology Agency (Rueda, 1995, 2002), which applied this concept to a set of urban organizations in Barcelona to measure urban complexity. The Shannon–Weaver diversity index (H) is given by

Spatial scale for the urban diversity index
Definitions of the basic unit of aggregation and other scale parameters are fundamental in spatial analysis. For instance, the relative strength of a spatial cluster could be radically different depending on the geographical scale used (Fujita and Thisse, 2013). For this reason, we defined the following distances as the spatial scale for our analysis: grid_d = (10m, 20m, 30m… 1,000m, in increments of 10m).
We applied the grid distance, grid_d, to set the size of the grid used to compute the diversity index. To assess the robustness of the analysis, we divided the study area into square cells of equal size grid_d, which changed from 10 m to 1000 m in increments of 10 m.
Definition of a grid with a hub store
One of the key concepts of this study is the neighborhood hub store. As mentioned earlier, hub stores can attract customers from nearby and far away. In addition, they can trigger trip chains among stores in the neighborhood (Yoshimura et al., 2018). Hub stores also attract many other stores, especially those that do not have higher attracting power (e.g., kiosks). Customer spillover from hub stores is, therefore, expected, since the other shops cannot lure customers by themselves (Eaton and Lipsey, 1982). As a result, they tend to form a spatial cluster at specific geographic locations (Yoshimura et al., 2020).
In this study, the presence of a hub store in a grid is determined by examining the distribution of the sales volumes of all shops in the grid. If the distribution is statistically similar to a power law, relatively few shops contribute to the vast majority of the sales revenue in the grid, and they can be considered hub stores. Here, we specifically define the hub store as the store that produces the largest sales volume within a grid, provided that the distribution of the sales revenue in the grid is statistically similar to the power law. Although the cut-off issue exists (i.e., until which rank of stores can a store be considered a hub store?), we focus on the largest store because our research explores the effects on the surrounding shops, rather than the effects on the individual store (i.e., which element, including the nearby stores, makes the environment special?).
To determine whether the distribution of the sales revenue in a grid is statistically similar to the power law, we applied the statistical test reported in Clauset et al. (2009). Note that our methodology is not aimed at identifying specific hub stores in a city; rather, it is focused on determining whether hub stores are present in a certain neighborhood, which is in line with the units of spatial analysis and research questions investigated herein. In addition, we analyze the agglomeration of stores at specific locations in terms of the number of stores falling onto the determined grid. Therefore, for the following analysis, we define a hub grid as a grid with a hub store.
More formally, we analyze the distribution of stores’ sales volumes in a limited area for the former and the distribution of the number of stores in a limited area over the city for the latter. Then, we check whether the distribution is statistically similar to the following power law

To test whether the power law is the best description for each dataset, we performed a comparative analysis of the goodness-of-fit of another possible candidate distribution for our datasets: the exponential function. In python, we compared the power law and exponential function fits to our datasets using the maximum-likelihood method and the log-likelihood ratio test provided by Alstott et al. (2014), which is the implementation of Clauset et al. (2009).
Correlation and causal relationship
The analytical framework for this study is based on correlation analysis. We analyze the correlations between the diversity degree indicator and stores’ sales volumes aggregated in the grid resolution. This is different from uncovering the causality by, for example, relying on randomly chosen small-scale samples, which can be best obtained from qualitative datasets that elucidate the agglomeration process in detail. Such studies attempt to understand which store is first located in the area and then attracts others, resulting in the spatial agglomeration, or they try to clarify the rules and system behind the economic spatial agglomerations. Conversely, the present work explores the correlations between the urban diversity consisting of the composition of stores and their revenues, aggregated in the grid resolution. We acknowledge that several possible confounding factors were not considered. For instance, examining the spatial clustering of store locations, it is unclear to what extent the process of locating a store is influenced by the presence of other stores. One way of accounting for this and extending this research is to enrich the models through traditional data collection methods (e.g., interviews or questionnaires). This way, it would be possible to start exploring causal relationships between the observed variables. Our approach can then be considered as complementary to conventional study methods.
Data sets
The dataset comprises a large number of transaction records made available to the researchers by a major Spanish bank. Specifically, it consists of bankcard transactions performed by two groups of card users in 2011: the bank’s direct customers, who hold a debit or credit card issued by the bank and make payments through any point-of-sale, and other bank cardholders, who make transactions through one of the data provider bank’s point-of-sale terminals around the country. The provided information includes a unique ID for each customer’s credit or debit card that, for privacy reasons, was not associated with the real ID of the customer or the bank card, the shop where the customer made the transaction, the timestamp of the transaction, or the amount of money spent. The data were aggregated and hashed for anonymization in accordance with all local privacy protection laws and regulations.
Basic properties for the individual categories.
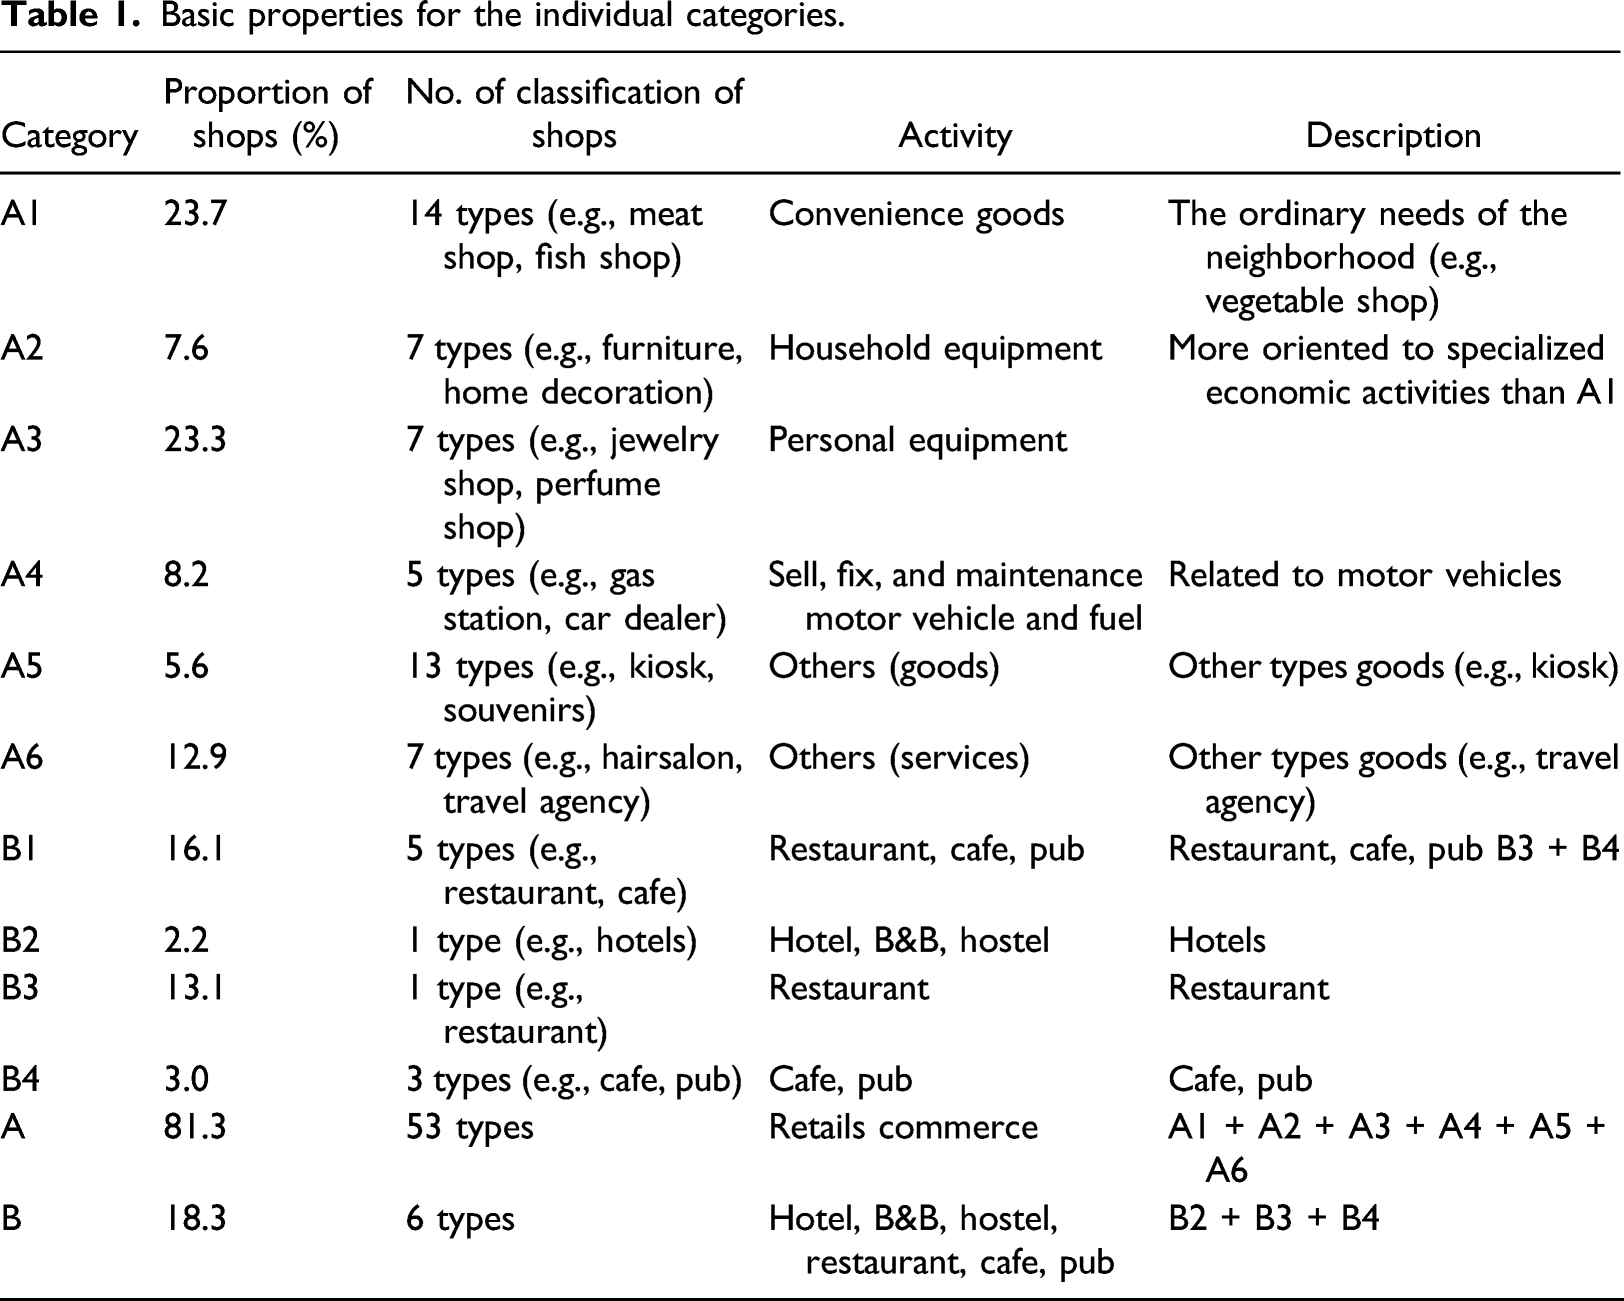
Regarding the cities, we selected the 50 most-populated cities in Spain at the time of the 2011 national census. Five cities in the original list were excluded because of errors during computation and replaced with those ranked below. The city selection criteria is based on the hypothesis that people tend to use their credit cards more in an urban area than in a rural area due to the different penetration rates of the credit card between cities: the larger the city size, the higher the penetration is between people. Furthermore, we need to be conscious that people in Spain tend to not use their credit cards for smaller purchases, compared with larger purchases. This results in a sample bias that we should be conscious of when interpreting the results. Considering these issues, we divided all cities into three classes depending on their populations: large, medium, and small. Basic information about the cities can be found in Supplementary Table 1 in the supplementary materials.
Results
Basic information for each city
Statistical analysis. The number of shops located in each city varied greatly (max = 40,987 in Madrid, min = 1137 in Lleida). Supplementary Table 1 in the supplementary materials indicates that the population of each city was largely independent from its area (Pearson’s r = 0.16). Furthermore, the area of the city and (1) the number and (2) types of stores were largely independent (r = 0.10 and r = 0.14, respectively). This suggests that a city’s superficial area cannot be a factor in predicting the number of stores in each city, resulting in heterogeneity in the stores’ spatial density. Conversely, we can see that the population in the city and (1) the number and (2) types of stores were strongly correlated (r = 0.98 and r = 0.79, respectively), suggesting that the demographic factors could help predict the number of stores and their variety in each city. Regarding the relationship with the total sales volumes produced in each city, we found that the population in each city and their total sales volumes were strongly correlated (r = 0.97); however, the relation with the area dimension was low (r = 0.12).
If we focus on the density of stores, this pattern changes radically. The densities of stores, divided neither by population nor area, show only modest correlations with the total sales volumes (r = 0.31 and r = 0.33, respectively). This is counterintuitive because one could expect that the higher the density of stores in a limited area, the higher the sales volumes. However, the total number of stores located in the city as a whole was highly correlated with the total sales volumes (r = 0.96, Spearman’s rho = 0.75, p = 0.01) and the number of store types (r = 0.74). However, the result changes significantly when we introduce the spatial element (i.e., density).
Correlation of urban diversity and sales volumes
Urban diversity and sales volumes. We examined whether greater diversity could generate higher sales volumes at the neighborhood scale. Thus, we computed Spearman’s rank correlation between the diversity index H and the total sales volumes.
Figure 2 shows Spearman’s rank correlations between the diversity index H and the total sales volumes for (a) large cities such as Madrid, Barcelona, and Valencia; (b) medium cities such as Bilbao, Santander, and Terrassa; and (c) small cities such as Reus, Cuenca, and Algeciras (see Supplementary Figures S1.1–S1.3 in the supplementary materials for an analysis of individual city-level examples). The results show a strong correlation for large cities that becomes stable after applying a 200-m grid. Conversely, for small–medium cities, the results become sparse when the grid size increases. A comparison among all cities, shown in Figure 2(d), reveals these differences. This result indicates that the greater the diversity in the grid, the higher the sales volume for the stores. Based on this, the following sections examine this relationship and its possible underlying mechanisms in more detail, based on 200-m grids. Box plot of Spearman’s rank correlation between H and the total sales volumes for (a) large cities, (b) medium cities, (c) small cities, and (d) all cities.
Distribution of stores and their sales volumes in the grid
Next, we analyzed the number of stores falling into each grid and their distributions over the city. First, we ranked all grids in the city in terms of their store numbers. Then, based on Clauset et al. (2009), we discerned statistically whether the distribution followed a power law.
The results showed that small–medium cities tended to follow the power law while large cities did not (see Figure 3(a), and Supplementary Table 2 and Supplementary Figures S1.1–S1.3 in the supplementary materials for an individual city-level analysis). This indicates that few grids contain vastly more stores, while other grids have fewer, and this tendency is more evident for small–medium cities than for large cities. We visualize these results in Figures 3(b) to (d). (a) Rank plot of city size, showing distinctions regarding whether the number of stores falling in the grid follow the power law (blue dots) or not (orange crosses). Examples of the distribution of stores’ highly densified locations in (b) Reus (small city), (c) Terrassa (medium city), (d) Madrid (large city), and (e) a composition of grids (200 m) for each city. Blue and orange indicate the grids showing the power law and the non-power law, respectively, while gray indicates grids containing fewer than four stores. Conceptual diagrams of the distribution of grids with a hub store for (f) Reus (small city), (g) Sabadell (medium city), and (h) Barcelona (large city).
We also analyzed the distribution of stores’ sales volumes in each grid. This analysis determines whether few stores generate disproportionally higher sales volumes in the grid, that is, whether a hub store is present. First, we ranked all stores in each grid by their sales volume and discerned whether the distribution follows the power law according to Clauset et al. (2009) (see Supplementary Figures S3.2.1–S3.2.3 in the supplementary materials).
The results showed that 10–15% of all grids in the large cities had a hub store (see Figure 3(e)), indicating that few stores in the grid could produce much higher sales volumes, whereas most stores generated lower sales volumes. Conversely, only 5% of the grids for small–medium cities followed the power law.
These results suggest that, from the viewpoint of sales volume, the grids with a hub store in small–medium cities were likelier than large cities to be agglomerated in fewer locations. Figures 3(f) to (h) show a conceptual diagram of this situation, in which few grids in small–medium cities had a hub store, whereas in large cities, more grids had a hub store. These results lead to speculation that small–medium cities could have single urban centrality (single-centrality), where many stores are spatially agglomerated. Conversely, large cities could have multi-centrality across the city, resulting in a widespread distribution of stores and their concentrations. Thus, in terms of the number of stores, the grid distribution for large cities does not follow the power law.
Relationship between densified store locations and the hub store. The present analysis did not reveal whether those locations (i.e., highly densified store locations and locations with a hub store) always and necessarily geographically coincided. To analyze this issue, we first ranked all grids in each city in terms of their store numbers. Then, we used the method described above to examine whether the grids could have a hub store. Finally, we performed Welch’s t-test to identify whether a significant difference existed in the average number of stores in each grid between those with and without a hub store.
The result (Supplementary Figures S4.1–S4.3 in the supplementary materials) showed that stores’ spatially agglomerated locations tended to have a hub store in large cities but not in small–medium cities (Figure 4(a)). Larger cities were more likely than small–medium cities to show a significant difference, which indicates that a hub store is likely to be surrounded by many other stores (Figure 4(b)-1); this tendency is more pronounced for large cities than for small–medium cities. Conversely, hub stores tended to be located in low-density environments in small–medium cities (Figure 4(b)-ii). (a) Rank plot of a city in terms of the number of stores showing a significant difference in the number of stores between grids with and without a hub store; (b) diagram of (i) single-centrality and (ii) multi-centrality with the distributions of hub stores. Diagram of (c) a single trip to the neighborhood triggered by the hub store and (d) a trip to the neighborhood triggered by the hub store and the trip chain among different store types. (e) Rank plot of cities in terms of sales volumes showing significant difference in the diversity index between those with and without a hub store. (f) Distribution of the number of cities in which the mean diversity index, following the power law, is significantly higher.
The previous section reveals that small–medium cities tend to have a single-centrality structure in terms of their store numbers and that few grids in small–medium cities have a hub store. However, the analysis in this section also revealed that highly densified store locations and the locations of hub stores did not coincide in small–medium cities, but they did in larger cities. This is intriguing because seemingly, highly densified store locations are not correlated with higher sales volumes in small–medium cities. Furthermore, this indicates that for small–medium cities, hub stores are located in different locations, where few stores are agglomerated. Conversely, larger cities tend to have a multi-centrality structure; thus, the presence of highly densified store locations and hub stores are largely co-located.
Relationship among diversity, hub stores, and sales volumes. The results presented in the previous section are consistent with those in the literature, where non-hub stores come to be located near a hub store because they expect spillover from hub store customers (Eaton and Lipsey, 1982). In fact, hub stores can trigger trip chains around these surrounding stores (Yoshimura et al., 2018), increasing opportunities for item purchases for not only hub stores but also surrounding stores (see Figures 4(c) and (d)).
However, a customer’s trip chain triggered by a hub store would not necessarily result in multiple purchases. Assuming the same type of stores surrounds the hub store (e.g., 20 shoe stores), the customer may choose only one such store for shopping. If, by contrast, various store types were located around hub stores, the customer could visit several stores to purchase different types of goods and services. Compared with the latter situation, the former would result in smaller overall sales volumes in the grids. This could be one reason most store categories are not spatially clustered, which has been reported in previous research (Yoshimura et al., 2020). This brings us to the second hypothesis, that the total sales volumes in each grid would be greatly affected by the composition of the types of stores near the hub store (i.e., by diversity).
To test this hypothesis, we examined whether greater diversity in a hub grid is significantly correlated with the total sales volumes in the grid. First, we ranked all grids in the city in terms of the diversity index. Next, we examined the distribution of the stores’ sales volumes in each grid and identified whether the grid would have a hub store to clarify whether grids with greater diversity are hub grids. Finally, we used Welch’s t-test to investigate whether a significant difference in diversity existed between grids with and without a hub store.
The results (for a statistical analysis of this distribution, see Supplementary Figures S4.1–S4.3 in the supplementary materials; for box and rank plots of the distributions, see Supplementary Figures S4.4–S4.6 and Supplementary Figures S4.7–S4.9, respectively) showed that grids with greater diversity tended to have hub stores when located in large cities but not in small–medium cities (see Figure 4(e)). This implies that the coexistence of different types of stores provides a positive environment for the emergence of hub stores, and this tendency is more evident for large cities than it is for small–medium cities (see Figure 4(e)).
These findings indicate that (1) hub stores are likely to be found in highly densified store locations, (2) grids with greater diversity are more likely to have hub stores, and (3) grids with greater diversity that have hub stores are substantially correlated with higher sales volumes. Finally, and more importantly, all these phenomena are more likely to occur in large cities than in small–medium cities.
Discussion and conclusions
These results could be interpreted as the hierarchical city structure argued by central place theory (Christaller, 1933; Lösch, 1944; (Lösch, 1954)). Based on a trade-off between various forces (e.g., centripetal force, centrifugal force), that would be expected to affect both the appearance and shape of cities (Fujita and Thisse, 2013; Krugman, 1996); a variety of goods and services would be highly agglomerated in some locations, forming a spatial hierarchy among them. The size and order of these locations vary greatly in terms of the functions they can provide. The higher ordered locations can provide more specialized goods and services, which hold all functions that the lower ordered locations can provide. Due to this nesting, the former would be expected to have higher diversity than the latter. One of our results reveal this aspect: the location’s function, in terms of its range of goods and services, largely depends on the size of the city to which it belongs. In addition, our findings go a step further: while previous studies have reported that higher ordered locations can attract more people, in terms of visitors, than lower ordered cities (Zhong et al., 2017), the present analysis presents evidence that neighborhoods with higher diversity are positively correlated with higher sales volumes, and this tendency is getting stronger in large than in small–medium sized cities.
Regarding the highly densified store locations on the neighborhood scale, two hypotheses can be derived. The first is that similar stores are agglomerated in a geographically limited area, and the second is that different store types are agglomerated (Duranton and Puga, 2000). Regarding the former, since customers can explore nearby stores to compare items and prices before making a purchase, the store owner can expect customer spillover from nearby stores (Eaton and Lipsey, 1982). This increases competition for stores, as the customer can choose only one store for their purchase. However, from the customers’ perspective, the physical proximity of similar stores makes it possible to check the quality of items by visiting different stores in person, which results in savings in search costs (Nelson, 1970). The latter case is the opposite: the district is full of different store types around the hub stores. In this case, customers are likely to make a trip chain between stores to purchase different items. Since store types differ in the cluster, the stores do not need to compete with each other. This would increase the probability of customers purchasing different items at different stores. Consequently, the total sales volumes in the neighborhood could increase.
(Yoshimura et al., 2020) previously reported that while store clustering locations made of only one category do not produce higher sales volumes, except for those selling personal items (e.g., jewelry), the spatial clustering locations featuring several categories can generate higher sales volumes. The results presented here reinforce these findings: more diversity locations, where a variety of retail stores are evenly distributed, display higher sales volumes than do lower diversity locations. In addition, Yoshimura et al. (2020) has focused on the specific case study of Barcelona, while the present research generalizes the findings by expanding the analysis to several cities. Consequently, we discover that our results tend to be observed in larger cities more frequently than in small–medium sized cities.
Therefore, our analysis provides clear value and novel perspectives to the existing research; however, some limitations should be noted. First, our dataset contains a possible bias in terms of the representativeness of credit card users and their utilization relative to the economically active population in the given area. For example, people might tend not to use their credit cards for small purchases. Therefore, this aspect needs to be explored in further research and should be considered when interpreting the obtained results. Second, this study does not consider the relationship between the density and diversity of economic entities. We demonstrate how the degree of the diversity index changes by sample size, but this does not mean that diversity is independent from density. This should be explored further in future work. Third, this research mainly analyzes the correlation between various spatial variables; therefore, the scope of this study excludes the possible causes of such observed correlations. One possible extension would be to take a qualitative approach (e.g., interviews, questionnaires), which enables researchers to explore causal relationships between the observed variables. Finally, the interpretation of the diversity index, which was developed in the biological sciences, for urban planning and urban studies should be explored further. In the biological sciences, the relationship between stability and complexity has been discussed in detail (Landi et al., 2018). Within this framework, diversity is positively evaluated if each species is evenly distributed in similar numbers within a targeted area. In urban planning and urban studies, it could be that the neighborhood/district has several types of stores with equal distributions. On one hand, it could be expected to increase urban resilience, but on the other, specialized neighborhood/districts would not be evaluated positively; this leads to an argument regarding what, in terms of city diversity, can be measured through the diversity index and why. If an adequate framework can be established to measure urban diversity, this tool would allow researchers to quantify urban commercial diversity and compare results among neighborhoods, helping to strengthen the field of urban planning and urban studies with solid scientific results.
Overall, our findings indicate a partial coincidence with the habitually made claim about diversity by Jane Jacobs. That is, the higher the urban diversity, the richer the QOL in the district, and vice versa. The present research elaborates on her statement in greater detail, as we focus on the relationship between urban commercial diversity and economic benefits on the neighborhood scale. A higher diversity of stores within a neighborhood is associated with higher sales volumes. These results highlight the importance of urban diversity for economic prosperity, which results in increased QOL for city neighborhoods. The findings make a novel contribution to the literature and provide evidence-based implications for urban planning for urban commercial diversity.
Supplemental Material
sj-pdf-1-epb-10.1177_23998083211050935 – Supplemental Material for Revisiting Jane Jacobs: Quantifying urban diversity
Supplemental Material, sj-pdf-1-epb-10.1177_23998083211050935 for Revisiting Jane Jacobs: Quantifying urban diversity by Yuji Yoshimura, Yusuke Kumakoshi, Sebastiano Milardo, Paolo Santi, Juan Murillo Arias, Hideki Koizumi and Carlo Ratti in Environment and Planning B: Urban Analytics and City Science
Footnotes
Acknowledgments
We would like to thank the Banco Bilbao Vizcaya Argentaria (BBVA) for providing the dataset for this study.
Declaration of Conflicting Interests
The author(s) declared no potential conflicts of interest with respect to the research, authorship, and/or publication of this article.
Funding
The author(s) received no financial support for the research, authorship, and/or publication of this article.

Supplementary Material
Supplementary material for this article is available online.
Author Biographies
References
Supplementary Material
Please find the following supplemental material available below.
For Open Access articles published under a Creative Commons License, all supplemental material carries the same license as the article it is associated with.
For non-Open Access articles published, all supplemental material carries a non-exclusive license, and permission requests for re-use of supplemental material or any part of supplemental material shall be sent directly to the copyright owner as specified in the copyright notice associated with the article.
