




Abstract
Green space accessibility has benefits for promoting physical and mental health of urban residents. Many studies have investigated this measure but used limited cities. To fill this gap, this study visualizes green space accessibility for 4353 cities across the globe. Three global open datasets and two different scales (city- and national-scales) were involved for the analysis. We found that most countries and cities have a relative high value in terms of the green space accessibility, and those with a relatively low value are mostly located in South American, African, and Asian countries and cities. The results may be useful not only for local governments to implement precise planning for reducing potential inequality in access to green space, but also for researchers to further investigate the relationship between green space accessibility and various issues related to urban built-up environment.
Urban green space can be defined as forests, grasses, parks, gardens, street trees, and all kinds of vegetation in the urban built environment, which has benefits for urban heat island and noise pollution reduction, ecological systems and air quality improvement. Access to green space or green space accessibility, defined as a proportion of an urban population living within a certain distance from a green space boundary (Van Den Bosch et al., 2016), has also benefits for promoting physical and mental health of urban residents (World Health Organization 2016). Currently, many studies have investigated green space accessibility for different cities (Liao et al., 2021; Van Den Bosch et al., 2016). But, to the best of our knowledge, only limited cities have been involved into the analysis, and there still is a lack of study to investigate this measure for cities across the globe.
To fill the above research gap, this study aims to visualize green space accessibility for more than 4000 cities across the globe. We employed three categories of global open data to calculate this measure, that is, (1) The Urban Centre Database in the Global Human Settlement Layer (GHS-UCDB
1
). (2) Global 100m-resolution population dataset (WorldPop
2
). (3) Global 10m-resolution land-cover dataset (FROM-GLC
3
). These datasets were produced or updated in the recent years (between 2017 and 2019); moreover, the FROM-GLC dataset has also been verified as the most effective one for urban green space mapping (Liao et al., 2021). The data processing steps include: First, a total of 4353 urban areas with more than 0.1 million population were extracted from the GHS-UCDB dataset; and then, from the FROM-GLC dataset the four land-cover types (forest, grass, shrub, and wetland) that probably related to green space were extracted for each urban area. Second, a size threshold was used to filter the extracted green spaces in order to ensure that each patch was larger than 1 ha; and the reserved green spaces were further buffered with a 300m radius. These thresholds were used by referring to Van Den Bosch et al. (2016). Third, the green space accessibility was calculated for each urban area, that is, the proportion (%) of population that located inside the buffered regions. This measure was also calculated for each country, that is, the proportion (%) of total population that located inside all the buffered regions in a country. Finally, the green space accessibility was visualized at both city- and national-scales (Figure 1). Visualizing green space accessibility at city- (a) and national-scales (b).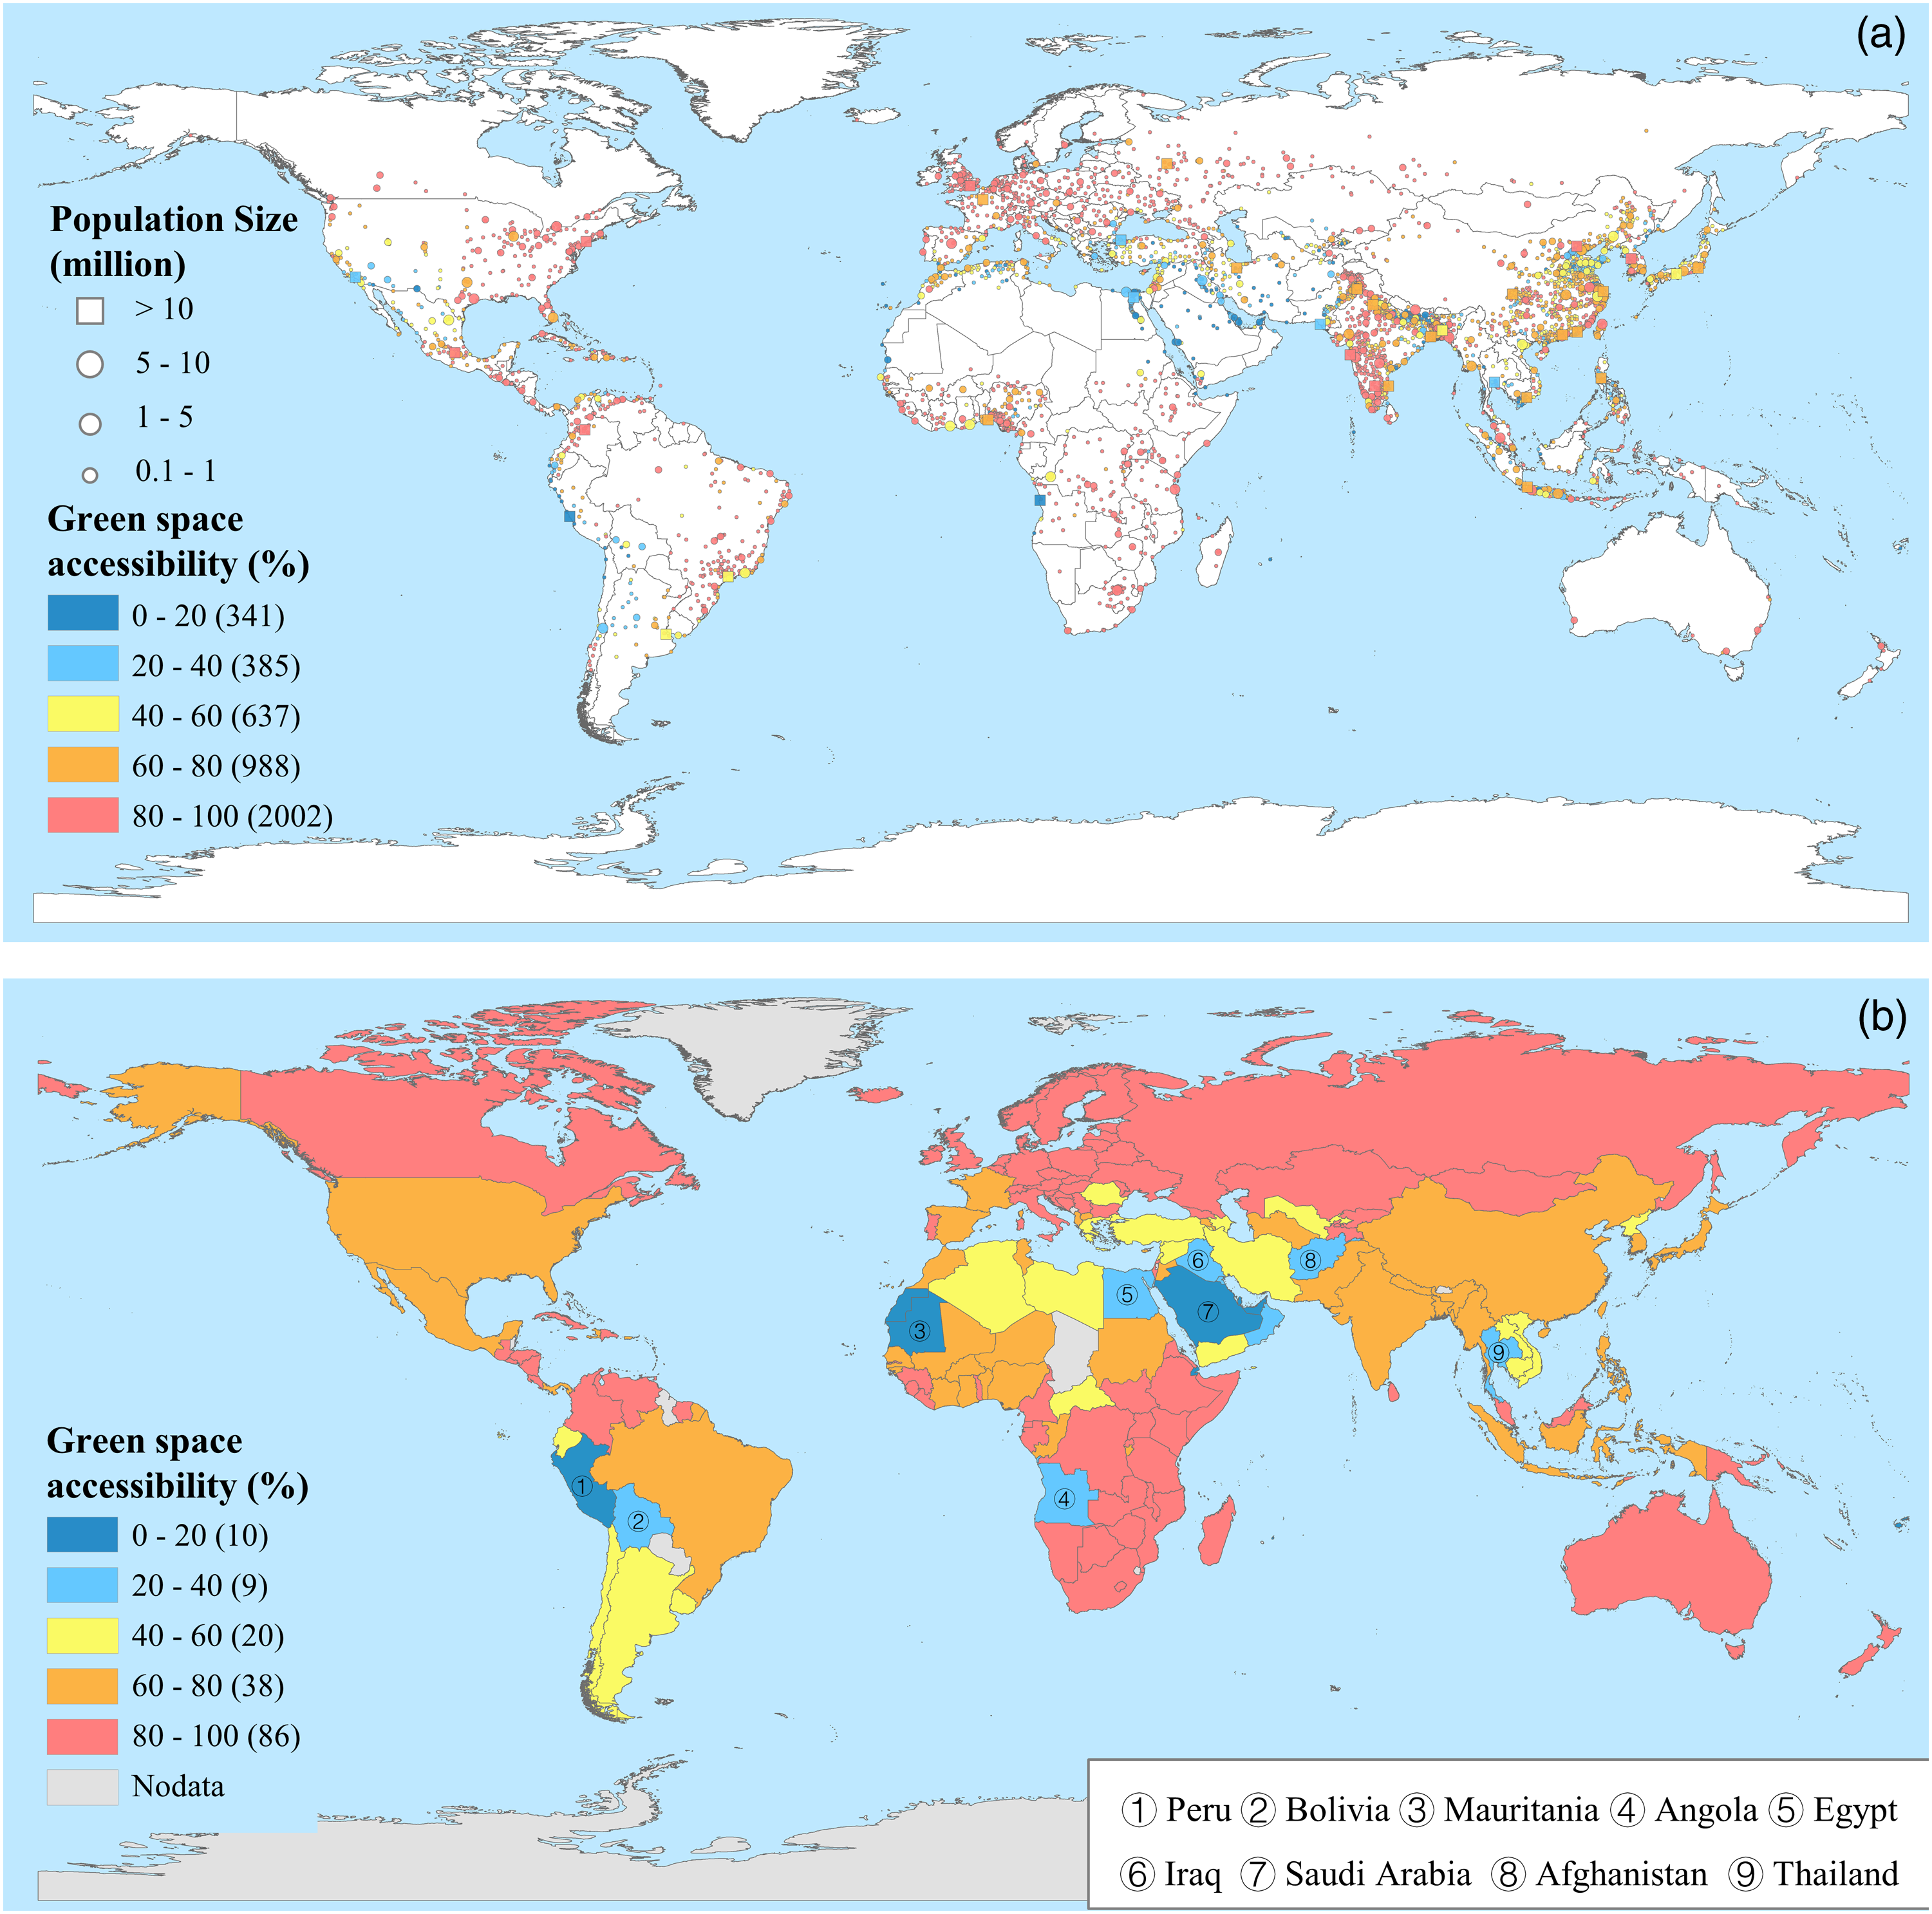
Figure 1(a) shows that most (2990) of cities in the world have a relatively high value (>60%) in terms of the green space accessibility. It means that in these cities, more than 60% of urban residents can access to green space (>1 ha) with a 300m distance. On the contrary, for 726 out of the 4353 cities, the green space accessibility is lower than 40%, and they are mostly located in the western part of South America (e.g., Peru and Bolivia), northern Africa (e.g. Mauritania and Egypt) and western Asia (e.g., Iraq, Saudi Arabia, and Afghanistan), as shown in Figure 1(b). Moreover, there may also exist differences for different cities in a country. As an example, in China, the cities with a relatively high value (>60%) are mostly located in the southeast and southwest, but those with a relatively low value (<40%) are mostly located in the North China. A similar case can also be found in India, in which country there is a clustering of cities that are characterized by a relatively low green space accessibility in the North (Figure 1(a)). Overall, the visualization results are useful for local governments to implement precise planning for reducing potential inequality in access to green space. The results may also be used for a cross-comparison of green space accessibility of cities across the globe, which has benefits for researchers to further investigate the relationship between green space accessibility and various issues (e.g., urban heat island, noise pollution, ecological systems, and air quality) related to urban built-up environment.
Despite the above advantages, it should also be noted that the green space defined in our study is related to all kinds of vegetation rather than public urban green space (e.g., parks and gardens) only. This is because currently there still is a lack of global dataset for public urban green space. Nevertheless, this limitation will be considered in our future work.
Footnotes
Acknowledgments
We would like to express special thanks to Yanzhao Yao, Yiming Liao, Xuanqiao Jing, Shuzhu Wang and Zhengxu Zhang from China University of Geosciences (Wuhan) for data processing.
Declaration of conflicting interests
The author(s) declared no potential conflicts of interest with respect to the research, authorship, and/or publication of this article.
Funding
The author(s) disclosed receipt of the following financial support for the research, authorship, and/or publication of this article: The project was supported by National Natural Science Foundation of China (No. 41771428) and Open Research Fund of National Earth Observation Data Center (No. NODAOP2021010).
