



Abstract
Social connections that span across diverse urban neighborhoods can support prosperity by mobilizing social capital. However, there is limited evidence on the spatial structure of individual social capital inside cities. This paper demonstrates that social capital measured by online social connections is spatially more concentrated for residents of lower-income neighborhoods than for residents of higher-income neighborhoods. We map the micro-geography of individual online social networks in the 50 largest metropolitan areas of the United States using a large-scale geolocalized Twitter dataset. We analyze the spatial dimension of individual social capital by the share of friends, closed triangles, and share of supported ties within circles of short distance radii (1, 3, 5, and 10 km) around users’ home location. We compare residents from below-median income neighborhoods with above-median income neighborhoods, and find that users living in relatively poorer neighborhoods have a significantly higher share of connections in close proximity. Moreover, their network is more cohesive and supported within a short distance from their home. These patterns prevail across the 50 largest US metropolitan areas with only a few exceptions. The found disparities in the micro-geographic concentration of social capital can feed segregation and income inequality within cities constraining social circles of low-income residents.
Introduction
Social networks are essential channels to share information, knowledge, and opportunities. Connections can help people in getting a job (Granovetter, 1995), in achieving higher wealth (Eagle et al., 2010) or career progress (Seibert et al., 2001). One possibility to theorize processes behind these widely observed phenomena is the concept of social capital that stresses the importance of resources that individuals can mobilize through their social connections (Coleman, 1988; Lin, 2001; Putnam, 2000). The structure of social networks is key in characterizing social capital (Borgatti et al., 1998). For example, network cohesion—often measured by triadic closure––is an important building block of social capital as it facilitates trust and the emergence of norms, while decreasing misbehavior (Coleman, 1990; Granovetter, 2005). In economics, common partners are thought to support the sustainability of cooperation links; thus, such supported ties are claimed to be essential for the accumulation of social capital (Jackson et al., 2012).
An early review of Mohan and Mohan (2002) stresses that geography is also an important factor in shaping social capital. For example, increasing geographical distance decreases both the probability of social ties (Liben-Nowell et al., 2005; Lengyel et al., 2015; Phithakkitnukoon et al., 2012; Sobolevsky et al., 2013) and the probability of closed triads (Lambiotte et al., 2008), implying the existence of spatial constraints to social capital. Bathelt et al. (2004) and Glückler (2007) discuss the importance of geographically non-local ties that are thought to boost economic prosperity by providing access to new knowledge and opportunities. Applying a weighted network approach, evidence suggests that individuals with spatially diverse social networks are wealthier than individuals whose connections concentrate in certain locations (Eagle et al., 2010). Yet, this previous research does not consider structural measures of social capital. Thus, how triadic closure and supported ties at geographical distance are related to the economic prosperity of individuals is still unknown.
In this paper, we aim to establish the empirical link between some structural measures of individual social capital in spatially projected social networks and income characteristics of home neighborhoods. This is done by using large-scale social media data to capture online social ties, which are an important layer of social connections (Brooks et al., 2014; Williams, 2006). The spatial projection of these online connections enables us to investigate the micro-geography Liu and Marx (2020) of individual social network structures across a wide range of cities. We demonstrate that neighborhood-level income is related to the spatial structure of social capital in the vast majority of investigated cities. In particular, we show that the social capital measures of residents in low-income neighborhoods are spatially more concentrated than that of residents living in high-income neighborhoods.
Cities have been long looked at as major places of the accumulation of social capital (for a comparison between individual and collectivist social capital in cities, see Portes (2000). Jacobs (1961) has stressed the spatial dimension of social capital very early by arguing that social ties of residents concentrate around their home neighborhood. This early conjecture has recently been confirmed with Facebook data from New York City: on average, around 40% of users’ friends live within 10 miles from their homes (Bailey et al., 2020). Paired with the prevailing assortative mixing of individuals in cities (Bokányi et al., 2021; Dong et al., 2020; Morales et al., 2019; Wang et al., 2018), this massive spatial concentration of social capital in cities has far-reaching consequences on neighborhood dynamics and can be associated with segregation and inequalities. In those cities where income difference is a major factor of assortative mixing such that social capital of the rich and poor are hardly overlapping, income inequalities rise (Tóth et al., 2021). Related case studies from Bangladesh (Bashar and Bramley, 2019), Brazil (Marques, 2015) and Hungary (Huszti et al., 2021; Méreiné-Berki et al., 2017) show that the concentration of social capital in poor urban neighborhoods facilitates trust and stronger social norms, but at the same time, limits social mobility. Such patterns can also be observed in large-scale social media data: the spatial concentration of Facebook friendships in New York City is stronger in areas with a lower average income and a lower level of education (Bailey et al., 2020).
We contribute to the above discussion by comparing the spatial dimension of individual social capital—captured by structural measures—in relatively poorer versus relatively richer neighborhoods across the 50 largest metropolitan areas in the United States. This is done with a large Twitter dataset containing geotagged tweets from which the home location of users, their mutual follower network, and the home location of their connections can be identified. We project the individual-level ego networks of users on census tracts that enable us to infer the average household income of the ego and alter by census tract level information from the American Community Survey. This way, we can map the structure and geography of social ties for more than 80,000 users across 50 US cities. Finally, we measure three aspects of individual social capital concentration in urban space within a circle of short distance radius (1, 3, 5, and 10 km) around the home location: the share of connections within the circle, triadic closure within the circle, and the share of supported ties within the circle.
Findings confirm that users living in neighborhoods of below-median household income have more spatially concentrated social networks. Residents of lower-income neighborhoods are embedded in social networks that are significantly more cohesive and include significantly more supported ties within a short distance. These patterns prevail, with few exceptions, in the 50 largest metropolitan areas of the United States. A significant negative correlation between the continuous value of neighborhood income and spatial concentration of social capital give further support to the finding. Furthermore, spatial concentration of social capital is associated with income assortativity because most spatially close connections of those living in relatively poorer areas are also residents of disadvantaged neighborhoods, among whom triadic closure is also more prevalent.
The study highlights that the social network of people from lower-income neighborhoods can offer limited access to opportunities in cities. We provide novel insights into individual-level social capital measures by mapping the concentration of triadic closure and supported ties in urban social networks. Moreover, we present individual-level social network features that can feed the segregation and inequality patterns observed inside cities.
Data and technical approach
We use a unique database obtained from the online social network site Twitter. It contains a large fraction of tweets (i.e., short user messages on the site) that are “geotagged” meaning that they have meta-information on the location from which they were sent. These tweets originate from users who enabled the exact geolocation option on their smartphones. The dataset contains tweets collected between 2012 and 2013, when exact geolocation sharing was an opt-out option for mobile devices, and as such, it has been more widely used on the site compared to later time periods. After 2015, tweets with GPS coordinates became rare that makes the construction of spatial network with this precision difficult. As a result of a careful sample selection described in Dobos et al. (2013), this dataset provides a noteworthy setting to study urban mobility and spatial social networks inside cities (for related studies, see Bokányi et al., 2016; Bokányi et al., 2017; Bokányi et al., 2021; Kallus et al., 2015; Kallus et al., 2017).
To identify the home location of users, the Friend-of-Friend algorithm (Huchra and Geller, 1982) was used to cluster messages in space. Any two tweet coordinates are considered to belong to the same cluster, if their separation is less than 1 km. For each cluster, the first two moments of the coordinate distribution are determined. Before calculating the mean coordinates of the cluster, data points are trimmed until all points are inside a 3σ radius to eliminate outliers. For more details about the process, see Dobos et al., 2013; Kallus et al., 2017. We focus on the three highest cardinality clusters with a minimum of 50 tweets on weekdays. Following (Bokányi et al., 2021; Lambiotte et al., 2008; McNeill et al., 2017), the cluster with the highest share of tweets sent between 8p.m. and 8a.m. on weekdays is identified as the home location of users. Figure 1(a) illustrates this process through an example user. Identification of home location and the spatial projection of individual social networks. (a) Home locations are identified as the places with the highest share of tweets in the morning (0:00–8:00) and in the evening hours (20:00–24:00). The histograms illustrate the process through an example user. The selected home cluster is marked by red. (b) Spatially projected social network of an example user. The home of ego is marked with red and home of alters are marked with blue. Home locations are characterized by the relation of the average household income in the respective census tract to the median income in the city.
The social capital of individual users is characterized by the structure of their ego network on the site (Borgatti et al., 1998; Brooks et al., 2014). The online social network of users is defined by their mutual followership ties on Twitter. To concentrate on meaningful ego networks, we only consider users with at least 10 geolocated friends in the same metropolitan area. The spatially projected social network of an example user is visualized in Figure 1(b). It is important to note that ties ranging outside the focal metropolitan area are disregarded, because we limit our analysis to the social capital encoded into relationships within the same metropolitan area. Additionally, we use American Community Survey (2012) data on average household income and population at census tract level to proxy the socio-economic characteristics of home locations. For simplification, we calculate the median income of census tracts for each metropolitan area, and categorize each tract as being above or below the median income of each city. Our final sample consists of 86,177 users. The distribution of users across the 50 metropolitan areas is available on Figure S1 in the Supplementary Material. Figure S2 illustrates the relationship between observed users and population of US metro areas, while Figure S3 presents the distribution of income and education in our sample and in the official census data.
We illustrate the spatial concentration of social ties with three different measures using concentric circles around the home locations. First, we calculate the share of friends (number of friends divided by the total number of friends) within these circles cumulatively, similarly to (Bailey et al., 2020). Second, we also consider the change in the cumulative measure by taking its first derivative. Third, we count the number of additional friends within each subsequent concentric annulus normalized by their area to obtain spatial connection density.
We also consider two approaches to quantify the structural cohesion of connections close to home. We first measure the local clustering coefficient of ego users in their subnetworks within concentric circles around their identified home locations. The formula of this metric is given by

Second, we use the supported tie measure related to individual social capital introduced by Jackson et al. (2012). Contrary to local clustering that is calculated for nodes, support is an edge characteristic. A social tie is considered to be supported, if the two nodes linked by the relationship have at least one common partner. The formula for the share of supported ties in the subnetwork of users is the following

Illustration of our key variables on an example graph.

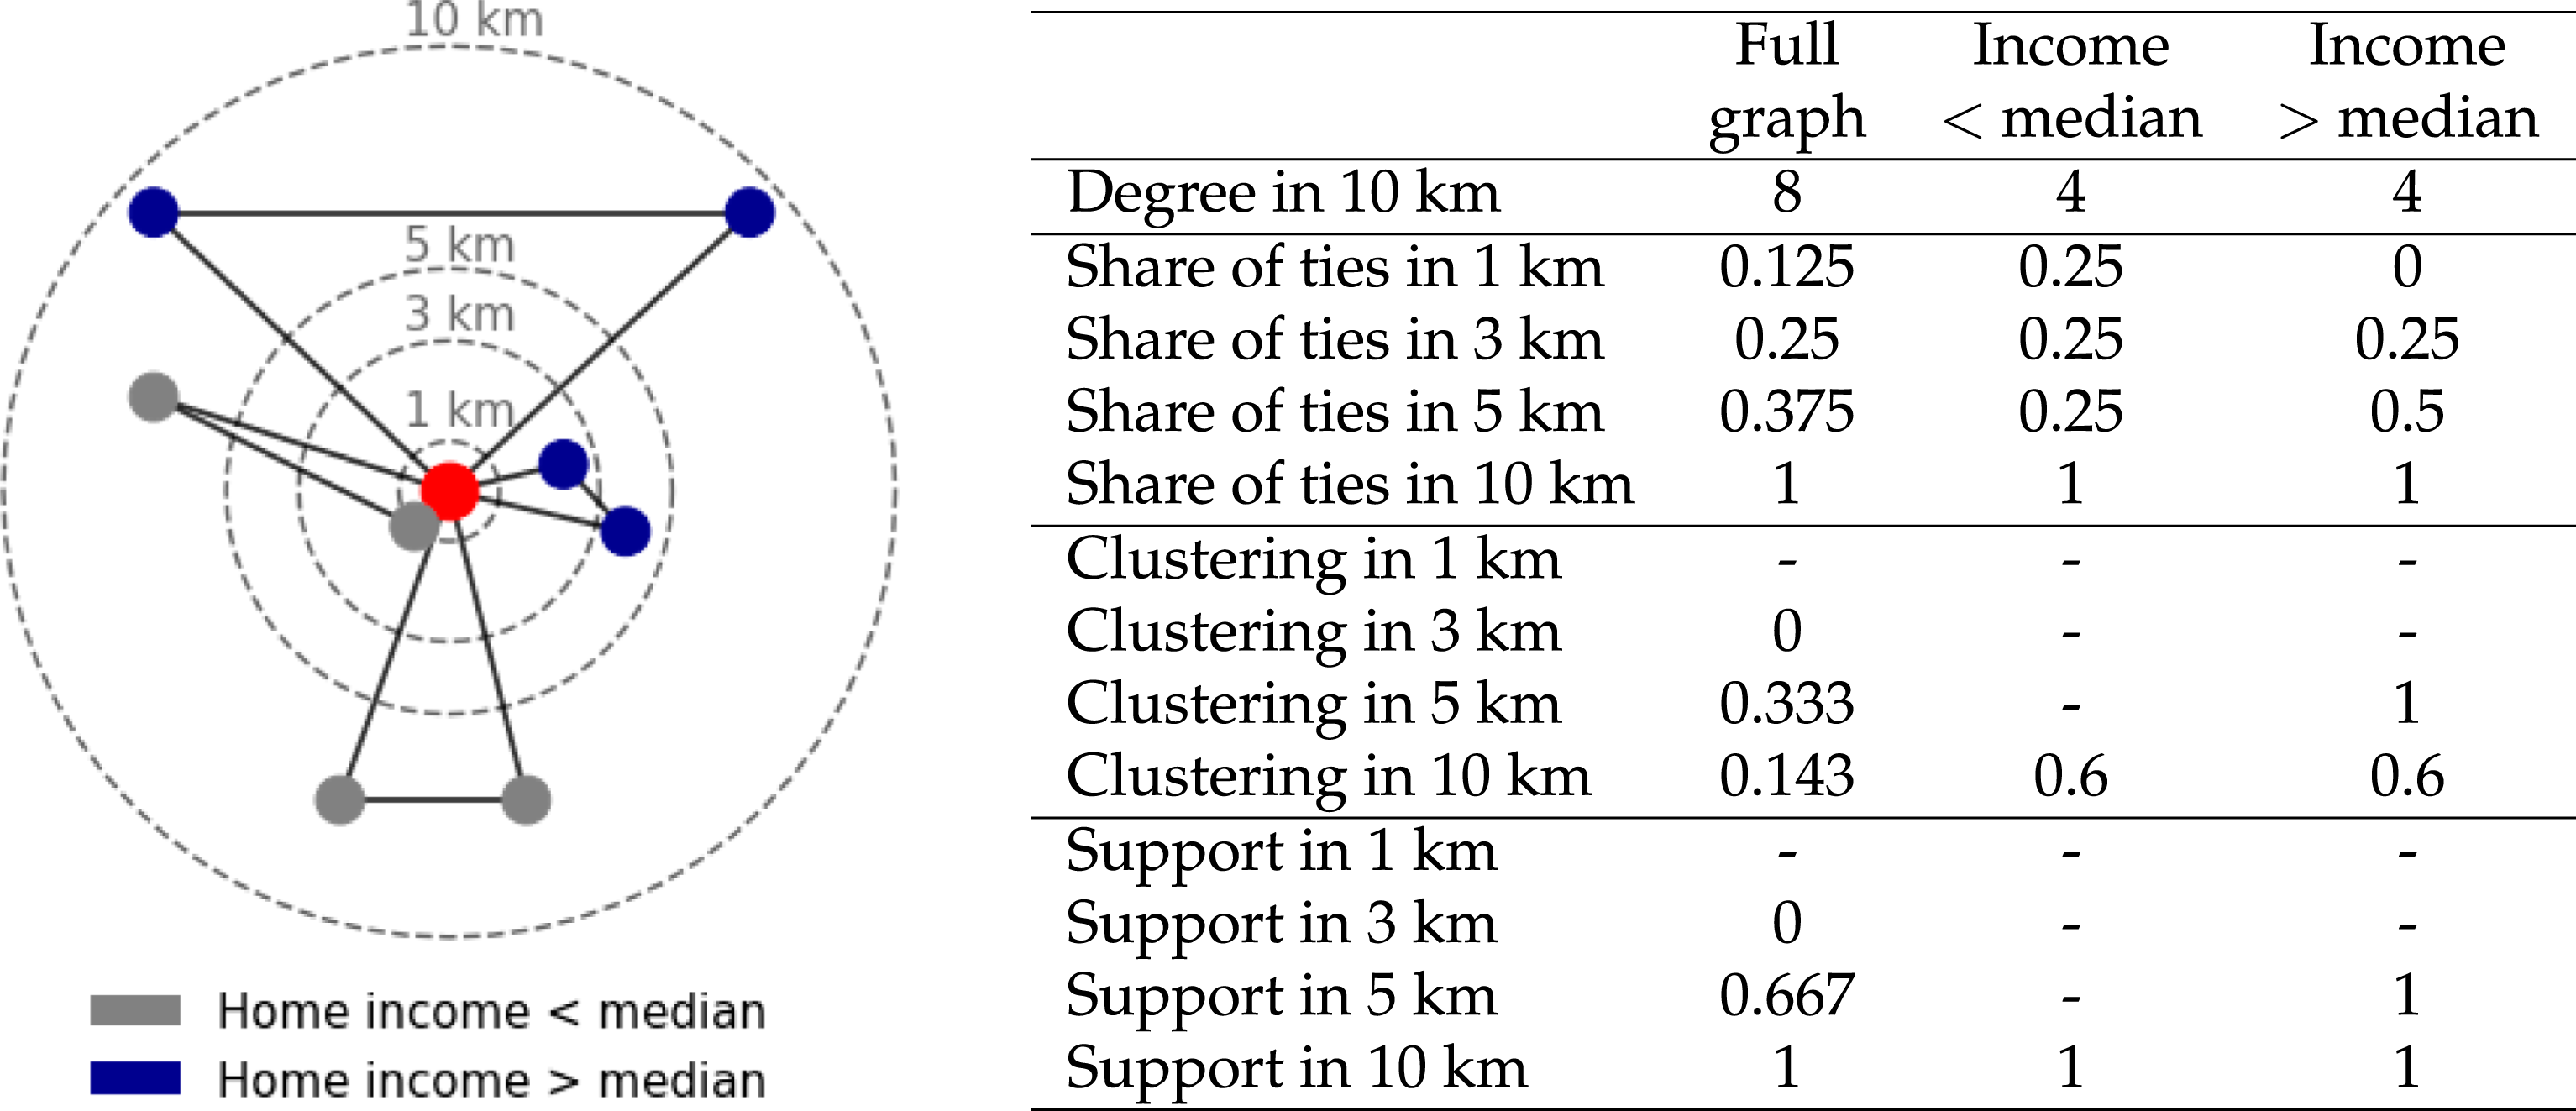
The red node represents our focal user. The color of the nodes refers to the income level at the census tract of users. The table describes the social capital related measures calculated within 1–3–5–10 km for the focal user on the example graph.
To consider assortative tie formation, we construct all these variables on income-based subnetworks of users. More precisely, we create two more ego networks for each individual, where we only consider friends living in above-median or below-median income level neighborhoods. This allows us to measure whether these structural features are more prominent inside income groups. Table 1 illustrates that the example user has 25% of ties in only 1 km toward lower-income friends, but the network is more clustered and supported amongst wealthier people in 5 km.
Results
To illustrate the concentration of individual social capital inside cities and to compare individuals from low- and high-income neighborhoods in this respect, we use three different approaches in Figure 2. As Figure 2(a) shows, an average user living in either a below- or an above-median income neighborhood has between 40% and 50% of their ties within a 10 km radius around the home location. We find that concentration of ties is stronger for people living in lower-income neighborhoods (home income Concentration of social ties around the home location of users in the top 50 metropolitan areas of the United States. (a) Cumulative share of connections in 10 km distance from home location. (b) Average share of connection at the distances from home in 10 km. (c) Probability density of ties in 10 km. (Normalized by the respective areas). All three figures represent average values for users across the top 50 metropolitan areas of the United States. We only consider users with at least 10 connections with identified home location. Median income is calculated for each metropolitan area separately.
In Figure 3, we proceed by comparing the 95% confidence intervals of the mean values for social capital measures of lower- and higher-income neighborhood residents. In general, there is a clear pattern that users from lower-income neighborhoods have a spatially more concentrated ego network, and on average, their ties are more cohesive and involve a higher share of supported relationships in close proximity to their home. Figure 3(a) illustrates that the share of ties is significantly higher in lower-income neighborhoods in 1, 3, 5, and 10 km circles. Measuring the average of local clustering in the ego networks of individuals trimmed to concentric circles around their home tells us in Figure 3(b) that higher-income neighborhoods concentrate significantly more closed triads in 1 km than lower-income neighborhoods. Because triadic closure is negatively correlated with degree, the lower-income neighborhoods having more connections within the 1 km circle might lead to this difference. Therefore, it is even more striking that triadic closure is significantly higher in the 3, 5, and 10 km circles for lower-income neighborhoods despite a higher share of friends for the same distance thresholds, with more than 10% of the triads being closed. Concerning the share of supported ties, Figure 3(c) documents that spatial concentration of supported ties is the highest among the social capital indicators. More than 40% of supported ties are within 1 km and more than 60% within 10 km. Residents of lower-income neighborhoods have significantly higher shares of supported ties in all distance categories. To illustrate the underlying tie concentration distributions behind Figure 3, Figure S4–S9 in the Supplementary Material show the share of ties at different distance thresholds, in different income groups across metro areas. Structural features of individual social networks inside 10 km. (a) Average cumulative share of connections in 1/3/5/10 km for above and below-median income user groups. (b) Average local clustering coefficient for higher- and lower-income groups in 1/3/5/10 km. (c) Average tie support for users in above or below-median income neighborhoods in 1/3/5/10 km from their home. Error bars represent 95% confidence intervals from bootstrap sampling.
In Figure 4(a)–(c), we illustrate the relationship between the income category of home neighborhood and the spatial concentration of social capital in each of the 50 metropolitan areas. The precise description of this controlled correlation can be found in Section S4 of the Supplementary Material. Negative coefficients mean that users in the respective city with above-median income tend to have lower share of their friends, lower triadic closure, and lower share of supported ties in 10 km from their home. Results suggest that in most of the cities, residents of above-median income neighborhoods have lower share of connections (Figure 4a) and lower number of supported ties (Figure 4c) in 10 km distance. In case of the local clustering coefficient (Figure 4b), the picture is more mixed (19/50 cases the coefficient is positive) but exceptions from the general trend are only few in case of share of friends (7/50) and the share of supported ties (12/50). Interesting exceptions are San Francisco, Detroit, Baltimore, and New Orleans, which suggests that both prosperous and segregated cities can deviate from the trend. However, the general tendency is that people living in lower-income neighborhoods have more concentrated social capital. Strong relationships along all three dimensions are observed for both metropolitan areas with high population such as Los Angeles and Miami, and at metro areas with smaller population such as Buffalo, Raleigh, and Salt Lake City. Controlled correlation between above-median home income and social capital–related measures in 10 km from home location. Dots represent linear regression coefficients for each metro area (see Section S4 of the Supplementary Material for more details on the models). The color of nodes indicate the sign of coefficients (gray denotes negative and blue denotes a positive relationship) and horizontal lines represent 95% confidence intervals. Nodes with lighter colors indicate statistically insignificant coefficients.
User level linear regression models with metropolitan area fixed effects.

The number of observations is smaller in case of clustering and tie support because their calculation requires at least 2 ties within 10 km distance.
Note: ***p < 0.01.
We include the population of the census tract as a control variable because these are not uniform even within metropolitan areas. As expected, population is significantly associated with the social capital measures. The negative correlation between population and share of friends within 10 km implies that people in populous neighborhoods tend to be connected to others in distant neighborhoods. On the contrary, the positive correlations between population and triadic closure and share of supported ties suggest that the size of neighborhoods facilitates spatial concentration of social capital by enabling network cohesion. (Population is negatively associated with triadic closure and has no significant relationship with supported ties in the 1 km circle, as reported in the Supplementary Material Section S5.)
Moreover, we also include the overall degree of users (irrespective of the distance of friends) as a further control variable. This way, we make sure that our results on the spatial concentration of the social network measures are not confounded by some users simply having an excess number of friends compared to others. The negative correlation between degree and share of friends within 10 km distance implies that having more connections goes together with a more widespread social network. A similar negative relationship is found for the clustering coefficient, which is unsurprising due to more friends having a lower probability of knowing each other. Conversely, the share of supported ties correlates positively with degree, implying that having more connections increases the probability of having at least one common partner with any one friend.
Further generalized robustness checks of the results in the form of regressions with dependent variables being the same measures within 1, 3, and 5 km distance from the home locations of users can be found in Supplementary Material Section S5.
Besides their structural features, we also investigate the homogeneity of the individual ego networks in terms of income level. To this end, we decompose individual ego networks analyzed above to income-based subnetworks that contain friends who live in either above or below-median income level neighborhoods. This enables us to compare the structural characteristics of social networks across income groups.
Figure 5 shows income segregation in all three approaches of social capital measurement. In Figure 5(a), we find that residents of higher-income neighborhoods have on average almost 60% of their ties to users living also in higher-income neighborhoods. Income homophily has an even greater role in the case of residents of lower-income neighborhoods: 70% of their friends live in lower-income neighborhoods. Similar patterns are found in terms of the clustering coefficient, and the share of supported ties. Users living in relatively poor census tracts tend to have higher closure in their networks among their friends who also come from lower-income neighborhoods. The tie support measure further corroborates this observation. Most of the ties users living in less affluent neighborhoods have to similar people in terms of income levels are supported relationships. Though homophily is also apparent in both of these measures among those coming from higher-income neighborhoods, its extent is always superior in case they are from lower-income neighborhoods. Taken together, income segregation is prevalent in social networks that span across neighborhoods in cities and can harm residents of lower-income neighborhoods who are typically connected to and accumulate social capital with lower-income residents. Homophily among the social networks of users within 10 km distance.
Discussion
Social capital is key for prosperity in life. This work contributes to the literature on social capital by illustrating that social network features of individuals measuring some aspects of social capital are spatially concentrated inside cities. This adds to the discussion in several points.
First, we show that connections of individuals strongly concentrate within only a few kilometers around the place of residence and these connections tend to be closed and supported. We find that the spatial concentration of social capital is stronger for people living in lower-income neighborhoods, which is a general observation across the top 50 metropolitan areas of the United States. The spatial concentration of social ties and social capital inside metropolitan areas confirms that edge formation probability is distance dependent even within cities (Bailey et al., 2020) not only at a larger spatial scale (Liben-Nowell et al., 2005; Lengyel et al., 2015). The geographic concentration of different social capital related network structures indicates that spatial constraints are important in the formation of the social fabric of cities. As such, home neighborhoods are crucial places for social capital accumulation, especially for the unprivileged. Therefore, when relocating individuals, social housing and redevelopment policies have to focus on changes in access to resources and norms embedded in people’s social networks (Méreiné-Berki et al., 2021).
Second, we adopt the novel individual social capital related network measure of (Jackson, 2020) to a spatial social network. Results suggest that similarly to the clustering of social ties, supported relationships are also highly concentrated within 10 km around home. We find negative correlation between the average income in a neighborhood with the share of supported ties within physical proximity and with the clustering coefficient.
Third, the pattern that the social capital of people living in lower-income areas is more concentrated in urban space connects to several other works on capturing societal challenges through online social media data (Bailey et al., 2020; Bokányi et al., 2021; Dong et al., 2020; Morales et al., 2019; Wang et al., 2018). Multiple studies address the problem that online social networks and interactions mirror offline segregation and inequality within metropolitan areas (Tóth et al., 2021). Our work is able to show the micro-foundations of these segregation patterns at the individual ego-network level. Moreover, using large-scale online social network data, we find a similar connection between income and social capital concentration as other studies based on interviews (Huszti et al., 2021; Marques, 2015) and surveys (Bashar and Bramley, 2019; Otero et al., 2021).
Our approach has some limitations. The definition of a social connection in this paper is based on mutual followership on the Twitter online social networking platform. While mutual followership signals mutual attention, due to biases both in the user-base and the sampling of the data, these relationships might not fully capture offline social relationships. Information is not available on the nature of social ties, that is, whether two mutual followers are family members, co-workers or friends from school. Future research might look into the concentration of social capital by investigating labeled and weighted online social networks. Adding context to social ties, for example, co-worker ties, school ties might be possible from different data sources, such as social networks inferred from register data. The context of ties might also be derived based on natural language processing of the messages sent on Twitter.
Even though our results are based on a relatively large sample from 50 different metropolitan areas, limitations in terms of representativity need to be noted. While the number of users within metropolitan areas included in our analysis is proportional to the population, the user samples can be unrepresentative of the whole population regarding age, gender, income, or ethnicity. We illustrate in Figure S3 of the Supplementary Material that the representativity of our sample in terms of income and education also varies across metropolitan areas. Other works present that within US Twitter users, African Americans are overrepresented (Hargittai and Litt, 2011), while other ethnicities might be underrepresented (Mislove et al., 2011; Malik et al., 2015). Following Webster (2010) and Sloan et al. (2015), users in our sample are most likely predominantly young and well-educated. Therefore, we might not be able to generalize our findings to the whole population of these metropolitan areas. (Pfeffer et al., 2018) suggests that the free 1% sample from Twitter Streaming API that was used for the initial data collection is prone to errors because of bot activity. By focusing only on mutual followership ties, imposing strict count limits in terms of connections and further spatio-temporal constraints, we tried to make our sample less distorted in this aspect.
The utilized Twitter data is unique in a sense that it enables us to map individual social networks inside cities. It was collected during 2012–2013 (Dobos et al., 2013), when it was relatively more commonplace to post Twitter messages with precise geographic coordinates than after 2015. However, this dataset is fairly old by now and is hardly refreshable. This introduces a series of limitations. Twitter has grown considerably since 2012 and our dataset only represents roughly the first half of adopters and their connections on the site. Given the robust patterns we observe across multiple cities, we believe that a richer, more recent sample would not drastically change our results. Our study uses neighborhood-level information from the American Community Survey to infer the socio-economic status of users by matching their identified home location to census tracts. The survey was conducted in 2012, while the data from Twitter was collected during 2012–2013, which again allows for some degree of bias. The socio-economic characteristics of the census tracts may be subjects to change over time and the individuals can also move to other neighborhoods. However, this study does not follow changes in the network structure or socio-economic indicators of people over time. A promising extension of this line of research would be to track how social capital changes when moving to different areas of a city.
Additionally, some census tracts might be diverse enough to mix below- and above-median income households (Hardman and Ioannides, 2004). Thus, follow-up research might proxy individual income at the census blocks instead of census tracts (Morales et al., 2019). Yet, we do not expect different results, because our findings are in line with previously demonstrated individual-level relations between income and the structure of spatial social networks (Eagle et al., 2010).
Moreover, we only map the concentration of ties around the home location of users. It is reasonable to think that the workplace of users or other frequently visited locations concentrate social activity and therefore connections inside cities (Hickman, 2013; Phithakkitnukoon et al., 2012). The recent study of Bokányi et al. (2021) illustrates that commuting indeed shapes the online social connections of people inside cities. However, the empirically observed home-work distance through Twitter data is around 6 km on average; therefore, we believe that a large share of potential co-worker relation is captured inside our 10 km threshold. To map the influence of work location on social capital concentration, further research is necessary. Additionally, distance from home and the observation of important locations that concentrate the social capital of people inside cities can vary by the population density of metropolitan areas. This is a possible reason behind the differences we observe even through the controlled correlation models behind Figure 4. Identification of locations away from home that shape the social ties of people in urban and rural areas is a promising related research direction.
An important future research direction would be to use online social networks inside cities to detect bridging and bonding functions of social capital (Brooks et al., 2014; Williams, 2006; Wachs et al., 2019). As we focus on the ego networks of users on Twitter, we mainly detect features that support bonding in our current setting. However, spatial network patterns that support bridging between income groups seems to be a promising direction for further research. It is important to note here that our measures are not directly dependent on the structure of the whole network of the metropolitan area, neither are they calculated from area-based metrics. Therefore, this large-scale ego-network approach is unique, especially at its scale, and we hope that future research will be able to make use of the anonymized network metrics published alongside this paper.
Supplemental Material
Supplemental Material - Income-related spatial concentration of individual social capital in cities
Supplemental Material for Income-related spatial concentration of individual social capital in cities by Ádám J Kovács, Sándor Juhász, Eszter Bokányi, and Balázs Lengye in Environment and Planning B: Urban Analytics and City Science
Footnotes
Declaration of conflicting interests
The author(s) declared no potential conflicts of interest with respect to the research, authorship, and/or publication of this article.
Funding
The author(s) disclosed receipt of the following financial support for the research, authorship, and/or publication of this article: This work was supported by the Ministry for Innovation and Technology from the source of the National Research, Development and Innovation Fund of Hungary (ÚNKP-20-4). This work was also supported by the Hungarian National Scientific Fund (OTKA K 138970).
Supplemental Material
Supplemental material for this article is available online.
Author Biographies
References
Supplementary Material
Please find the following supplemental material available below.
For Open Access articles published under a Creative Commons License, all supplemental material carries the same license as the article it is associated with.
For non-Open Access articles published, all supplemental material carries a non-exclusive license, and permission requests for re-use of supplemental material or any part of supplemental material shall be sent directly to the copyright owner as specified in the copyright notice associated with the article.
