
Abstract
Urban intensification and erection of high-rise buildings can affect the visibility of urban landmarks and pedestrians’ viewshed toward important monuments. Current 2D and 3D Isovist techniques use static rather than dynamic and cumulative view sheds to analyze visibility. The purpose of this research is to develop a method called ULVIA 1 to assess the average visibility degree of urban landmarks in urban design process. Several factors such as observer and environmental characteristics as well as the concept of cumulative viewshed (using Nurbs data and ray casting in Grasshopper) have been considered to develop this method. Ark-e-Alishah Mosque in Tabriz was selected as a case study and three alternative 3D urban models were reproduced based on data and aerial photos of the monument and its urban context in 2003, 2020 and a proposed model. The ULVIA is executed in sequential steps. The findings reveal that the 2003 urban fabric creates visibility with normal intensity and distribution in all paths, the 2020 option does not have this balance, and the difference between riding and pedestrian mode is higher. The final proposed alternative has a higher visibility intensity and better distribution in both pedestrian and rider modes than other alternatives and therefore UlVIA has the potential to be integrated into urban design process to assess various development alternatives to achieve the best results in terms of historical landmarks’ visibility from surrounding environments.
Introduction
Urban landmarks are critical elements of the city image (Lynch, 1960) that produce legibility and orientation (Biniaz and Hanaee, 2017; Jacobs, 2006; Koseoglu and Onder, 2011; Tibbalds, 2010), identity (Nasr, 2018; Tarkashvand and Majidi, 2013), responsiveness (Gharehbaglou et al., 2016), and durability (Tabatabaei, 2006) in cities. These elements might be ignored and threatened by the risk of extinction during physical transformations in cities if their function or visibility is impaired (Appleyard, 1969). Morello and Ratti (2009) state that we are always looking to identify and organize the urban environment, so it is better to facilitate these efforts rather than disrupt them in reshaping the urban environment (Morello and Ratti, 2009). This arises the question of: how to control the results of urban changes, to increase environment’s quality without compromising specific aspects such as environmental visibility or openness around landmarks during the design process. In urban design, an approach known as the analytical approach follows this issue. The field seeks tools for urban design’s control and assessment to create and support quality urban environments. These tools and indicators such as visual openness (Shach-Pinsly et al., 2007), visual exposure (An et al., 2015), sky view factor (Middel et al., 2018) and visual impact assessment help the urban design process and analysis of the existing situations and the proposed alternatives. The primary purpose of this study, therefore, is to provide a method to assess the visual impact of physical development around urban landmarks, especially those seen from a near distance.
The following sections review different methods and approaches used in urban design and landscape planning to study and assess visual impact assessment and landmark’s visual protection processes. Then a model called ULVIA is developed based on several factors including observer characteristics, environmental characteristics and the concept of cumulative viewshed and using Grasshopper software. This method then is being tested on a historical landmark in Tabriz known as Ark-e-Alishah in three stages of urban developments around the monument and the results have been presented based on optimum degree of visibility.
Literature review
In a general sense, awareness of the consequences of changes is the main discussion of Environmental Impact Assessment (EIA), which was initially discussed in environmental protection (Glasson and Therivel, 2013: p3). Part of this concept includes the visual impact of changes in the composition of available views due to landscape changes (Watson, 2003: p13). The process is called Visual Impact Assessment. These measures began in the 1970s in the United States with the development of visual management systems and gradually incorporated landscape classification, visibility of activities to sensitive users, and the landscape’s ability to absorb visual impact. Assessment methods have evolved since the 1980s with the development of visual simulation technology. These technologies led to improved visibility assessment and three-dimensional modeling to study landscape changes (Smardon, 2016). Another influential factor in this area is how to define the relationship between the observer and the environment. As Kwon (2007) brings up, the origin of contemporary visibility analysis is after achieving theoretical and empirical reasoning in psychology’s visual perception, especially the Gestalt school of psychology (Kwon, 2007). Environmental perception will be practical on the assessment method based on whether it is considered a top-down process -including the memory process- and bottom-up process (instinctively) (Démuth, 2013). In top-down perception, the environment’s quality is related to the observer and follows the observer’s preferences in the evaluation (Appleton, 1975; Abkar et al., 2011; Pazhouhanfar and M.S., 2014). In bottom-up perception, quality is considered in the landscape (Steg and Groot, 2019: p47). The methods developed in this section are mainly based on Gibson’s theory that considers the urban visual experience as the exchange of visual information between levels that can be perceived (Benedikt, 1979; Chang and Park, 2018; Turner et al., 2001; Yang et al., 2007). In this theory, perception is reduced to the sense of vision, but it should be noted that 87% of human perception occurs through vision (Nijhuis et al., 2011: p.22).
Visual Impact Assessment (VIA) is performed on a range of issues such as surveying development around the river (Wróżyński et al., 2016), improving the quality of the landscape around the historic wall (Ögçe et al., 2020), installing wind turbines (Depellegrin et al., 2014), highway projects (US DOT, FHWA, 1988), and the development of high-rise buildings (Van der Hoeven and Nijhuis, 2011). In urban areas, valuable buildings and landscapes are usually recognized and protected by law (Implementation group, 2012). An example of this is the Leiden Hall Tower construction in the city of London. The building’s original design blocked St. Paul’s Church’s view and was built in a sloping shape to prevent obstruction of the view (RSHP, 2015).
The use of the concept of visibility in this research field is determined under the studies' objectives. For example, in urban landmarks, which are the main subjects of this study, Kalin and Yilmaz (2012) assessed the pathways leading to Hagia Sophia, intending to find a path with the highest resolution (Kalin and Yilmaz, 2012). Using DSM data (Digital Surface Models), Cassatella and Carlone (2013) mapped areas of visual sensitivity to Turin’s urban landmarks. They were looking for tools to support high-level development (Cassatella and Carlone, 2013). Dinesh and KP, 2014 developed a visual assessment method for the Gramps temple by considering this temple’s visibility to be vital in all directions because the temple’s construction is primarily for worship and visibility from near and far (Dinesh and K.P., 2014). In the field of natural resources, due to the effect of seeing the vegetation on health and creating pleasure in the observer, the visibility of all vegetation is considered in the assessment (Malm, 2016: p151). Karimipour et al. (2016) examined the visual impact of high-rise towers’ construction on the visibility of valuable resources for a district in Tehran over 20 years (Karimpour et al., 2016). Oťahel et al. (2018) made valuable viewpoints by considering the landmarks’ visibility (Oťaheľ et al., 2018). Czyńska and Rubinowicz (2019) categorized valuable landscapes based on different levels of landmarks’ visibility. These studies have been done by considering a series of visual assessment attributes that can be put in three parts: the observer and environmental characteristics and visibility tools.
Observer’s characteristics in the urban environment have been developed differently to represent the assessment conditions more accurately. Part of this includes features related to the effect of physiological conditions on human perception (such as gender, age, height, field of view (FOV), and depth of vision and include discussions of perceptual thresholds (Pakzad and Bozorg, 2018: p.64). Another part is an answer to questions including who, how many, how, and where they see the landmark. The observer’s FOV is represented by visual field (54 horizontal degrees and 37 vertical degrees) or panoramic (Cassatella and Carlone, 2013). Human vision distance is considered as an absolute distance, with a threshold of about 1200 (Nijhuis and Reitsma,, 2011: p.249) or the weighted value (An et al., 2015), distribution of viewpoints in a uniform (An et al., 2015), random manner (Karimpour et al., 2016) and along the path (Wheitkamp, 2011), the availability of access points (Czyńska and Rubinowicz, 2019), and the type of use of space (Oťaheľ et al., 2018).
Regarding environmental characteristics, it is important whether atmospheric factors affect visibility or not (Danese et al., 2009; Malm, 2016). More importantly, it is representing visual obstacles that exist in the urban environment. These barriers include land topography, vegetation, buildings, billboards, urban facilities, and equipment (Dinesh and K.P., 2014) that may obstruct the view. Accessibility, accuracy, and simplicity of working with data affect their selection. The advantage of DSM data has been used in recent studies, including all features and vegetation (Cassatella and Carlone, 2013; Czyńska and Rubinowicz, 2019; Garnero and Fabrizio, 2015). Nevertheless, some studies have been done using vector data (Suleiman et al., 2011; Karimpour et al., 2016).
The main tools presented in the visibility analysis are Isovist in architecture and viewshed in the study of landscape and urban spaces (Czyńska and Rubinowicz, 2019; Llobera, 2003; Yang et al., 2007; Van Bilsen, 2008; Bartie, 2011). Isovist is a set of visible points from a certain point in space according to the environment. In other words, it determines the visible space from a viewpoint. Viewshed analysis identifies areas of the surface that are visible from one or more points. In other words, the viewshed is a binary representation of the visibility of a place from a specific point of view. It is usually calculated by the standard functions of GIS software from the numerical terrestrial model. The result is the Boolean variable, which determines whether each cell is visible from the point of view (value 1) or not (value 0) (La Rosa, 2011).
Visibility analysis tools and methods have achieved more popularity in urban design field recently but there still needs for further sophistication and appropriation of the methods to be integrated in the planning and design process. Koltsova et al. (2013) have developed a method for assessing visibility of facade surfaces and collaborated with an architect in a design competition to integrate theoretical and analytical aspects of their method with practical aspects of design. They checked the visibility from important points around the project site such as bus and tram stops, public spaces etc. to objects on the project using a parametric approach. Morello and Ratti (2009), extended the concept of “isovist” in three dimensions and examined how it could be used as a quantifiable method for Kevin Lynch’s urban analysis. They used computational and 3 dimensional visibility methods and new image processing techniques, which are called Digital Elevation Models (DEM), to contribute to Lynch’s five visual elements and the way they can be interpreted, to assess the environmental quality of urban forms. In fact, they tried to make Lynch’s perceptual methods and mental maps more quantifiable for evaluation of urban forms and their impacts on well-being and imagability.
Czyńska and Rubinowicz (2016) developed a method called VIS (Visual Impact Size) for visual impact assessment of tall buildings on the cityscape and used it in planning practice in many cities of Poland. This method helps the designer to measure how well a proposed tower is visible from different points of the city, using a 3D simulation model of the city.
The primary purpose of this study, as was mentioned, is to provide a method to assess the visual impact of physical development around urban landmarks. Urban landmarks, based on visibility, fall into two categories: those seen from a far distance and those seen from a near distance (Moughtin et al., 1999: p.103). Most studies have assessed the landmarks of the first group. In contrast, most historical landmarks are not much taller than today’s buildings due to the past architectural standards being strongly affected by possible changes. Therefore, an assessment method for this group of landmarks is essential. This difference in scale leads to a difference in method. One of the differences is that the visibility of the first category of landmarks or structures is reduced to one or more points or nodes (Czyńska, 2018; Garnero and Fabrizio, 2015), while the visibility of the surfaces is an essential feature of the second group of landmarks seen from a near distance. In a general classification, landmarks' visibility characteristics in urban space can be summarized in eight cases (Figure 1). These criteria’ importance is different in each field, and its consideration depends on its importance in the field under study. According to the definitions of VIA (Visual Impact Assessment), it is a measure to examine the impact of the proposed options (Karimi Moshaver, 2014). Visibility indexes of landmarks in urban environment.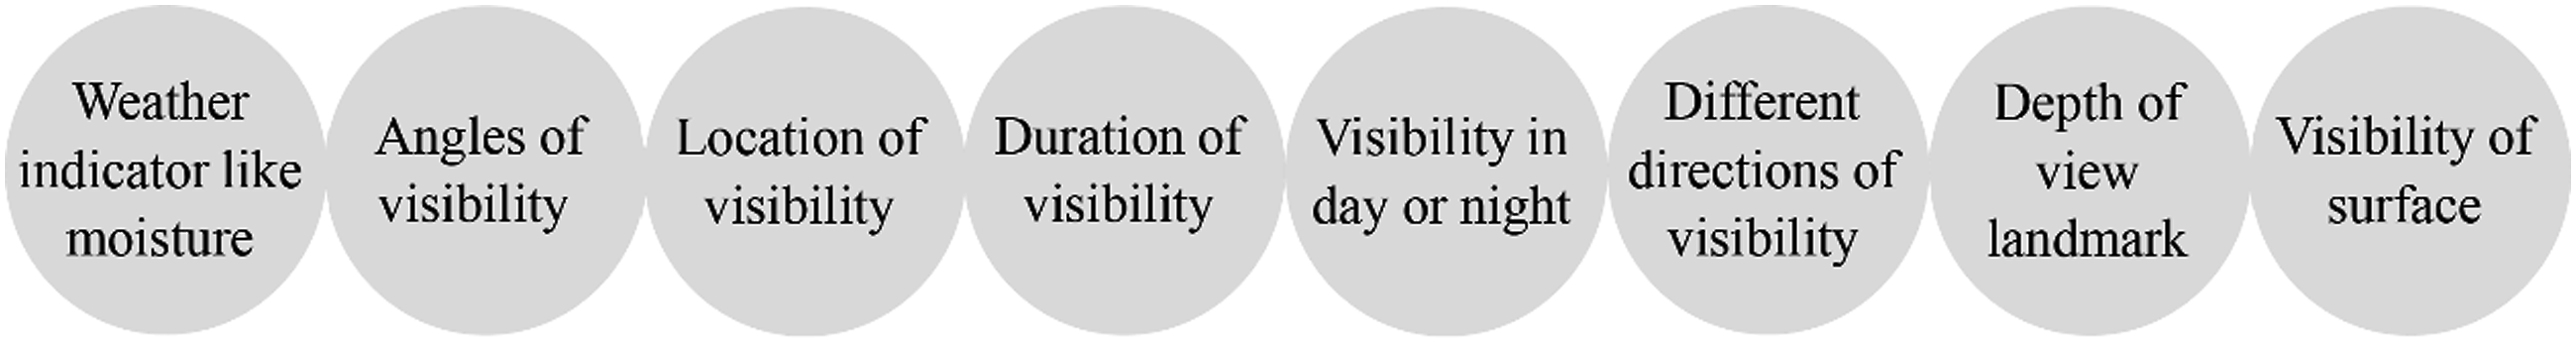
Methodology
Visibility defines the relationship between the observer and the environment around the landmark (Dinesh and K.P., 2014). In this study, the visibility of landmark surfaces per day in different directions by considering the distance and location of visibility has been considered. There is no specific approach to assess the visual impact (Caha, 2017; Morello and Ratti, 2009). However, the ULVIA method’s components, proposed in this paper, are distinguished in three steps, each of which has subsections. In the first step, the observer’s characteristics, including the FOV, height of the observer, distribution of viewpoints, riding or pedestrian mode of movement are determined. In the second step, the physical components of the environment that lead to obstruction of vision are determined. In the third step, the technique is performed on the model. The final step of the analysis of the results is performed using the indicators of minimum visibility, visibility intensity, and visibility distribution, making it possible to compare different options.
This study focuses on Ark-e-Alishah, an Ilkhanid mosque built between 715 and 739 AHS in Tabriz, Iran; It was part of the city’s defensive wall during the Qajar period. Ark is registered in 1931 as 170 national monuments of Iran (Figure S1 in the Supplementary Material) (Mansouri and Ajorloo, 2003). Due to the widespread criticism of the changes around Ark-e-Alishah until 2020, the assessment basis was placed before these changes, namely, 2003, the 2020 condition and an alternative designed option. Anyhow, examining how these actions affect Ark visibility is one of the main objectives of this study.
Observer and environmental characteristics
There are no preferences in the Ark’s visibility angle, so the importance of visibility is the same from any point. Its distribution has been done along the paths around the landmark. The number of viewpoints determines based on the periodic counting in the sections of the paths around the landmark. One viewpoint was assigned for every 300 riders or pedestrians. A total of 61 viewpoints were distributed according to the ratios determined in these paths (Figure S3 in the Supplementary Material). Observer height (pedestrian 165 cm and rider 120 cm) and FOV for rider and pedestrian are determined based on cone of vision from ladybug package. Due to the tendency to maintain the vision of landmarks in urban space and the lack of possibility of detecting it at a greater distance from the threshold due to human visual capacity, a vision distance of 1200 m is a good option for landmark assessment.
In this assessment, the models are used only to examine the obstruction of vision, so a shell of physical composition changes around the landmark is needed. Three-dimensional models are obtained by multiplying the number of floors by the height of 3.5 m per floor (Figure 2). The ark’s visibility has been examined in three positions from left to right in 2003, 2020, and alternative proposal. The 2003 situation is before the construction of the Mosalla (a big modern mosque) next to the monument, and 2020 is after completing the project. The alternative option is the 3D reconstruction of the original monument based on Mansouri and Ajorloo’s historical research.
Implementation of assessment method
The assessment technique is selected under the visibility characteristics of urban landmarks and the desired technique’s capability. However, the critical point is that not all features of the landmarks’ visibility (Figure 1) are equally important in determining the method. Urban landmarks are prominent elements that usually have a significant impact on pedestrians and are easily visible (Böcekli, 2003), and basically, observers need to see them. Thus, the appropriate space for visual assessment is a three-dimensional landmark, and executive techniques in a two-dimensional environment are not a good option in this assessment. Having a vision of the landmark in this study means that how the observer or observers who use the space around the landmark see the surface of the landmark. The visibility of surfaces, which is emphasized in visual assessment (Morais, 2018; Chang and Park, 2018), leads the assessment method to using data that can be worked on its surface and technique that assess surface visibility. Here, NURBS modeling is used to assess the landmark’s surface visibility. In the first step of the ULVIA method, the landmark model is divided into as many units as possible and used as a basis for assessment (Figure 3(a)). How the visibility changes in different options are evaluated based on changes in the visibility of these units. Between Isovist that assesses visible space and viewshed that represent what is that visible in FOV, viewshed is more appropriate. Run the procedure of visibility analysis on Landmark.
Following this stage, the importance of visibility from several points is raised. In urban planning, only one point is considered for assessment, but in most cases, such as urban landmarks, it is necessary to assess visibility from multiple points. For this reason, the concept of cumulative viewshed has been developed. Cumulative viewshed uses map algebra to combine viewsheds obtained from observation points at different locations (Danese et al., 2009). This feature is significant for the visibility of landmarks because they are visible from different viewpoints; therefore, a cumulative viewshed is an appropriate tool for analyzing landmark visibility.
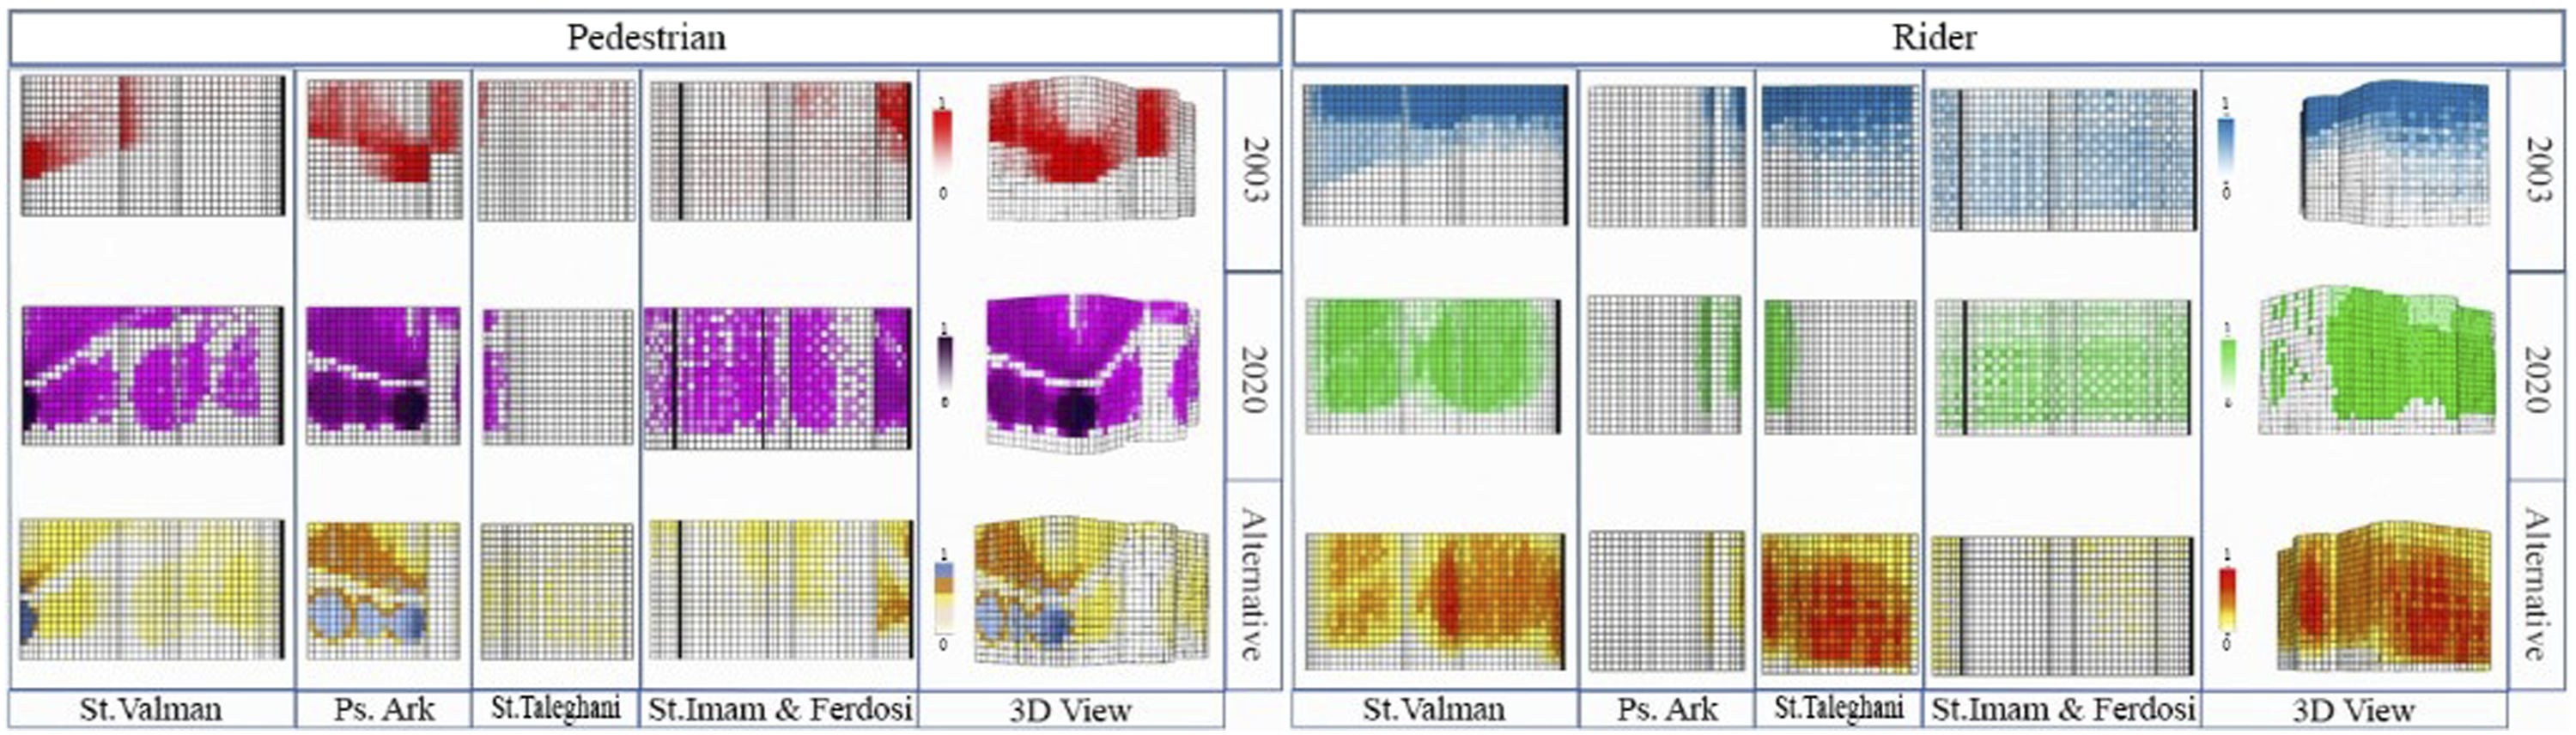
After selecting the technique, using the previous steps of the observer’s characteristics, the environmental characteristics are determined (Figure 3(b)). Then, using the Ray Casting method, for each angle of the viewshed, a beam is emitted equally to the depth of vision (Figure 3(c), after which the beams that hit the landmark surface are determined (Figure 3(d)). In the next step, the number of hits per unit is counted. This is done by defining the hit points in the rectangular tree algorithm as separate elements, and then counting the number of points in the bounding boxes with the center of each unit is done (Figure 3(e)). In the final step, the visibility status of the landmark is displayed on the landmark surface (Figure 3(f)), and the status of the changes can be analyzed using the defined indicators (Figure 4). This feature has been developed in the form of a component in the Rhino 6.16 software in the Grasshopper canvas. Differences between MV, IV, and VD. As seen in the figure, the difference in visual presentation in MV and IV results is only in the color spectrum used. There is no difference in place of the visible units, so to avoid repeating in the analysis result of MV uses IV images.
Indexes for analyzed visibility of urban landmark
These results show the visibility of each surface of viewpoints. To compare and analyze indicators, it is necessary to show differences in the visibility of different options. The difference between the options is in the changes in the visibility of the surface units, so the analysis of the visibility points relative to the surfaces is done.
Minimum visibility
This indicator determines each surface unit’s visibility or non-visibility, whether or not the beam has hit each one of the surfaces at least once. This indicator allows you to compare the overall visibility status of the landmark.
The intensity of visibility
Physical changes around the landmark may have blocked the vision of one point and directed the vision to the other, so in comparing the two situations, we should explain it. For this purpose, the VI index with zero amplitude shows a change in visibility on each surface. This index is obtained by dividing each surface unit’s visibility by the surface that has the highest number of beam hits. This criterion explains the change in observers’ situation, their distance, and other issues that can affect visibility from different angles, well.
Visibility distribution
The two previous indicators show the general state of visibility and where the focus of the landmark’s visibility is. Still, it does not state whether the changes made around the landmarks change the amount of visibility or where the changes occurred in which parts. Some changes in visibility can be neither decreasing nor increasing but is a change in the visibility location, which is well explained by this concept.
Results
Result of minimum visibility
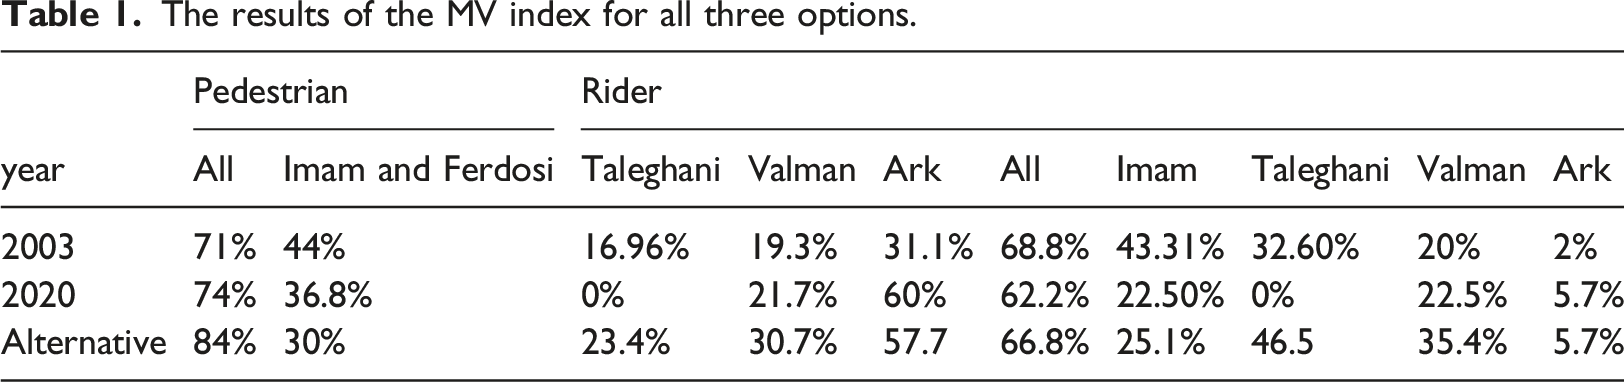
The results of the MV index for all three options.

Ark Monument and its surrounding streets. Counting directions of rider and pedestrian flow with periodic volume (10 min) method.
In 2020, the effect of the semi-translucent wall in the visibility of the Ark building’s lower parts (Figure 5) had shown their impacts on the degree of visibility. The blocking of the view from Taleghani and part of Valman had the greatest impact on MV’s result in all paths. The highest MV is related to the Ark, with the MV of 60% of the surfaces, and the lowest is on Taleghani. A total of 74% of the Ark surfaces are visible. The pedestrian MV in the alternative option is 84%. Considering the same viewpoints in the analysis, this option is seen at a higher surface than the previous options. Overall, the MV has increased by 3%. The conversion of the wall on the Pedestrian Street and Valman has increased visibility. The location of the mass on the northern front has reduced the visibility of Imam. This decrease is 14% in the base parts of Ark. The effect of mass displacement on pedestrian visibility from Taleghani has increased by 23.4% and 6.44%, respectively, compared to 2020 and 2003. Its impact on Valman compared to 2020 has increased by 8%, which is considerable (Table 1).
In the riding condition, the biggest challenge that Mosalla has created is the complete blockage of the view from Taleghani and part of the view from Imam and Valman. In 2003, in these three paths, the MV was 20.81% in Imam, 32.60% in Taleghani, only in Valman due to the short distance between the viewpoints, and the rigid wall was less and 2.50%. In the alternative option, the MV improves all paths except Imam; this is due to the placement of 15 m high mass between the observer and the Ark building.
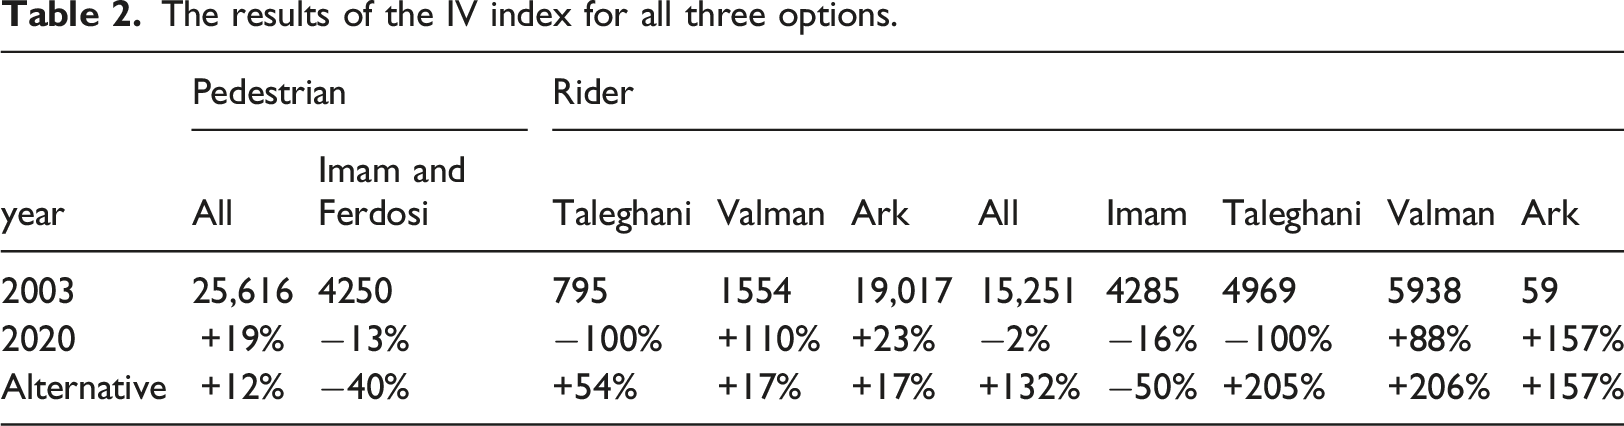
The results of the IV index for all three options.
Result of intensity of visibility
Visibility of Imam Street in 2003 was better and the changes made have led to the obstruction of vision in this path. The Ark building from Ark Pedestrian Street had the highest visibility in all three options, so that in 2003 the focus of view was on the upper part of the Ark building, in 2020, and the alternative option was up to 7 m high. The alternative option reduced part of the visibility by 7% due to the mass location (Figure 5).
In the riding condition, in 2003, all the paths, except for Ark, were relative of the same intensity Table 2. This situation is disrupted by the establishment of Mosalla in 2020, leading to a 2% reduction in total intensity. In this year, the focus of vision in the Valman has increased significantly by 88%. The alternative option changes have increased the VI to a maximum in Valman and Taleghani, and as shown in Figure 5, a higher level is seen with greater intensity. The important point in this option is the significant reduction of visibility in the Imam.
The IV of landmarks is not the same in all directions, so the impact of any change on each path’s visibility is also different. In the Taleghani, in the pedestrian mode, the IV is generally less than 0.1. However, in the riding mode, except for the 2020 option, the IV has reached one. Therefore, in this mode, physical changes are more sensitive, and changes should be commensurate with the visibility capacity, but in the 2020 option, the visibility has reached zero (Figure S6 in the Supplementary Material).
Result of visibility distribution
The results of the VD index for all three options.

The results of the IV index for pedestrian and rider mode in all three cases.
In the riding mode, the difference between the 2003 and 2020 option’s visibility is in the uniform VD of the Imam and Taleghani. In Imam, the changes have blocked more than 35% of the visibility (Figure 7). In Taleghani, this rate reaches 100%. The differences between the 2020 and the 2003 option are more significant in the visibility of Valman, and Ark. Riders in Ark path is limited by bicycle and taxi, so this path is not visible. Still, the view of Valman is of particular importance because both observers(pedestrians and riders) can see the main exterior of the Ark from this route. In 2020, the wall’s conversion had increased the VD by 118%, so this option is better than the 2003 option. The main difference between the 2003 and alternative options is the VD of 75% on Imam. Still, in the alternative option, it has reduced this distribution by being located on the north side of Ark. Position the proposed mass as follows Kelly has led to an increase in the VD. This change has increased the VD of Taleghani, which has been blocked by the construction of the Mosalla, by 238%, and the same situation is observed in Valman and Ark, where a wider area of the Ark building is seen more intensely (Figure 7). The results of the VD index for pedestrian and rider in all three cases.
Conclusion
This article examined the visual impact of the physical changes around Ark-e-Alishah in 2003, 2020 and an alternative situation. There is no general VIA method to be used for visual impact assessment of urban landmarks, thus Ark-e-Alishah, as a landmark visible from within the urban spaces, needs a method based on its visibility characteristics. The ULVIA method is developed considering the observer characteristics (such as height, FOV, depth of vision, and distribution), environmental characteristics (including physical obstacles and topography), and the concept of cumulative viewshed using Nurbs data and ray casting in Grasshopper. The ULVIA method makes it possible to analysis changes around urban landmarks based on the three concepts of minimum visibility (zero, one), intensity visibility (density of hits on each unit), and visibility distribution (distinctive hits on each surface).
Based on the results, it is possible to explain each option’s visibility in terms of riding or pedestrian movement in each path. The 2003 option has visibility with normal intensity and distribution in all paths, the 2020 option does not have this balance, and the difference between riding and pedestrian mode is higher. The view is focused on the Ark pedestrian street. Compared to other options, the alternative option has a higher visibility intensity and a better distribution for pedestrians and riders. The visibility of the Imam Street in the alternative option has decreased. The main viewpoint to see the Ark building in the past was from the south. However, after the construction of Imam Street, this direction has changed and the alternative option could be designed as a complement to Ark building by considering Imam Street’s importance. Hence, it also brought fewer visual Impacts. Therefore, the use of assessment methods in process of design and planning can reduce the impacts on landmark’s visibility. However, according to the objectives set in the research, by prioritizing the facade or parts of the building, the importance of observers in each path, adding vegetation and other obstacles a more accurate assessment can be done.
Supplemental Material
Supplemental Material - Visual impact assessment of urban developments around heritage landmarks using ULVIA method: (The case of Ark-e-Alishah monument in Tabriz)
Supplemental Material for Visual impact assessment of urban developments around heritage landmarks using ULVIA method: (The case of Ark-e-Alishah monument in Tabriz) by Sirwan Salimi, Morteza Mirgholami, and Amir Shakibamanesh in Environment and Planning B: Urban Analytics and City Science
Footnotes
Acknowledgments
There is no special thanks except that I, Sirwan Salimi, thank my supervisor Dr. Mirgholami and my advisor Dr. Shakibamensh for their help in bringing the article to this stage.
Declaration of conflicting interests
The author(s) declared no potential conflicts of interest with respect to the research, authorship, and/or publication of this article.
Funding
The author(s) received no financial support for the research, authorship, and/or publication of this article.
Supplemental material
Supplement material for this article is available in online.
Note
References
Supplementary Material
Please find the following supplemental material available below.
For Open Access articles published under a Creative Commons License, all supplemental material carries the same license as the article it is associated with.
For non-Open Access articles published, all supplemental material carries a non-exclusive license, and permission requests for re-use of supplemental material or any part of supplemental material shall be sent directly to the copyright owner as specified in the copyright notice associated with the article.