
Abstract
As a major component of social acceptance, visual impact is often considered a significant constraint in solar applications. Visual impact assessment of solar applications, however, has been limited to pedestrians in previous studies. The extent to which PV systems can have visual impacts on occupants and whether it is necessary to include occupants in the measurement of visual impact remains uncertain. To fill this gap, we extended it from pedestrians to occupants and proposed a quantitative method to integrate pedestrians and occupants into a framework, combining the estimation of solar potential for the feasibility assessment of PV applications in a built environment. The concept is tested with a real case, located in Qingdao city, China, to present the technical flowchart for the feasibility assessment of solar PV deployments with the visual constraint. Building surfaces with qualified solar irradiation and low visibility were identified and compared in two cases, that is, with and without the inclusion of occupants as the visual constraint. The comparison results show that the change of suitable building surfaces for solar applications is 172,306 m2 (21% of suitable area) and 126 GWh (19% of yield energy) across the study area, indicating the significance of including occupants in the visibility assessment for the deployment of solar applications. The proposed method considers the visual constraint for the feasibility assessment of solar applications from the perspective of pedestrians and occupants, and it is helpful to identify the suitable surfaces for the large-scale deployment of solar applications at an early planning stage of solar city.
Introduction
Currently, more than 50% of the world’s population lives in cities, and it is estimated that by 2050, this fraction will increase to 70% (United Nations, 2011). Meanwhile, the energy demand is also increasing with the growing migration to urban areas. By 2030, 75% of global energy consumption is expected to come from cities (Madlener and Sunak, 2011). Compared with other renewable energy sources such as geothermal energy and wind energy, solar energy is one of the few sources that can be widely applied in urban areas (Xu et al., 2021). Particularly, solar photovoltaic (PV) provides a sustainable option for energy generation to meet modern society’s needs (Pearce, 2002). With limited and valuable land resources in urban areas, a promising solution for exploiting this tremendous energy is to deploy the solar modules on building surfaces, which generally forms building-integrated photovoltaics (BIPV) or building-attached photovoltaics (BAPV).
Building surfaces, however, are not always suitable for the deployment of solar applications. As the strong heterogeneity of solar irradiation can be found on building surfaces of the complex urban context, a primary concern is to estimate the solar potential on the building envelope for the optimal deployment of solar modules (Freitas et al., 2015). In recent years, the evaluation target of solar potential has been expanded from rooftops (Wong et al., 2016; Martín-Jiménez et al., 2020) to the entire building surfaces (Lau et al., 2017; Zhu et al., 2020), that is, rooftops and facades, and the study scale has been expanded from the neighborhood (Zhang et al., 2015) to the district (Lau et al., 2017), the city (Chatzipoulka et al., 2018) and even the national scale (Bódis et al., 2019). Meanwhile, a large number of solar radiation models or tools, such as ArcGIS Solar Analyst (Fu and Rich, 1999), GRASS r.sun (Hofierka and Súri, 2002), SOL (Redweik et al., 2013), Radiance (Perez et al., 1990; Ward, 1994), and PVGIS (Súri et al., 2005) have been developed and greatly promoted the solar applications in urban environments. To select the usable building surfaces for solar applications considering technical limitation or economic viability, the simulation-based solar potential is generally accompanied by a suitability assessment of building surfaces for PV integration in relation to the minimum irradiation threshold (Kanters et al., 2014).
However, it may not be appropriate to determine the usable area based entirely on the harvesting solar irradiation on building surfaces. An effective solar energy planning should also consider visual impact in relation to the landscape alteration induced by the PV modules. As a major component of social acceptance, visual impact is often considered a significant constraint on the selection of available surfaces for solar applications (Florio et al., 2018).
Conventionally, as the solar application expands from rooftops to building facades, PV modules on facades (and partly even on rooftops) are considered visually unappealing to the pedestrians. A concept, “Criticity,” was proposed to quantify the visual impact of solar applications, which considers the visibility of solar modules regarding location-specific context (Munari Probst and Roecker, 2015). To be specific, building surfaces that are historically significant (high sensitivity) or can be easily seen (high visibility) require a high-quality of PV integration for the energy generation (Florio et al., 2015, 2018, 2021). In fact, long before this concept was proposed, scholars have realized that aesthetic performance is one of the key factors in solar applications, and various PV modules were tested and designed to meet the high visual standard (Dessi, 2013). Visual impact of PV applications is defined as the undesired changes in the landscape of PV installations that may generate on residents (Fernandez-Jimenez et al., 2015). To measure the visual impact of solar applications, visibility assessment was usually conducted, which determines the visibility level of each building surface, that is, cumulative viewshed, by calculating the number of times a building surface is seen by viewpoints from the pedestrians (Florio et al., 2018). For instance, Annalisa Minelli et al. developed a tool to measure the PV visibility based on the proportion of the area of field of view (Minelli et al., 2014). Pietro Florio et al. measured the visual impact of PV modules through a solid angle-based assessment for the detailed planning stage of solar applications (Florio et al., 2018). Most recently, Sun et al. proposed a methodology for the feasibility assessment of PV deployments by combining visual impact assessment and energy yield on building surfaces (Sun et al., 2021).
In contrast to the visibility assessment from possible viewpoints on the ground, we argued that the cityscape changes caused by the deployment of solar applications could also have visual impacts on the occupants through windows. As a crucial element connecting the inner self to outside world, the window view has been playing a great role in urban life, including residential satisfaction (Kim et al., 2022), thermal comfort (Ko et al., 2020), work performance (Lottrup et al., 2015), occupant well-being (Elsadek et al., 2020), visual privacy (Zheng et al., 2021, 2022), and even financial values (Turan et al., 2021). Predictably, with a large number of PV modules widely spread over the rooftops and even building facades, the original fabric of the building envelope will be changed, potentially resulting in a negative impact on the window view quality of neighboring occupants. Moreover, the widespread deployment of PV modules may have a greater visual impact on neighboring occupants than pedestrians. This is because once a construction project is completed, the physical environment of occupants generally does not change for a long period, that is, the field of view of a residential window remains the same. Accordingly, with the solar application deployed on building envelopes, the view content of occupants could be changed permanently, as well as the view quality. The visual impact assessment of PV modules, however, has been limited to investigations from the pedestrian’s perspective, with little attention paid to the occupants. In this regard, the visual constraint towards solar applications not only comes from pedestrians but also from the occupants. However, the extent to which PV modules can have visual impacts on occupants and whether it is necessary to include occupants in the measurement of visual impact remains uncertain.
This study aims to explore the visual impact from the occupant’s perspective and to open the minds of urban planners that it is significant to consider the visual impact of PV deployments in existing built environments. In particular, visual impact of PV panels was only investigated from pedestrians’ view in previous studies. We extended it from pedestrians to occupants and proposed a quantitative method to integrate pedestrians and occupants into a framework, combining the estimation of solar potential for the feasibility assessment of PV applications in a built environment. Three contributions were sought in this article. First, the inclusion of occupants was demonstrated to be significantly necessary in terms of visual impact for the deployment of solar applications, which was not addressed in previous studies. Second, the technical flowchart has been designed to evaluate the feasibility of solar applications under the visual constraints of pedestrians and occupants. Finally, for the feasibility assessment of solar PV deployments, a quantitative comparative analysis was carried out with and without the inclusion of the occupants.
Material and methodology
In this section, the methodology of feasibility assessment of solar PV deployments with the visual constraint from both pedestrians and occupants was designed and applied to a real case.
Study area
Qingdao (119°30′ E−121°00′ E and 35°35′ N-37°09′ N) is located in the eastern Shandong Peninsula on the east coast of China, with a total area of 1174.56 km2. Surrounded by the Yellow Sea to the east and south, Qingdao is a sub-provincial city of Shandong with a population of 10.1 million (NBS, 2021). The deployment of PV systems on building surfaces in Qingdao has three advantages: (1) abundant solar energy resources. The city locates in the available zone of solar energy, where annual hours of sunlight are more than 1500, and the annual irradiation amount is approximately 5000 MJ/m2 (NBS, 2020); (2) a large number of buildings that can be used to install PV panels. The building area was ranked as the first echelon in the country (Wang et al., 2021); (3) policy support from local government. The vigorous promotion of solar PV applications to build several comprehensive utilization demonstration stations based on the 14th Five-Year Plan of Qingdao city (Qingdao Municipal Government, 2021), in which the total installation capacity of PV power is expected to be 4 million kW, with the inclusion of 1 million kW from BIPV/BAPV applications. On the other hand, as a popular tourist destination and a historical and cultural city in China, Qingdao welcomes over 100 million international and domestic tourists every year (Government Affairs, 2019). In this context, to meet the rapid development of PV applications and achieve the ambitious solar deployment targets, this paper takes Shinan District, which is the economic, cultural, and political center of Qingdao, as an example to conduct an exploratory study.
Shinan District covers an area of 30.01 km2, with a maximum length of 12.7 km from east to west and 4.8 km from north to south, and a total population of 0.48 million in 2020 (QSDGN, 2022). The study area, as shown in Figure 1, located in the west of the district, was selected for the feasibility assessment of PV deployment. The study area covers an area of 2.5 km2, with the railway station in the north and the sea on three sides. Blocks in the area are distributed in a compact manner, with a density of about 0.25, forming a variety of building height types with low-rise, mid-rise, and high-rise buildings. Study area in Qingdao city, Shandong Province, China.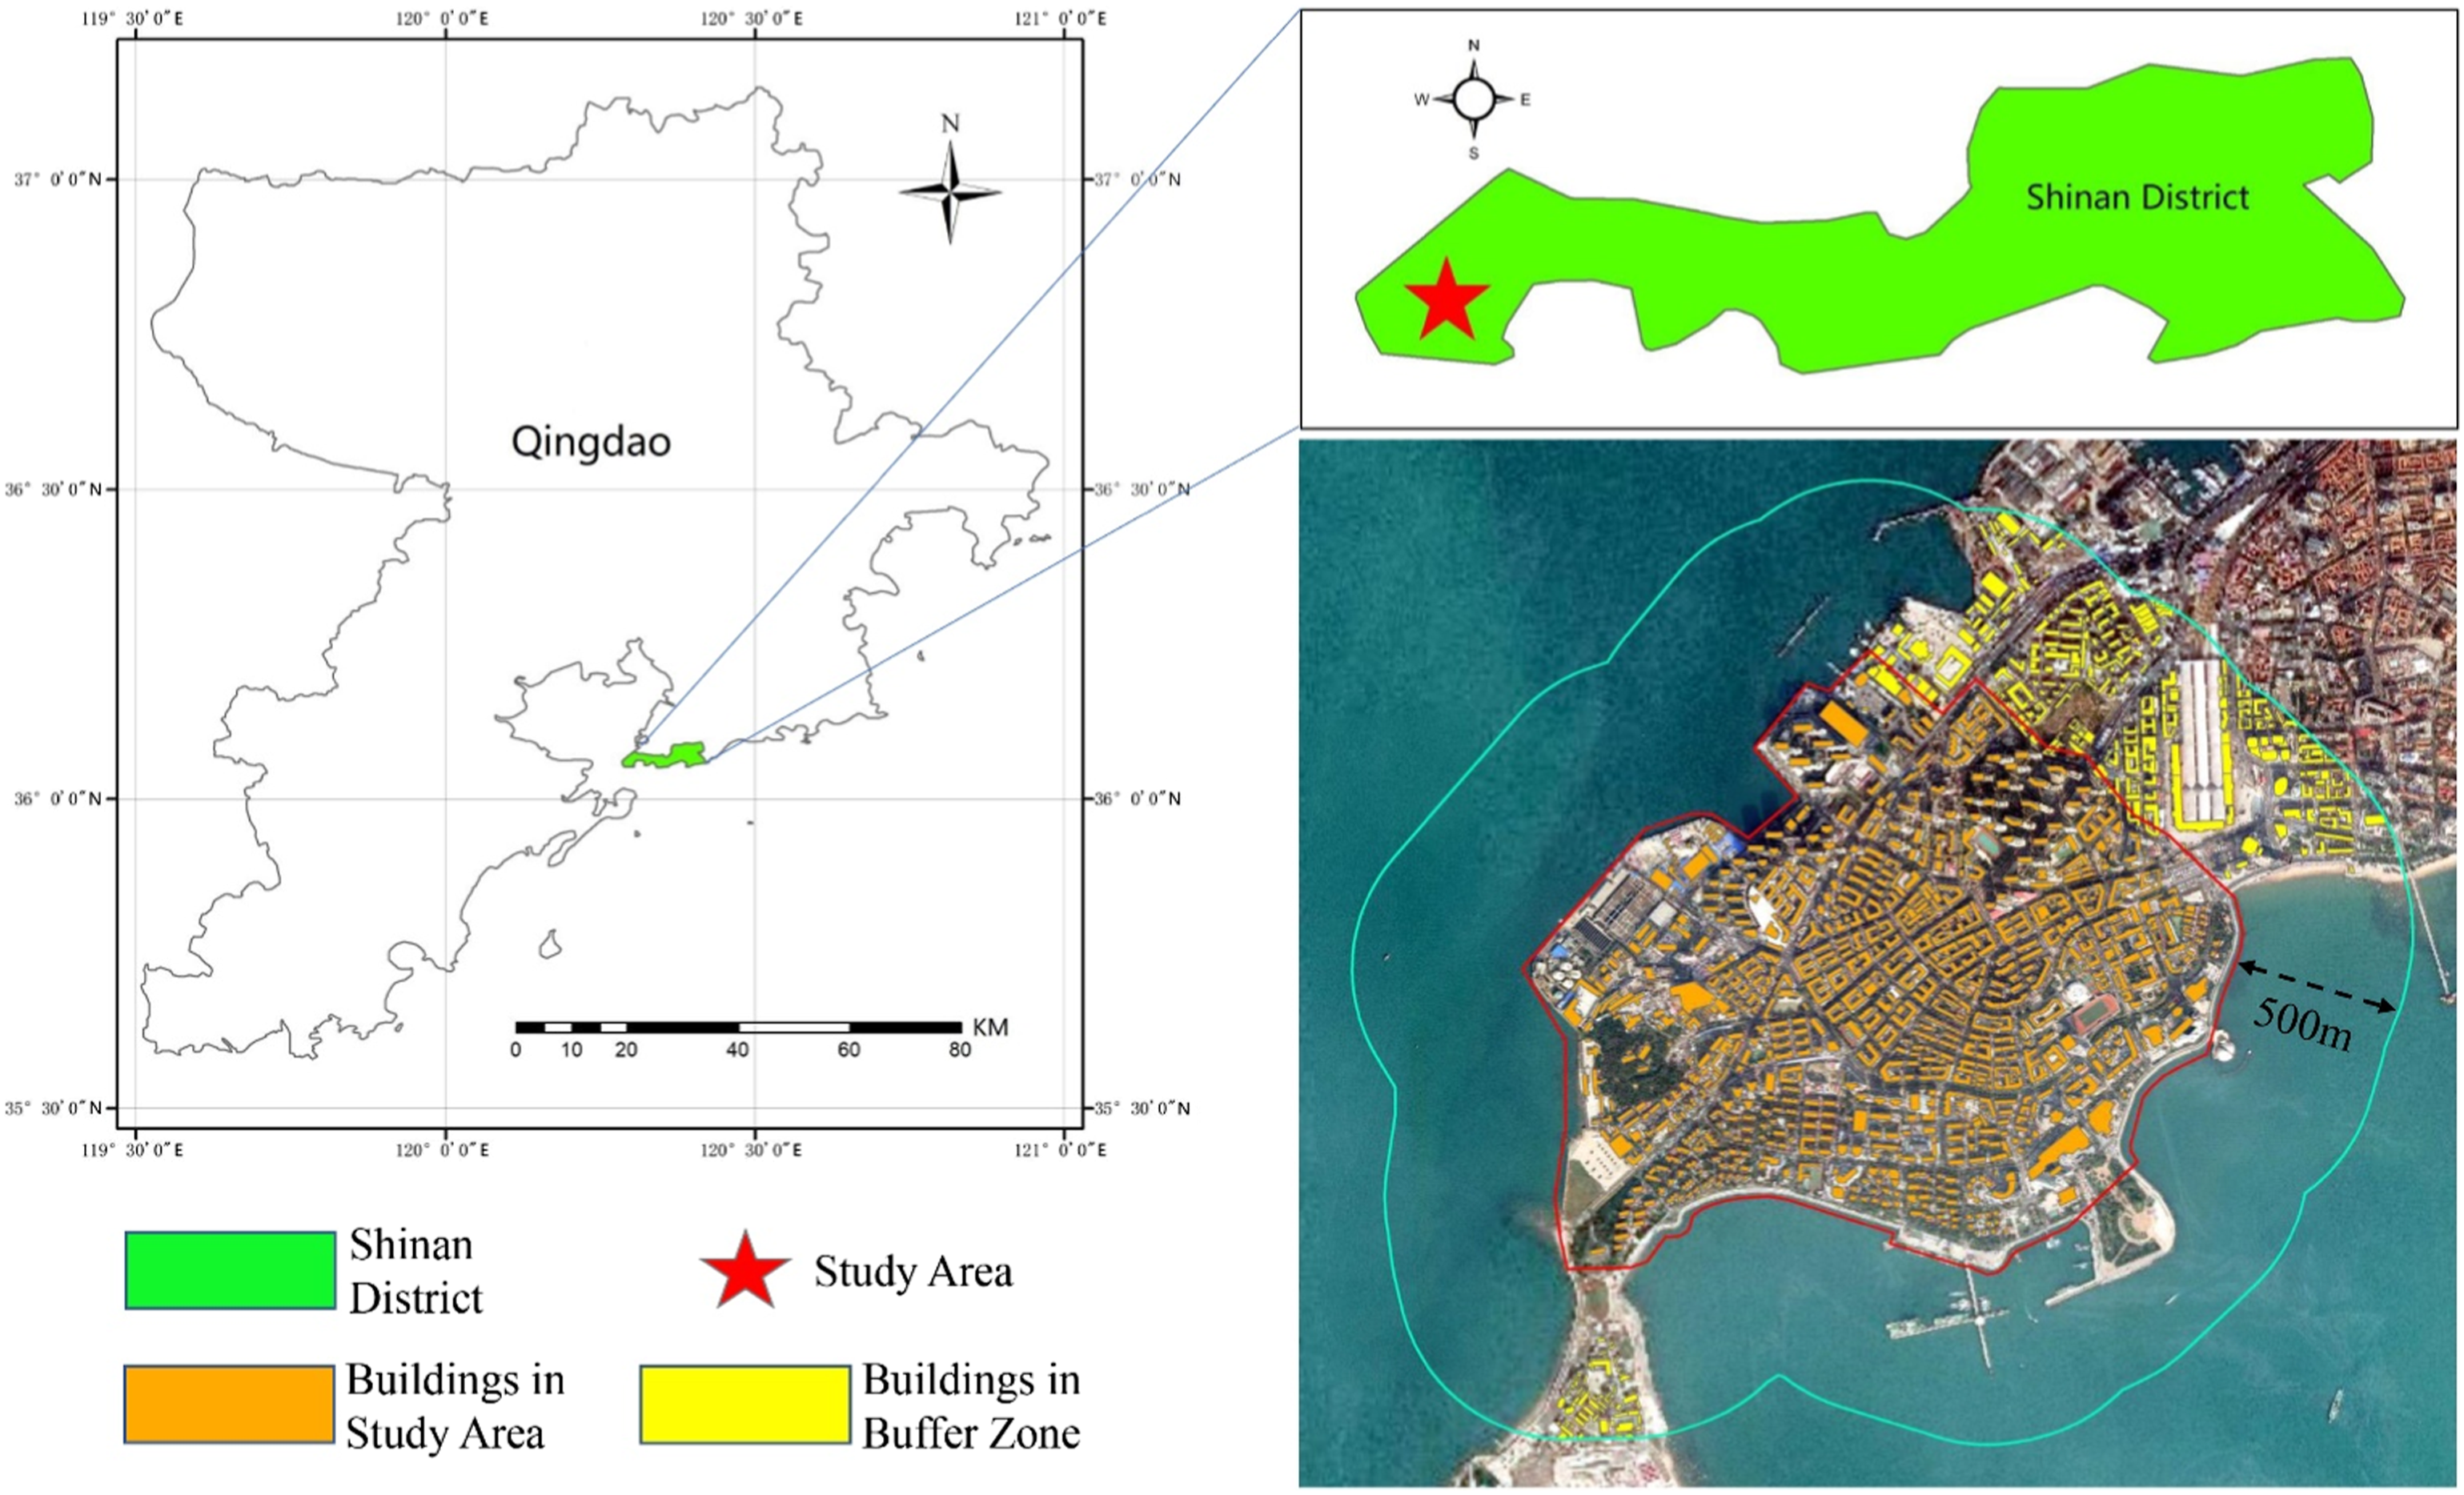
The technical flowchart is presented in Supplement Figure S1. Solar potential and visual impact were applied as the two components for the feasibility assessment of PV deployments on building surfaces. To be specific, solar potential was assessed by annual solar irradiation to identify qualified building surfaces; visual impact was measured based on visibility analysis to select the surface with low visibility. Suitable surfaces were then extracted by the overlay analysis of these two components for the deployment of solar applications.
Data preparation and processing
For the construction of volumetric model of the study area, 2D building footprints and road information were first extracted from OpenStreetMap (OSM), and each floor height was assumed to be 3 m for all buildings (Carneiro et al., 2010; Zhu et al., 2020). Operations such as data cleaning, digitizing, coordinate transforming, and matching were conducted in ArcGIS 10.3 platform for the preprocessing. Some floor information was not available in the original OSM dataset in the study area, which was thus filled based on field measurement to ensure data completeness. It should be noted that this study is based on a simplified volumetric model without involving any architectural details such as balconies or parapets. Moreover, as the selected site is relatively flat, the terrain element was not included in this study. The vegetation was excluded in this study so that the visibility can be assessed in a worst-case scenario without trees. Overall, there are 843 buildings in the study area, with a rooftop area of 513,885 m2 and a façade area of 1,659,780 m2.
Estimation of solar potential
This section measures the solar potential of building façades and rooftops to select qualified building surfaces for solar applications. The Ladybug Tools suite (Roudsari, 2017), which contains a series of environmental analysis functions in the Grasshopper software package, was adopted for the solar irradiation simulation of building envelopes. Specifically, the Ladybug Tools suite streams the climatic and geometric data to Radiance engine for the simulation. The annual cumulative solar irradiation can be calculated using cumulative sky radiance distributions generated by the GenCumulativeSky module in Ladybug Tools. More details can be found in work by Robinson and Stone (2004). Moreover, annual solar irradiation on the building envelope (kWh) is estimated and served as an indicator to filter and select the qualified building surfaces.
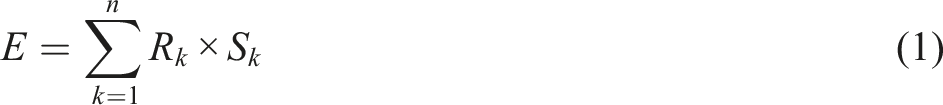
The procedure of solar irradiance simulation is detailed below. A few parameters such as the local weather file (Qingdao city), target geometry, context geometry, analysis period (from 1 Jan to 31 Dec), and the grid size (3 m × 3 m) were first collected and set as the input for the simulation. Rooftops and facades were separated as the target geometries for the analysis, and all the blocks located in the study area were taken as the context geometries. In addition, each of the targeted surfaces was subdivided into 3 m × 3 m grids with a test point offset of 0.01 m from the base surface. Thus, the solar radiance on building surfaces can be estimated by using equation (1).
Measurement of visual impact
The measurement of visual impact mainly involves three steps, named target point extraction, viewpoint extraction, and visibility analysis. As shown in Supplement Figure S3, targeted building surfaces were first subdivided into 3 m × 3 m grids with a test point offset of 0.01 m from the base surface as aforementioned. Second, the viewpoints were sampled not only from the pedestrians but also from the occupants. For the pedestrians, viewpoints were extracted evenly along the roads with an observing height of 1.5 m and a distance of 3 m between two adjacent viewpoints. For the occupants, viewpoints were distributed every 3 m along building facades in horizontal and vertical dimensions. Each viewpoint was assumed to have a 360° field of view with a maximum view distance of 500 m following a relevant study (Florio et al., 2018). Third, the visibility analysis was carried out between each target point and defined viewpoints from street and building levels. For each target point under analysis, the number of viewpoints from pedestrians and occupants being able to see is calculated as the cumulative viewshed of each building gird (point) in Grasshopper. The visibility level of each target point is quantified by the visibility percent, which calculates the proportion of the number of visible points among all potential viewpoints within a given distance (i.e., 500 m in this study), as shown in equation (2).

Result
Assessment of solar irradiation on building surfaces
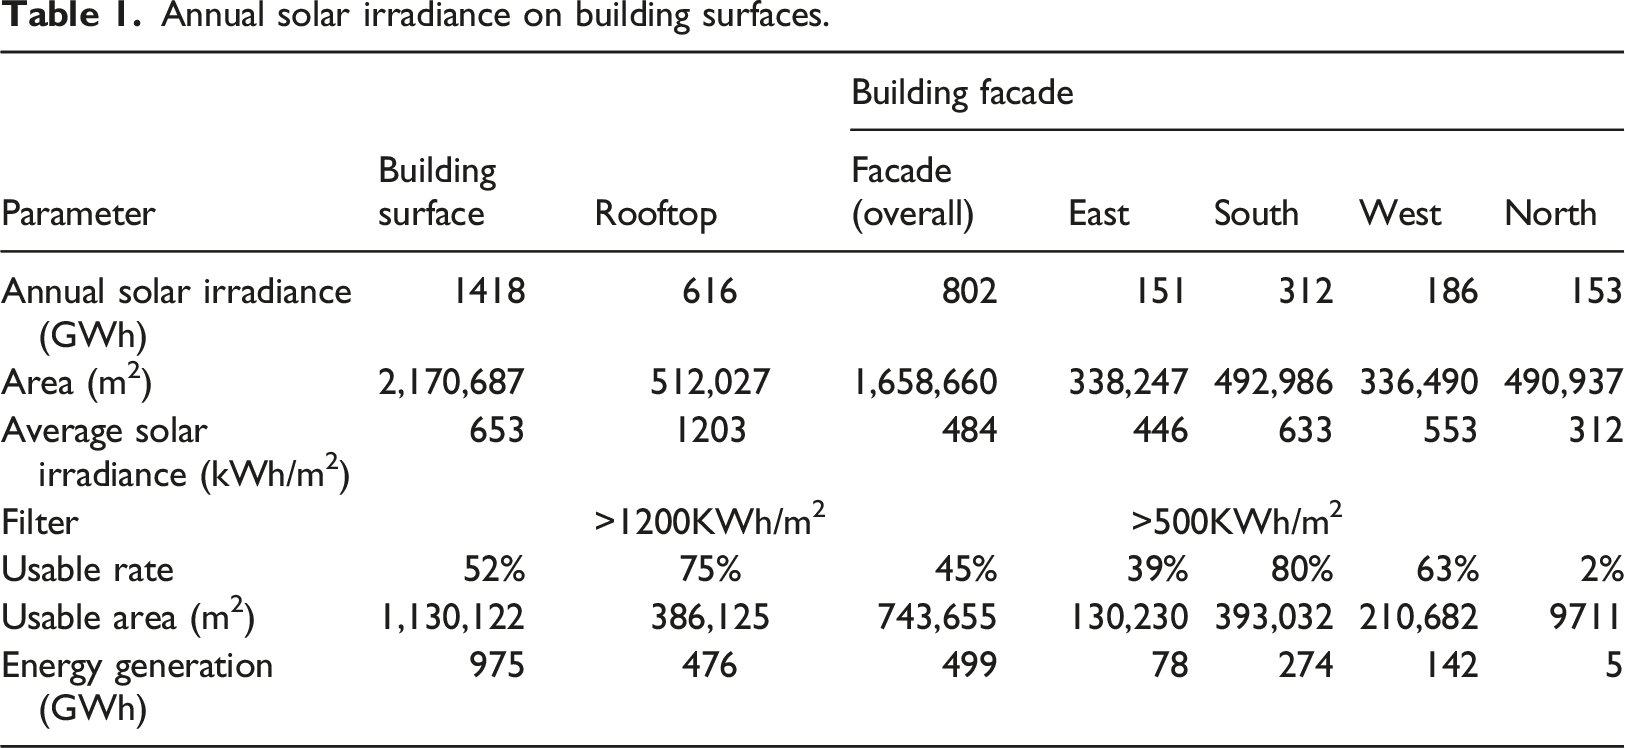
Annual solar irradiance on building surfaces.
Visibility assessment on building surfaces
From the perspective of pedestrians (see Figure 2(a)), high visibility can be found on the building facades orientated to the street. Those facades with lower visibility are usually located along the street or are surrounded by urban structures. It should be noted that rooftops were all simulated to be invisible to pedestrians, indicating that solar applications can be applied freely on any rooftop without the constraint of visual impact. As demonstrated before, however, the widely distributed solar panels can potentially influence the window view quality of the occupants. Figure 2(b) presents the visibility result on building surfaces from the perspective of occupants. In contrast to Figure 2(a), an evident difference can be found was that the visibility of rooftops varies dramatically across the area. Specifically, those rooftops with a lower elevation and close to high-rise buildings generally present higher visibility from the perspective of occupants. This may be a common phenomenon when the urban morphology presents strong spatial heterogeneity of building height in a region. Additionally, both simulated results show that higher visibility could be observed on building facades in areas where buildings were sparsely distributed. The visibility result with the combination of pedestrians and occupants can thus be calculated, as shown in Figure 2(c). 3D mapping of visibility assessment from the perspective of (a) pedestrians; (b) occupants, and (c) the combination of pedestrians and occupants.
Feasibility assessment of PV deployments
In this study, a building grid (point) was considered “qualified” for solar applications only if the annual solar irradiation is higher than a threshold, that is, 1200 kWh/m2 for rooftop areas (Lee et al., 2016) and 500 kWh/m2 for façade areas (Sun et al., 2021), above which the deployments are regarded as economically viable.
It is worth noting that compared to residential and industrial areas, historical buildings are usually more sensitive and require tighter restrictions or even to be unsuitable for solar applications (Florio et al., 2021). In this case, historical buildings (i.e., Taixi Fortress Site) were initially identified and excluded for the feasibility assessment of PV deployments. The qualified building surfaces were considered usable areas for the deployment of solar applications as shown in Supplement Figure S5. Statistical results of annual solar irradiance on building surfaces can be found in Table 1.
Accordingly, the visibility of a target point was classified into two levels, 1) low visibility, when its visibility percent Qualified points overlaid on the map of classified visibility.
Further, the qualified surface can thus be overlaid on the map of classified visibility to select the suitable surfaces for the deployment of solar applications. Taking Block X (low-rise) and Y (high-rise) as examples, each qualified building grid with sufficient solar irradiance was extracted and represented by a center point. From the perspective of pedestrians, the south-oriented façade of Block X presented high visibility because it directly and closely faces the main street, where it can be visually accessed from a large number of viewpoints of pedestrians. The rooftop cannot be observed from the pedestrians and it was thus simulated with no visibility. In this case, the suitable surface for solar applications can be found on the rooftop and west-oriented façade, in which the requirement of qualified solar irradiance and low visibility can be met. However, being surrounded by densely distributed buildings and closed to several high-rise buildings, the rooftop of Block X is highly exposed to the window view of the neighbors, resulting in a high level of visibility from the perspective of occupants. In this regard, the rooftop of Block X may not be suitable for the deployment of solar applications. Similarly, the south-oriented façade can be observed with qualified solar irradiance while accompanied by high visibility from the occupants. By contrast, the rooftop of Block Y was estimated with significant solar irradiation and low visibility on the rooftop, which can be the ideal area for the deployment of solar applications.
Discussion
Statistical analysis with and without the inclusion of occupants
Since the same grid resolution was used when simulating visibility and solar irradiation, the centralized point of each grid can thus be assigned the attributes of cumulative viewshed and annual solar irradiance, allowing for the overlay analysis based on a point-to-point manner.
To understand the distribution of solar potential and classified visibility on building surfaces from a global perspective, statistical results were summarized as shown in Figure 4. In the horizontal dimension, the cumulative viewshed of each surface gird was classified as low (blue, 0–20% visible) and high (red, more than 20% visible), respectively. In the vertical dimension, the height of each level of visibility represents the percentage of solar potential (left) and surface area (right) relative to the entire building envelope, respectively. In addition, with the constraint of energy threshold, the upper and lower parts indicate the distribution of qualified surfaces and unqualified surfaces, respectively. Statistical results with the overlay of solar potential and classified visibility (a) from pedestrians and (b) from pedestrians and occupants.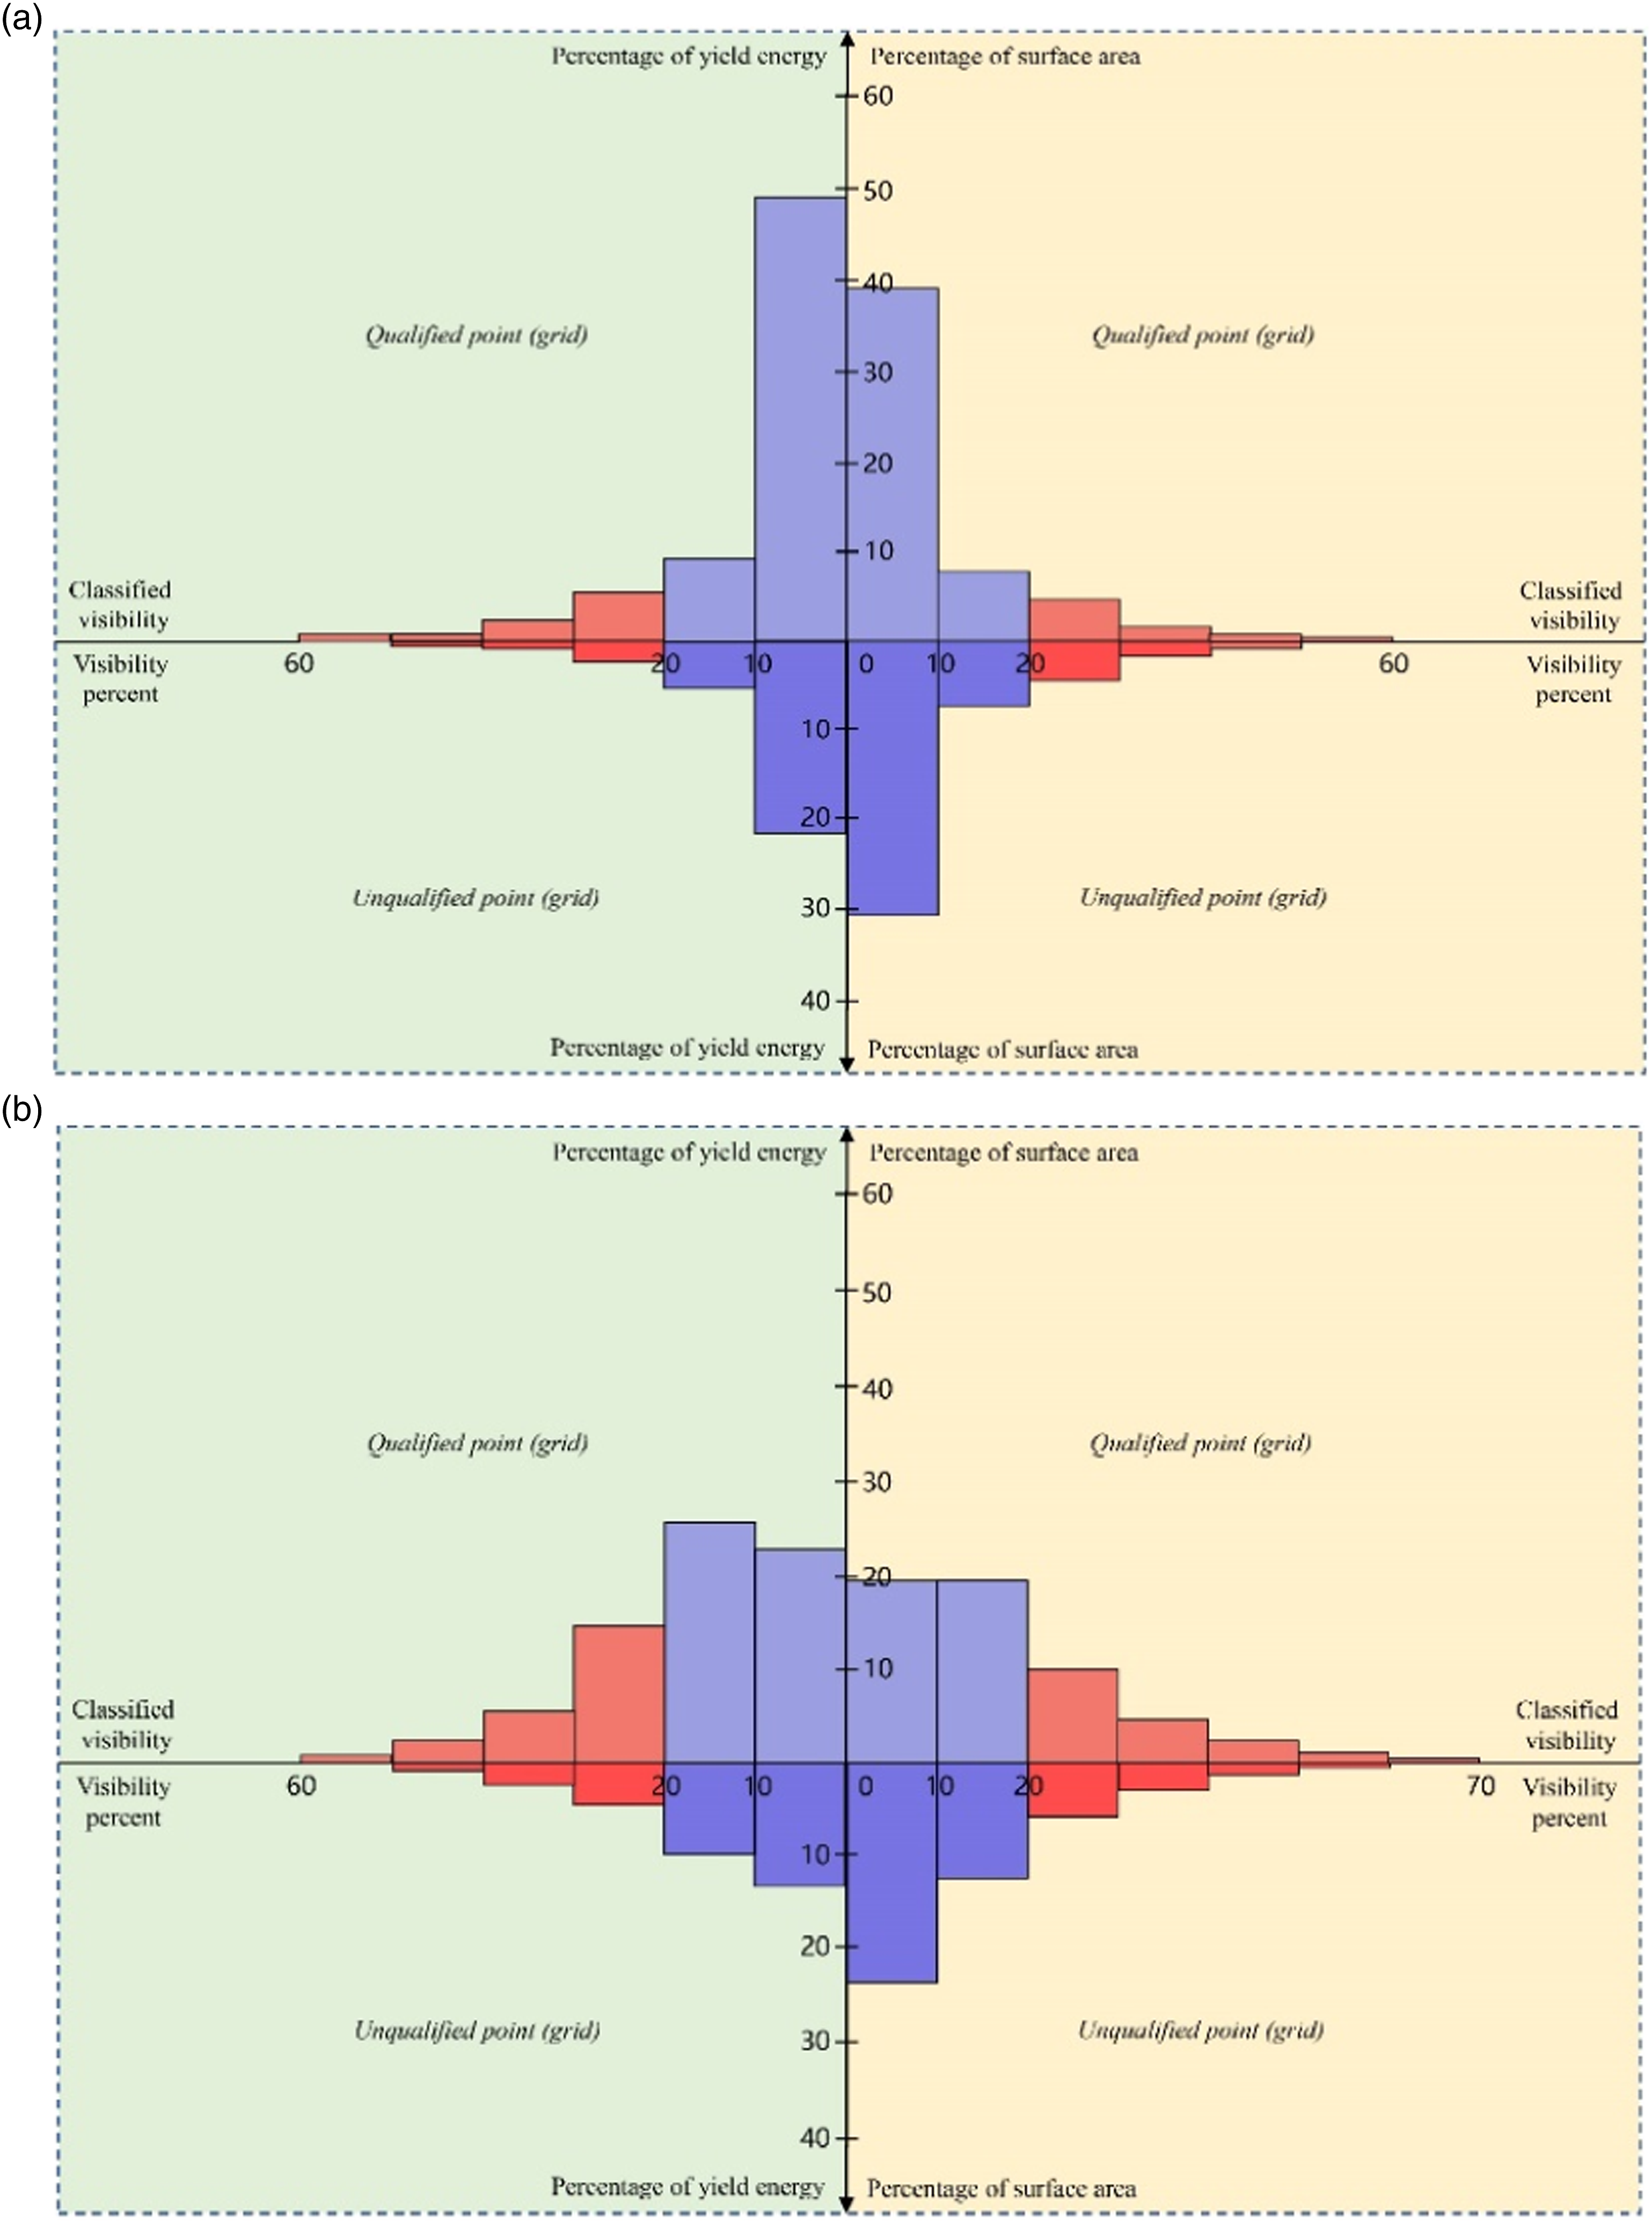
From the perspective of pedestrians, the suitable surface with qualified solar irradiation and low visibility was estimated with an area of 998,623 m2 and yield energy of 808 GWh, which is about 46% and 57% of the energy yield for the entire building surface, respectively. With the inclusion of occupants, by contrast, the former occupied an area of 825,317 m2, which accounts for 38% of the building surface. The potential energy could reach 681 GWh, which accounts for 48% of the solar potential across the study area. The statistic shows the change of suitable building surface for solar applications can be 173,306 m2 in area (21% of the suitable area) and 126 GWh in energy generation (19% of yield energy) across the study area, which indicates that it is considerably required to take the occupants into account for the feasibility assessment of solar applications in urban environments.
Statistical analysis in different building layouts
To understand the changes in suitable surface area and potential energy under different building layouts, four types of building layouts, including aligned parallel, staggered, semi-enclosed, and enclosed, were extracted from the study area, as shown in Supplement Figure S6.
Building surfaces were classified into four groups, qualified solar irradiation and low visibility (i.e., HighR and LowV); qualified solar irradiation and high visibility (i.e., HighR and HighV); unqualified solar irradiation and low visibility (i.e., LowR and LowV); and unqualified solar irradiation and high visibility (i.e., LowR and HighV), to conduct the statistical analysis. Significant changes can be found in aligned parallel and staggered layouts with the involvement of occupants, where the percentage of suitable surface area has changed from 49.7% and 28.4%–10.3% and 18.8% in the aligned parallel and staggered layouts, respectively. Accordingly, the percentage of yield energy changes from 63.9% and 45.2%–10.7% and 34.4% in the former and latter, respectively. In comparison, there are no significant changes in semi-enclosed and enclosed layouts. These two different situations are caused because buildings from the aligned parallel and staggered layouts are close to many high-rise buildings that create a large number of sightlines that could visually connect to the target surface. By contrast, target surfaces from the semi-enclosed and enclosed layouts are mainly influenced by the internal interactions, and the visual impact from surroundings accounts for a relatively small proportion. Statistical details can be found in Supplement Figure S7.
In addition, since this study aims to combine the visual impact from pedestrians with occupants for the feasibility assessment of PV applications, the influence of building layouts on solar irradiation, visibility, and their relationships is out of scope at the current stage. More investigations on how the complicated building layouts in urban environments influence solar irradiation and visual impact are of great interest and significance to be explored in future studies.
Strategy for the deployment of solar applications
Block X (low-rise) and Y (high-rise) can be considered typical samples in urban environments, and we further concluded two cases for the deployment of solar applications as follows. (1) Qualified solar irradiation and low visibility: this surface could mainly be found on rooftops of high-rise buildings or the facades directly facing against the street. As such, the deployment of solar applications on these surfaces can be a primary solution in that taking into account the visual constraint while utilizing the high solar potential. If there is no specific requirement to be visually appealing, standard PV modules can be installed on these surfaces without any transformation or upgrading. (2) Qualified solar irradiation and high visibility: it was estimated with solar irradiation of 270 GWh, which is about 20% of the entire solar potential as shown in Figure 4(b). It can be found on rooftops of low-rise buildings, which is usually surrounded by high-rise buildings. Similarly, the facades of upper floors of high-rise buildings could also be the case. The deployment of solar applications on these surfaces is generally not recommended because of the presence of the visual constraint. However, to increase the availability of solar energy in urban areas, these surfaces can be installed with customized PV modules under a careful design and planning to form an optional solution for the solar application in urban environments.
It should be noted that the threshold of yield energy was set as 500 kWh/m2 on facades and 1200 kWh/m2 on rooftops in this study. The thresholds can be negotiated as the criteria might be varied with the local policy and market behavior. Especially with the continuous development of PV technology and the reduction of production costs, it is possible to convert some of the unqualified surfaces into qualified surfaces by lowering the threshold of yield energy; thus, increasing the capability of electricity generation from solar applications.
Metrics for visual impact assessment
Several metrics were developed specifically to evaluate the visual impact of PV installations in recent years. Minelli et al. developed an index called the NI-index (Minelli et al., 2014), which uses line-of-sight techniques to quantify the visual impact of solar and wind plants. In particular, the NI-index calculates the proportion of the area of field of view obstructed by the perceived size of PV modules. Based on the fuzzy viewshed and distance decay model, a new metric called the Potential Observation Hours (POH), presented by Fernandez-Jimenez et al. (2015), can calculate the visual exposure time in which the PV installations may be visually connected to possible observers. Parameters such as the inhabitants, PV size, potential observers from roads, and their distance to the PV plant were taken into account in this metric to select the optimal site for PV installations. These two methods can be applied to centralized PV systems in large territorial areas. For the distributed PV systems deployed on building surfaces in complex urban environments, Florio et al. recently proposed an average solid angle-based metric (Florio et al., 2021), which was demonstrated to be promising for visual impact assessment of PV modules. The metric, namely, visual amplitude, represented the perceived size of the target mesh facet over the spherical field of view of the average observer. In this study, we followed the work from Sun et al. (2021), in which a relatively simple yet effective metric, visibility percentage, was presented to classify the visual impact of PV panels on each building surface. It was calculated by the number of visible viewpoints over the total number of potential viewpoints based on the line-of-sight regardless of the shape or size of the target object. Basically, the solid angle and visibility percentage-based metrics both represent an average view that could be used for visual impact assessment of PV panels.
In addition, a sensitivity analysis based on the viewpoint sampling distance was conducted and shown in Supplement Figure S8. Taking Block Y as an example, five test points extracted from the center of building surfaces (North-, East-, South-, and West-oriented facades and rooftop) were used to perform the sensitivity analysis. The visibility percent of each test point shows a relatively stable result regarding the sampling distance, as shown in Supplement Figure S8. Although 12 m (Florio et al., 2018), 6 m (Sun et al., 2021), and 2.5 m (Florio et al., 2021) were used in previous studies, we adopted 3 m as the sampling distance in this study as a trade-off between the computational cost and simulation accuracy.
Limitation and future study
The limitation and future studies have been summarized as follows. First, the simulations of visibility and solar irradiation were based on simplified volumetric blocks, which may not perfectly represent the 3D urban context. Particularly, while the building form and layout are the main influences on solar irradiation and visibility of building surfaces, urban street trees can make a difference regarding both solar irradiation and visibility on the ground floor, according to Sun et al. (2021). Moreover, the types of rooftops are regarded as totally flat based on the volumetric model, resulting in building surfaces with angled rooftops in real scenarios may be over-estimated in terms of solar potential. In future study, the estimation accuracy of solar irradiation and visibility can be improved based on 3D models with more structural details. Second, viewpoints from pedestrians and occupants were assumed to be distributed evenly along the roads and building surfaces for the visibility assessment in this work. Considering the distribution differences in crowd density of pedestrians and the window-to-wall ratio of each building, it is suggested to account for these differences by weighting the pedestrians and extracting actual window viewpoints to improve the visibility assessment. City-cross cases are suggested to be conducted for comparative analysis in further studies. Moreover, although the investigation of building layouts is out of range of this article, it is of great interesting and significance to optimize building layouts with the constraints of solar potential and visual impact for sustainable urban planning and building design. Third, visual impact was only assessed in physical domain based on the quantitative analysis, while the qualitative analysis from perceptual domain was not included in this study. Therefore, a combination of the proposed quantitative method and qualitative approach (e.g., questionnaire survey) is expected to be a better solution addressing the visual constraint for the deployment of solar applications.
Conclusion
Building rooftops and facades can greatly increase the usable surface for PV deployments, but may be perceived to have a potentially negative visual impact on pedestrians and occupants in urban environments. This paper proposes a technical flowchart to assess the feasibility of solar applications not only from the aspect of energy generation but also from its visual impact. In particular, visual impact of PV panels was only investigated from pedestrians’ view in previous studies. We extended it from pedestrians to occupants and proposed a quantitative method to integrate pedestrians and occupants into a framework, combining the estimation of solar potential for the feasibility assessment of PV applications in a built environment.
From the aspect of energy generation, the solar irradiation on building rooftops and facades was estimated from spatial-temporal scales, revealing the considerable solar potential from building facades compared to rooftops. To quantify visual impact, the visibility analysis of each surface was conducted from the perspective of pedestrians and occupants. By integrating the simulated visibility and solar potential into the assessment, building surfaces with qualified solar irradiation and low visibility can thus be identified as the suitable surfaces for the deployment of solar applications. In conclusion, with the inclusion of occupants for the visual constraint, the change of suitable building surface for solar applications was estimated to be 172,306 m2 (21% of suitable area) in area and 126 GWh (19% of yield energy) in energy generation across the study area. The result indicates the cityscape changes caused by the deployment of solar applications could be a great visual constraint for the deployment of solar applications. The proposed framework allows to address the visual constraint of pedestrians and occupants for the feasibility assessment of solar PV deployments in urban environments, and it is helpful to identify the suitable surfaces for the deployment of solar applications at an early planning stage of solar city.
Supplemental Material
Supplemental Material—Feasibility assessment of solar photovoltaic deployments on building surfaces with the constraint of visual impacts
Supplemental Material for Feasibility assessment of solar photovoltaic deployments on building surfaces with the constraint of visual impacts by He Zheng, Bo Wu, Hui Lin, Junsong Jia, and Heyi Wei in Environment and Planning B: Urban Analytics and City Science.
Footnotes
Declaration of conflicting interests
The author(s) declared no potential conflicts of interest with respect to the research, authorship, and/or publication of this article.
Funding
The author(s) disclosed receipt of the following financial support for the research, authorship, and/or publication of this article: This work was supported by National Natural Science Foundation of China [grant number: 41961055], Joint Funds of the National Natural Science Foundation of China [grant number: U1811464] and open fund project of National-Local Joint Engineering Laboratory on Digital Preservation and Innovative Technologies for the Culture of Traditional Villages and Towns [grant numbers: 2021HSKFJJ015].
Supplemental Material
Supplementary material for this article is available online.
References
Supplementary Material
Please find the following supplemental material available below.
For Open Access articles published under a Creative Commons License, all supplemental material carries the same license as the article it is associated with.
For non-Open Access articles published, all supplemental material carries a non-exclusive license, and permission requests for re-use of supplemental material or any part of supplemental material shall be sent directly to the copyright owner as specified in the copyright notice associated with the article.