




Abstract
Immigrants play a new role in the spatial dynamics of residential segregation in South Korea. The featured graphic depicts changes in the geographical patterns of immigrant enclaves and the spatial segregation among four immigrant groups divided by the average per capita income of their birth countries from 2008 to 2021. Cartograms show that immigrants from advanced (Q1) economies concentrate in the center of Seoul, and enclaves formed by upper middle (Q2) economy-born groups are spatially isolated in the southwestern part of the Seoul Metropolitan Area. Immigrants from lower middle (Q3) and low-income (Q4) economies are more likely to reside in rural and industrial areas apart from Seoul Metropolitan Area. This study identifies that a deepening heterogeneity exists regarding the residential choice of immigrants, and socioeconomic backgrounds determine how each group will occupy specific places.
The growth of immigrant groups in developed countries has been mainly led by migrant workers from developing countries. Previous studies emphasized that spatial segregation of migrant groups has been expanded in major gateway cities in developed countries (Musterd and Deurloo, 2002; Park and Iceland, 2011). South Korea has seen rapid growth in the number of migrants. In the early 2000s, the migrant employment system was improved, and globalization progressed, accelerating the pace of migration. In particular, the places occupied by immigrants in South Korea differ according to their country of birth (COB) (Park, 2022). This study compares and visualizes the spatial difference between immigrants in 2008 and 2021 using cartograms. The status of COB’s income was divided into quantiles as of 2021, using per capita Gross domestic product data by 195 countries published by the International Monetary Fund (2022).
Figure 1 shows the major residential areas and concentration of migrant groups by the quantiles of COB’s income in 2008 and 2012. First, in the Q1 group, a high proportion of immigrants residing in Seoul among SMAs was observed, particularly in central business districts in Seoul (Figure 1(a)). In areas other than SMA, migrants’ residences were concentrated in large cities such as Busan, Daegu, Daejeon, and Geojae, where the shipbuilding industry consolidated. In the Q2 group, the proportion of immigrants in the SMA was relatively larger than that of the Q1 group. However, the main residential area was southwest of Seoul, which differs from the Q1 group (Figure 1(b)). The Q3 and Q4 groups exhibited residential selection behavior distinct from the Q1 and Q2 groups. Although both groups had a large resident population in SMA, the proportion of immigrants in Seoul was quite low (Figures 1(c) and (d)). In the Q3 and Q4 groups, many cases of residents living in large cities and manufacturing areas other than Seoul were seen. Spatial differences of immigrants in the South Korea. (a,e) Immigrant group from high-income economies (Q1); (b,f) immigrant groups from upper-middle-income economies (Q2); (c,g) immigrant groups from lower-middle-income economies (Q3); (d,h) immigrant groups from low-income economies (Q4). Note: Each region (administrative district) in cartograms is resized according to the total number of each immigrant group living there. Shown in diverging colors is the proportion of each immigrant group to total regional residents (eight level hierarchy classified by the Jenks natural breaks method).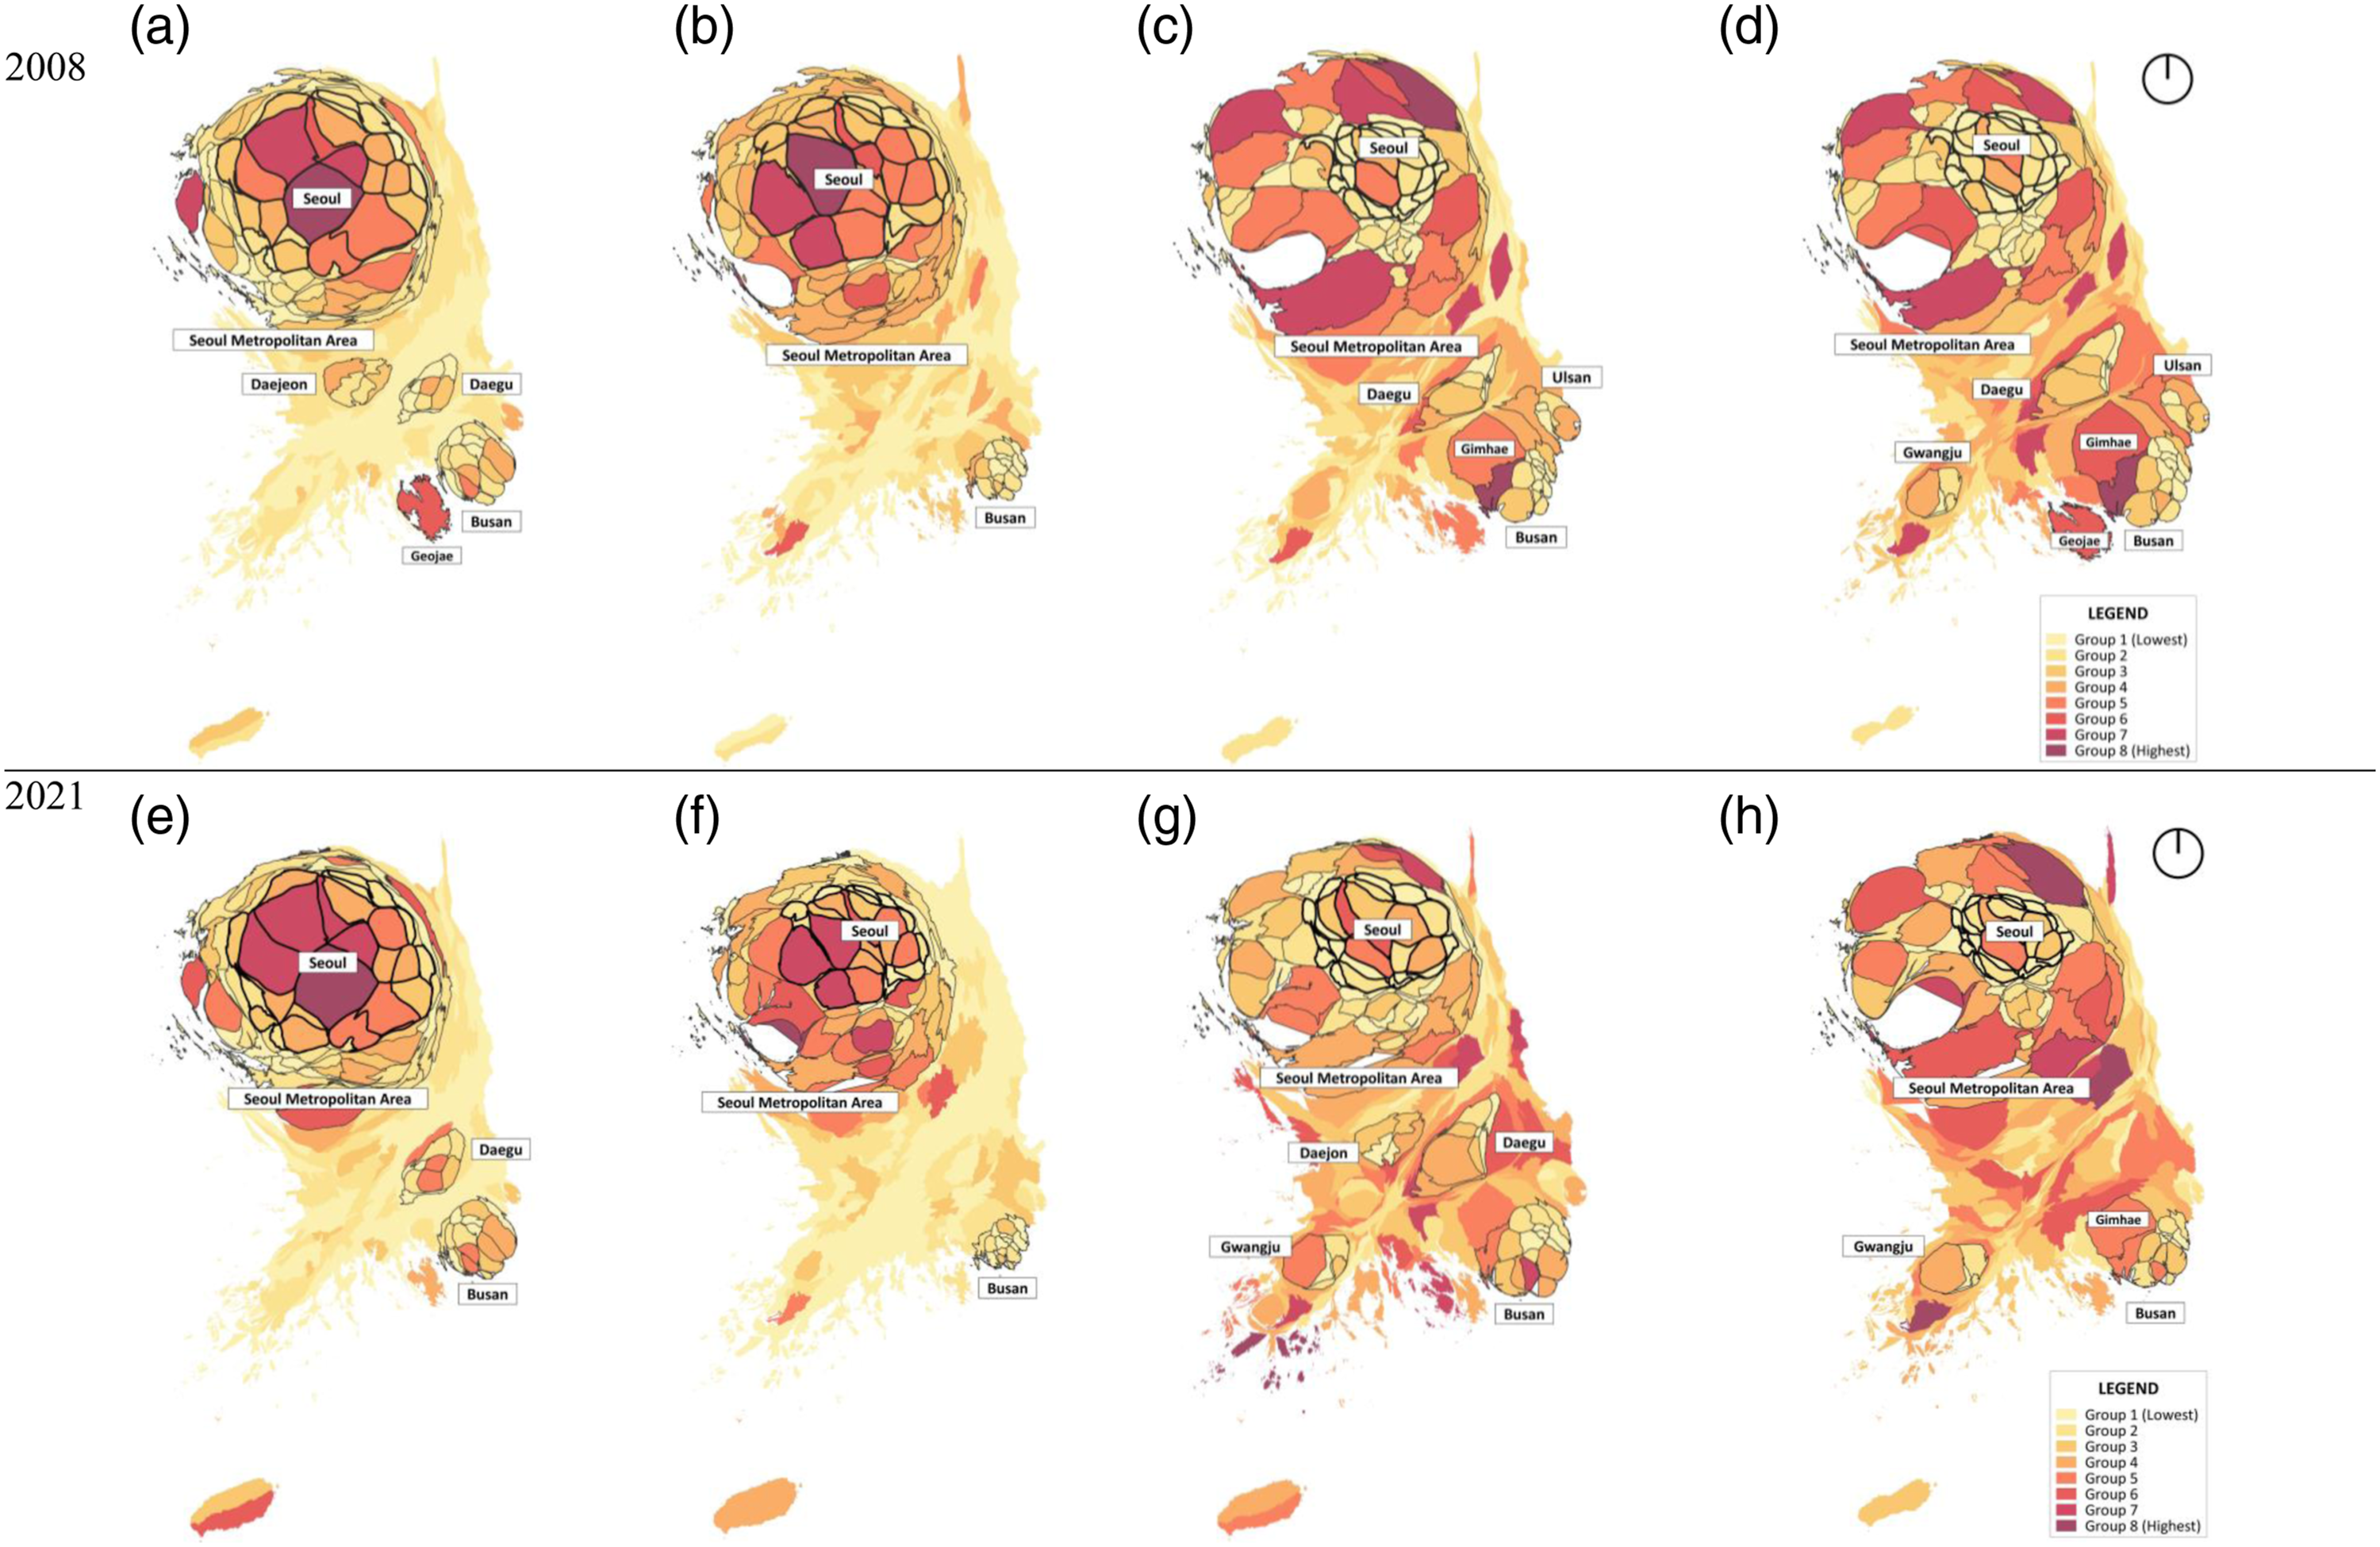
Figures 1(e)–(h) show the spatial changes of immigrants in 2021. In the Q1 group, the concentration in Seoul increased, while the immigrants in Geojae decreased significantly due to the decline of the Korean shipbuilding industry (Figure 1(e)). In the Q2 group, a decrease in Seoul and an increase in immigrant concentration in the southwestern part of the SMA were noted (Figure 1(f)). Both these groups were further extended to the southeastern boundary of the SMA. The Q3 group showed a decrease in SMA and an increase in immigrant concentration in Seoul, it showed an opposite trend to Q2 group (Figure 1(g)). The Q4 group revealed similar quantitative growth as the Q2 group, but it was concentrated in the northern areas of the SMA (Figure 1(h)).
Footnotes
Acknowledgements
We used the official data of registered foreigners by the Ministry of Justice in Korean Government with the spatial unit of Si-Gun-Gu as a local government.
Declaration of conflicting interests
The author(s) declared no potential conflicts of interest with respect to the research, authorship, and/or publication of this article.
Funding
The author(s) disclosed receipt of the following financial support for the research, authorship, and/or publication of this article: This research was supported by the Basic Science Research Program through the National Research Foundation of Korea (NRF), funded by the Ministry of Education (No. 2020R1I1A3056561)
