
Abstract
Research on the relationship between space and social interaction has focused on indoor spaces, such as museums and offices. However, empirical evidence on the connection between the intensity of social interaction and outdoor public spaces is still lacking. Applying machine learning algorithms to a 9-hour time-lapse video of an urban park, we decipher the effects of two spatial features, edges, and landmarks, on visitors’ activities. We identified dynamic visitor groups in the videos through a graph-based method and mapped the clustering pattern of interaction activities over time and space. In parallel, we used a computer vision algorithm to delineate fixed objects (notably the harbourfront, landside park boundary, a carousel, four benches, three pavilions, and four heart-shaped seating) and dynamic edges (formed by moveable furniture as park visitors repositioned them) onsite. We found that dynamic edges formed by moveable furniture and the fixed edge of a visual landmark consistently attracted more social interaction and group activities. In designing public spaces that encourage group activities, urban planners and designers can leverage the combination of fixed objects and flexible furniture to maximise the choices for visitors and curate a more engaging public open space.
Introduction
In a world of increasing urbanisation and mobility, cities have become the centre of our social lives. While social cohesion is crucial for sustainable urban development, cities are facing rising challenges brought by online activities, including e-shopping and door-to-door deliveries (McDonald et al., 2019), and more indoor activities, especially under recent surging epidemics (Hunter et al., 2021; Schmitt-Grohé et al., 2020). These forces are eroding the urban social fabric – streets, parks, and community gardens – that were vividly described as the stage of ‘ballet’ by Jane Jacobs (Jacobs, 1993). Urban public spaces require reconsideration to continue bringing urban dwellers together in space and time.
There have been long-standing interests in the association between space and social interaction. Empirical studies straddle across disciplines, including mobility, network analysis, geography, urban planning, architecture, and design (Festinger et al., 1950; Fischer, 1982; Hillier et al., 1993; Spillane et al., 2017; Whyte, 1980). Although using different disciplinary languages, these studies largely agree that space plays a central role in forming social ties (Small and Adler, 2019).
Moreover, the study of space and social interaction covers different nested geographical contexts (Loo et al., 2017), including macro scales of cities and regions, meso scales of neighbourhoods, and micro scales of streets and parks. Research at the macro scale focuses on the role of distance in determining opportunities for people with different backgrounds to meet each other and, hence, is closely related to the racial or social segregation literature (Athey et al., 2020; Moro et al., 2021; Pan et al., 2013). Meso-scale studies include empirical research on the role of neighbourhood in fostering a sense of community (Zhang et al., 2021) and “third spaces” such as cafes and play facilities that anchor social interaction within local communities (Simmel, 1971) and among school children (Loukaitou-sideris, 2003).
In this study, our purpose is to delve into the complex relationship between public space and social interaction at the micro-level of an urban park. This study was inspired by the well-known observations by Jacobs (1961) and Whyte (1980) about human behaviours, movement, and interaction in an open space setting. Their work underlined the key message that micro-settings such as shade, paths, and door-fronts can play essential roles in forming social interaction. More recently, Aelbrecht (2016), Rivera et al. (2021), and Veitch et al. (2022) have studied the relationship between space and social interaction in parks, streets, and plazas. Moreover, researchers have started to evaluate street sidewalks as pedestrian-oriented public spaces – proper street furniture, lighting, and railings are re-imagined as pathways to curate a safe, comfortable, and convenient pedestrian experience (Loo, 2021). Almost half a century after Whyte’s work, it is important to revisit the urban design elements that we have learned to use. Hence, we aim to conduct a thorough study on how urban design elements may connect with social interaction in public spaces in a dense urban environment beyond North America.
Methodologically, post-occupancy evaluations (POE) commonly used to examine how users react to the design of buildings and public spaces at the micro-scale are hard to scale in time and space given the intensive requirements of manual annotation and data collection. Using videos, some researchers have identified and analysed pedestrian group behaviour (Weina Ge et al., 2012; Zaki and Sayed, 2018). Yet, we have not seen applications of these methods in analysing the group interaction behaviours in large public spaces, such as an urban park, over an extended period of time. This further motivated us to apply advanced deep learning algorithms and computer vision methods to re-examine these earlier theories with empirical methods.
Correspondingly, this study mainly attempts to address the following questions using a pilot project in Hong Kong: 1. What aspects of group activities can we capture in public spaces with advanced computer vision algorithms? 2. How does the extent of group activities in public space vary spatio-temporally? 3. How do the dynamic patterns of group activities in public space vary with the spatial configuration of fixed and movable park furniture?
Section 2 reviews the previous work articulating the relationship between space and social interaction, and the advanced methodologies that allow us to collect and measure social interaction within a more extended observation period. Section 3 introduces the data used in this study and explains the overall methods regarding 1) interaction detection from video data, 2) main spatial components in this study, and 3) the relationship between the two. Section 4 describes the study results. Section 5 discusses the study’s implications and limitations. Finally, section 6 concludes and highlights our contributions.
Literature review
Social interaction, defined as a sequence of exchange actions between individuals and groups in sociology (Turner, 1988), has inspired a diverse body of literature. Ranging from geography, transport, network analysis, architecture, organization research, and urban planning, researchers assert that physical space plays a central role in stimulating such actions (Gehl, 1971; Hillier and Hanson, 1989; Small, 2009; Spillane et al., 2017; Whyte, 1980).
The relationship between space and social interaction can vary across different spatial scales. At a regional scale, decades of original research have been devoted to the science behind pedestrian movement and wayfinding. The street pattern, in turn, impacts the opportunities of people contacting each other, including the renowned ‘space syntax’ (Hillier and Hanson, 1989) and Kevin Lynch’s Image of City (Lynch, 1960). Generally, the variability of geography measured by the physical distance or catchment areas is shown to account for much of the social network structure in these large-scale studies (Hunter et al., 2021; Moro et al., 2021; Pan et al., 2013). At the mesoscale, identifying locations for people to meet and socialise in a neighbourhood or community is a dominant focus. Some sites such as parks, restaurants, coffee shops, churches, and porches are key ‘third spaces’ that draw people together and enhance social ties (Mehta and Bosson, 2010; Oldenburg and Brissett, 1982).
Complementary to the above studies, the focus of this work is at a micro-scale. Architects, planners, and sociologists have a long history of documenting essential characteristics that shape individual-level social activities in communal spaces. For instance, William H. (Holly) Whyte used films and maps to show how people walked, met, conversed, and interacted in public spaces in his famous work, The Social Life of Small Public Spaces (1980). Danish architect Jan Gehl also noted that social activities could be affected by planners and architects through design (Gehl, 1971). His work devotes attention to features in public spaces that make them felicitous for walking, resting, and meeting. Through these early observational studies, we find two features common to successful public spaces in shaping social actions yet deserve further empirical analysis: edges and landmarks.
Gehl (1971) describes the ‘edge phenomenon’ as a situation when the space adjacent to a wall, bench, or object becomes a premium location for dwelling, resting, and watching. Both Whyte and Gehl emphasised the need to allow for flexibility among all types of edges. In particular, loose chairs enable people to move them to the sun or shade depending upon the season and time of a day; people of two or three can arrange them to forge conversation; individuals tend to move the chair slightly as a way to show possession (Olin, 2017). Unfortunately, despite the great success in North America and Europe, this type of moveable public furniture is not yet widespread in Asia’s planning context, partly due to concerns of property stolen and maintenance.
Kevin Lynch used the term ‘landmarks’ to refer to fixed locations in cities that are unique and help pedestrians navigate (Lynch, 1960). A landmark in a city could be a church, a skyscraper, or a tower, while the same concept at a micro-scale may refer to a drinking fountain, a sculpture, or even signage within a park. Whyte called this the ‘triangulation’ phenomenon in which strangers are more likely to talk to each other in the presence of a landmark stimulation. The stimulus might be a street entertainer or a piece of outdoor sculpture. Simmel (1997) proposed that such fixed locations can serve as ‘pivot points’ for social interaction. Fixed places in space give people reasons to gather at a location and may structure social interaction around them.
There are also recent studies that complement early observations. For instance, Mehta and Bosson (2010) found that successful cafes and restaurants provided significantly more shelter and seating than other establishments. Wilkerson et al. (2012) found that a house’s porch facilitates communications with neighbours. Similar work has been carried out in an interior context. Lim et al. (2022) found that workstation locations in a clinic office directly affect the frequency of communication between coworkers.
Despite the progress, common challenges have hindered the application of research to inform design in practice. In particular, the observation time is usually limited, and the data-gathering methods are case-specific, which is hard to apply to different contexts. To overcome such challenges, researchers created advanced data-gathering methods to support urban studies. For example, Williams et al. (2019) conducted field tests using multiple sensors to gather information on how people use moveable benches in public spaces. Besides, human trajectories were extracted from videos to analyse the vitality in public spaces (Niu et al., 2022) and pedestrian groupings along sidewalks (Weina Ge et al., 2012).
Along the same line, this research intends to address several remaining gaps. Firstly, public space plays a vital role in social interaction, communication, and gathering. Although deep-learning-based computer vision algorithms have made tremendous progress (Weina Ge et al., 2012; Yu et al., 2016; Zaki and Sayed, 2018) in identifying group behaviours, their applications in urban studies are still limited to counting individuals or tracing people’s movements. We yet lack knowledge on to what extent we can use these methods in analysing social interaction. Secondly, dynamic edges (be it moveable furniture or installation) and fixed landmarks are widely used in urban design practice. Despite previous work on fixed landmarks and their impact on social interaction, we lack empirical studies that measure the effects of both features in parallel. Hence, this study’s findings can inform better planning and management of public space in practice. Through highlighting different effects of dynamic edges and fixed landmarks on social interaction, the findings can also be used to inform the creation of vibrate public spaces through the creation of dynamic edges and/or fixed landmarks, where and when relevant.
Data & methods
To bridge the two research gaps, we design a study to identify the connection between space configuration and social interaction regarding the edge and landmark effects at a site. We first design a video analytic pipeline to leverage both computer vision algorithms and graph theory to identify group activities in a public park over time and space. Then, we designed a series of models to capture the individual and combined effects regarding the two spatial characteristics, edges and landmarks. Edges involved two types of space: 1) fixed edges capture the space adjacent to fixed furniture and park boundaries; 2) flexible edges refer to the space around flexible furniture that people can move and arrange for play, sit, stand, and converse with each other (Figure 1(a)). As to the landmarks, we first considered all fixed objects on the ground equally as potential landmarks. Then, through the experiment, we identified those more essential in attracting group activities and social interaction. a) Overall research structure. 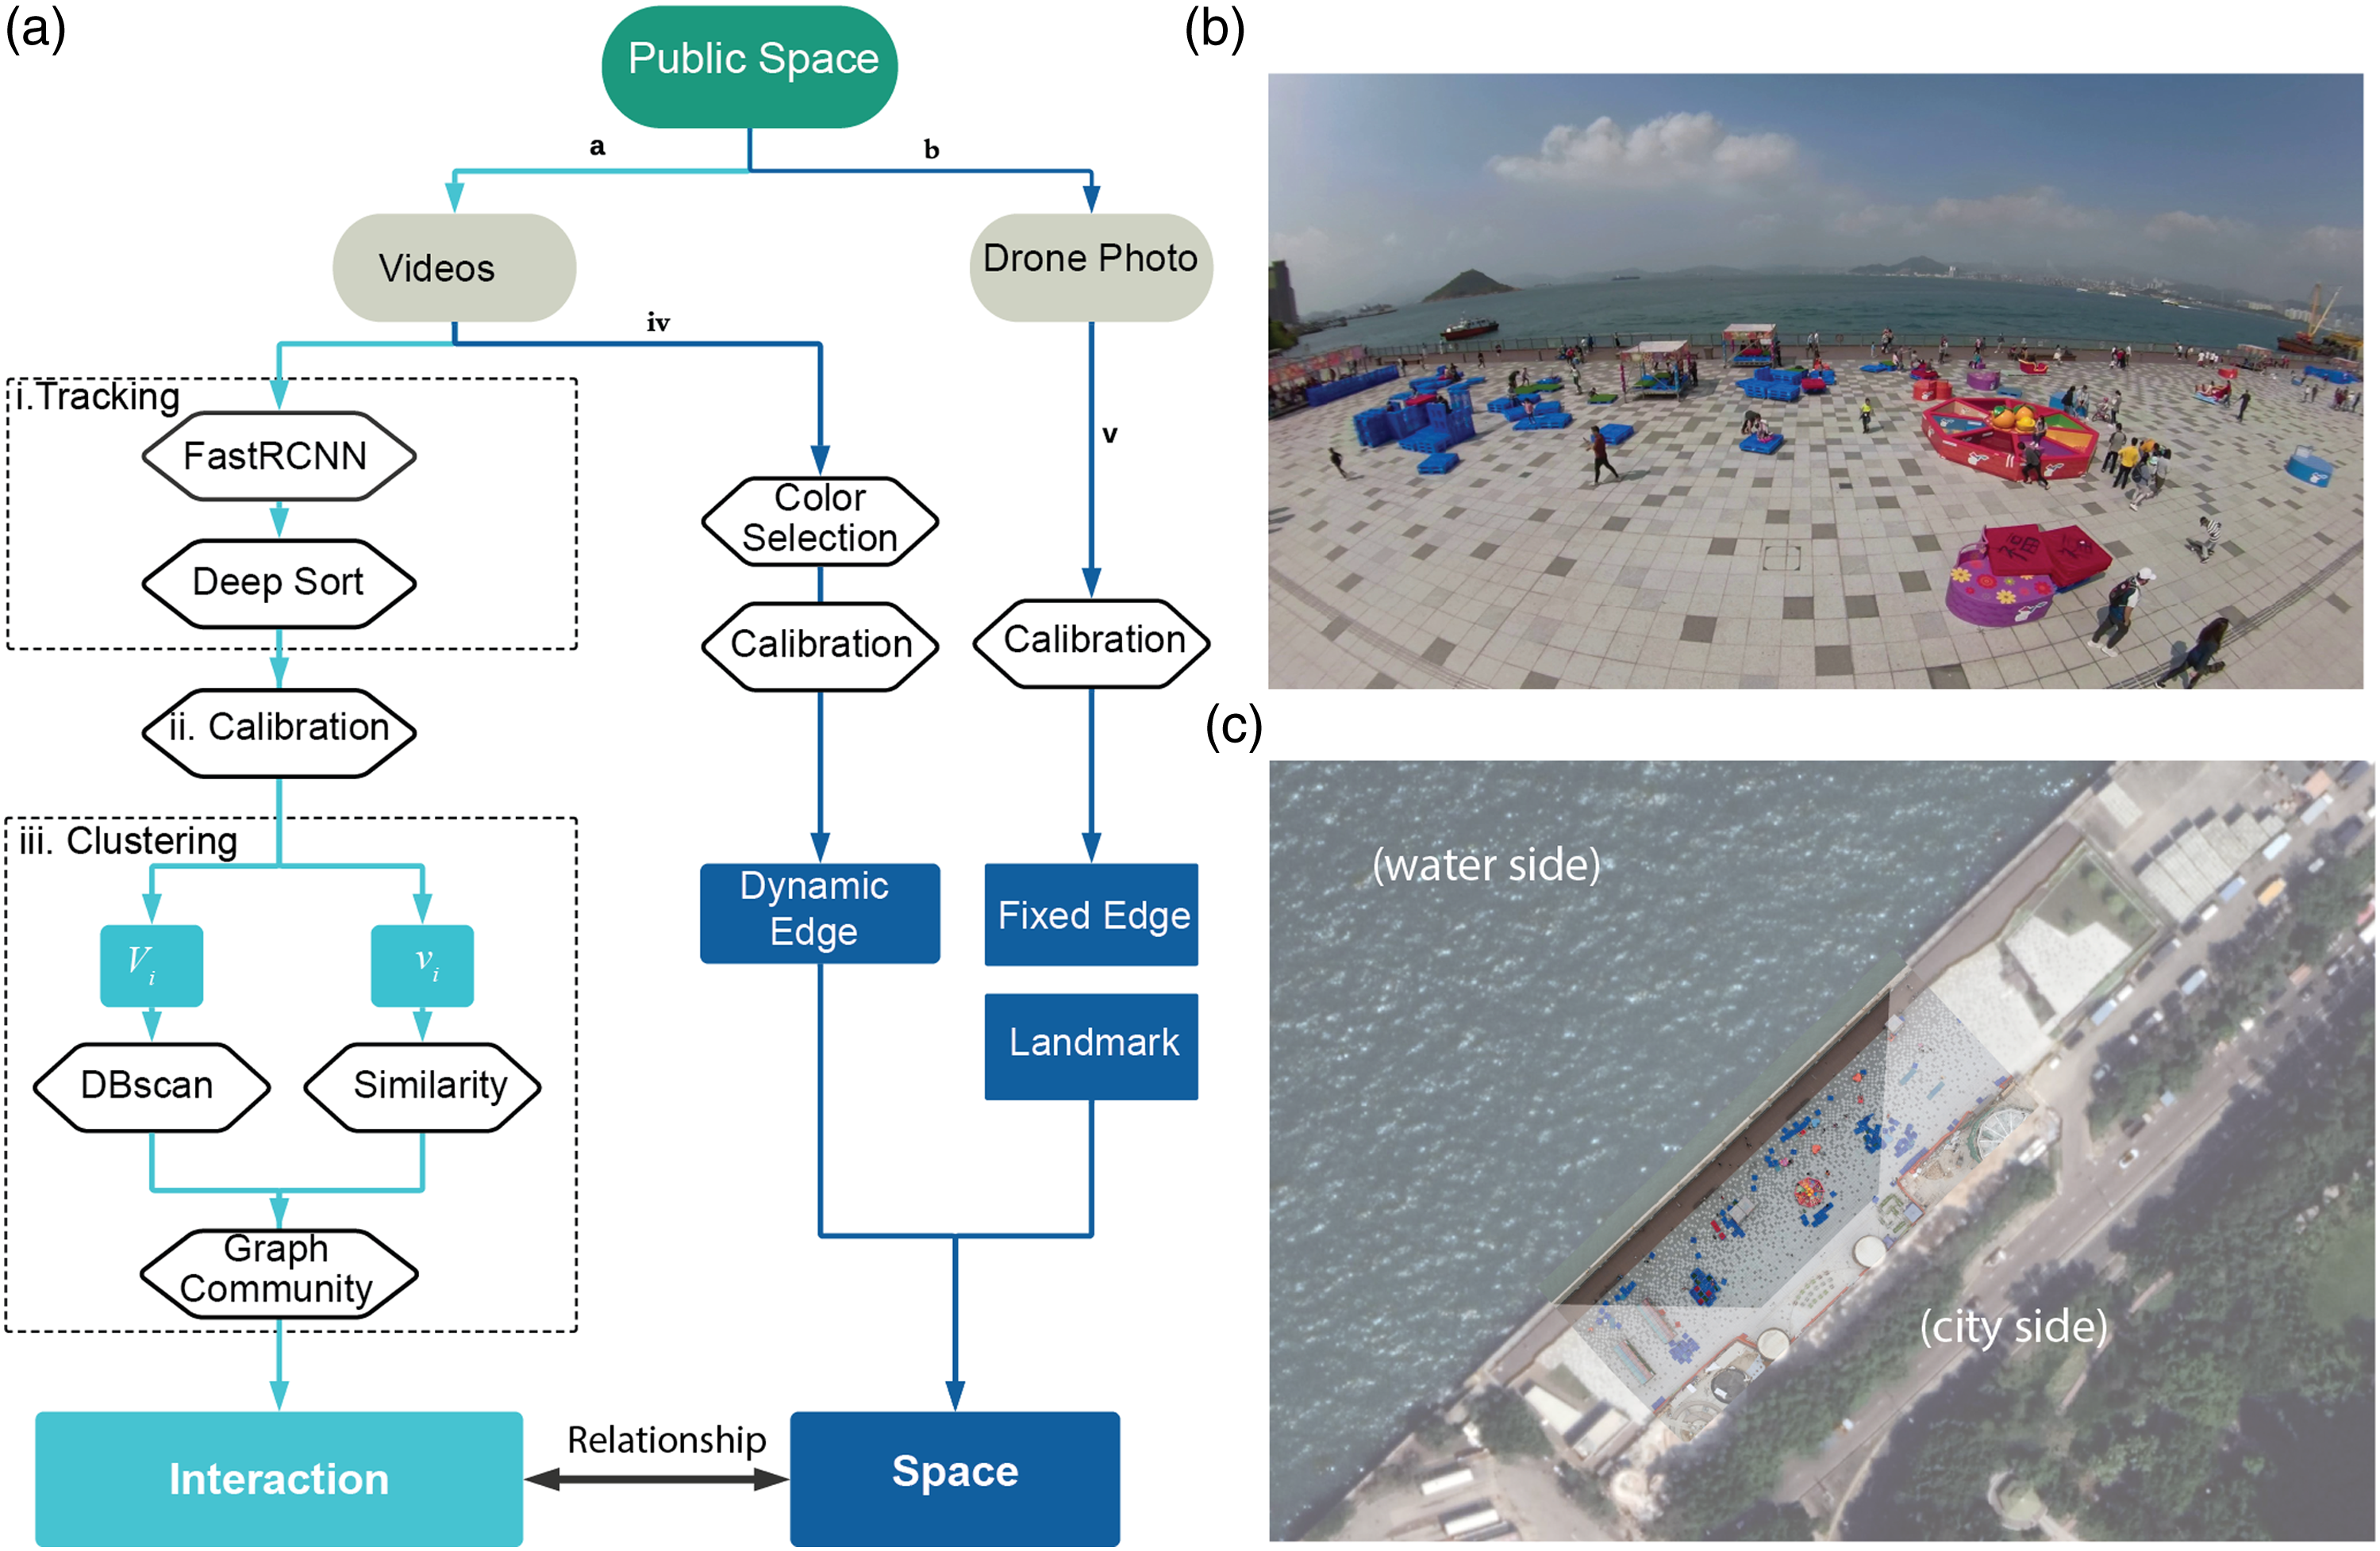
Site and videos
The videos used in this study were taken at the Belcher Bay Waterfront Park on Hong Kong Island, Hong Kong on February 14th, 2021 from 9 am to 6 pm (see details of the video source in the Supplementary Materials). The total area of the effective region is 1,641 square meters. The promenade was one of the trial sites for the open management of public spaces in Hong Kong. In relation, the Harbourfront Office entrusted a consultancy firm (not this research team) to conduct a user experience study in February, 2021. For the purpose of the study, the consultancy firm set up cameras for site observations. The video’s one frame equals 0.5 seconds in real life. Under the auspices of the Harbourfront Office, the time-lapse videos were shared for our research purpose. Ethical approval was obtained from the authors’ university before the analysis began. Thus, this research team has neither the authority to decide on the survey date nor to repeat the study afterwards. We make the best use of the video footage to examine the research questions. Also, though the survey date was on Valentine’s Day, it was a Saturday. Many family and group activities were observed at the site (see below).
Graph-based social interaction identification from time-lapse videos
Identify the spatial distribution of individuals
We use the Fast RCNN model (Girshick, 2015) and the deep-sort model (Wojke et al., 2017) trained based on the coco dataset (Lin et al., 2014) to identify the spatio-temporal location of each participant in the park. All park visitors captured in the videos were anonymised through a video anonymiser model (Ren et al., 2018) to avoid personal identification. For each visitor, we obtain a box container that locates his/her location in the image at pixel level at time t and a tracking ID that differentiates one participant from another (Figure 2(a)). Then, each individual’s image-based location is calibrated into real-world coordinates (see detailed process in the Supplemental Materials). a. Fast RCNN model detecting everyone’s location. b. DBSCAN results shown based on the calibrated location of each individual. c. Tracking result of the movement of two people. d. Similarity measures of the speed profiles of two individuals using the rolling average of their temporal speed. e. Example of detected social groups that are formed as they move towards the same destination. f. Using the graph-based method, we detect groups of pedestrians that are likely to be interacting with each other over time. People within the same interaction group are labelled with the same colour.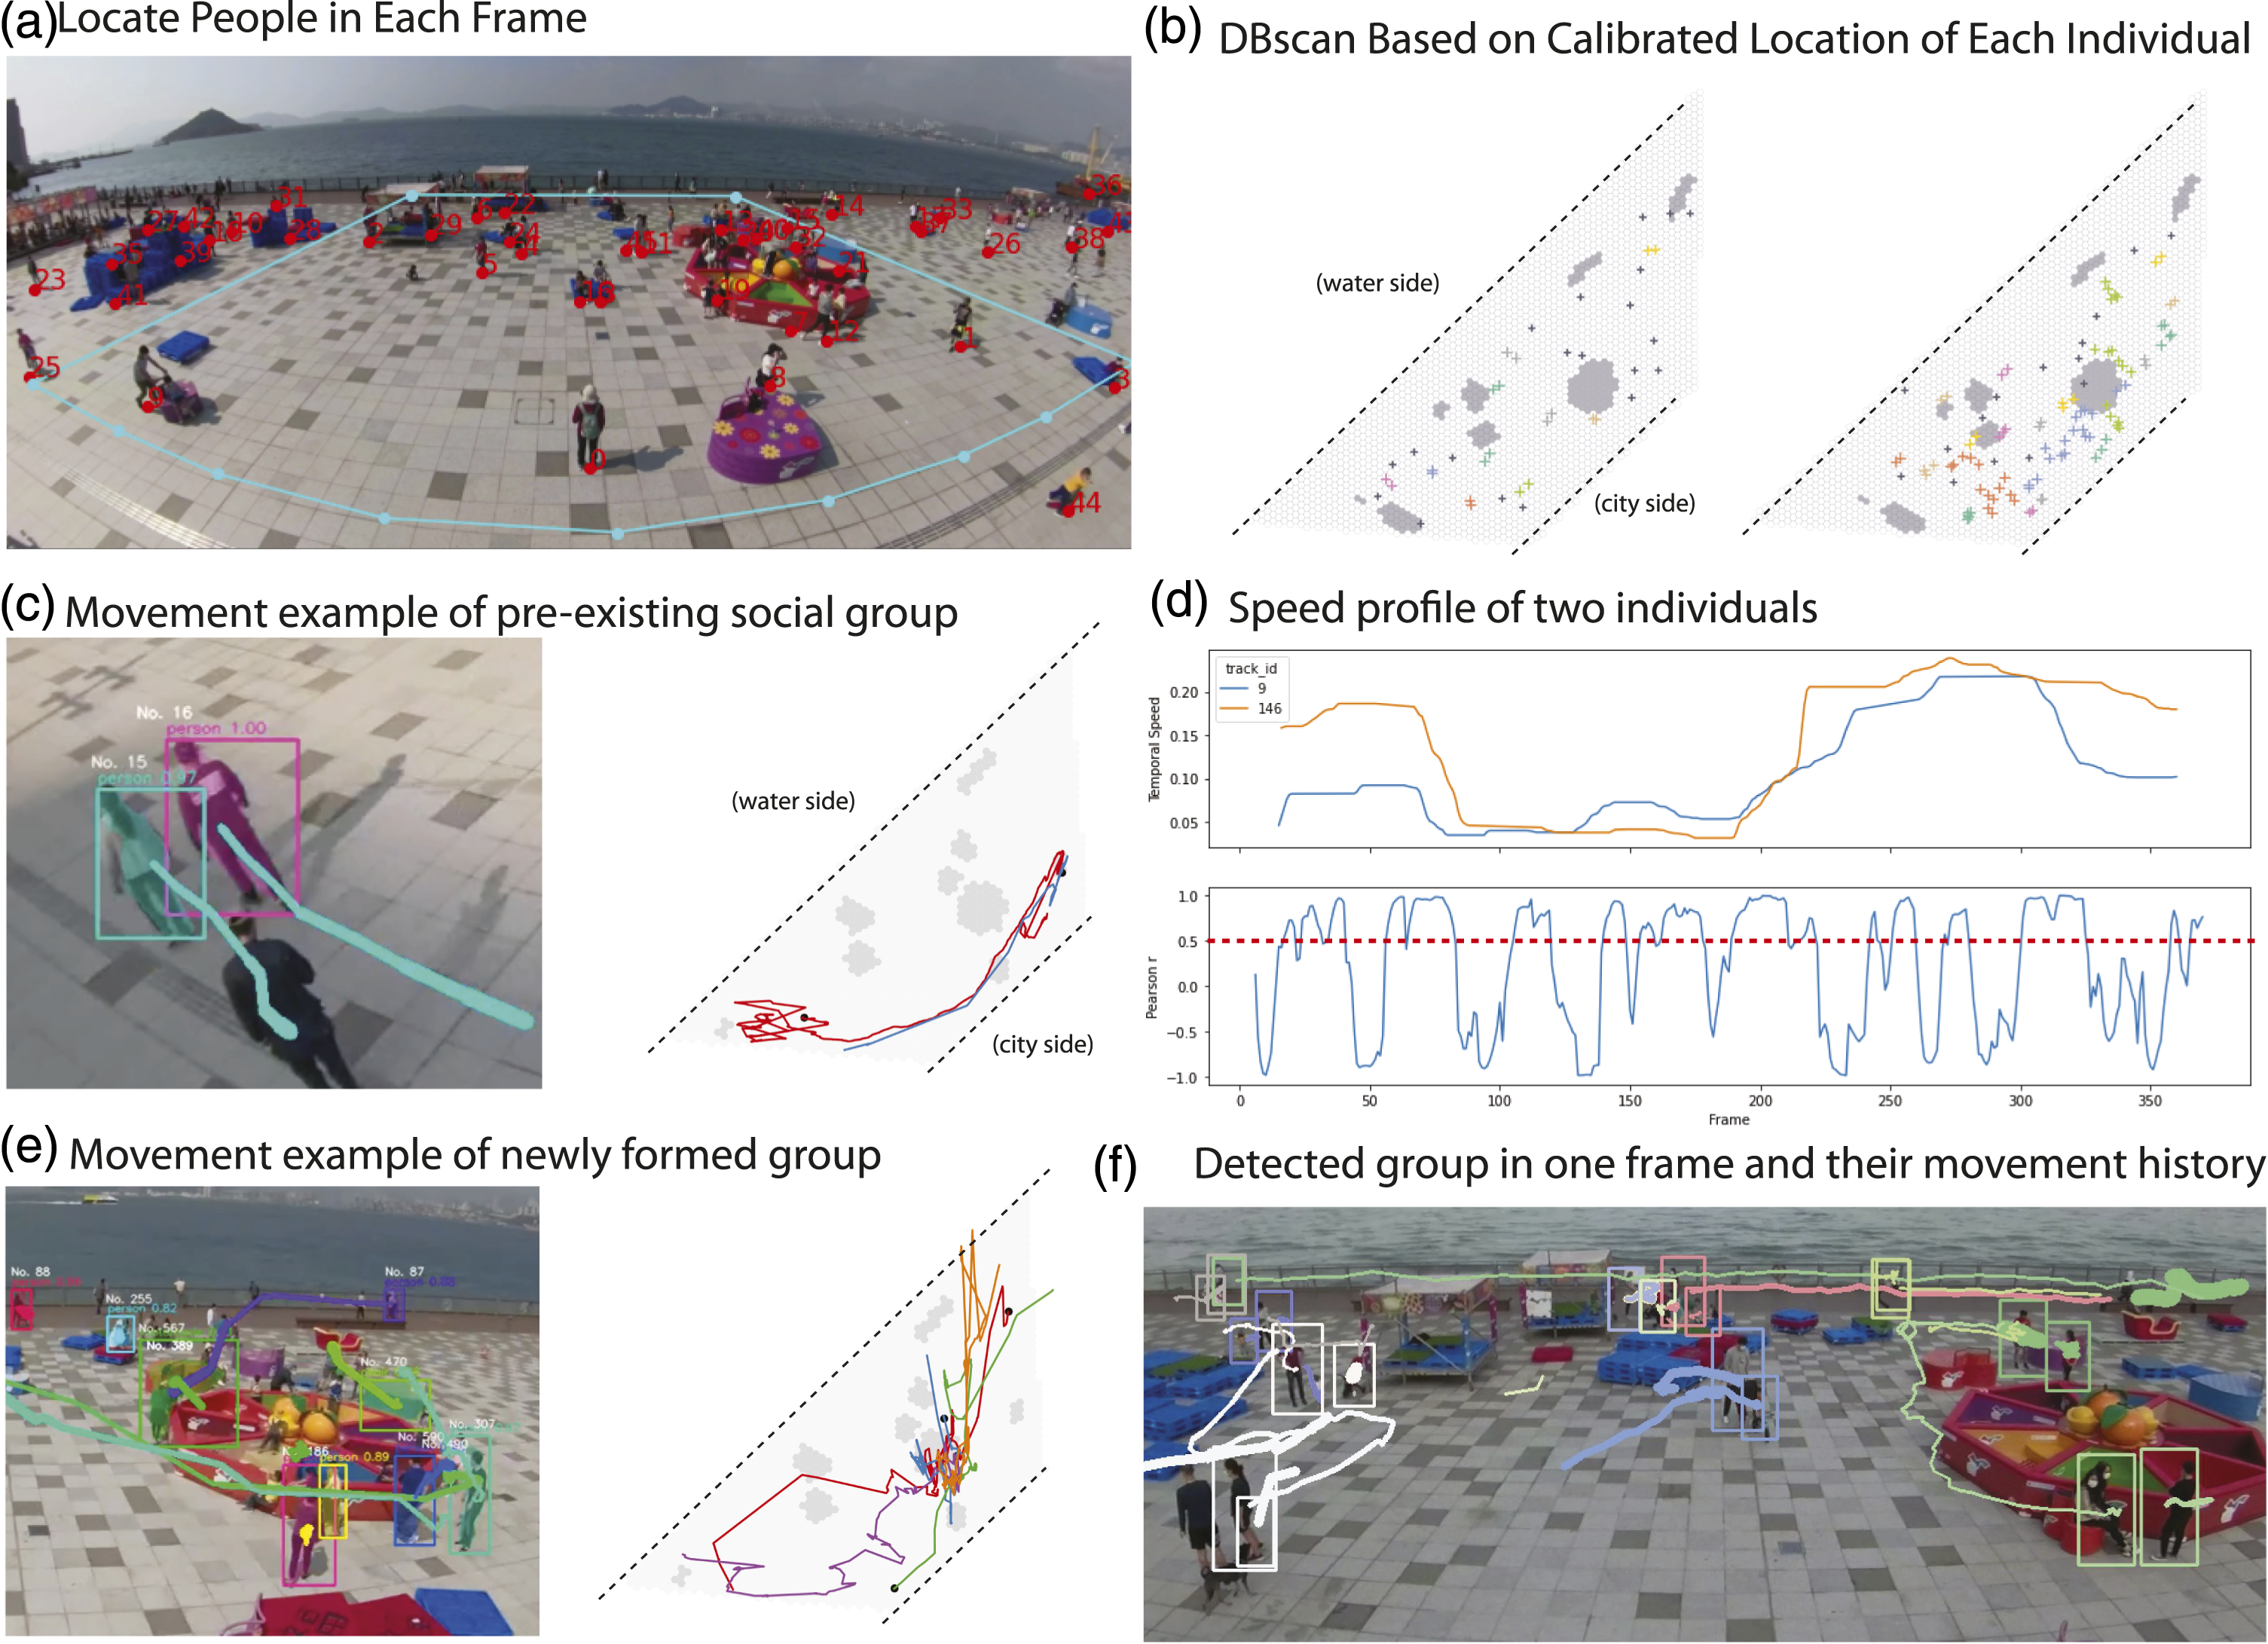
Identify potential social groups of interaction
As we do not directly know group relationships and people’s activities were constantly changing during the observation period, we used a graph-based method to identify potential interaction among groups of people based on distance and their moving characteristics. We consider that a group of people that act (e.g., walk, stand, or stand) at a similar speed (0 for stationery activities) and stay close to each other for a period of time are likely to have interaction. We first apply a spatial DBSCAN algorithm (Schubert et al., 2017) to all visitors in each frame. Based on Edward T. Hall’s theory (1963), there are different critical interpersonal distances that delineate the culture of interaction. Here, we select the close social distance of 2.1 meters as the maximum distance value in the DBSCAN algorithm and two individuals as the minimum size of each cluster. For each frame
Using each individual’s location in each frame, we also compute a rolling mean speed

Then, we construct a graph network for every 7200-frame time sliding window (the sliding interval at 20 frames),
Next, for each time window, we use the Girvan–Newman Algorithm (Newman, 2004) to cluster the graph network and obtain the communities or groups, which are subsets of people that are more closely connected than others. The Girvan–Newman Algorithm is a divisive method that allows us to start from the entire graph as a whole community and gradually remove the links between nodes based on the edge betweenness-centrality value. This method does not require a pre-defined size of each community. A similar graph-based method to identify social groups among pedestrians was used by Ge (2012). Figure 2(c) shows the type of community of two people that are constantly walking together. Figure 2(e) shows the kind of community forged as people come to play in the centre. Figure 2(f) shows all interaction and movement tracks detected in each period before this frame.
A total of 36,337 visitors were detected staying in the study area for at least 10 seconds. Among these participants, 6,424 of them had been in at least one social group. Here, we define a social group as composed of a unique set of people. People might deviate from their original interaction group and form new interaction groups during the observation time. For example, person
Spatio-temporal composition of public space
To quantify the impact of edges and landmarks on social interaction, we first locate their positions from the videos and then construct spatio-temporal parameters to describe their characteristics.
Locate the landmarks and edges
A landmark can be any remarkable object situated along or distant from the pedestrian route (Millonig and Schechtner, 2007). However, objects differ from each other by their size, colour, and location. Thus, we document all fixed objects observed on the site and put them into four different categories per their functions, namely, a carousel, four benches, three steel-structured temporary sheltered pavilions, and four heart-shaped seating (Figure 3(a)). The flexible furniture primarily consists of some moveable and stackable blue boxes (100 cm* 100 cm* 10 cm). Two major types of spatial edges are then delineated around these objects: 1) fixed edge: a space adjacent to the park boundary and fixed objects; 2) dynamic edge: a space adjacent to the flexible furniture, which could be stacked and moved. a. Example frame to extract the location of all movable furniture by selecting all blue objects. b. Transform the pixel-level locations in the perspective view to the plan view. c. Each cell’s distance from the fixed components on the site. d. Spatio-temporal distribution of all detected furniture (the blue stackable blocks) in the video within the viewshed of the video. Darker blue indicates the cell has been occupied by moveable furniture for an extended period of time.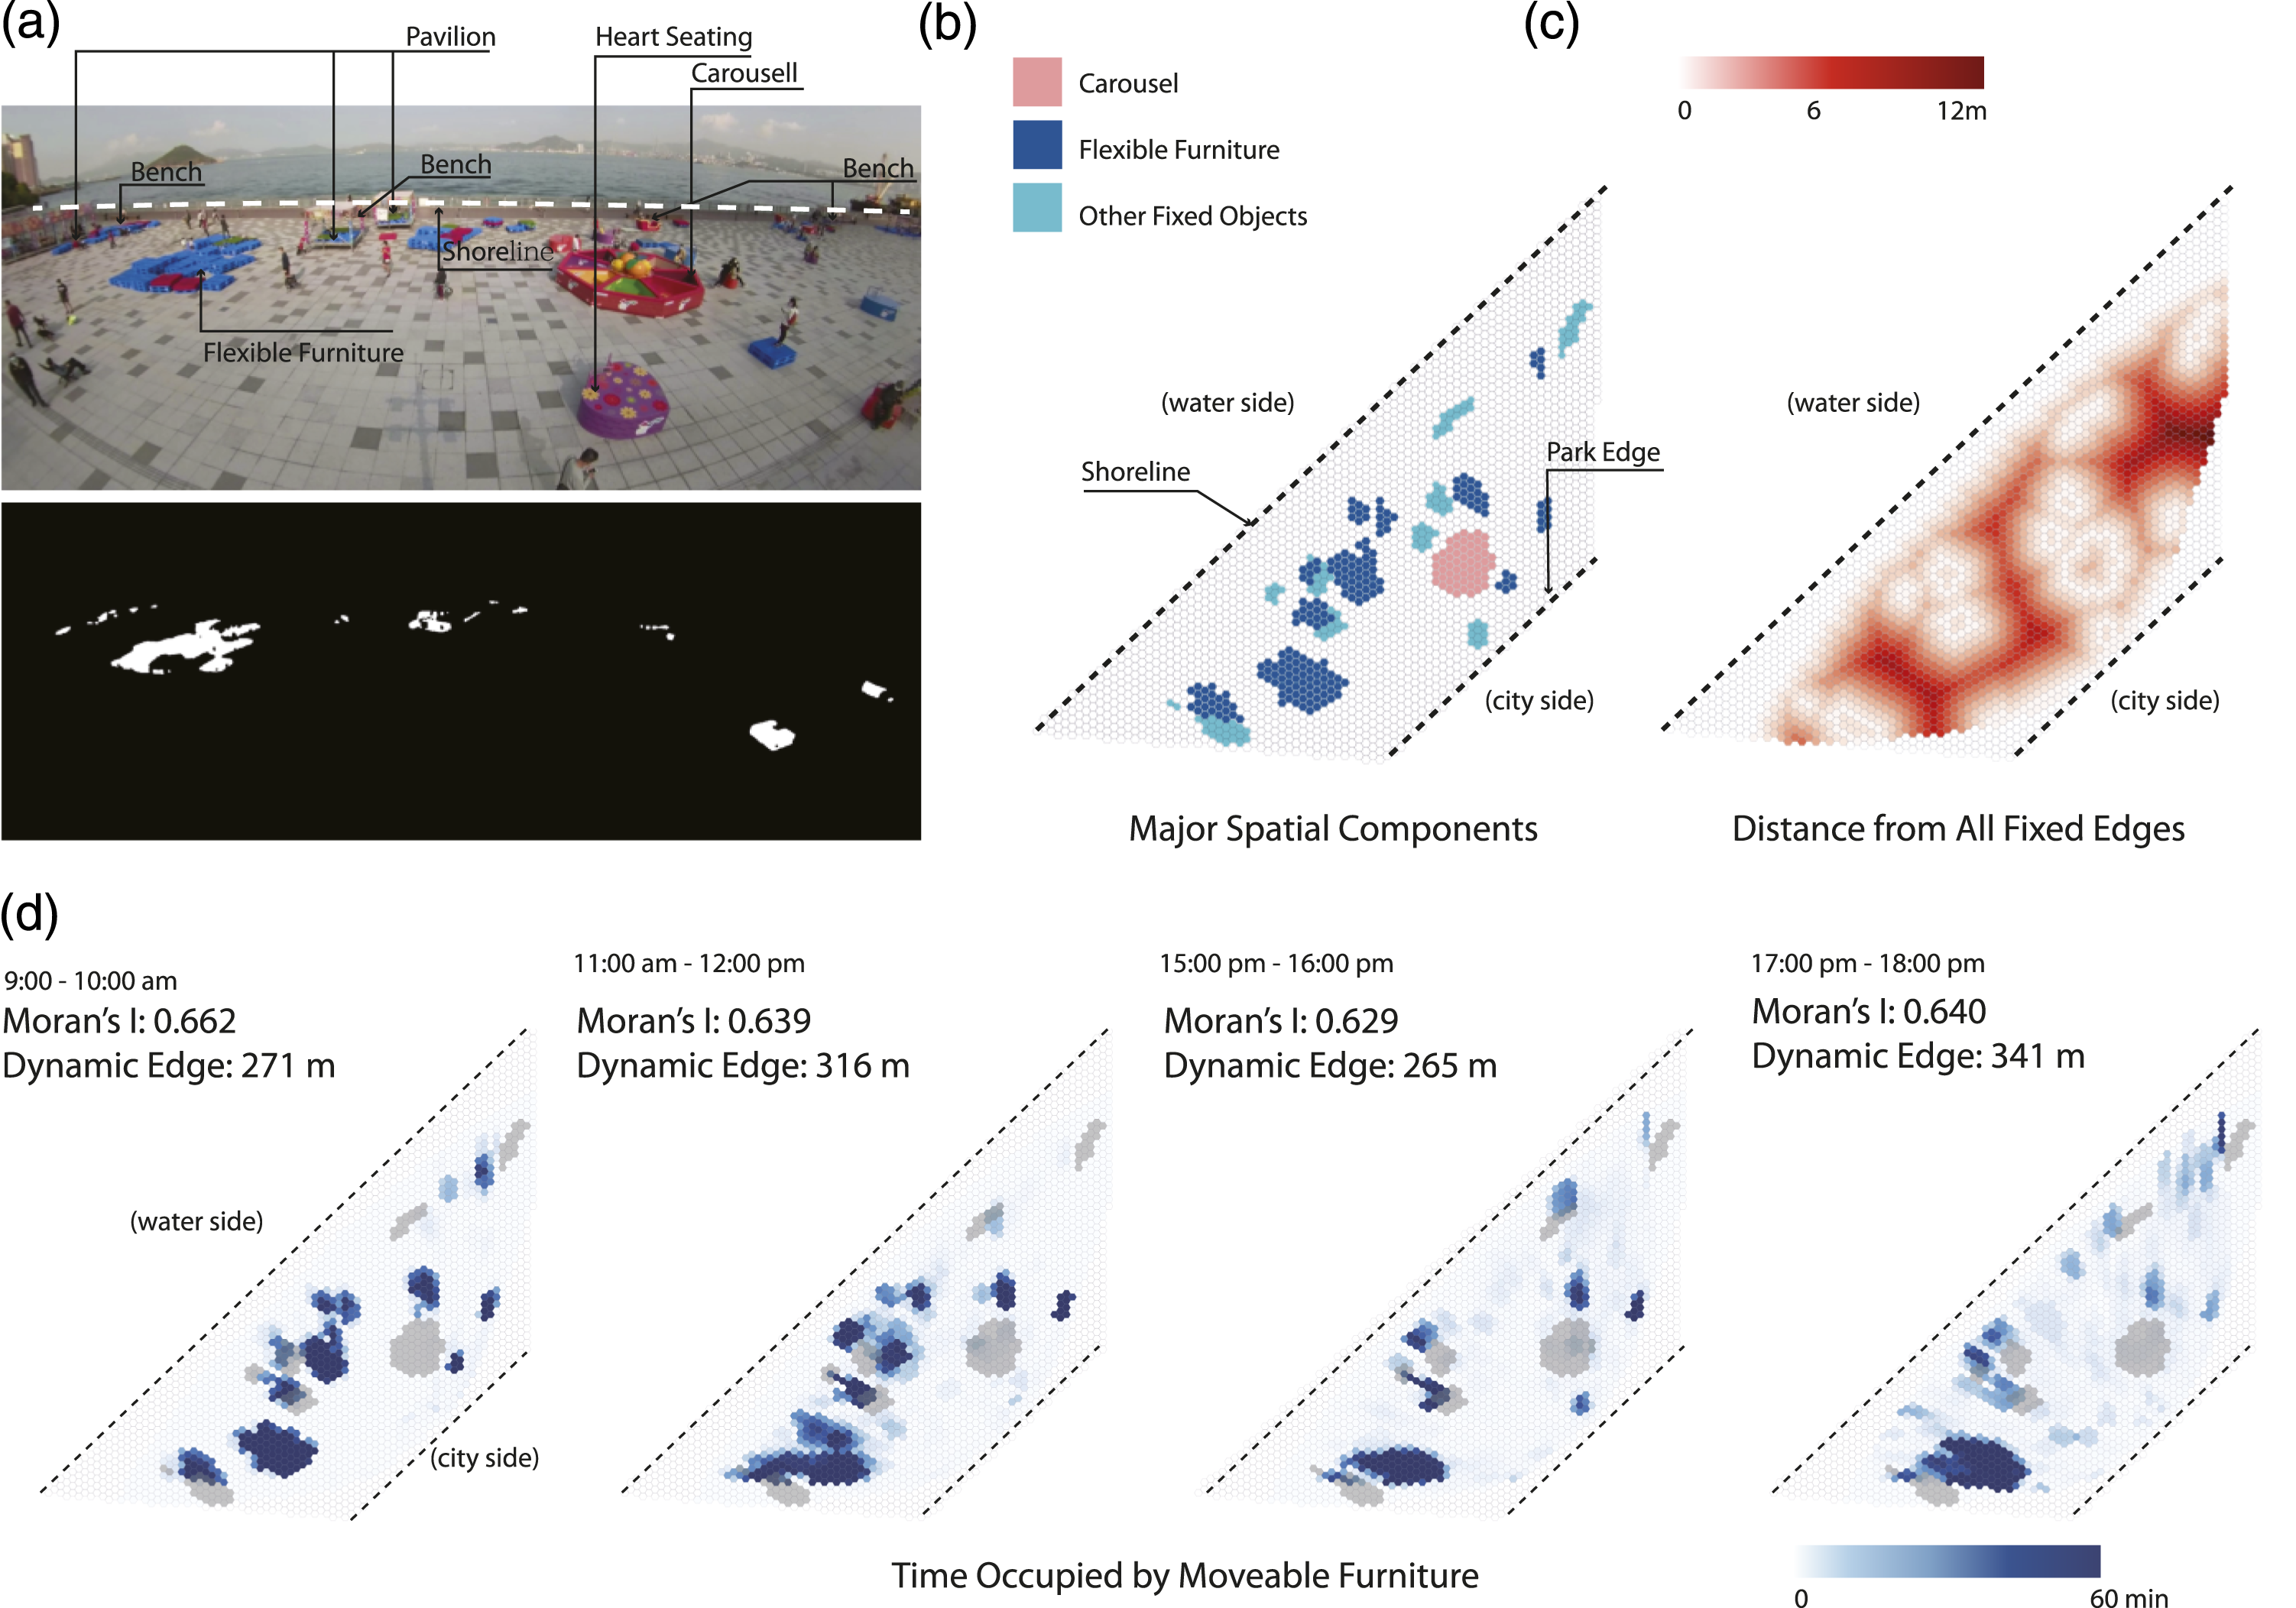
Three steps are involved in documenting the spatio-temporal characteristics of landmarks and edges: 1. Locate the fixed objects in a frame (Figure 3(b)). 2. Identify moveable furniture by its colors in each frame. Here, the blue blocks have specific hues and saturation ranges
1
that we can directly use to detect their locations from each image (Figure 3(a)). 3. Calibrate the locations of all objects to the real-world coordinates (Figure 3(b)).
Then, we join all identified objects to the hexagon cells for analysis. Figure 3(d) shows each cell’s aggregated time occupied by detected moveable furniture. The detection of a dynamic edge requires more steps as the moveable furniture is only forming a sitting boundary, for example, when it is not being constantly moved around. Here, we chose a time threshold of 10 minutes to decide if a piece of moveable furniture is forming an edge or not. Within each hour, if any movable furniture occupies a cell for more than 10 minutes, we assume that this cell is part of a dynamic edge. As a reference, we also show the associated Moran’s I (p-value = 0.0001) and the total length of the edge of the flexible furniture for each period. Moran’s I (>0.60) indicates that the spatial distribution of the moveable furniture is far from random but rather clustered in space.
Construct spatio-temporal measures of edges and landmarks
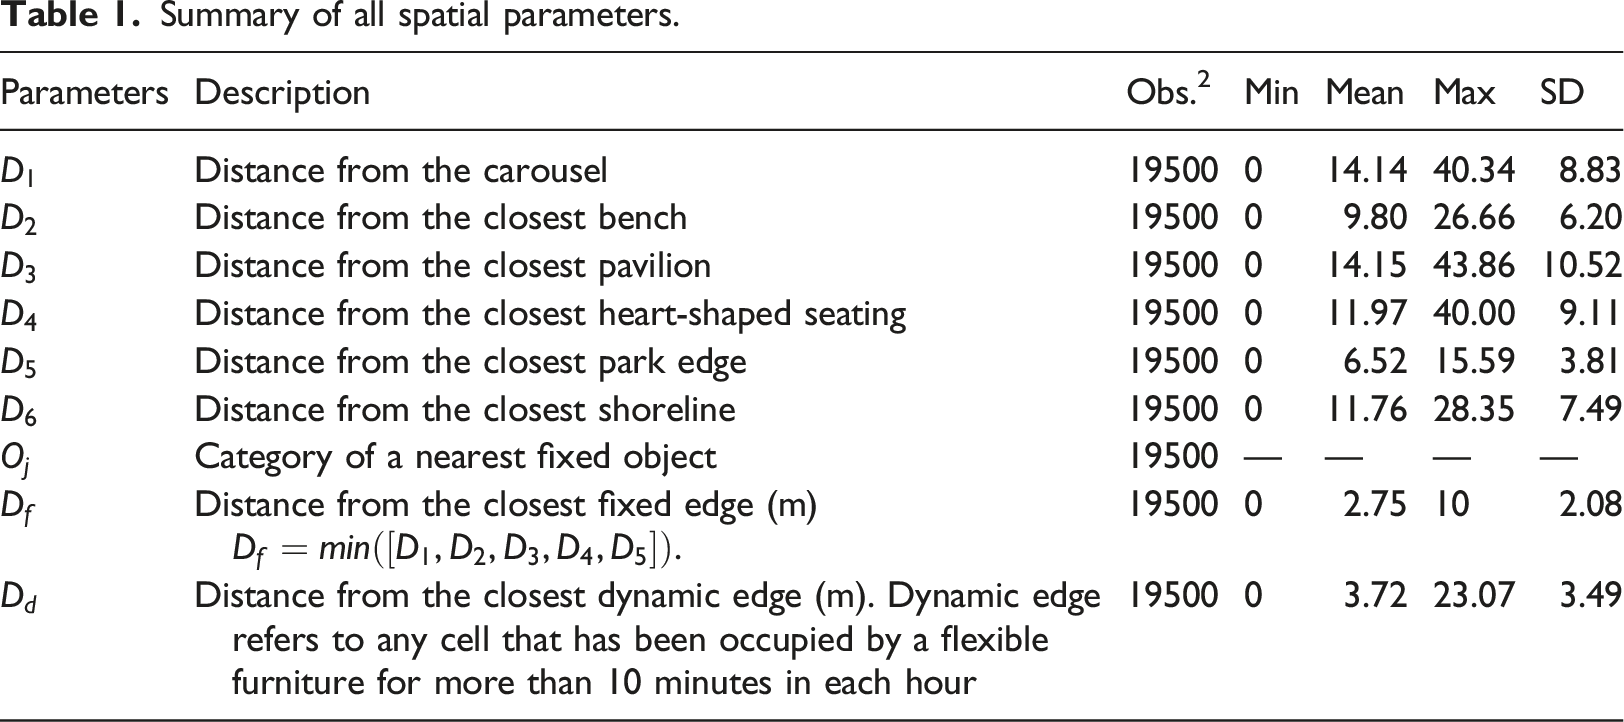
After obtaining the locations of all fixed and flexible objects on-site, we calculate the shortest distance from any cell i within the study area to an edge cell of any type of object
Model Specification.
To understand the relationships between social interaction and spatial configuration through time in a day, we further specify a series of experiments as follows. We first examine whether the edge phenomenon exists during our observation period through a simple negative binomial model (Equation (1)):

The second experiment is to understand among all types of edges, which ones are more likely to have a positive relationship with social interaction. Accordingly, we have the following model (Equation (2)):


Summary of all spatial parameters.
Results
Spatial distribution of social interaction
We first show the spatio-temporal distribution of identified social groups through the time of the day (Figure 4(a)). A social group may consist of two or more people (Figure 4(c)). For each hexagon cell, we calculate the time any detected social group occupies it within one hour. Spatially, we observe that there have been constant group activities and social interaction happening around the carousel. a. Spatial distribution of detected social groups and their associated activity time spent in each cell. b. Number of people and number of people in groups detected every minute from morning (9:00 am) to afternoon (18:00 pm). c. Distribution of social group size.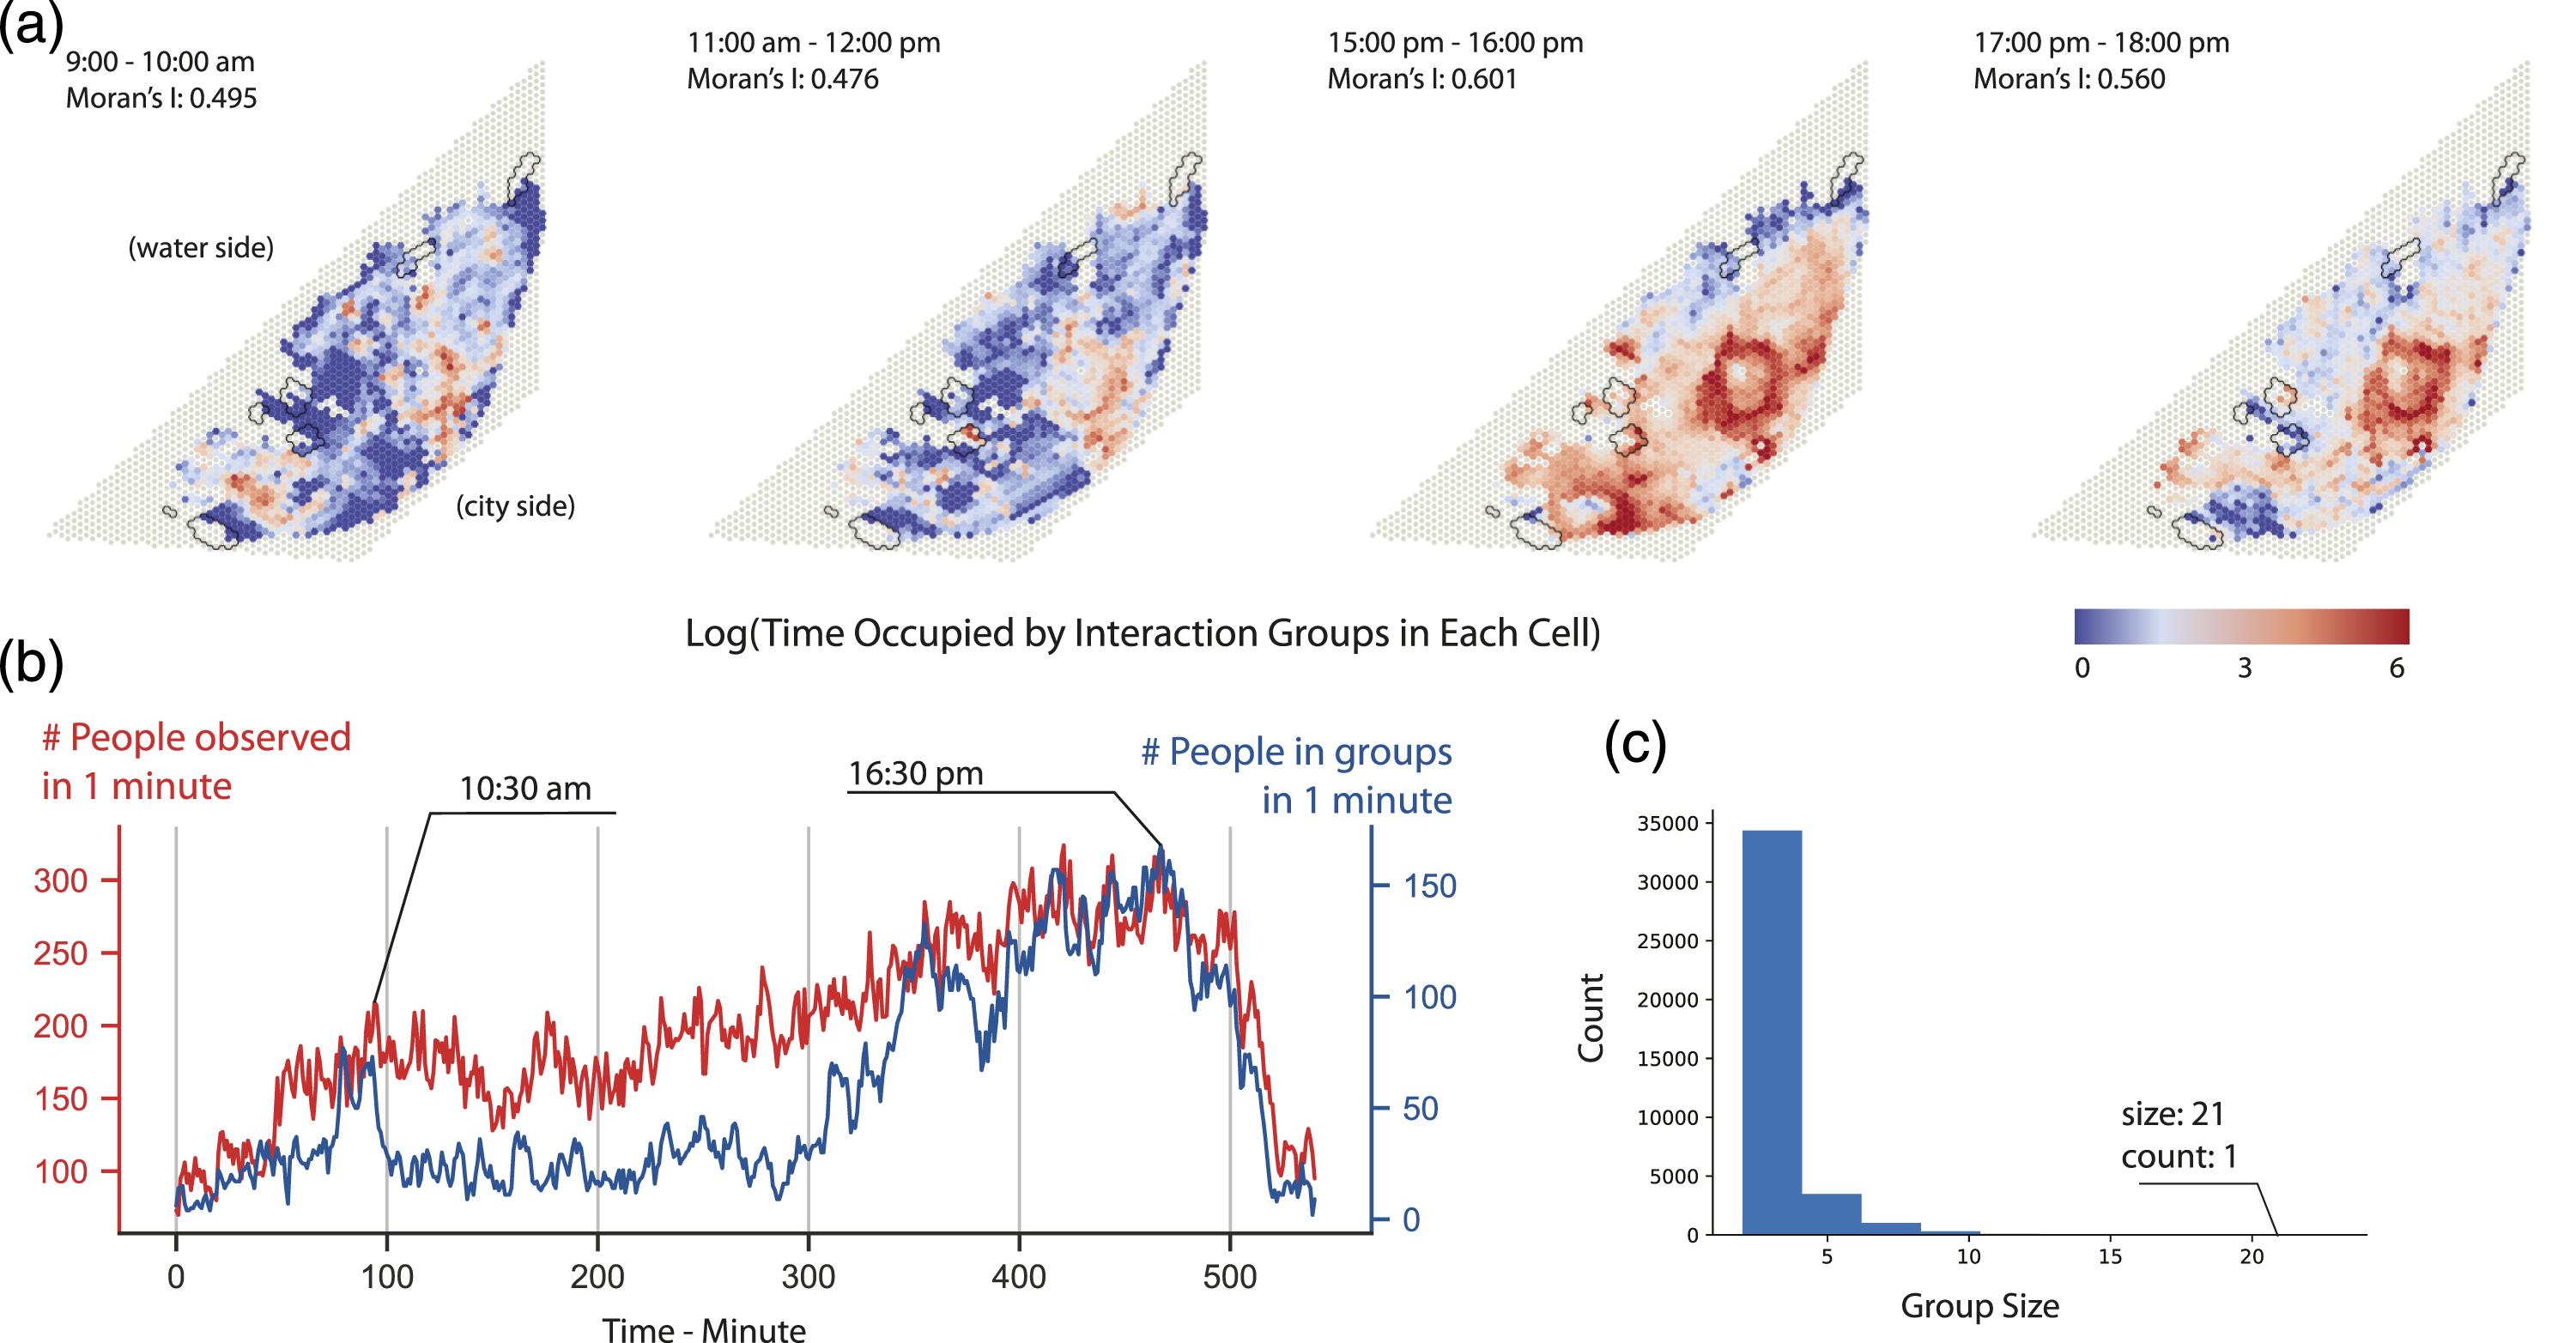
Apart from the carousel, the west side of the study site also has a constant concentration of interactions around some moveable furniture. The Moran’s I value suggests a higher degree of spatial clustering in the afternoon (0.601, p-value = 0.0001) compared to the morning (0.495, p-value = 0.0001). Temporally, we observed two peaks of overall activities during the study period – one was from 10:00 to 11:00, and the second was from 4 pm to 5 pm.
Edge effects on social interaction
Figure 5(a) shows the results of the first model. Only parameters with p-value <0.05 are shown in the diagram. We observe that most of the time within the study period, more group activities and social interaction happened closer to object edges, be it dynamic ( a. Results of the first model, estimating the effects of fixed and dynamic edges on social interactions. All variables are standardised. b. The effects of fixed and dynamic edges on social interactions, differentiating the fixed edges by their object type. c. Margin plot of the object category effect on interaction. d. Non-linear relationship between the distance from the carousel and social interactions. e. Scatterplot between the total length of flexible edges and proportion of people participating in social groups to total people observed in each minute. f. Scatterplot between flexible furniture occupation time’s Moran’s I and proportion of people participating in social groups to total people observed each minute.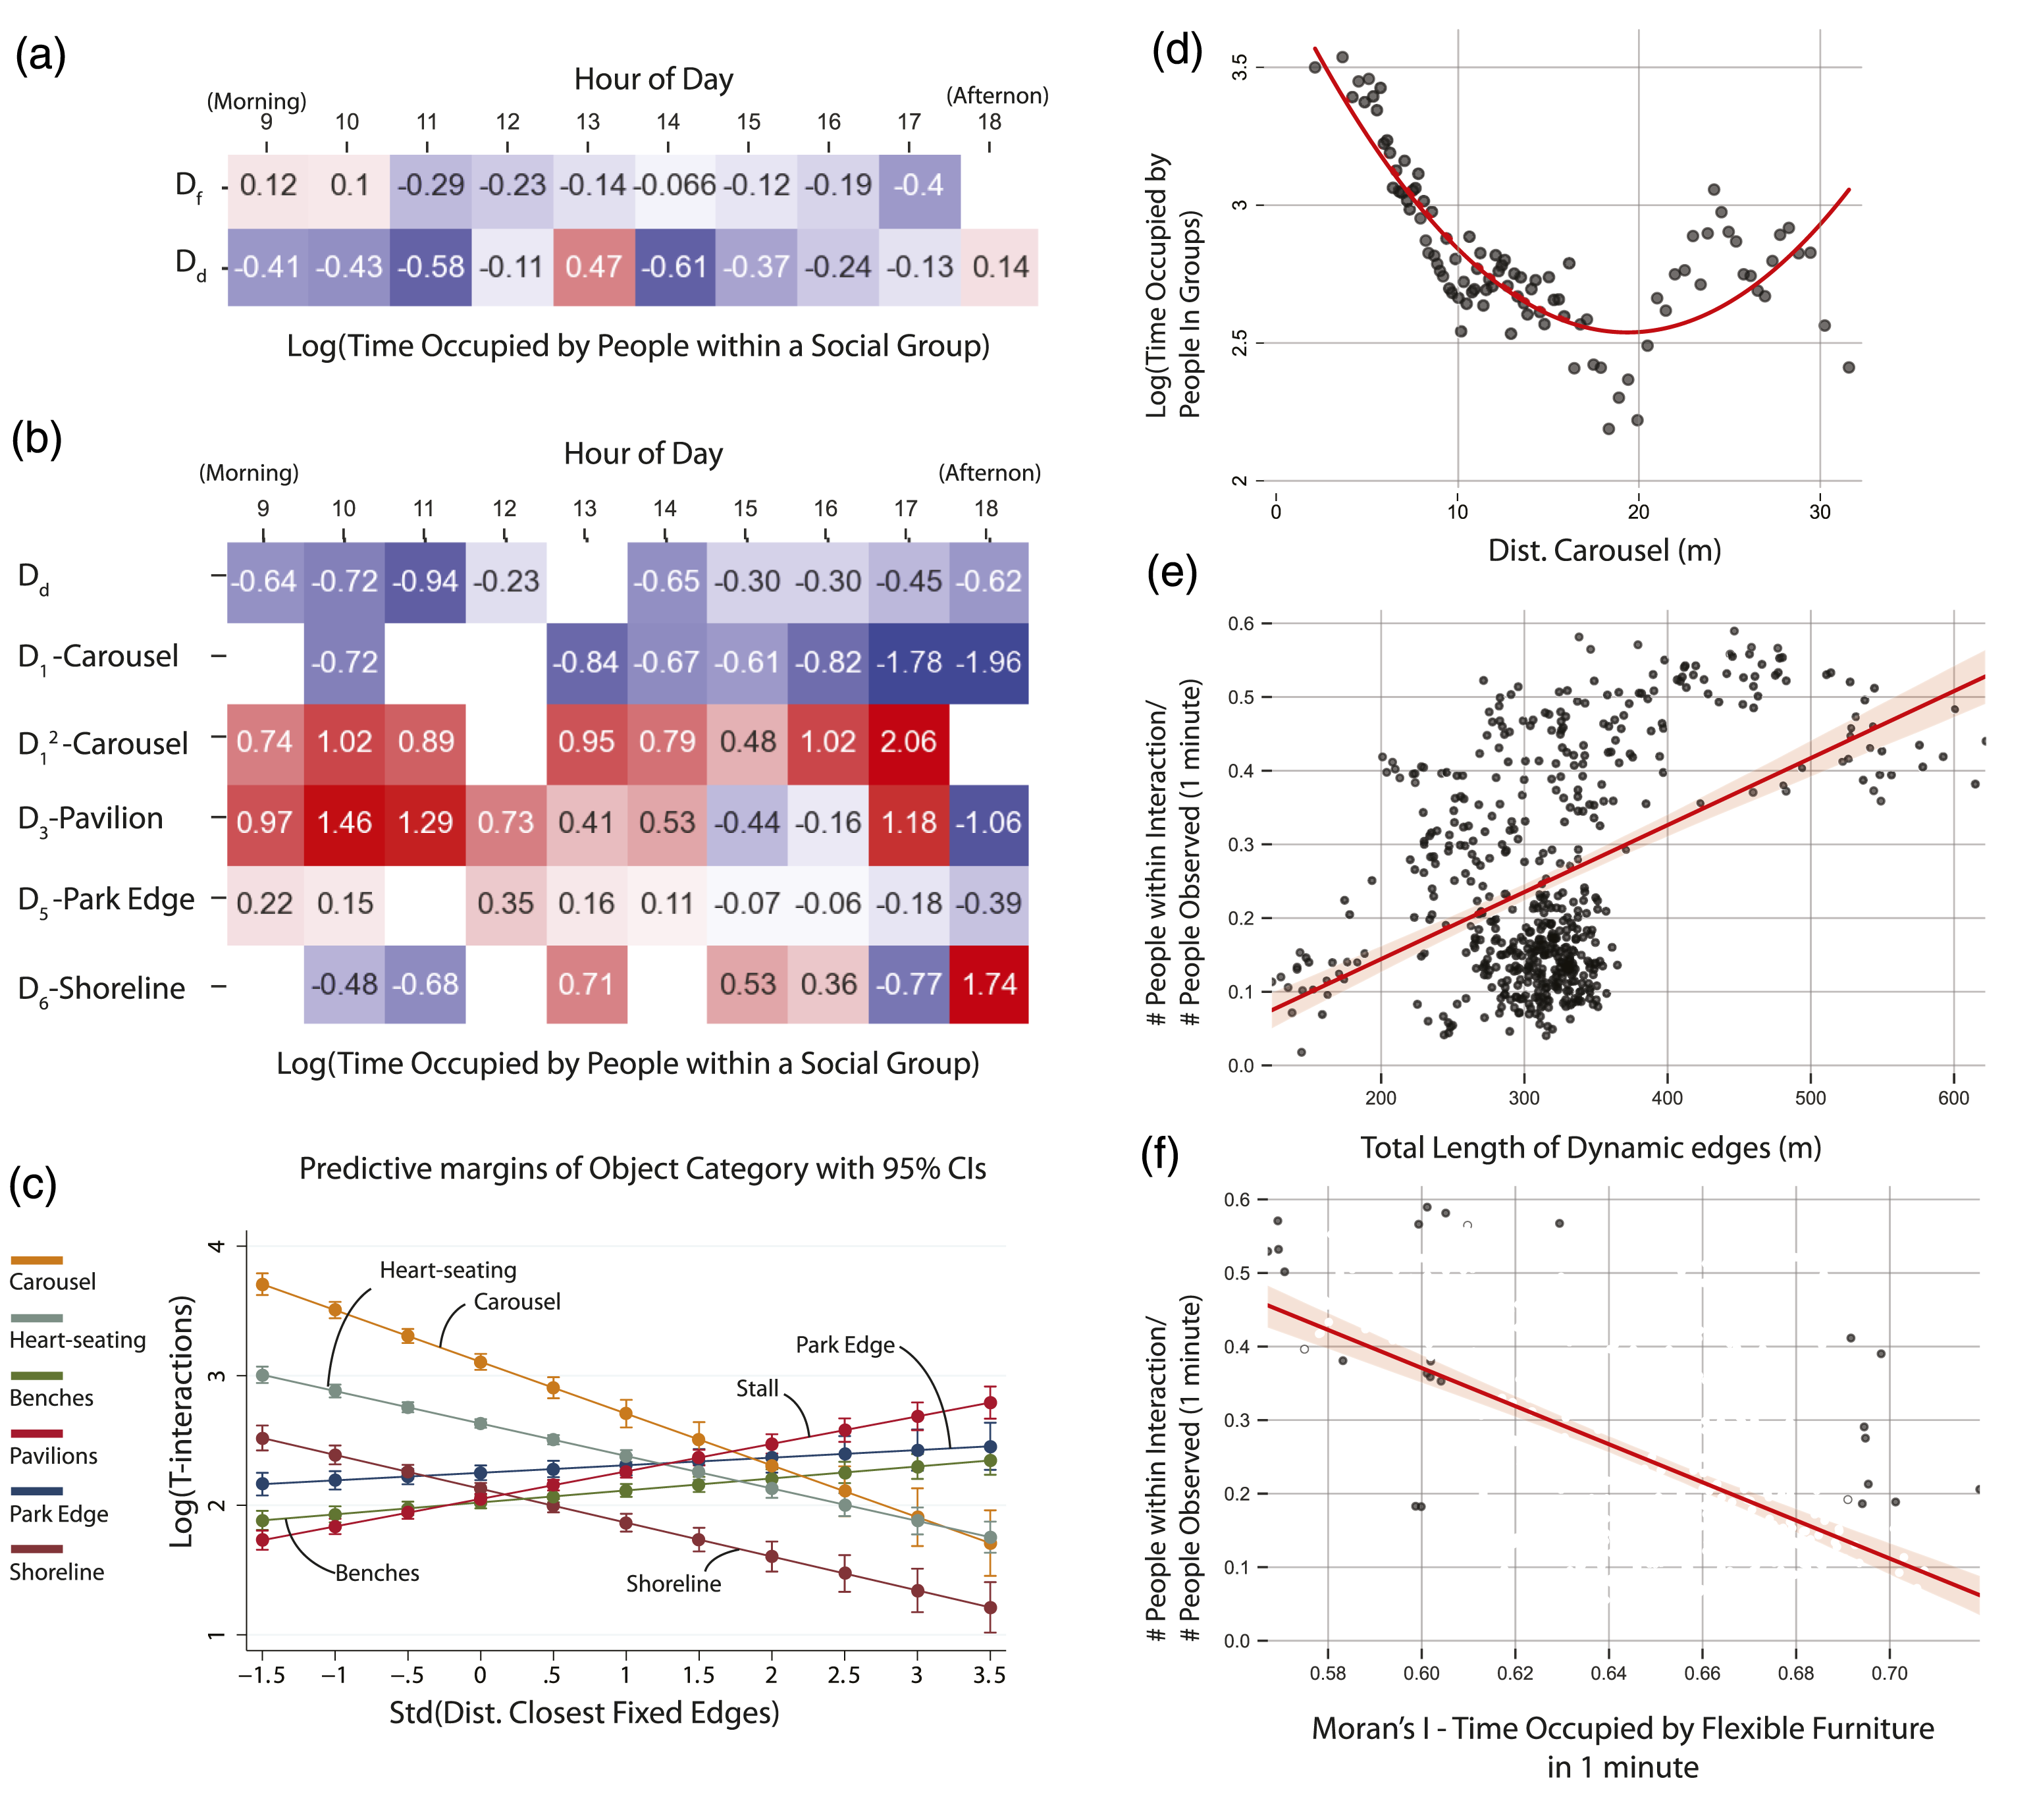
To further unpack the variations among fixed edges, we show the results with equation (2) (Figure 5(b)). The distance from the heart-shaped seating (
Three main points can be seen in Figure 5(b). First, consistent with the first experiment, dynamic edge plays a rather consistent role in estimating the level of social interaction. Second, the carousel is the second consistent estimator of social interaction throughout the study period. Its associated quadratic term (
We use two plots to further illustrate the effect of dynamic edges on social interaction (Figure 5(e) and (f)). Here, the interaction intensity refers to the proportion of people participating in any social group in a minute. We use Moran’s I value and total length of exposed edges of all flexible furniture to estimate the degree of clustering. We observe that Moran’s I is negatively associated with interaction intensity, while the total length of exposed flexible furniture edges is positively associated with interaction intensity.
Landmarks and social interaction
As described previously, instead of pre-determining which object is more likely to be a landmark, we include all objects in equation (3) and use a categorical variable and an interaction term to show the marginal effect of each object. Figure 5(c) plots the results of equation (3). Consistent with the previous observations, the closer a cell is located to the carousel, the more likely we will observe social interaction happening in that cell. The heart-shaped seating has a similar but less dominant effect than the carousel. In addition, the distance from the shoreline also has a negative correlation with the observed interaction group. In contrast, compared with other fixed objects, the benches, pavilion, and park edges are less effective in attracting group social interaction.
Discussion
Social group activities in public space are not random in space
We first show that social group activities in public spaces are spatially clustered. The carousel on site has been the most successful in attracting groups all day long. As Whyte (1980) claims, what attracts people most is others. The carousel on-site provides a place to stay, play, and watch and be a stage to host activities that further attract more people to join. It is clear that planners and designers could encourage cluster of activities by creating such foci in a public space.
Edge phenomenon prevails, especially the dynamic edges
The ‘edge phenomenon’ holds in our experiment. Most importantly, the effect of dynamic edges is more substantial than that of fixed edges during most of the day. This new evidence has important planning implications. Notably, flexible features are important in activating public space by drawing people in groups (Figure S1(a)). In particular, activities such as playing with the moveable furniture tend to attract attention from people passing by (Figure S1(b)). And with many kids engaging with the moveable furniture on-site, parents usually stay around to keep an eye on them, further extending the social groups' size around the dynamic edges (Figure S1(c)). In other words, the intensive play activities further attract people in groups and encourage them to form new groups. The flexible setting enables visitors to develop their own relationships within the site and choose their way of participation. It resonates with the statement that planning and design should aim to generate maximum choices for people to form social pattern (Gans, 1961). Hence, if the goal is to create a vibrant open space, the use of flexible furniture should be encouraged.
In addition, our results also show that the edge effect, even for the most critical fixed object in this study, the carousel, has a threshold. Once beyond the threshold, the edge effect diminishes as people will likely be attracted to other features within their sight.
Landmarks exist among fixed objects in attracting social groups
Although this study does not specify landmarks among the fixed objects, the model results indicate that the carousel and the heart-shaped seating objects are dominant in attracting more social interaction activities. They become the ‘stimulus’ described by Whyte and intrigue the ‘triangulation’ process. This result informs the importance of specifying spatial hierarchy and creating unique objects in space design. Moreover, with these fixed landmarks, people also arrange the moveable furniture around them to watch the activities happening around the landmarks.
The effect of natural scenery in a public space
With the study site in Hong Kong, a very dense urban environment, a natural scenery overlooking major green and blue assets is a valuable feature in public space design. The Victoria Harbour, one of the city’s most important assets, provides a meaningful ‘backdrop’ for all activities happening at this park. Despite the fact that visitors in most parts of the park can see the Victoria Harbour, our study confirms that people and group activities tend to stay closer to the harbourfront, especially in the morning. One of the challenges in coastal cities is that many waterfront locations have been occupied by private development, port activities, or vehicular roads that prevent public enjoyment. Reflecting on the comments made in the Introduction, these forces are eroding the urban social fabric. With the pandemic, urban planners and designers should accord high priority to urban public spaces near major natural scenery or resources to bring urban dwellers together in space and time.
Applications in data-driven public space management
Beyond the empirical findings, this study demonstrates a data-driven direction to understand the relationship between the design of public spaces and visitors’ behaviour. With this approach, we have captured the interaction between individuals, groups, and site furniture in a public open space in Hong Kong. In smart cities, the traditional post-occupancy evaluation process can be supplemented with the methods of this study to collect and analyse users’ behaviour after project delivery. In this way, project teams can measure success and identify room for improvement. Moreover, visitors may use a public space differently in different seasons. Our analysis can be applied to understand these differences at various times of a year. Also, changes in site layouts and furniture can be evaluated more scientifically based on changes in the patterns of usage and visitors’ behaviour. Using our method, designers can also first design prototypes and make temporary public spaces in cities to know how well their designs could be adopted. Nowadays, many cities are seeing a resurge of urban activities in the post-COVID-19 pandemic era. It is necessary to know whether and in what ways the spatial and temporal patterns of public space usage have changed. These data can inform and support city administrators and planners to better design and manage open spaces.
Limitations
A couple of limitations remain. First, the social interaction in this study does not distinguish between people who know each other beforehand and newly formed groups. It would be very interesting to identify the groups formed by strangers, for example, who join games in parks together, or parents who stand together to watch their kids. Such newly developed social ties can be a good sign of community ties developed through park visits. Such findings would further help urban design practice to understand what features in parks can benefit local communities rather than only attract tourists. Second, in this study, we used people in groups to proxy interaction groups. Future research could further differentiate interaction types, such as talking and playing. Design practice usually envisions diverse activities happening in a single public space through proper design. There is a need to empirically test the implementation of such a design vision to further measure public space design’s effectiveness. Lastly, our site has a unique feature of facing the harbourfront, and the time of data collection was on Valentine’s Day. These features may have an impact on the observations. Future studies could leverage our developed methods in other parks and during a different time of year.
Conclusion
As door-to-door delivery services, work-from-home policies, and social media made physical distance a blurring concept, we still need space to play, meet, and converse with each other in cities. How to create public spaces that strengthen the connection among urban inhabitants is a long-lasting question that requires us to conduct repeatable studies. In particular, people’s behavioural patterns may evolve and adapt. Leveraging the currently available computer vision algorithms and deep learning models to extract social groups from time-lapse videos, this research quantifies the effects of the edge phenomenon and landmarks in forming social groups and interactions in a public space.
The study has made several contributions. First, we extended previously short observation-based studies at small sites by using a deep learning model and computer vision algorithms. Then, we quantify the edge phenomenon, one of the renowned observations from Whyte and Gehl. We capture variations among all spatial edges given their characteristics, being moveable or fixed, nature edges (harbourfront), or designed edges (park edges and furniture edges). Moveable edges have more consistent effects in attracting people in groups compared to fixed edges. Moreover, among all fixed objects on the site, we identify the hierarchy by comparing their capability of attracting more people in groups or forming interacting groups. Even though the same objects were all on-site throughout the day, we show that the harbourfront tends to attract people in groups in the morning, and the effects of the carousel outweigh other objects during the day. Lastly, the video analytic approach used in this project can be adapted to videos from different public spaces in cities, which will facilitate practices like POE and cross-site comparisons.
Supplemental Material
Supplemental Material - Social interaction in public space: Spatial edges, moveable furniture, and visual landmarks
Supplemental Material for Social interaction in public space: Spatial edges, moveable furniture, and visual landmarks by Becky PY Loo and Zhuangyuan Fan in Environment and Planning B: Urban Analytics and City Science
Footnotes
Acknowledgements
The authors would like to thank the Harbour Office for sharing the video with the research team. The computing facilities are supported by GRF17616221. The authors would also like to acknowledge the support of the Guangdong-Hong Kong-Macau Joint Laboratory Program of the 2020 Guangdong New Innovative Strategic Research Fund, Guangdong Science and Technology Department (Project No.: 2020B1212030009).
Declaration of conflicting interests
The author(s) declared no potential conflicts of interest with respect to the research, authorship, and/or publication of this article.
Funding
The author(s) disclosed receipt of the following financial support for the research, authorship, and/or publication of this article: This work was supported by the University Grants Committee (GRF17616221) and the 2020 Guangdong New Innovative Strategic Research Fund (Project No.: 2020B1212030009).
Supplemental Material
Supplemental material for this article is available online.
Notes
Author Biographies
References
Supplementary Material
Please find the following supplemental material available below.
For Open Access articles published under a Creative Commons License, all supplemental material carries the same license as the article it is associated with.
For non-Open Access articles published, all supplemental material carries a non-exclusive license, and permission requests for re-use of supplemental material or any part of supplemental material shall be sent directly to the copyright owner as specified in the copyright notice associated with the article.