
Abstract
A range of accessibility indicators has been developed in the past decade to evaluate equity in transportation within urban areas. Some studies have attempted to incorporate them in transport poverty metrics, focussing on insufficient access to general services and employment. While accessibility measures coupled with statistics have been effective in assessing immediate households’ vulnerability, we argue that an analysis of their adaptive capacity could contribute to a better information of local policies in the long term. This paper aims to develop a methodology for mapping transport poverty risks at the metropolitan scale, while studying the relation between urban segregation and the transport divide. We use the case study of Lyon to operationalise our method and find evidence of vulnerability patterns previously identified in the sociological literature. Beyond the sensitivity of households living in the first-crown neighbourhoods and the growing exposure of medium-income families settling in peripheral municipalities, we emphasise the importance of using mixed methodologies to better capture households’ needs and mobility choices within suburban environments. We conclude by discussing shortcomings and future developments of our research.
Introduction
Sparked by Russia’s invasion of Ukraine in 2022, the global energy crisis raised fears of new winters of discontent across Western Europe. National governments responded with a set of initiatives to protect consumers. In France, with the energy prices rising sharply, the administration tried to contain inflation with tariff shields, consumer subsidies and tax credits on fuel. This strong political reaction arguably echoed recurring local concerns on daily mobility costs and transport poverty (Lucas et al., 2016). In short, the latter is generally used to describe the situations of people lacking options to access general services and employment, as a result from an adverse combination of transport availability, adequacy and affordability. This usually results in insecurity or heavy individual efforts. Even with the development of large public transport (PT) systems, which alleviated deprivation and car dependence, research has shown that some segments of the population are still particularly vulnerable to transport conditions – and this even in urban environments (Mejía Dorantes and Murauskaite-Bull, 2022). With priority still being given to the swift reduction of carbon emissions (IPCC, 2023), the European Union is promoting urban planning processes based on the proximity principle along with infrastructure investments for sustainable transport modes. But uncertainty remains in regards to a fair distribution of those funds, especially within city regions.
In order to guide public action, some French economists have previously emphasised the notion of (double) energy vulnerability. Its assessment is generally carried out using household consumption and mobility surveys (e.g. Berry et al., 2016; Nicolas et al., 2012). A vulnerable household is defined by an expenditure threshold – for example, about 10% of its budget for travel-related expenses, which obviously concerns a large majority of poor households in France. The issue at hand is worse than expected in urban peripheries. According to Cochez et al. (2015), a larger percentage of periurban households are prone to transport poverty (18,8%) as compared to those facing challenges in heating their homes (16,9%), not to mention people that escape these statistics by drastically reducing or eventually cutting their consumption – a phenomenon sometimes referred to as hidden energy poverty (Betto et al., 2020). These figures may have deteriorated since then. If surveys make it possible to approach households’ short-term vulnerability from their current expenses and income (Mattioli et al., 2018), there is still difficulty in estimating the capacity of households to adjust their transport costs in the longer term (Büttner et al., 2013), and cope with transport disadvantage – which refers to the constraints that individuals or communities face when using transportation (Currie and Delbosc, 2011). Individuals may adopt a range of mobility adjustments, such as using alternative modes of transportation, like biking, taking PT, carpooling or, most commonly, restricting their travel and access to certain places. It has been observed, for instance, that the suburban dwellers often aim at reducing the effects of the mobility constraint whether by relocating their home or employment, working remotely, chaining multiple-motive trips, or mobilising local resources and social networks (Berroir et al., 2017; Ortar, 2018).
On the other hand, a dense literature has already examined how the notion of accessibility informs public policies in terms of distributive justice, at a metropolitan scale, and how transport networks affect urban inequalities by shaping the geographies of access to opportunities (Pereira et al., 2017). Strong theoretical links have been established between accessibility measures (e.g. Geurs and Ritsema van Eck, 2001; Klar et al., 2023) and urban planning concerns, such as employment and productivity (e.g. Melo et al., 2017), as well as segregation and equity (e.g. Litman, 2002; Young, 1999). In the latter, accessibility has been used as a ‘combined capability’ (Pereira et al., 2017), reflecting access to a set of actions that can potentially be performed by individuals. The stated objective is to highlight inequalities in accessibility and build indicators aiming at strengthening the freedom of each individual (Vecchio and Martens, 2021). Since inequalities are not in themselves problematic, this literature has criticised the pure disparity approach and, in turn, proposed to focus on situations of said insufficient accessibility (Martens, 2016). Two similar households with equivalent initial resources may indeed have made different location choices involving different initial investments and subsequent levels of accessibility. This raises the question of what minimum accessibility should be guaranteed. The proposed metrics, nonetheless, struggle to identify accessibility poverty, asking whether these levels actually enable people to engage in everyday activities. They are based on group averages which, by their inherent nature, mask the variations within groups. Limitations include the lack of consideration for motility (Kaufman et al., 2004), that is, the ability to move – which depends on the economic, social and cultural capital of individuals. The construction of specific accessibility-based methodologies for revealing accessibility poverty, as experienced in the wild, remains difficult.
It is worth mentioning that analyses in terms of vulnerability and equity both neglect social and power relationships. Individuals do not just consume or access resources but rather get involve in a series of activities, some of which are primarily relational and require engagement with social institutions. For example, with the rise of the gig economy, some workers are increasingly hindered by the structure of the labour market (Wentrup et al., 2018). Within cities, this also questions power dynamics and socially conflicting behaviours and forces related to urbanism (Harvey, 2010), as well as their impact on individual situations. One aspect regularly highlighted in the literature is that of access to housing (e.g. Cao and Hickman, 2018; Le Goix et al., 2021a). Since Halbwachs seminal study on Post-Haussmann Paris and the urban land rent (1908), social theorists have repeatedly demonstrated how housing affordability is both affecting and being affected by urban developments. Lately, Haramboure and Carantino (2021) found evidence of gentrification along new French tramway infrastructures with middle- and upper-class households capitalising on the gains in accessibility. This calls for integrating transport disadvantage and social inequalities as structural factors of transport poverty (Lucas, 2012).
We propose to implement an empirical example based on cumulative accessibility measures for exploring transport poverty risks, while drawing on insights from the approaches detailed above. Although similar analyses have already been conducted in other contexts on issues of equity (e.g. Maharjan et al., 2022; Martens and Bastiaanssen, 2019; Rock et al., 2016) and vulnerability (e.g. Dodson and Sipe, 2008; Fishman and Brennan, 2010; Mattioli et al., 2019), we are proposing an original methodology supported by a French case study. For this purpose, we build a transport poverty risk analysis, using metropolitan accessibility indices, economic disparities and demographics, in order to provide information on households’ vulnerability. The first section briefly presents our method and relevant work on which it is based. We then apply it to a case study for Lyon. Eventually, we discuss the limitations and possible developments of our approach.
Methodology
Transport poverty risks describe the threats posed by various hazards (e.g. volatile fuel prices, labour shortages and pandemics) and their impacts on households’ transport conditions in a defined area. As both the impacts and the responses to the hazard are very difficult to estimate at the individual level, we used an urban vulnerability analysis framework inspired by Swart et al. (2012). Thinking in terms of vulnerability – expressing the expected impact of a given risk – highlights the potential nature of transport poverty, without denying that households can avoid it by resorting to resources that we cannot assess quantitatively. The distinction into three components is essential as it makes it easier to identify its contours within different environments: (1) Exposure, which refers to the type and amount of risk dwellers are subject to. In our case, this is the number of households that are heavily car dependent for satisfying their needs. (2) Sensitivity, reflecting the extent to which households are affected by shocks. It is generally estimated using the distribution of income. (3) Adaptive capacity, which describes the ability of people to make post-shock adjustments and mitigate consequences. Adaptive capacity indicators can be structured in many combinations, since it can vary greatly, depending on age, education, disability, family configurations, housing market, etc. We will be focussing on this last component later on, by looking at generic attributes that are known to affect households in adjusting their mobility and the associated costs.
Our methodology consists of four key steps: 1. Choosing a study area and scales for which a vulnerability analysis is relevant; 2. Defining needs and collect available data; 3. Specifying multiscalar accessibility indicators; 4. Assessing vulnerability by spatialising its components.
Various assumptions and decisions were made here as we adapted our research to specific purposes. In particular, we chose not to use an opportunity threshold to characterise sufficient accessibility. The sharp density contrast within large and fragmented urban areas made it difficult to set it without microdata on needs and preferences. Here, we seek mainly to sketch out a preliminary analysis and future developments.
Step 1. A question of scales
First and foremost, choosing a study area raises the questions of scales. We argue that functional areas are particularly well suited to a transport poverty risk analysis, ensuring that commuting households in peripheral areas are not excluded. It is particularly relevant to French cities, where lower-middle-class households have tended for decades to buy suburban housing: recent sociological studies have looked in peripheral private housing development to study the social segregation process that arises from homeownership support policies (Gobillon et al., 2022). This choice will probably have less significance in region with higher wages and benefits, or where the poorest are concentrated near the city centre (e.g. Brussels). Defining the right level of granularity is neither self-evident. Working with microdata is not technically ideal. As detailed later, it may still be preferable to aggregate them at neighbourhood level.
Step 2. Needs and data
We then need to define origins, destinations and networks. For the former, we propose to draw on literature for locating vulnerable profiles by targeting specific attributes previously identified as determinant. It should be borne in mind that some of them, such as disposable incomes, are obvious and easily quantifiable; others have much fewer clear effects or measures. A good idea of the spatial distribution of households according to their characteristics in a given space is therefore necessary. Information on the housing stock and market should also be available. Regarding destinations, opportunities must be referenced. As part of a broader definition of urban accessibility, and for an initial overview, we suggest choosing a varied set of opportunity types. A weighting should be assigned to balance their value.
The issue of data availability emerges at this step. In our case, we had access to household-level data for the year 2019 listing, among other descriptive characteristics, the geographical coordinates of urban amenities and jobs, as well as all households. Lastly, we suggest using OSM and GTFS data for characterising networks, at least for cities where the information is available. While these are theoretically perfect conditions for carrying out an analysis of accessibility, we can already point out two methodological obstacles: 1/ Access to microdata is restricted and their processing is possible following relatively lengthy administrative procedures, which raises concerns in terms of reproducibility. 2/ We used the R5 routing engine developed by Conveyal via an open-source transport analysis tool called r5r (Pereira et al., 2021). It enabled us to conduct an accessibility analysis of network datasets with high spatial and temporal resolution. R5 is designed for calculating travel times for one-to-many and many-to-many trips, which is useful for access indicators. It performs significantly better than older tools (Higgins et al., 2022) and makes possible to process large datasets. However, the quality check of original data may consume time and resources. In our case, we corrected manually some inaccurate geocoding.
Step 3. Specification of accessibility measures
We propose here to specify accessibility and mobility indicators adapted from Van der Veen et al. (2020). One of the most common indicators is the cumulative accessibility measure, which counts the number of opportunities that can be reached from a given place within isochrones. The main advantage of such functions is the ease of interpretation and communication but it does not inform well on actual travel behaviour, which is influenced by individual preferences, choices, and constraints (Geurs and van Wee, 2004). Utility-based approaches are in turn rather complex to implement, considering among other things the provision of individual data. Gravity-based indicators, which consider nearby opportunities more heavily, are seen as a better reflection of actual accessibility (Higgins, 2019). However, this is not true for competitive opportunities like jobs, specialized and rare services, or relatively short time differences; few would argue that an opportunity 5 min away is just as valuable as one 20 min away. We have chosen not to detail all the metrics available below, as our objective is purely exploratory. Instead, we propose to use two straightforward multiscalar indicators – one based on a Hansen-type cumulative accessibility, the other on a travel time matrix – that approach mobility potential in functional areas.
The first is a local accessibility index P, which reflects the tendency of individuals to limit their travel within a proximity perimeter (Berroir et al., 2017). We propose to exclude car use here, as our aim is to account for accessible opportunities when trying to minimise travel costs. Instead, we focus on active mobility and PT as a common alternative, particularly in deprived neighbourhoods (Juste et al., 2018). To measure it, we used the classic binary counting function F(j) with a cut-off threshold parameter c of 30 minutes, knowing that the metropolitan scale would in any case bring out considerable inequalities. With


We are aware of the limitations of this time threshold, including the fact that jobs located 31 min away are not counted even though in reality they could likely benefit residents of that zone. This index could be improved by testing several travel time thresholds (e.g. 10, 20, and 30 min).
The second is a public transport availability index C. It intends to assess PT efficiency when travelling to at least one metropolitan centrality. To elude this connectivity would be equivalent to considering peripheries as isolated, while our study area merges territories according precisely to the rate of commuting to the urban pole. We have consequently focused on calculating the minimum time needed to reach the main nodes of the network where the different services and works are often concentrated. These hubs are both often a necessary passage to transfer from suburbs and are marked by an abundance of opportunities. With

Step 4. From accessibility to vulnerability
The local accessibility index can be used on a preliminary basis to estimate exposures to transport poverty risks. The more local opportunities there are, the less likely it is that households will be dependent on a car to meet their daily needs. By adding an income variable, we can draw up a bivariate map of both exposures and sensitivities.
Our last step consists in initiating a more in-depth study involving households’ adaptive capacity. The idea is to draw a Ward’s classification of the urban fabric which will give us insights into the transport divide; we thus implement a hierarchical clustering based on both local accessibility and PT availability indices, plus the Euclidean distance to city centre. This Euclidean distance is used to consider the relative advantage resulting from a central position within the functional area. Eventually, we propose to cross-reference the resulting clusters with real estate prices and family configurations, as factors affecting urban segregation. This process may reveal economic and social trends which restrain mobility choices, a fortiori increasing vulnerability.
The case of Lyon
Context
Two of the most important French social movements of the past decade, i.e. the 2013 Bonnets rouges and the 2018 Gilets jaunes, were rooted in demands for fiscal justice associated with carbon taxes on fuels. Although one should not overlook the role played by the rejection of politicians in power in these movements, the social distribution of transport costs in France raises clear equity concerns.
Despite tax cuts, pump costs for one litre of petrol rose from around €1.4 to over €2 between 2021 and the 2022 energy inflation, before stabilising at around €1.8. Beyond rural areas, around 18.3% of households in French urban peripheries were already considered vulnerable in the mid-2010s (Cochez et al., 2015) and this figure has undoubtedly worsened recently. One of the social profiles particularly over-represented among the Gilets jaunes protesters was young households owning their homes in peri-urban areas, particularly in second-tier city-regions (Boyer et al., 2020). Housing affordability seems to be a crucial issue in France. The cost of French real estate, adjusted for inflation, has risen by 70% since 2000, hence reaching an all-time high in terms of unaffordability (Friggit, 2017). Some middle- and upper-class homeowners living in affluent neighbourhoods have gained from the increase in housing prices, while low-income households have become more susceptible to price changes, leading to an increased financial strain (Le Corre, 2019).
We selected Lyon’s functional area as our case study for many reasons (step 1). First, the city has historically experienced significant urban unrest. ‘Urban troubles’ in the Minguettes, a district in the southern suburbs, were the first to receive extensive national media coverage in the 1980s. Since then, the French urban policy (Politique de la ville) has tried to tackle poverty in these districts by enhancing their economic dynamism, launching expensive urban renewal and deploying tramway networks. But the social outcomes of these programs are very mixed (Cour des comptes, 2020). Lyon’s deprived neighbourhoods also hosted protests as part of the 2005 and 2023 nationwide urban riots, and in more peripheral areas during the Gilets Jaunes crisis (Walker and Blavier, 2022). Secondly, Lyon’s transport system is characterised by an already well-developed PT network covering suburbs, as well as a regional train system connecting neighbouring municipalities to the city centre (Figure 1 – public transport network). The car accounts for around 40% of trips in Greater Lyon, which suggests that the strengthening of PT services and current progressive fare policies could still induce a significant modal shift. Lyon’s radioconcentric, fragmented and relatively spread out configuration (Figure 1 – population density) makes its peripheries an interesting case study for our operationalisation. In addition, the main author’s previous fieldwork has facilitated the interpretation of the results. General overview of Lyon’s functional area: demographic structure, morphological and functional extent and public transport services.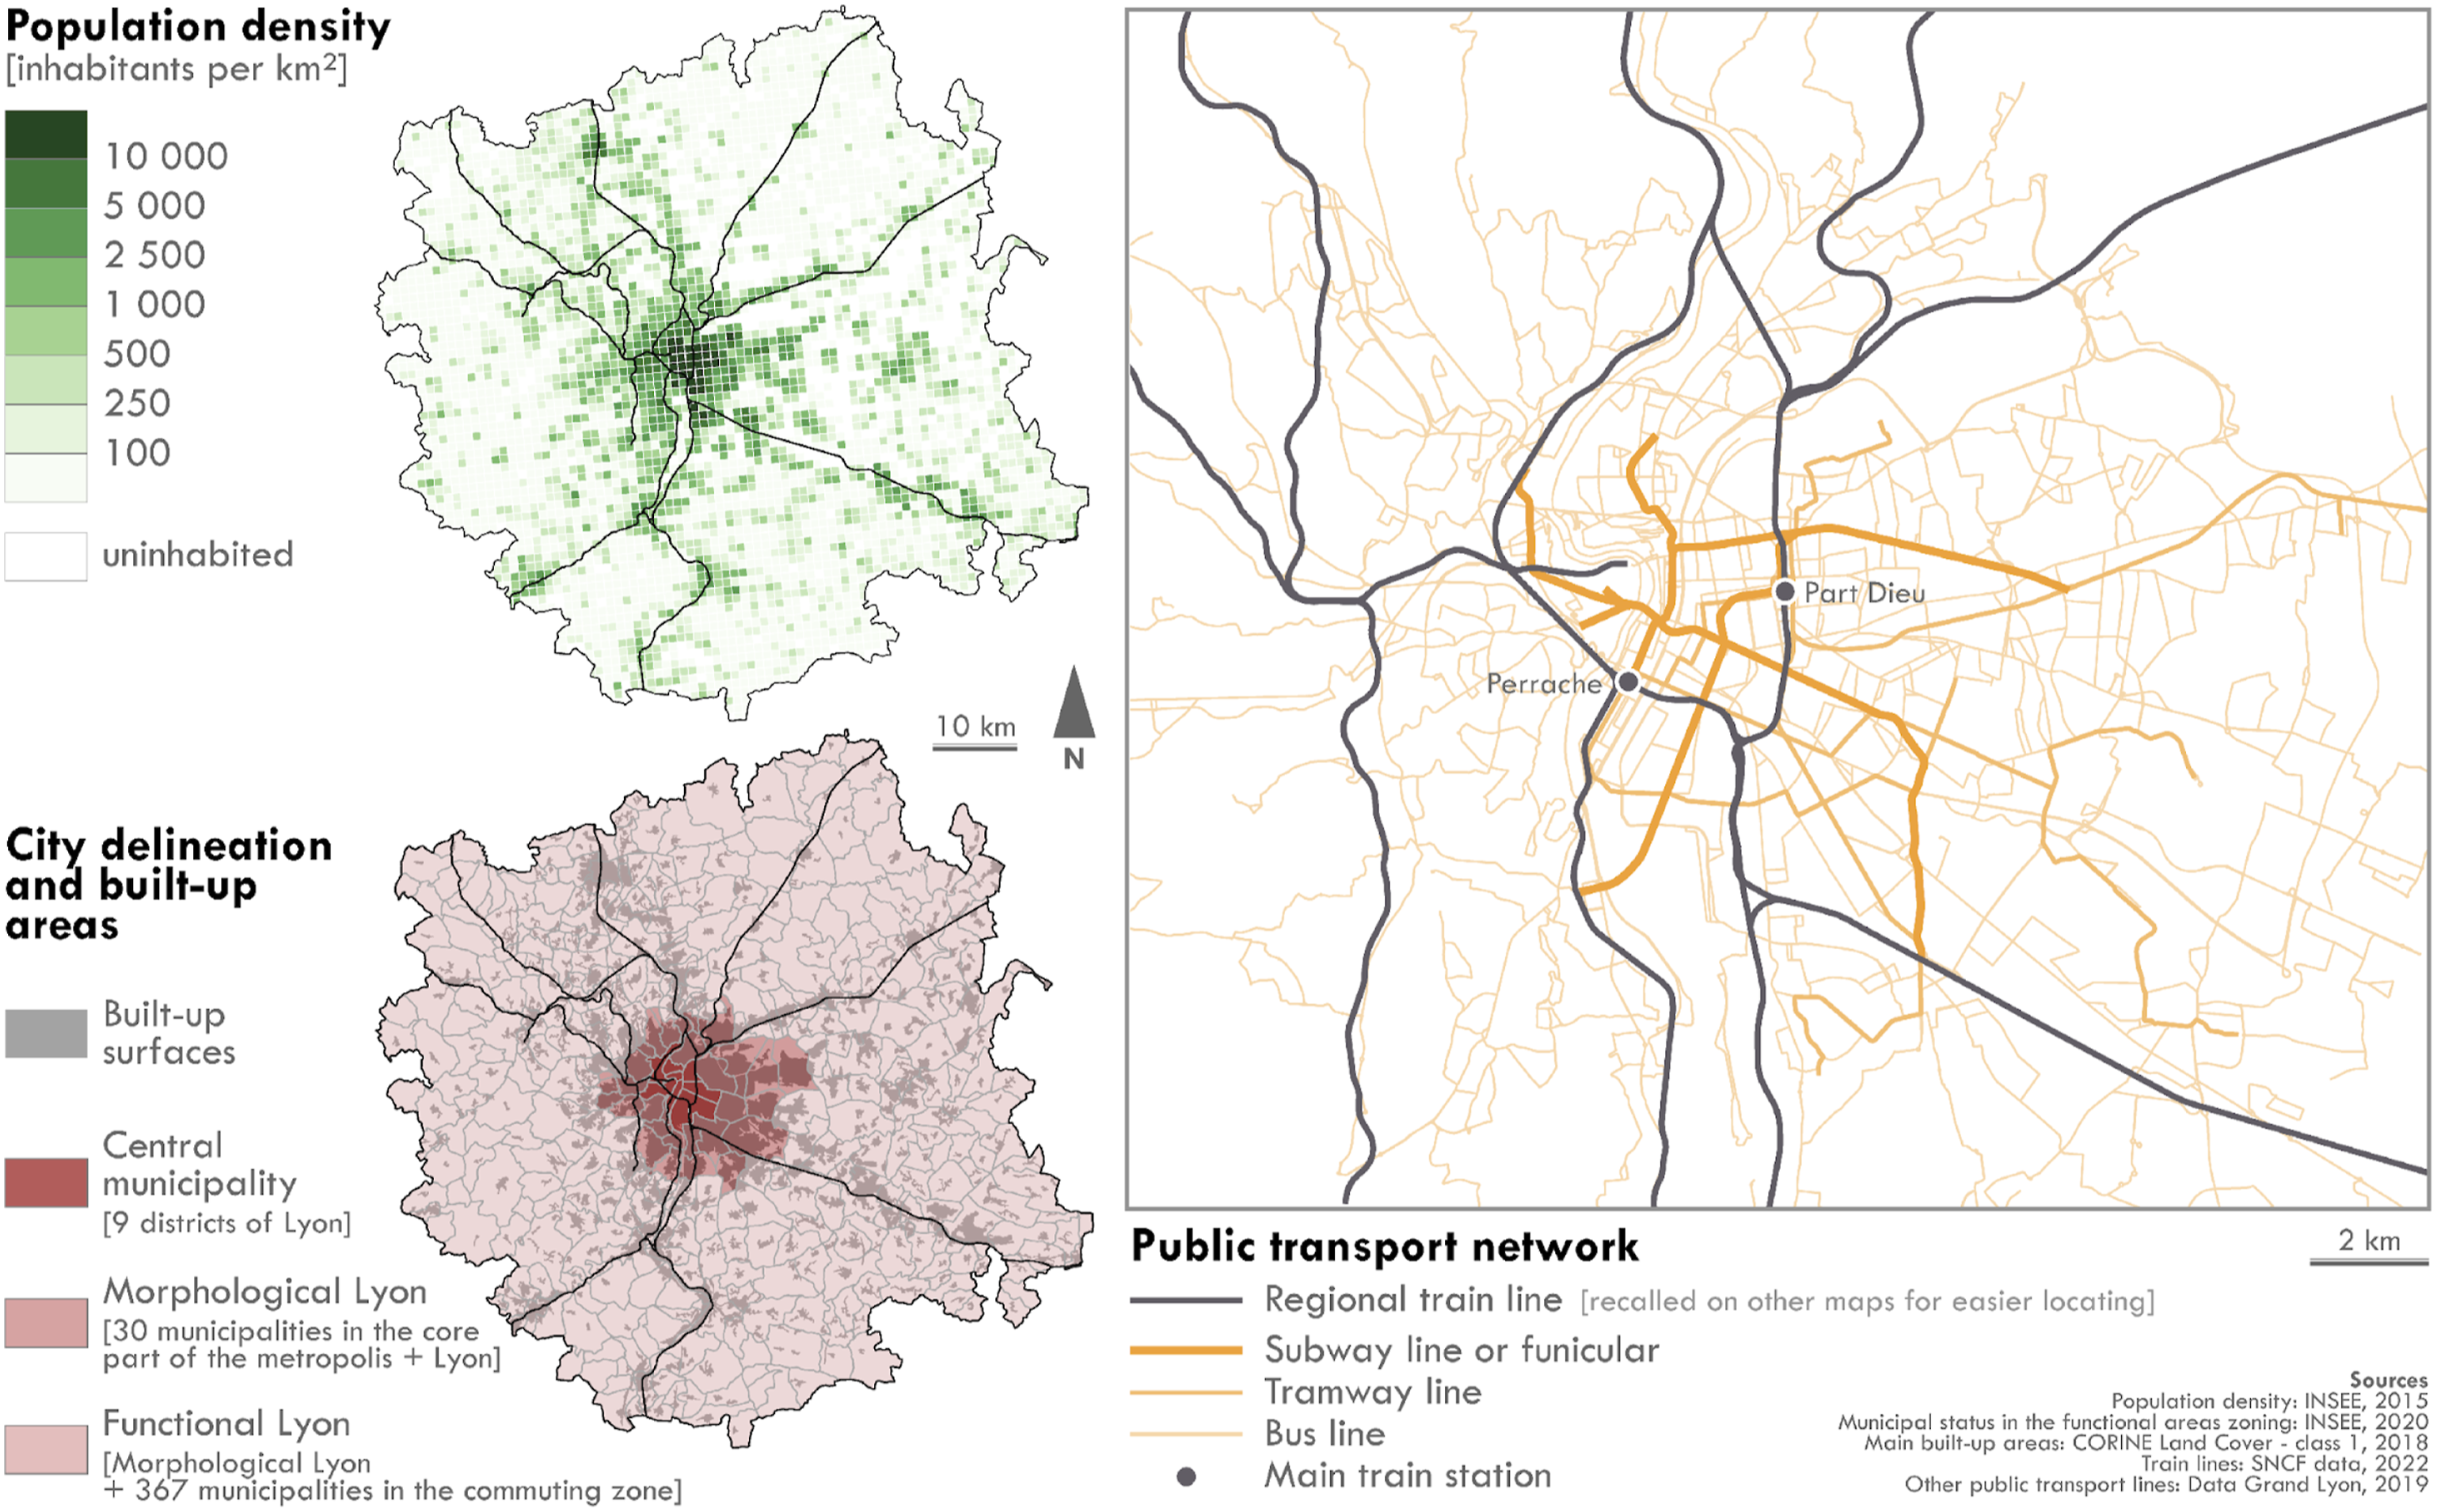
Lyon is the second French functional urban area by population (2.3 million inhabitants; compared to the 1.4 million inhabitants of the Greater Lyon administrative area). The statistical delineation used 1 covers 398 municipalities, 31 of which form the morphological core of the metropolis, the municipality of Lyon being cut in 9 districts (Figure 1 – city delineation and built-up areas). According to the French National Institute of Statistics and Economic Studies (Insee), Lyon does not differ from other cities at the top of the French urban hierarchy on many demographic and social indicators derived from the population census. The contemporary demographic dynamics, the shares of working-class residents (16.7%) and owner-occupied primary residences (90.0%), as well as the unemployment rate (8.4%) are all close to those of the ten largest French cities. Nevertheless, a few other traits make the city stand out among this set of 10 functional areas. As in Paris and Marseille, and contrary to many other cities, the proportion of apartments is considerably higher than the proportion of houses (69.8% in Paris, 64.8% in Lyon and 63.7% in Marseille); while the modal share of public transport in home-work trips is half that of Paris (21.0% in Lyon versus 42.0% in Paris), this share exceeds that of all the other cities in the ten largest by several points (between 10.7% and 15.8%).
We assessed vulnerability within the metropolitan population. All data collected or constructed are based on IRIS (Insee, 2020), a sub-municipal statistical unit (around 2,000 inhabitants) that offers relevant socio-demographic data for a decent level of granularity. Greater precision has been pursued by using the Filosofi (Fichier localisé social et fiscal, 2019) household-level data; yet, the time required for the processing is out of all proportion to that to be invested in processing aggregated data. The accessibility indicators are based on the centroids of each IRIS main residential area (n = 909).
Data
A comprehensive aggregation and classification of more than 3 million opportunities was conducted (step 2). We also considered external centralities to avoid edge effects. All areas potentially up to 30 min from an IRIS in the study area were included. The goal was to mirror the essential types of activities that people engage in on a regular basis. Since there is not an even distribution of opportunities across different types, a straightforward hierarchical method was used, where each weighted subcategory was given the same level of importance (25% of the total accessibility). To this end, we collected data and adapted classes from existing databases, namely BPE (Banque Permanente des Équipements, 2019) and Flores (Fichier localisé des rémunérations et de l’emploi salarié, 2019): • Retail and Services – Administrative services: town halls, police stations, etc. – General services: banks, post offices, etc. – Commercial: restaurants, supermarkets and specialised stores • Educational services and Leisure – Schools: elementary schools, secondary schools and higher education – Cultural facilities: cinemas, libraries, etc. • Health and Sports – Care services: pharmacies, medical offices, hospitals, etc. – Sports: parcs, sport facilities • Employment: jobs, excluding temporary agency work
In order to create a combined transportation network that includes all transit options, we collected pedestrian ways and roads data from OpenStreetMap (OSM) as well as the local public transport shapes and services through General Transit Feed Specification (GTFS) datasets made by the PT operators (TCL, SNCF and regional buses). We then used the r5r R package to compute the shortest travel time by public transit between origins and destinations, departing each minute in a 10-min window during peak hour on a working day. We used a standard arrival time of 9 am on Tuesday (Conesa, 2018), January 31, 2023.
Accessibility indices were then assessed (step 3). For local accessibility, the isochrone corresponds to an intermodal (walking and PT) 30-min travel time, which is sufficient to cover most of the scope of the peri-urban communities and the nearby centralities. For public transport availability, we have taken the minimum time to reach by bicycle and public transport – allowing park and ride – one of the two main transport hubs, namely Part Dieu station which is located in the central business district and Perrache station closer to the historic centre (Figure 1 – public transport network).
The real estate prices we used in addition are taken from the DVF database (Demande de Valeurs Foncières). It lists only the sales of apartments and houses. The average prices per m2 in each IRIS were extracted annually for the period 2017–2021. When only 3 or 4 years were available out of the 5, the missing values were estimated by averaging the values of the adjacent years. When only one or 2 years had values over the period, the data were considered insufficiently representative. Finally, a quality check was undertaken by verifying the variability of real estate prices from year to year: if the ratio of the standard deviation of prices to the mean of prices was greater than 0.3 (an arbitrary threshold), the variance was deemed too large for the prices to be considered reliable.
Results
We eventually assessed vulnerability by overlaying its components (step 4). Our first aim was to produce a bivariate map combining the local accessibility index with the median disposable income. This allowed us to simultaneously map exposures and sensitivities of households to transport poverty risks (Figure 2). Exposure and sensitivity to transport poverty risks in Greater Lyon.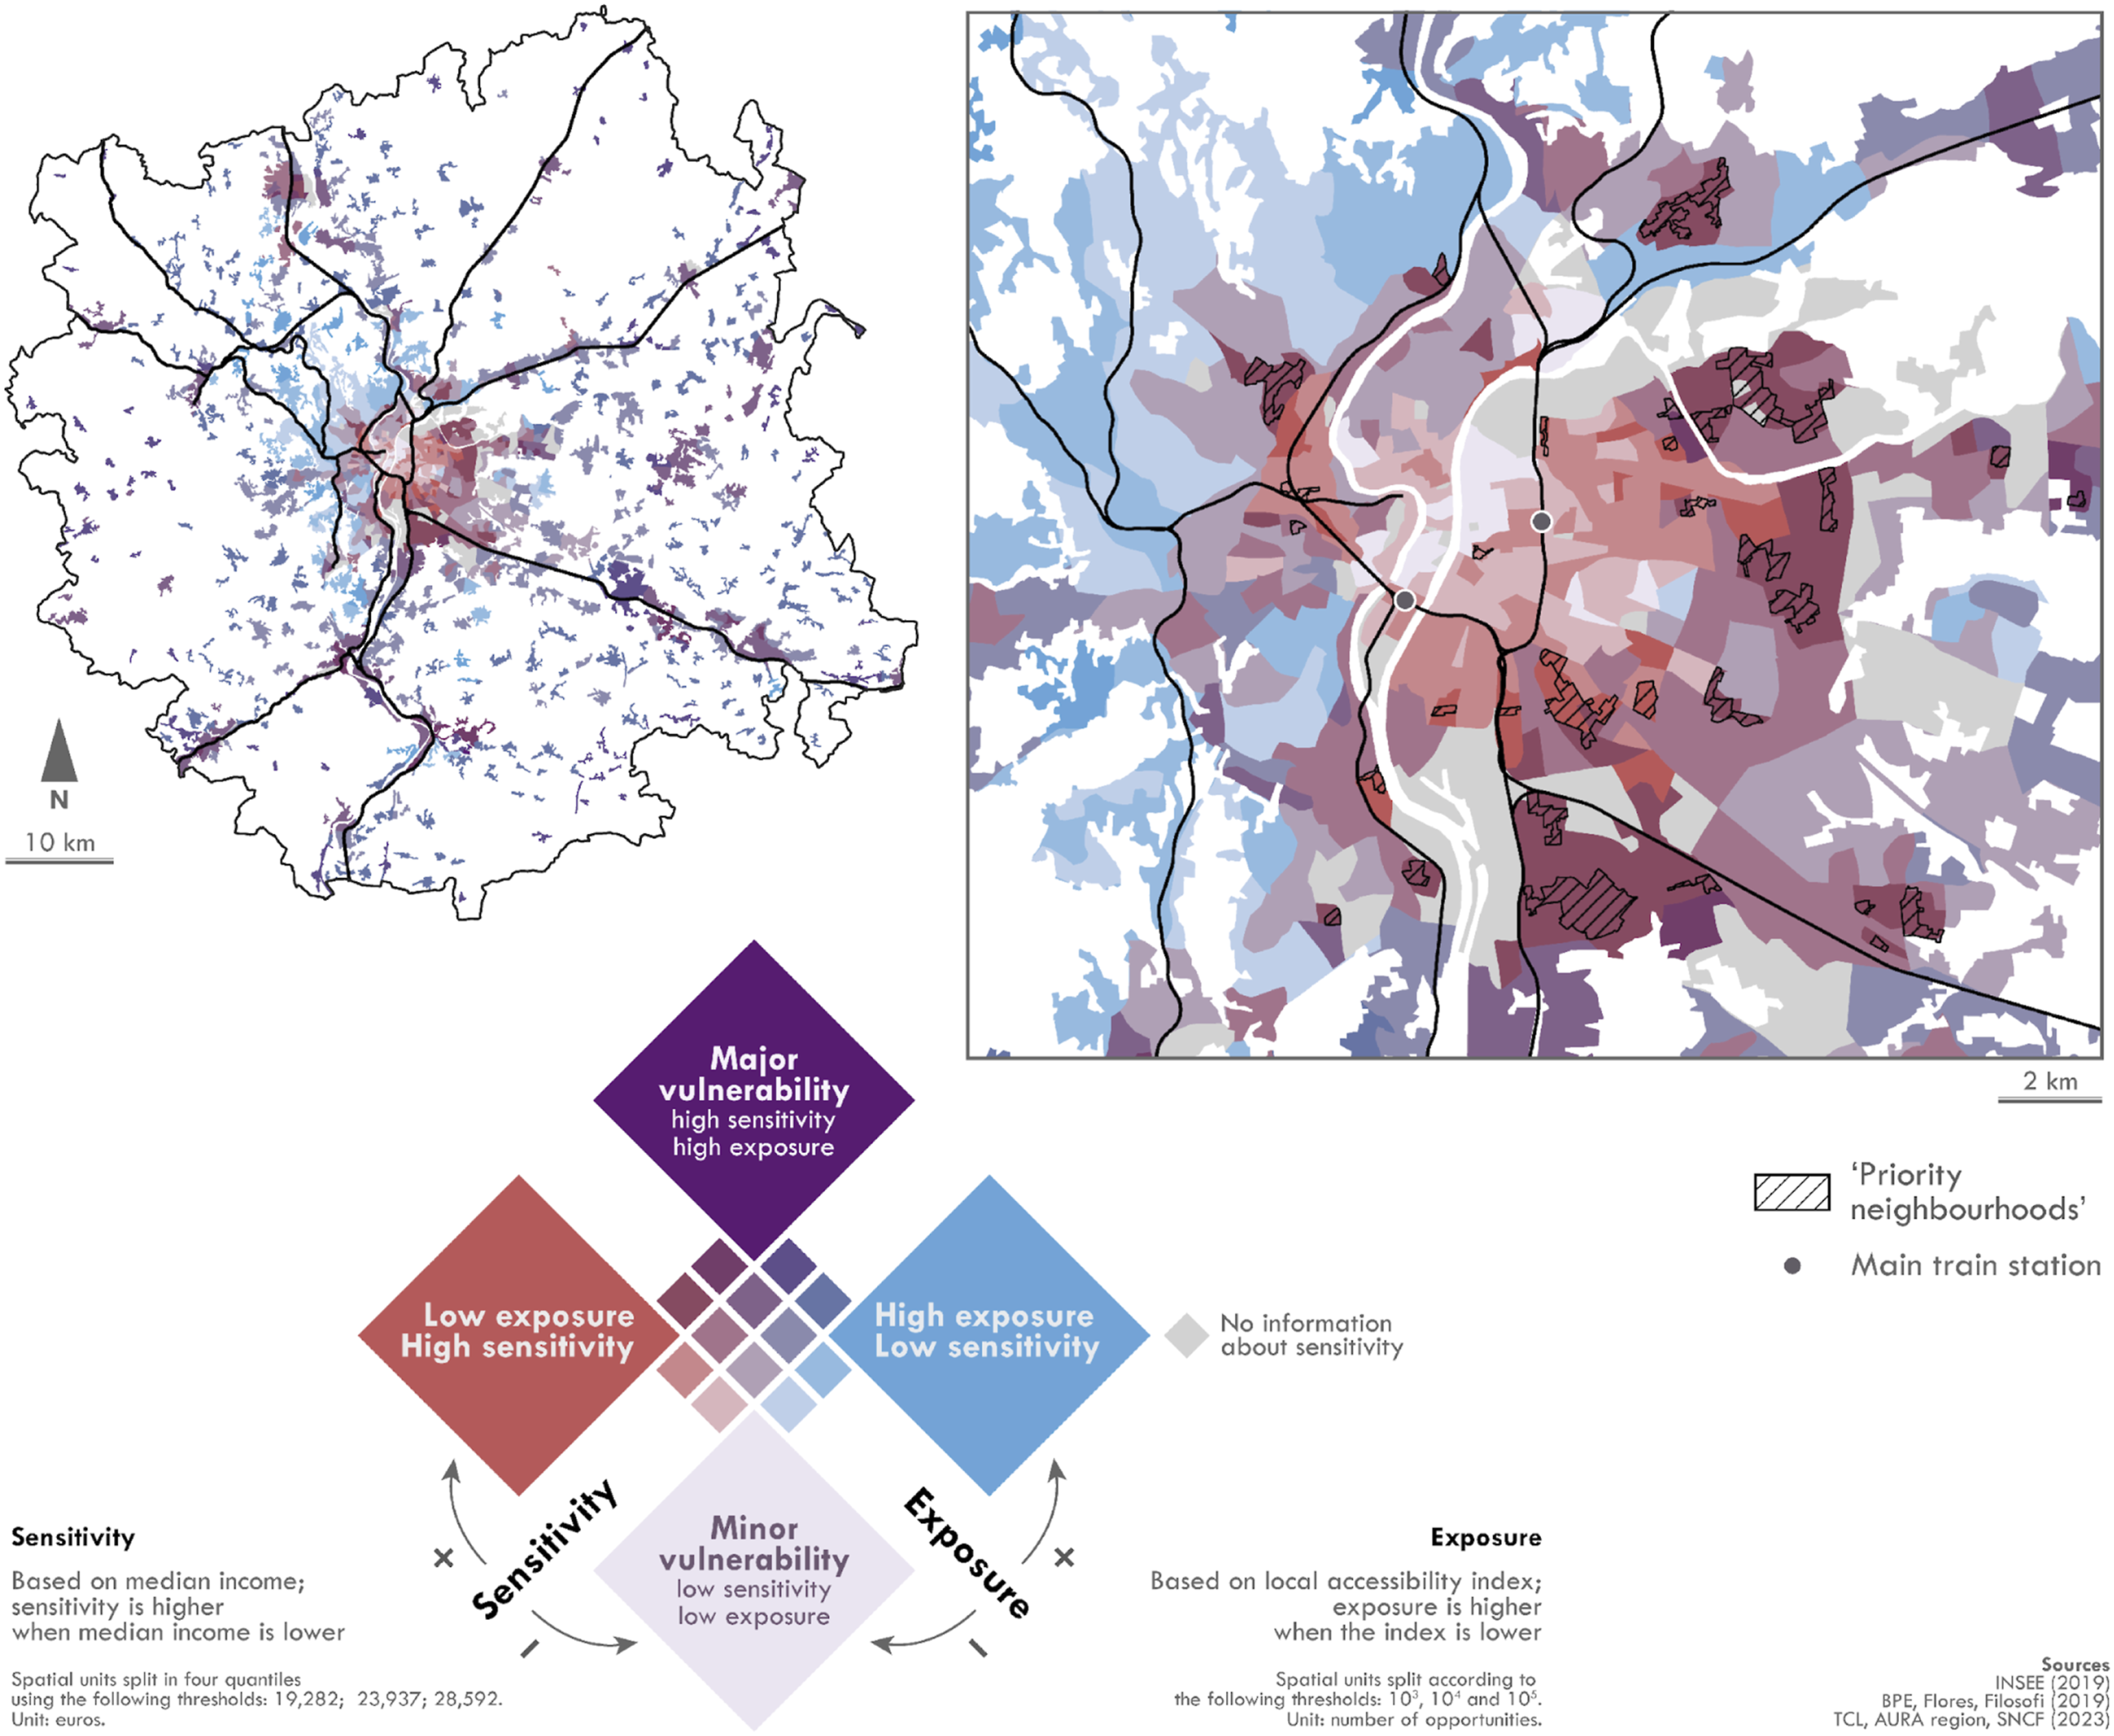
We observe that the number of opportunities is distributed in a much more predictable way than income. The possibility of limiting one’s daily trips to a local area increases the closer one gets to the centre, which is linked to a larger spatial concentration of jobs and services; the further away from the centre, the lower the accessibility to these destinations and the larger the exposure score. Even relatively dense peripheral fabrics sometimes have low levels of opportunity. In comparison, the area seems much more socially fragmented in terms of sensitivity, with a concentration of wealth in the western first ring and poverty in the eastern one. We clearly identify the contours of deprived social housing estates, listed as ‘priority neighbourhoods’ (‘Quartiers prioritaires de la Politique de la Ville’ or QPV) by the French administration. A dense French literature has examined these ‘territories of relegation’, with urban relegation being understood as the socio-political process that tends to induce the concentration of people with migration background in disadvantaged places or conditions (Wacquant, 2016). Despite strong state intervention, these deprived neighbourhoods still feature higher rates of poverty, unemployment and crime than anywhere else in mainland France. The mapped colours show that even after PT infrastructural improvements, priority neighbourhoods – highly sensitive by definition – are almost always located in the most exposed inner suburbs (Figure 2). It seems that PT investments have not compensated for the local shortage of opportunities. This relative spatial isolation is reinforced by discriminations on the labour market, due to the social stigma associated with the origins of local workers (Bunel et al., 2016). While not denying the importance of a good and frequent transport service, it seems at least insufficient.
In order to include the last component of vulnerability in the assessment, a classification was preliminarily carried out. It refines exposures by creating a typology of urban environments according to accessibility indicators. The purpose of this Ward’s classification was to build an overview of the urban structure in terms of accessibility differentials. Three variables were used: the local accessibility and public transport availability indices, plus the Euclidean distance to city centre (Place Bellecour, near the two main train stations cited above). Four clusters are then identified, which are globally contiguous, arranged in a centre-periphery manner (Figure 3). We will refer to this structure as an (in)accessibility gradient which we then intentionally map as an ordinal information. This gradient reflects the inequalities in exposure to transport poverty risks. The further down this gradient goes, the more difficult it is for households living in the IRIS concerned to limit their car dependency by opting for local opportunities or by using PT. As expected, the structure of the transportation network is visible in the results. The urban core is served by a dense subway network, while in the first-crown suburbs the tramways and buses predominate. In further peripheries, it should be noted that we could substitute our typology with a density gradient, as is usually done. But our method performs better to differentiate in the second crown the transit-oriented (cf. public transport availability) and relatively well-equipped (cf. local accessibility index) peri-urban fabric from the more isolated rural-urban fringes. Multiscalar (in)accessibility gradient in Lyon and its peripheries.
The introduction of adaptive capacity required a selection effort, as many material factors limit households in the reduction of their mobility costs. We retained two of them with regard to the literature. For many French households, the purchase of a standardised small house in peripheral areas with lower access to jobs and public services appears to be the only affordable option, even with state support (Gobillon et al., 2022). National homeownership policies and mayors of suburban municipalities contributed to the settlement of families with diverse social backgrounds and varying mobility prospects, including local workers, young families from urban centres and former first-crown-social-housing tenants. During her sociological enquiry in new private housing estates within Lyon’s eastern periphery, Lambert (2015) frequently observed mothers giving up paid work to take full responsibility for childcare – a renunciation linked to the commuting distance and the relatively low level of their previous salary. The common counterpart of this gendered division of domestic labour was the creation of savings through the deprivation of family leisure activities. These findings suggest that both housing affordability (restraining residential choices) and family configurations (increasing needs and constraints) are locally relevant factors for our investigation. Within each of the above-mentioned clusters (exposure), we have crossed the median disposable income (sensitivity) and the proportion of families with at least two children, as well as the average housing price per m2 (Figure 4). Family configurations versus income disparities within (in)accessibility clusters.
We can draw three main lessons from this intersection: 1. We observe very high housing prices – resulting from market competition – and a low percentage of families in the dense urban core. The variability of incomes within it is probably mainly explained by housing occupancy status and residents’ age: renters, including students, predominate in relatively young districts, while wealthier homeowners are over-represented in neighbourhoods with older dwellers. 2. The first crown suburbs also have heterogeneous profiles. The trends there are more diffuse. Urban pockets of wealth and poverty are very marked. It should be noted that, at this scale, accessibility indicators do not particularly highlight the relegation of these deprived neighbourhoods and their residents. 3. The fragmented peri-urban fabric and the sparse metropolitan fringes are more homogenous; the higher the inaccessibility gradient, the lower the diversity within the clusters. Apart from the preference of wealthier households to settle in better-served localities, this clustering effect can be explained by the attractiveness of municipalities offering affordable housing to middle-income families.
We argue that those families could suffer from a heavy relocating disadvantage (Randolph and Tice, 2017). Our analysis highlights mainly the exposure of these peri-urban households, but it probably has a poor appreciation of sensitivity; we do not include financial liabilities in our estimate, whereas lower and middle-class households often contract loans and bear heavy financial burdens (Walks, 2018). The quantitative assessment of adaptive capacity is finally tricky, since many individual factors, coupled with urban segregation, weight on households’ long-term residential choices. That said, there is no doubt that family obligations and the associated costs are determinant. Furthermore, first-time homebuyers are not always in a position to move house in the short term without incurring losses on resale – unlike renters. But investigations are warranted to draw clear lessons on individual situations. The diversity of occupations and resources available to each household, whether in terms of assets or opportunities, suggests the need for additional enquiries, notably into the norms influencing mobility and housing choices.
Discussion and conclusion
By implementing this vulnerability assessment in a case study for Lyon’s functional area, we aimed to balance the consideration of urban accessibility and individual attributes when studying transport poverty risks. Our results showed significant disparities on the basis of both local accessibility and public transport availability indices, particularly between inner and outer suburban dwellers. Beyond the highly sensitive households living in deprived neighbourhoods, we identify middle-income municipalities particularly exposed in the peripheries. Our approach was primarily exploratory but it remains useful as equity concerns can still be identified if mapping is based on relevant scales and attributes. In case of development, our methodology could help policymakers segment the urban fabric according to vulnerability components and thus guide public action. It is worth noting that the actionability of the three components differs considerably. Policymakers are in a position to strengthen households’ adaptive capacity and reduce their sensitivity through targeted measures, as opposed to the wider and long-term inflections of social trends determining exposures. For instance, advancing the adaptive capacity could concretely involve strengthening educational and leisure services to offer parents greater flexibility, thereby alleviating the cost of family responsibilities. Similarly, incentives for higher employment benefits or adapted working arrangements could ease the strain of commuting. As for exposure and its sociospatial distribution, the growing suburban poverty in France prompts questions about the fairness of homeownership support policies, as well as the local effectiveness of urban planning. Despite the government’s ambition to develop more affordable housing alongside transport infrastructures, the social trends observed call for the development of proximity and transport services, even in less dense areas. In light of this evidence, we can also confirm that a comprehensive approach of transport poverty seems necessary for coordinating public policies. This thus involves improving public infrastructure and PT dependability, while dealing with broader economic issues such as urban segregation, functional diversity, job insecurity or housing quality and affordability. The latter particularly remains a crucial concern in Europe (Le Goix et al., 2021b), where the average purchasing power has fallen with the rise of interest rates.
Finally, we would like to discuss some shortcomings of our methodology. We must first underline functional areas as an important spatial context of access to opportunities, but it raises issues of complexity. The metropolitan context provides a plethora of opportunities which are difficult to sort out. Properly introducing competition (Shen, 1998) or spatial availability (Soukhov et al., 2023) to some extent would better account for opportunities. In order for these measures to be effective, only those opportunities should be considered for which the chosen audience is competing, but this is not obvious even with microdata. Utility-based accessibility assessments imply specific routing and heavy matching processes, the gain in accuracy of which is perhaps not as significant compared to the performance of aggregated data. If the ideal way to assess vulnerability is by relying on individual preferences, our study showed that the availability and processing of microdata on a metropolitan scale pose significant issues. In this paper, scaling and pragmatism were main factors in drawing up the measures. One prospect already well-developed would be to provide more focused calculations based on sociological enquiries, in order to deepen our understanding of the specific needs and efforts linked to family, age or disability. This could lead to the design of analytic hierarchy processes to better assess opportunities according to preferences, while accounting for motility. Another way of collecting and refining data on opportunity and transport adequacy might be to use participatory research. Detailed interactive softwares would be useful to gather insights on perceived accessibility (Lättman et al., 2018) and formulate local strategies for optimising mobility in urban spaces.
Footnotes
Author contributions
Pons: Conceptualisation, Methodology, Data curation, Formal analysis, Visualisation, Writing – Original Draft, Writing – Review & Editing.
Finance: Data curation, Visualisation, Writing – Review & Editing.
Conesa: Supervision, Funding acquisition, Writing – Review & Editing.
Declaration of conflicting interests
The author(s) declared no potential conflicts of interest with respect to the research, authorship, and/or publication of this article.
Funding
The author(s) disclosed receipt of the following financial support for the research, authorship, and/or publication of this article: Pons received a doctoral grant from a JPI Urban Europe project (99950054 – ENUAC call) cofounded by the French National Research Agency (ANR-20-ENUA-0003).