
Abstract
Background
Whether there is a cognitive load-dependent brain activation pattern in the pre-Alzheimer's disease phase is unknown. Multimodal system provides a powerful technical tool.
Objective
We evaluated brain activity patterns under different cognitive loads in patients with mild cognitive impairment.
Methods
Functional near-infrared spectroscopy signals and electroencephalography signals were acquired from the mild cognitive impairment group (MCI, n = 20) and the healthy control group (HC, n = 24) under four cognitive loads. We analyzed the respective brain activity features and performed correlation analyses.
Results
(1) During the encoding phase, both the left occipital (pcond = 0.05, pgroup < 0.01) and left temporal (pcond = 0.02, pgroup = 0.03) skewness condition effects and between-group effects were significant. (2) As the cognitive load increased, the clustering coefficients and local efficiencies were significantly lower for the HC group. (3) The left occipital and left temporal activation skewness in the MCI group were significantly correlated with left occipital electrical features, whereas the left occipital activation intensity and skewness were significantly correlated with left occipital electrical features in HC group.
Conclusions
The pattern of brain activity in MCI depends on cognitive load. Left occipital and left temporal may be important brain regions for evaluating MCI and need to be focused on in the future.
Introduction
Alzheimer's disease (AD) is a common neurodegenerative and progressive disease,1–3 whose principal symptoms include cognitive impairment and difficulty in daily life. 4 Cognitive impairment involves functions such as memory, speech, attention, and executive. It is estimated that the number of people with AD will reach 13.8 million by 2060.5,6 AD is rapidly becoming one of the most expensive and burdensome diseases in the world. Although some medications can slow the progression, no cure has been found.7,8 The underlying mechanism of clinical symptoms of AD is unknown. Mild cognitive impairment (MCI) is an early stage of AD, and understanding its early symptoms can help people get a diagnosis and appropriate treatment. Through early intervention, it is possible to minimize the effects of AD and prolong the quality of life of patients.
The pattern of brain activity during cognitive tasks in patients with MCI has yet to be uniformly determined.9–12 Some studies have confirmed increased frontal activation during working memory tasks in MCI patients,9,10 whereas others have shown the opposite result.11,12 This may be because MCI patients exhibit different brain activation patterns resulting from different task paradigms and loads. For example, it was found that healthy individuals had significant frontal activation under high cognitive load conditions.13–16 Compared with healthy individuals, MCI has reduced activation at high cognitive load, but similar frontal activation 12 or increased11,17,18 activation at low cognitive load. However, limited evidence supports the role of cognitive load in modulating activation patterns in individuals with mild cognitive impairment. Thus, the neural basis of cognition in patients with MCI remains to be determined.
Functional near-infrared spectroscopy (fNIRS) has relatively accurate spatial information and is widely used to explore abnormal brain activity in cognitive disorders. 19 Relative to healthy individuals, MCI and AD have abnormal activation patterns and network connection patterns in both resting 20 and task 21 states. Electroencephalography (EEG), with millisecond temporal resolution, provides rich electrophysiological information and offers valuable biomarkers for diagnosing AD.22–25 In the early stages of AD, researchers have found an increase in slow waves (delta and theta waves)26,27 and a decrease in fast waves (alpha and beta waves).28–31 In addition, other forms of power spectrum, energy, ERP features, and network features have been used in previous studies to quantify the cognitive level of MCI.32–35
Although many results have been achieved in single-modal AD assessment and diagnosis research, the complex nature of AD disease predetermines that assessment from a single perspective needs to be revised. Multimodal approaches have been a hot research topic.36–38 The fNIRS-EEG dual-modality system combines the advantages of high spatial resolution and high temporal resolution, which provides comprehensive brain function information based on hemodynamic and electrophysiological features. The fNIRS-EEG dual-modality system has been used to identify functional changes associated with AD. For example, Cicalese et al. used the fNIRS-EEG system for AD identification and obtained sufficiently good classification performance that was superior to that obtained with a single modality. 39 Indeed, although the fNIRS-EEG system has been used to extract cross-modal indicators in patients with AD,40–42 to the best of our knowledge, this multimodal approach has not been applied to assess the presence of cognitive load-dependent dysfunction in patients with MCI.
Therefore, in order to further explore the neural basis of mild cognitive impairment and the changes in brain activity under different cognitive loads, the fNIRS-EEG dual-modal system was used in this study to explore the perspectives of hemodynamics and electrophysiology. We used the digit verbal span task (DVST) paradigm with four cognitive load levels to investigate whether cognitive load modulates brain activity patterns in MCI. In addition, this study explored the correlations between hemodynamic and electrophysiologic activities under different cognitive loads.
Methods
Subjects
Subjects were recruited and grouped by professional cognitive rehabilitation physicians. The recruitment criteria for subjects were as follows: aged 60 and above, no major psychiatric disorders or cognitive disorders other than AD, and no major verbal or executive dysfunction. Criteria for healthy control subjects (HC): no memory loss, no cognitive-related diseases, Mini-Mental State Examination (MMSE, Shanghai version) score above 24,43–45 and Montreal Cognitive Assessment (MoCA, Beijing version) score above 23.46,47 This study simultaneously employed the MMSE and MoCA scales to ensure the validity of cognitive assessment. Criteria for MCI subjects: complaints of memory loss within the last one to two months, able to carry out daily activities, MMSE score below 24, MoCA score below 23, while not meeting AD criteria. A total of 24 healthy subjects and 20 MCI subjects completed the study. Demographic information is shown in Table 1.
Demographic information.

This study was approved by the Guangxi Jiangbin Hospital Ethics Committee (GXJBYY-IRB-KY-2020016) and performed following the Declaration of Helsinki. Each participant was fully informed of the research purpose and methods and provided written, informed consent before the experiment started.
Experimental paradigm
In this study, the classical DVST was used to examine the subjects’ cognitive function. 39 The experimental paradigm is shown in Figure 1(a). To prevent the effects of fatigue, the task duration was controlled to be within 20 min. It consisted of a 3-min resting state and an 11-min task state for 14 min. The resting state requires the subject to sit quietly and gaze at the center of the screen. In the task phase, the screen presented a string of numbers for 5 s, and the subject performed memory encoding. After that, the number disappeared and the subject was asked to relax for 10 s. Next was 6 s of memory retrieval in which the subject verbally recalled the number string (either in forward or backward) as required. A 10 s break was taken, followed by the subsequent trial. To set up different cognitive loads, the length of the digit strings n was set to 3, 4, 5, and 6. Based on research findings related to cognitive assessment using the DVST task and the memory capacity of older adults, 48 the changes in brain activity at string lengths of 4 and 5 are particularly noteworthy. Therefore, the number of trials was set to 4, 6, 6, and 4, respectively named DVST3, DVST4, DVST5, and DVST6, to ensure the reliability of the data and the validity of the results. The number of trials of the same cognitive load task was the same for forward and backward, and the order was randomized.

(a) Experimental program. (b) Schematic diagram of fNIRS channel and EEG electrode arrangement. Cyan balls are fNIRS channels and orange balls are EEG electrodes. Brain model from BrianNet Viewer.
Data collection
A continuous-wave multi-channel fNIRS system (Huichuang, China) was used for data acquisition. The wavelengths were 740 nm and 850 nm. The sampling rate was 21 Hz. Because AD is a disease that involves lesions in multiple brain regions, data acquisition was performed on the global brain. According to the international 10–20 system, 18 sources and 31 detectors were arranged, traveling 59 channels, covering frontal, parietal, temporal, and occipital lobes. All sources and detectors were spaced 3 cm apart, where the reference points were Fz, C3, C4, and Cz, see Figure 1(b).
A dry electrode EEG device (DSI-7, Wearable Sensing, USA) was used for signal acquisition. The sampling rate was 300 Hz. According to the International 10–20 system, the electrodes are arranged at positions F7, F8, P3, P4, O1, and O2. The reference electrode corresponds to FCz, and the grounded electrode corresponds to CPz. Simultaneous labeling of dual-mode signals using NirsTrigger (Huichuang, China).
Data processing
The fNIRS data were preprocessed using homer2. 49 First, The raw light intensity was converted to optical density. Second, the motion artifact was removed by the spline interpolation method, where the parameters were set as follows: SDThresh = 20, AMPThresh = 5, tMotion = 0.5 s, tMask = 1s, p = 0.99. 50 Physiological noise was removed by 0.01–0.2 Hz bandpass filtering. Finally, changes in the concentration of oxyhemoglobin (HbO) and deoxyhemoglobin (HbR) were obtained according to the modified Lambert-Beer law. Since HbO has a higher signal-to-noise ratio than HbR and is more sensitive to tasks, the HbO signal was processed in this study.
Brain activation
To reduce individual differences in channel location, we calculated and analyzed brain region features. The brain regions are shown in Table 2. In this study, activation intensity, kurtosis, and skewness51,52 were calculated for the memory encoding phase (time window: 6–11 s, 5 s delay) and the retrieval phase (time window: 26–31 s, 5 s delay). 53
Distribution of brain regions.

Brain activation feature during the memory encoding phase.

Functional network
FC_NIRS calculates the global network features (clustering coefficient, characteristic path length, small-world, global efficiency, and local efficiency). 54 First, channels are taken as network nodes, and Pearson correlation coefficients between channels are taken as connections. Then, the Pearson correlation coefficient between each channel pair was calculated to obtain a 59 × 59 correlation coefficient matrix. Fisher's r-z transform of the correlation coefficient matrix is used to improve normality. Finally, the threshold sparsity is used to transform the correlation matrix into a binary matrix, and the corresponding network topology properties are calculated. In this study, we chose a wide threshold range of 0.1–0.5 with a step size of 0.01. 55
EEG feature
EEG signal preprocessing using EEGLAB. Firstly, global re-referencing was performed. Second, bandpass filtering from 1–40 Hz was performed. Due to fewer electrodes, to fully utilize the EEG information, we processed the raw signals using the MAICA algorithm. 56 This was followed by eye movement noise reduction using the method of Salim et al. 57 The frequency bands were divided into delta wave 0.5–4 Hz, theta wave 4–8 Hz, alpha wave 8–13 Hz, and beta wave 13–40 Hz. 58 Finally, the relative power spectral density characteristics of the EEG were calculated for the encoding phase (time window: 5–15 s) and retrieval phase (time window: 21–31 s).
Statistical analysis
The age, MMSE scores, and MoCA scores of the subjects in the two groups were analyzed using the two-sample t-test. The gender in both groups was tested using χ2 test. Statistical analyses of the number of correct trials and brain function features under different cognitive loads in both groups were performed using two-way mixed ANOVA. Correlation analyses were used to further examine the correlations between cerebral hemodynamic and electrophysiological activities.
Results
Demography and behavior
There was no statistically significant difference in age and gender between the two groups. MMSE and MoCA scores were significantly higher in the HC group than in the MCI group (see Table 1).
A two-way mixed ANOVA found significant between-group effect (pgroup < 0.01) and condition effect (pcond < 0.01) for the number of correct trials in the two groups, with nonsignificant interaction effect (pinter = 0.66). Further analysis revealed no statistically significant difference in the number of correct trials of DVST3 between the two groups. As the cognitive load increased, the number of correct trials in both groups increased and then decreased. The number of correct trials in DVST4 was significantly higher than that in the other tasks. From DVST4 to DVST6, the number of correct trials was significantly higher in the HC group than in the MCI group, see Figure 2.

Behavioral performance under different cognitive loads.
Brain activation
Activation intensity is shown in Figure 3. The results of the two-way mixed ANOVA on brain activation features during the memory encoding phase are shown in Supplemental Table 1. In the memory encoding phase, the activation levels of brain regions (RF, LT, RT, LIP, and RIP) under different cognitive loads were lower in the MCI group than in the HC group. Relative to other cognitive loads, the activation intensity was maximized in HC and MCI groups under the DVST4. In addition, from DVST4 to DVST6, parietal and occipital activation increased in the MCI group relative to the HC group. Left prefrontal activation increased in the MCI group relative to the HC group under the DVST5 and DVST6. A two-way mixed ANOVA showed a significant between-group effect for LO activation intensity only (pgroup = 0.04), with a nonsignificant condition effect (pcond = 0.12) and interaction effect (pinter = 0.17). Further comparisons revealed significantly higher activation levels in the MCI group than in the HC group under the DVST4 (p = 0.03) and DVST6 tasks (p = 0.04).
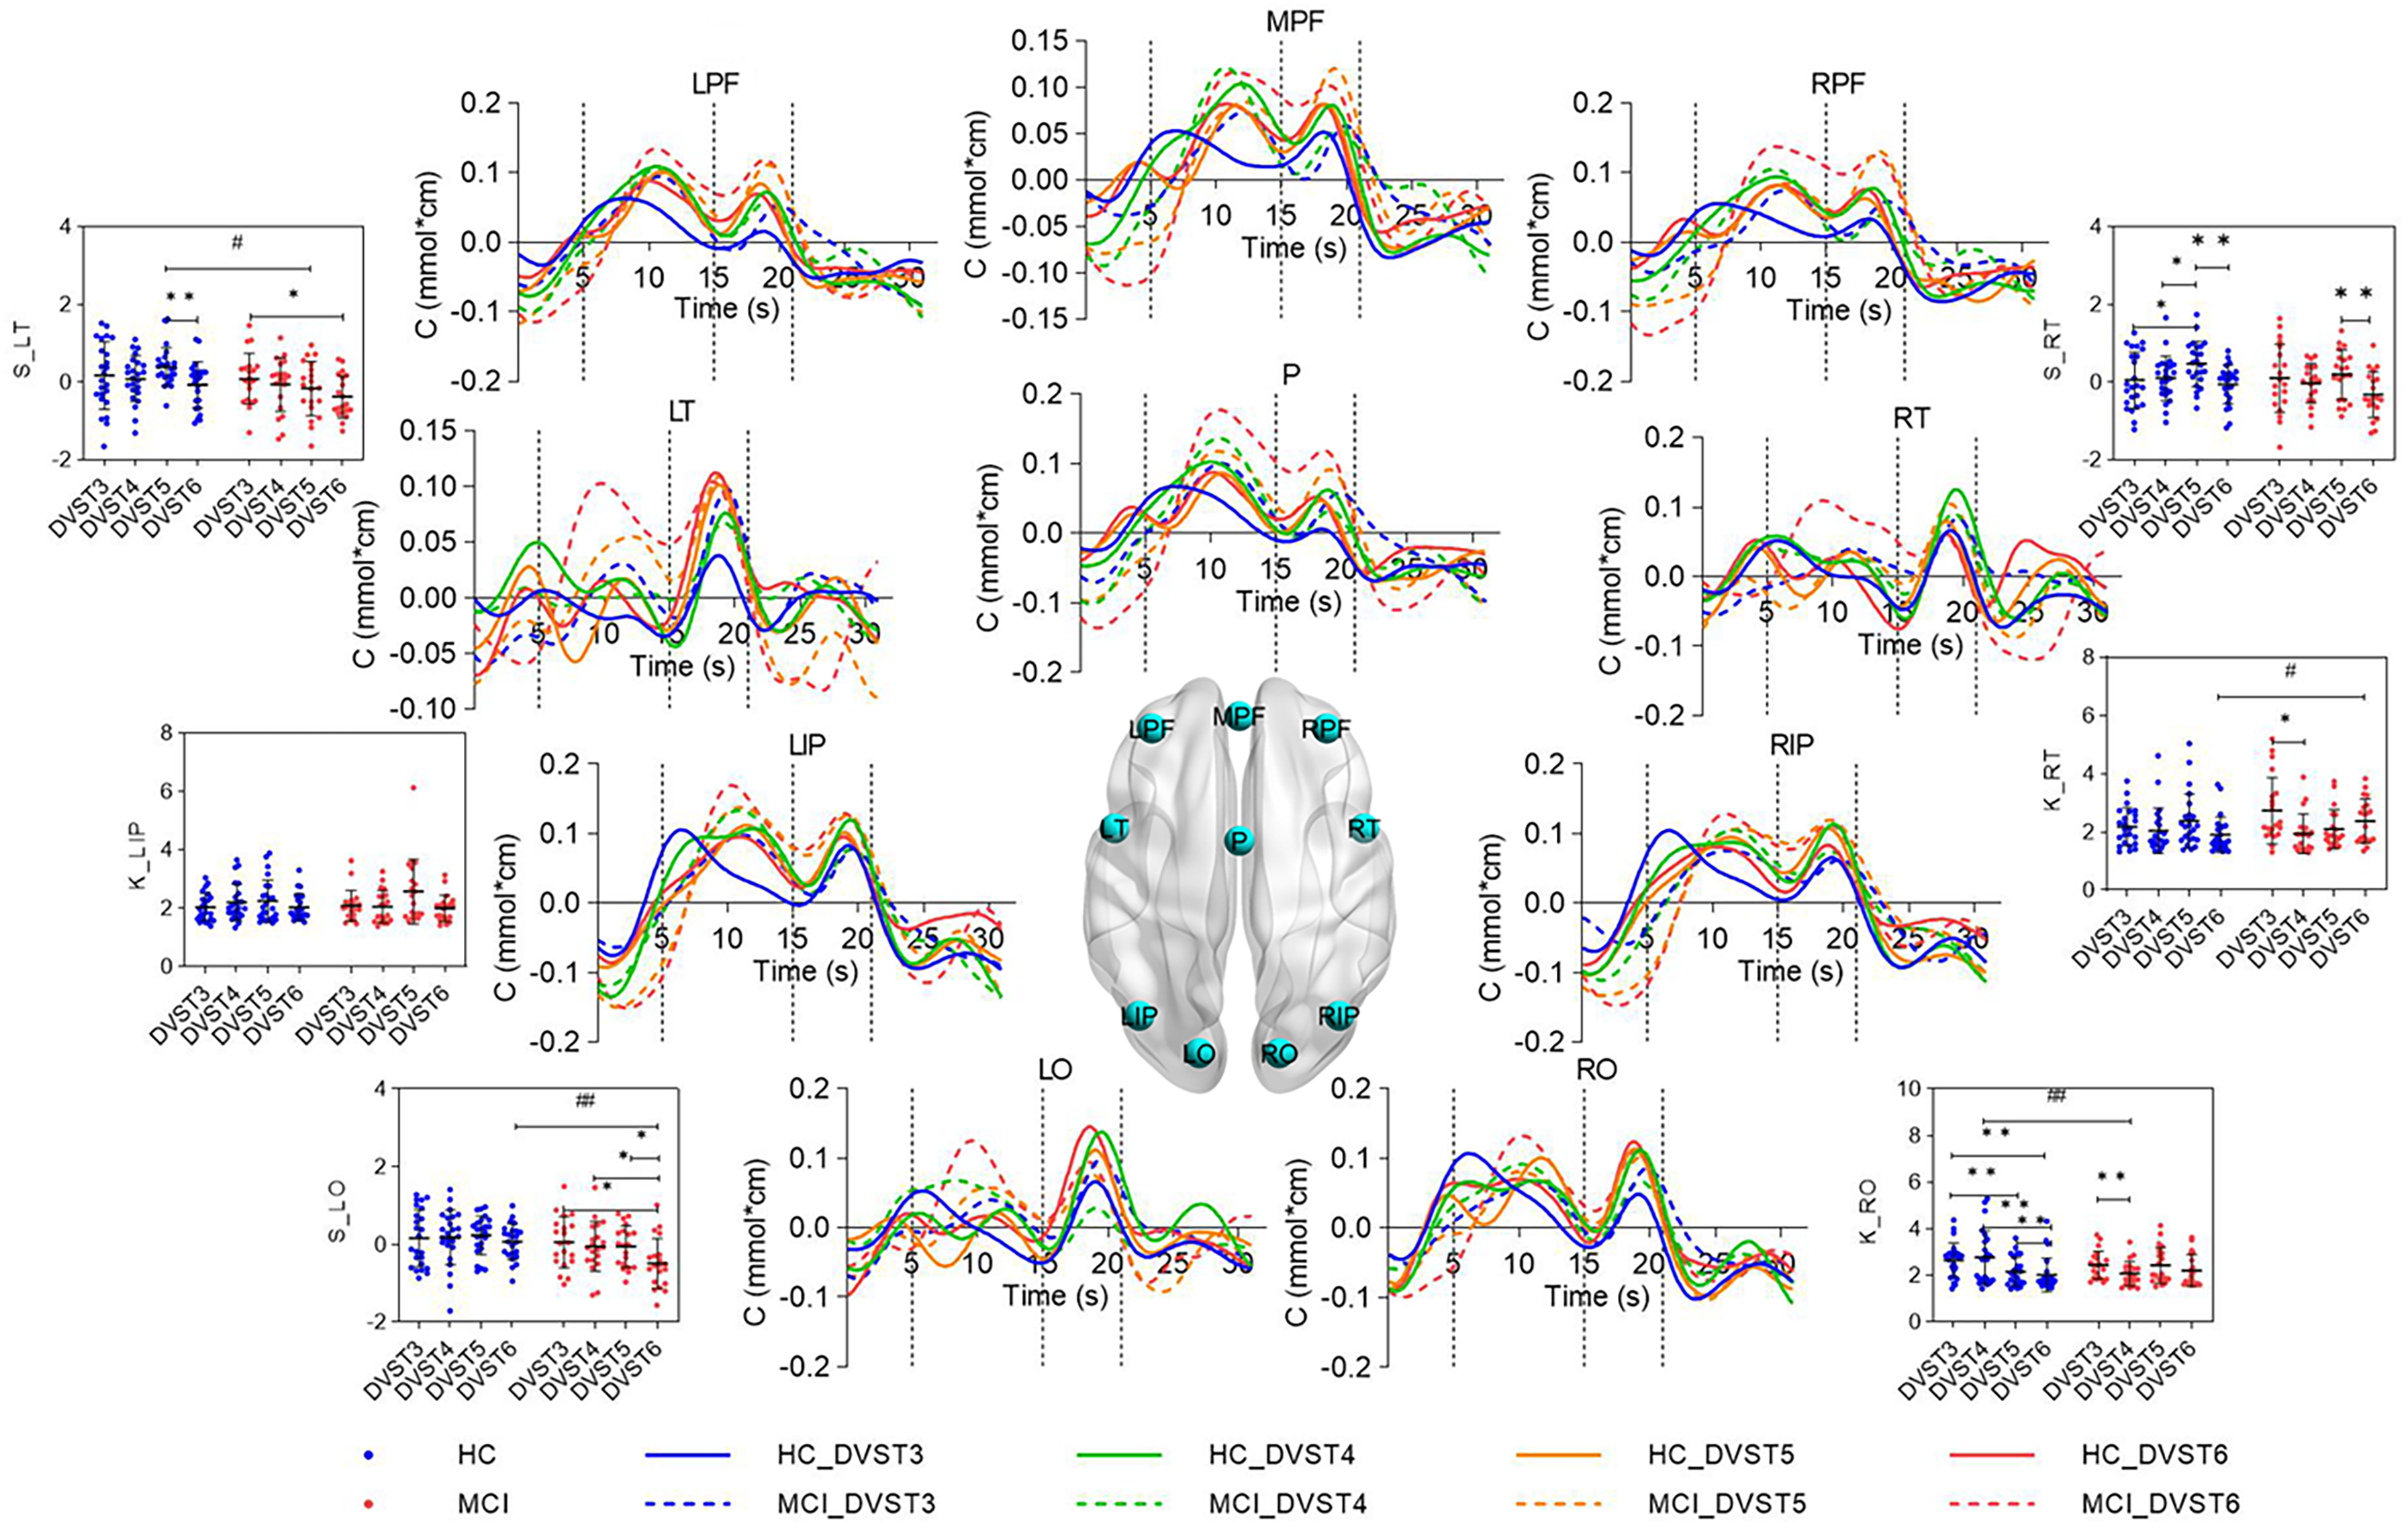
Brain activation intensity, kurtosis, and skewness. C indicates the change in HbO concentration, that is, the activation intensity. K indicates kurtosis, and S indicates skewness. * indicates within-group differences, * p < 0.05, ** p < 0.01. # indicates between-group differences, # p < 0.05, ## p < 0.01. Brain model from Brainnet Viewer.
The kurtosis for the encoding phase revealed significant condition effects for LIP (pcond = 0.03), RT (pcond = 0.05), and RO (pcond = 0.04), and a significant interaction effect for RT (pinter = 0.03) and RO (pinter = 0.01), see Table 3. Further analysis showed that there were significant differences in HC groups under different cognitive loads. Analyses for skewness found significant condition effects for LT (pcond = 0.02), RT (pcond < 0.01), and LO (pcond = 0.05). Significant between-group effects were found for LT (pgroup = 0.03) and LO (pgroup < 0.01). Further analysis revealed significant between- and within-group differences across cognitive load.
A two-way mixed ANOVA showed no statistically significant differences in activation intensity, kurtosis, and skewness features during memory retrieval.
Functional networks
After two-way mixed ANOVA, we found that the brain network features, such as the clustering coefficient, small-world, and local efficiency, significantly differed between the HC group and the MCI group under the thresholds of 0.1–0.12. Figure 4 demonstrates the brain network features of the two groups under the DVST3.
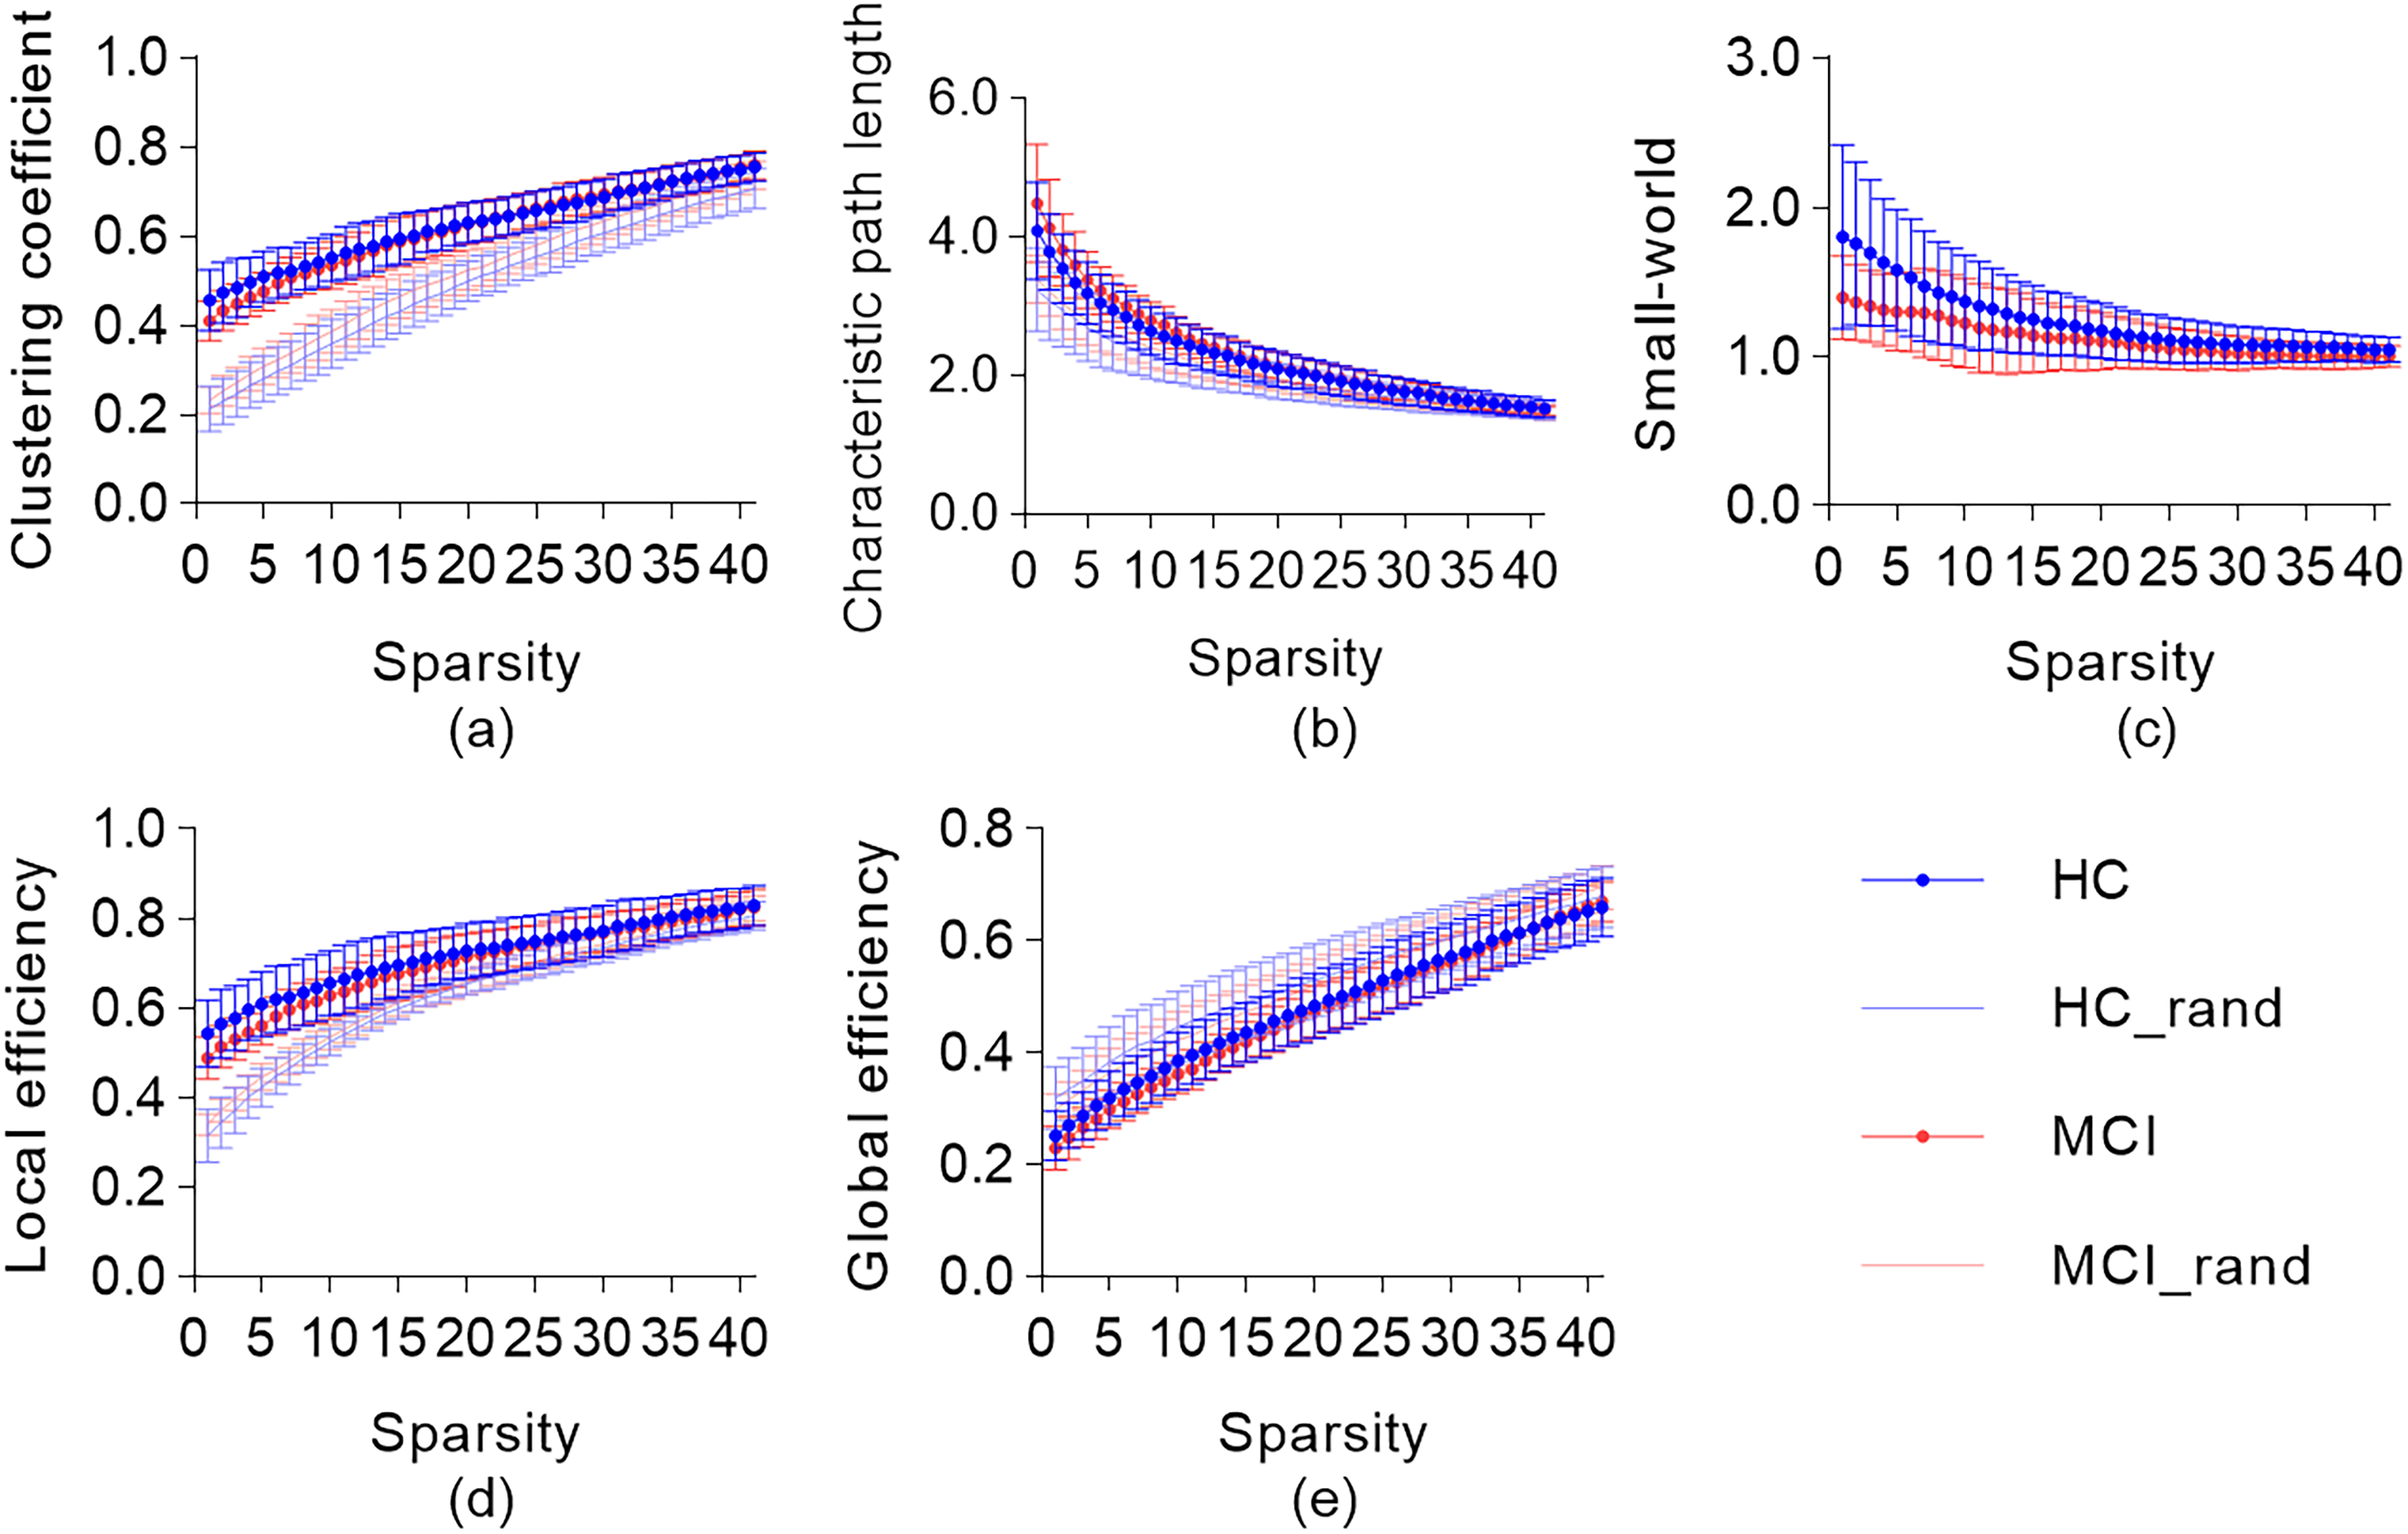
Functional network metrics with sparsity thresholds of 0.1–0.5 for the DVST3. (a) Clustering coefficient. (b) Characteristic path length. (c) Small-world. (d) Local efficiency. (e) Global efficiency. Blue and red curves with dots indicate the HC and MCI groups, respectively. The light-colored curves indicate the mean and error bars of the matched random network.
Figure 5 shows the network characteristics of the HC and MCI groups at a threshold of 0.11. Supplementary Table 2 shows the results of the two-way ANOVA. Two-way mixed ANOVA revealed a significant condition effect for clustering coefficient, pcond = 0.01, nonsignificant between-group (pgroup = 0.09), and interaction (pinter = 0.16) effects. Further analyses found that the HC group clustering coefficient decreased significantly with the increase of cognitive load (pDVST3−DVST4 = 0.03, pDVST3−DVST5 = 0.02, pDVST3−DVST6 < 0.01). The MCI group differed significantly only under the DVST4 and DVST5, p = 0.05. Between-group analyses found a significant difference under DVST3 (p = 0.03). Local efficiency had a significant condition effect (pcond < 0.01), with nonsignificant between-group effect (pgroup = 0.07) and interaction effect (pinter = 0.10). As the cognitive load was increased, the HC group significantly decreased local efficiency (pDVST3−DVST4 = 0.04, pDVST3−DVST5 = 0.02, pDVST3−DVST6 < 0.01). The MCI group had a significant difference under the DVST4 and DVST5 (p = 0.02). Similarly, there was a significant between-group difference under DVST3 (p = 0.01). Small-world had a significant between-group effect (pgroup = 0.03), a condition effect (pcond = 0.17), and an interaction effect that was not significant (pinter = 0.10). As the cognitive load was added, small-world decreased in the HC group, with a significant difference under the DVST3 and DVST6, p = 0.05. There was a significant between-group difference in small-world under the DVST3 (p = 0.01).

Network features for a sparsity threshold of 0.11. (a) The clustering coefficient, (b) the small-world, (c) the local efficiency, (d) the characteristic path length, and (e) global efficiency. * indicates significant difference in the group, *p < 0.05, **p < 0.01. #indicates significant differences between groups, #p < 0.05, ##p < 0.01.
EEG relative power density feature
In this study, each channel's relative power density features were calculated. After a two-way mixed ANOVA, there were no significant between-group effects, conditioned effects, or interaction effects in the two groups of subjects under different cognitive loads in the encoding phase. Under four cognitive loads with six channels, the delta and theta relative power densities of the MCI group were greater than those of the HC group. The alpha relative power densities of bilateral frontal and right occipital lobes were greater in the MCI group than in the HC group. In contrast, the alpha relative power densities of bilateral parietal and left occipital lobes were smaller in both MCI groups than in the HC group. Beta relative power density in the right frontal lobe and right occipital lobe was greater in the MCI group than in the HC group, and the rest of the channels showed that the MCI group was smaller than the HC group.
Significant effects were found in the bilateral parietal lobes during the memory retrieval phase (Supplemental Table 3). Significant between-group effects were found for the relative power densities of the O1 channel alpha (pgroup = 0.05), theta (pgroup = 0.05), and beta (pgroup = 0.01), but neither the condition effect nor the interaction effect was significant. Further analyses revealed significant between-group differences only for beta across cognitive loads (pDVST3 = 0.03, pDVST4 = 0.03, pDVST5 = 0.02, pDVST6 = 0.02). In theta wave of the O2 channel, the condition effect was significant, pcond = 0.03, intergroup effect pgroup = 0.35, and interaction effect pinter = 0.99 were not significant. The beta intergroup effect was significant (pgroup = 0.03), but the condition effect (pcond = 1.00) and interaction effect (pinter = 1.00) were not significant. The delta band interaction effect was significant (pinter = 0.04), but the intergroup effect (pgroup = 0.96) and condition effect were not significant (pcond = 0.07). There were no significant differences in the three features of the right parietal between and within groups.
Correlation analysis
The fNIRS features with significant differences were correlated with the EEG features of adjacent brain regions. As shown in Figure 6, during the memory encoding phase of the DVST3, the activation intensity of the LO in the HC group was significantly correlated with the relative power densities of the alpha, beta, and theta of the O1 channel. The skewness of LO in both the HC and MCI groups was significantly correlated with the relative power densities of the alpha, beta, and theta of the O1 channel. The skewness of the LT in the MCI group was significantly correlated with the relative power densities of the relative power densities of alpha, beta, and theta of O1 channels were significantly correlated.

Correlation between hemodynamic and electrophysiological features during the memory encoding phase. (a) and (b) are the correlation between LO activation intensity and O1 features in HC and MCI groups, respectively. (c) and (d) are correlations between LO skewness and O1 features in HC and MCI groups, respectively. (e) and (f) are the correlation between LT skewness and O1 features in the HC and MCI groups, respectively.
Discussion
To deepen the understanding of the neural basis of mild cognitive impairment, the fNIRS-EEG bimodal system was used to investigate the brain activity changes of MCI under different cognitive loads. The study confirmed that cognitive load modulates brain activity patterns in patients with MCI, that the left occipital and left temporal lobe are potentially sensitive regions for cognitive assessment, and that fNIRS features in the left occipital lobe are significantly correlated with EEG features.
In the present study, parietal and occipital activation intensity was enhanced in MCI patients with increasing cognitive load relative to the HC group, which we attribute to compensatory mechanisms. It is well known that compensatory mechanisms in patients with neurodegenerative diseases either recruit intact neural circuits in adjacent brain regions or activate existing neural networks to maintain cognitive function. 59 Functional neuroimaging typically captures this sequence of increased cerebral perfusion (higher metabolic demand to maintain normal function, hyperactivation) 60 followed by decreased cerebral perfusion (limited metabolic demand due to severe neurodegenerative changes, hypoactivation). 61 The compensatory process is inversely proportional to the extent of neurodegenerative disease (which is evident in the early phases of the disease). In contrast, failure of neurologic compensation (reduced hemodynamic response, hypoactivation) occurs predominantly in the more severe stages. 62
The left occipital and left temporal lobes are key regions for cognitive assessment.20,63 Most studies have focused on the prefrontal lobe because of its association with higher processing functions. Relevant studies have confirmed that in the resting state, the decreased functional connectivity of MCI mainly involves bilateral prefrontal, occipital, and parietal cortex, such as the functional connectivity of the right prefrontal and right occipital, the left prefrontal and left occipital, and the right prefrontal and the left occipital.64,65 This may be attributed to the pattern of hypoperfusion and hypometabolism in patients with MCI, resulting in reduced tissue oxygenation levels and diminished blood flow turbulence. Liu et al. found that left prefrontal and right occipital functional connectivity was significantly higher in the MCI group than in the HC group during a counting backward task. 66 It is important to note that these functional connectivity abnormalities may be region-specific. In addition, the left temporal lobe plays a crucial role in vocabulary storage. At a high cognitive load, MCI people may use simpler and more familiar strategies rather than integrate more visual or spatial information. Such a strategy may lead to increased activity in the left temporal, resulting in a left-biased state. It is also important to note that when cognitive load is increased, emotional stress may lead to a shift in the regulatory mechanisms of the left temporal, which may further exacerbate left temporal activation.
In this study, as the cognitive load increased, the clustering coefficient, small-world, and local efficiency of the HC group significantly decreased, and the brain network lost regularity and had higher dispersion. When the cognitive load increases, the task demands more neural resources, which may lead to the prioritization of certain neural connections, thus reducing the clustering coefficient. The flexibility and adaptability of the neural network are limited, and the efficiency of information processing is reduced, which is manifested in the weakening of the small-world. Highly loaded tasks may lead to distraction and competition for resources, and neurons in localized regions may have difficulty communicating efficiently, thus reducing local efficiency. 67 Zhao et al. explored the role of working memory load in predicting activity flow and brain activation in different frontal-parietal systems. It was found that the activation of both executive control and dorsal attentional networks monotonically increased with increasing levels of working memory load, but their relative contributions to distributed information processing showed different load-dependent changes. 68 In the present study, the clustering coefficient of the MCI group was significantly lower than that of the HC group during the DVST3, contrary to the results of Li et al. 69 This may be due to the differences in MCI types (i.e., aMCI and naMCI combined vs. aMCI alone), which led to inconsistent results.
Previous studies have confirmed that electrophysiology and hemodynamics are related. The degree of neural activation correspondence between different regions or networks is different. 70 In the present study, we found that the left occipital activation intensity and skewness, and the skewness of the left temporal were significantly correlated with the alpha, beta, and theta relative power densities of the O1 channels. The left occipital activation intensity and skewness, as well as the skewness of the left temporal lobe, can be used as potentially important indicators for cognitive assessment in the future. The EEG feature of the left occipital likewise deserves further attention.
There are limitations in this study: the sample size is relatively small. In the future, MCI subtypes need to be more finely divided based on large samples to further explore the changes in brain activity characteristics. Second, we found that the hemodynamic characteristics of the HC and MCI groups varied with the cognitive load, and it is worthwhile to further explore whether the further increase in cognitive load would lead to significant changes in electrophysiological characteristics. The cognitive assessment indicators proposed in this study need to be further validated and tested in large datasets, to facilitate clinical translation and contribute to the early diagnosis of cognitive disorders.
In conclusion, this study analyzed the changes in cerebral hemodynamic and electrophysiological activities in patients with MCI and healthy people under different cognitive loads. We concluded that the brain activity pattern in MCI depends on cognitive load. With the increase of cognitive load, some brain regions would be over-activated, and the compensatory mechanism contributed to the maintenance of the normal functional activities of the brain. The left occipital and left temporal lobes may be important regions for MCI assessment and need to be focused on in the future.
Supplemental Material
sj-docx-1-alr-10.1177_25424823251325537 - Supplemental material for Study on cognitive impairment evaluation based on photoelectric neural information
Supplemental material, sj-docx-1-alr-10.1177_25424823251325537 for Study on cognitive impairment evaluation based on photoelectric neural information by Zehua Wang, Ye Zhang, Ning Ma, Huiting Qiao, Meiyun Xia and Deyu Li in Journal of Alzheimer's Disease Reports
Footnotes
Acknowledgments
We want to thank Danyang Huichuang Medical Equipment Co., Ltd in China for supporting the fNIRS equipment for this study.
Author contributions
Ethical considerations
This study was approved by the Guangxi Jiangbin Hospital Ethics Committee (GXJBYY-IRB-KY-2020016) and performed following the Declaration of Helsinki.
Consent to participate
Each participant was fully informed of the research purpose and methods and provided written, informed consent before the experiment started.
Funding statement
The authors disclosed receipt of the following financial support for the research, authorship, and/or publication of this article: This work has been supported by the Research Funding of Hangzhou International Innovation Institute of Beihang University (Grant No. 2024KQ098), the China Disabled Persons’ Federation special topic (Grant No. CDPF2023KF00001), the National Natural Science Foundation of China (Grant No. 8246140544), the National Key Research and Development Plan (Grant Nos. 2021YFF0501601, 2021YFF0501602, and 2022YFC3601203).
Declaration of conflicting interests
The authors declared no potential conflicts of interest with respect to the research, authorship, and/or publication of this article.
Data availability
Due to participant privacy concerns, the dataset used in this study cannot be made publicly available.
Supplemental material
Supplemental material for this article is available online.
References
Supplementary Material
Please find the following supplemental material available below.
For Open Access articles published under a Creative Commons License, all supplemental material carries the same license as the article it is associated with.
For non-Open Access articles published, all supplemental material carries a non-exclusive license, and permission requests for re-use of supplemental material or any part of supplemental material shall be sent directly to the copyright owner as specified in the copyright notice associated with the article.