
Abstract
Background
Repetitive transcranial magnetic stimulation (rTMS) offers a non-invasive therapeutic option for primary progressive aphasia (PPA) and Alzheimer's disease among other neurological conditions.
Objective
This study aims to enhance the personalization of rTMS therapy by predicting patient-specific changes after one session of rTMS across multiple clinical assessments, based on the targeted stimulation area.
Methods
We studied 20 PPA patients, each receiving rTMS targeting in three distinct brain regions. Using machine learning, we developed predictive models for eight clinical outcome measures, incorporating features extracted from structural MRI, resting-state EEG, and individualized electric field modeling via SimNIBS. These features were used to estimate each patient's likely response to rTMS in terms of cognitive and language function.
Results
Of the outcome measures, ‘Clinical impression of change’ emerged as the most reliable indicator of perceived improvement, achieving a top F1-score of 0.80 using a Decision Tree model based solely on sociodemographic features. Meanwhile, ‘Words per minute’ reached an F1-score of 0.77 with a Random Forest model utilizing EEG-derived features.
Conclusions
The predictive models developed in this study underscore the feasibility of using EEG and SimNIBS data to anticipate patient outcomes from rTMS therapy. This data-driven framework can aid in customizing rTMS protocols, paving the way for more targeted and effective interventions for PPA and related neurodegenerative conditions.
Keywords
Introduction
Primary progressive aphasia (PPA) is a neurodegenerative syndrome characterized by a gradual decline in language abilities while other cognitive functions remain relatively preserved in the early stages of the disease. 1 The syndrome encompasses three main subtypes: nonfluent/agrammatic (nfvPPA), semantic (svPPA), and logopenic (lvPPA) aphasia. Each subtype is associated with relatively specific clinical and neuroanatomical characteristics, although there is some level of overlap. 2
The nfvPPA is characterized by nonfluent spontaneous speech with features such as agrammatism, phonetic paraphasias, and/or apraxia of speech. 2 Patients with nfvPPA often have difficulty with speech production and grammar, but comprehension remains relatively preserved. 2 The svPPA, is characterized by a loss of word meaning and semantic knowledge. 2 Patients with svPPA may have fluent speech, but their language is often empty and lacks meaning. 2 Finally, the lvPPA is characterized by word-finding difficulties and impaired sentence words repetition. 2 Patients with lvPPA may have intact grammar and comprehension, but struggle with finding the right words and may show phonological errors. 2
Recent studies have highlighted the potential of behavioral treatments for speech and language in PPA. A systematic review of 103 studies involving 626 individuals with PPA found that most interventions focused on word retrieval, with the majority reporting improvements in primary outcome measures, generalization, and maintenance of treatment effects. 3 Furthermore, research is ongoing to better understand the underlying pathology and progression of PPA. Advances in neuroimaging and biomarker studies may lead to earlier diagnosis and more targeted interventions. 4
Non-invasive brain stimulation (NIBS) and, specifically, transcranial magnetic stimulation (TMS) stands as a pioneering technique engineered to stimulate specific cerebral regions and networks. By generating a magnetic field that penetrates the scalp, it induces electrical currents in targeted brain regions, modulating neuronal activity. 5 This method has significantly contributed to the mapping and exploration of various cerebral functions, ranging from memory and visual processing to motor cortex dynamics.6–9 A notable advancement within this domain is repetitive TMS (rTMS), which has shown promise in ameliorating symptoms of several neurological and psychiatric disorders by delivering sustained effects through repeated stimulation over time. 5
Studies investigating NIBS in the field of PPA have yielded heterogeneous results, highlighting both the potential of these techniques and the need for further investigation to draw definitive conclusions. 10
In a previous study, we found that the application of 15 sessions of rTMS for 3 weeks in patients with PPA was associated with positive effects in language and neuropsychiatric symptoms.11,12 Additionally, we evaluated the clinical responses after a single-session of rTMS in the left inferior frontal gyrus (IFG) and left dorsolateral prefrontal cortex (DLPFC) in patients with nfvPPA and svPPA. We found differential effects over the DLPFC and Broca's area (IFG) according to the PPA variant, showing a general favorable use of DLPFC. However, some patients responded better to stimulation of different areas, suggesting that personalization of the brain target could maximize the effect of the technique. 13
The efficacy of rTMS depends on precise targeting and the tailoring of stimulation parameters, which vary from one individual to another. Due to the heterogeneity of PPA in terms of variants and stages, we could hypothesize that a personalized approach could maximize the effects of TMS. Thus, machine learning (ML) offers promising avenues for this personalization of protocols, enhancing the accuracy and outcomes of treatment. For TMS, ML has shown remarkable potential for personalizing treatments. For example, Moser et al. developed a model that can identify the optimal placement of the coil for a given cortical target in TMS using a novel multi-task deep neural network. 14 Another example can be found in, 15 where Ebrahimzadeh et al. were able to anticipate the outcome of rTMS using EEG in patients with major depressive disorder, classifying them as responders and non-responders.
These examples highlight the transformative potential of ML in personalizing brain stimulation. As our ability to collect and analyze complex multimodal data improves, we can expect even more sophisticated and accurate personalized treatment approaches in the future. This trend toward personalized data-driven care promises to revolutionize the management of neurological disorders, offering patients more effective and tailored therapeutic options.
This study aims to advance the integration of ML and rTMS in the context of PPA. We propose the development of a predictive model based on several biomarkers collected at baseline to predict the response to single-session rTMS. Such a model could inform the selection of optimized rTMS protocols for PPA and lay the groundwork for future, more efficient and stratified clinical trials in this field.
Methods
Participants
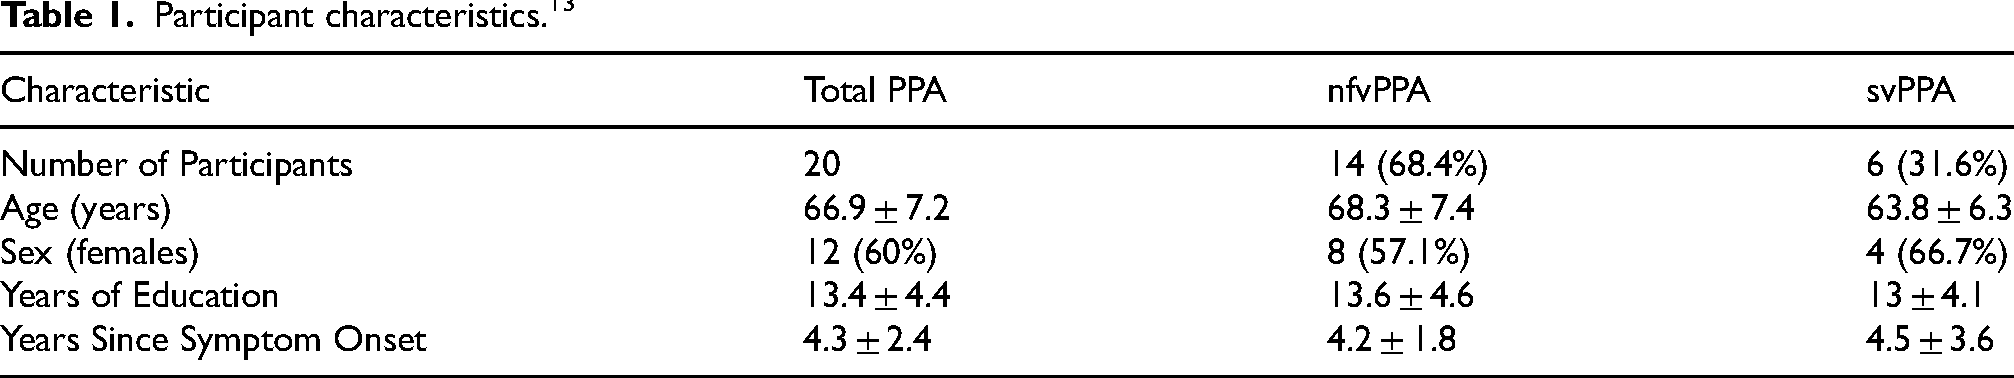
This study involved a cohort of 20 individuals with PPA (12 females and 8 males). These participants were the same from a prior study,11,13 selected based on the diagnostic criteria for PPA as defined by Gorno-Tempini et al. 16 Table 1 presents an overview of the participants’ characteristics. Fourteen patients were classified as nfvPPA, and 6 as svPPA.
Participant characteristics. 13
Stimulation protocol and assessments
Participants underwent a single session of rTMS targeting several brain regions implicated in language processing and cognitive function. These regions included the DLPFC and IFG areas. Sham stimulation (Vertex stimulation) was included as a control to assess the placebo effect. An adequate interval between consecutive stimulations was ensured to prevent carryover effects. 13
As can be seen in Figure 1, language assessments were conducted before and after treatment. Additionally, EEG and MRI were acquired before treatment.
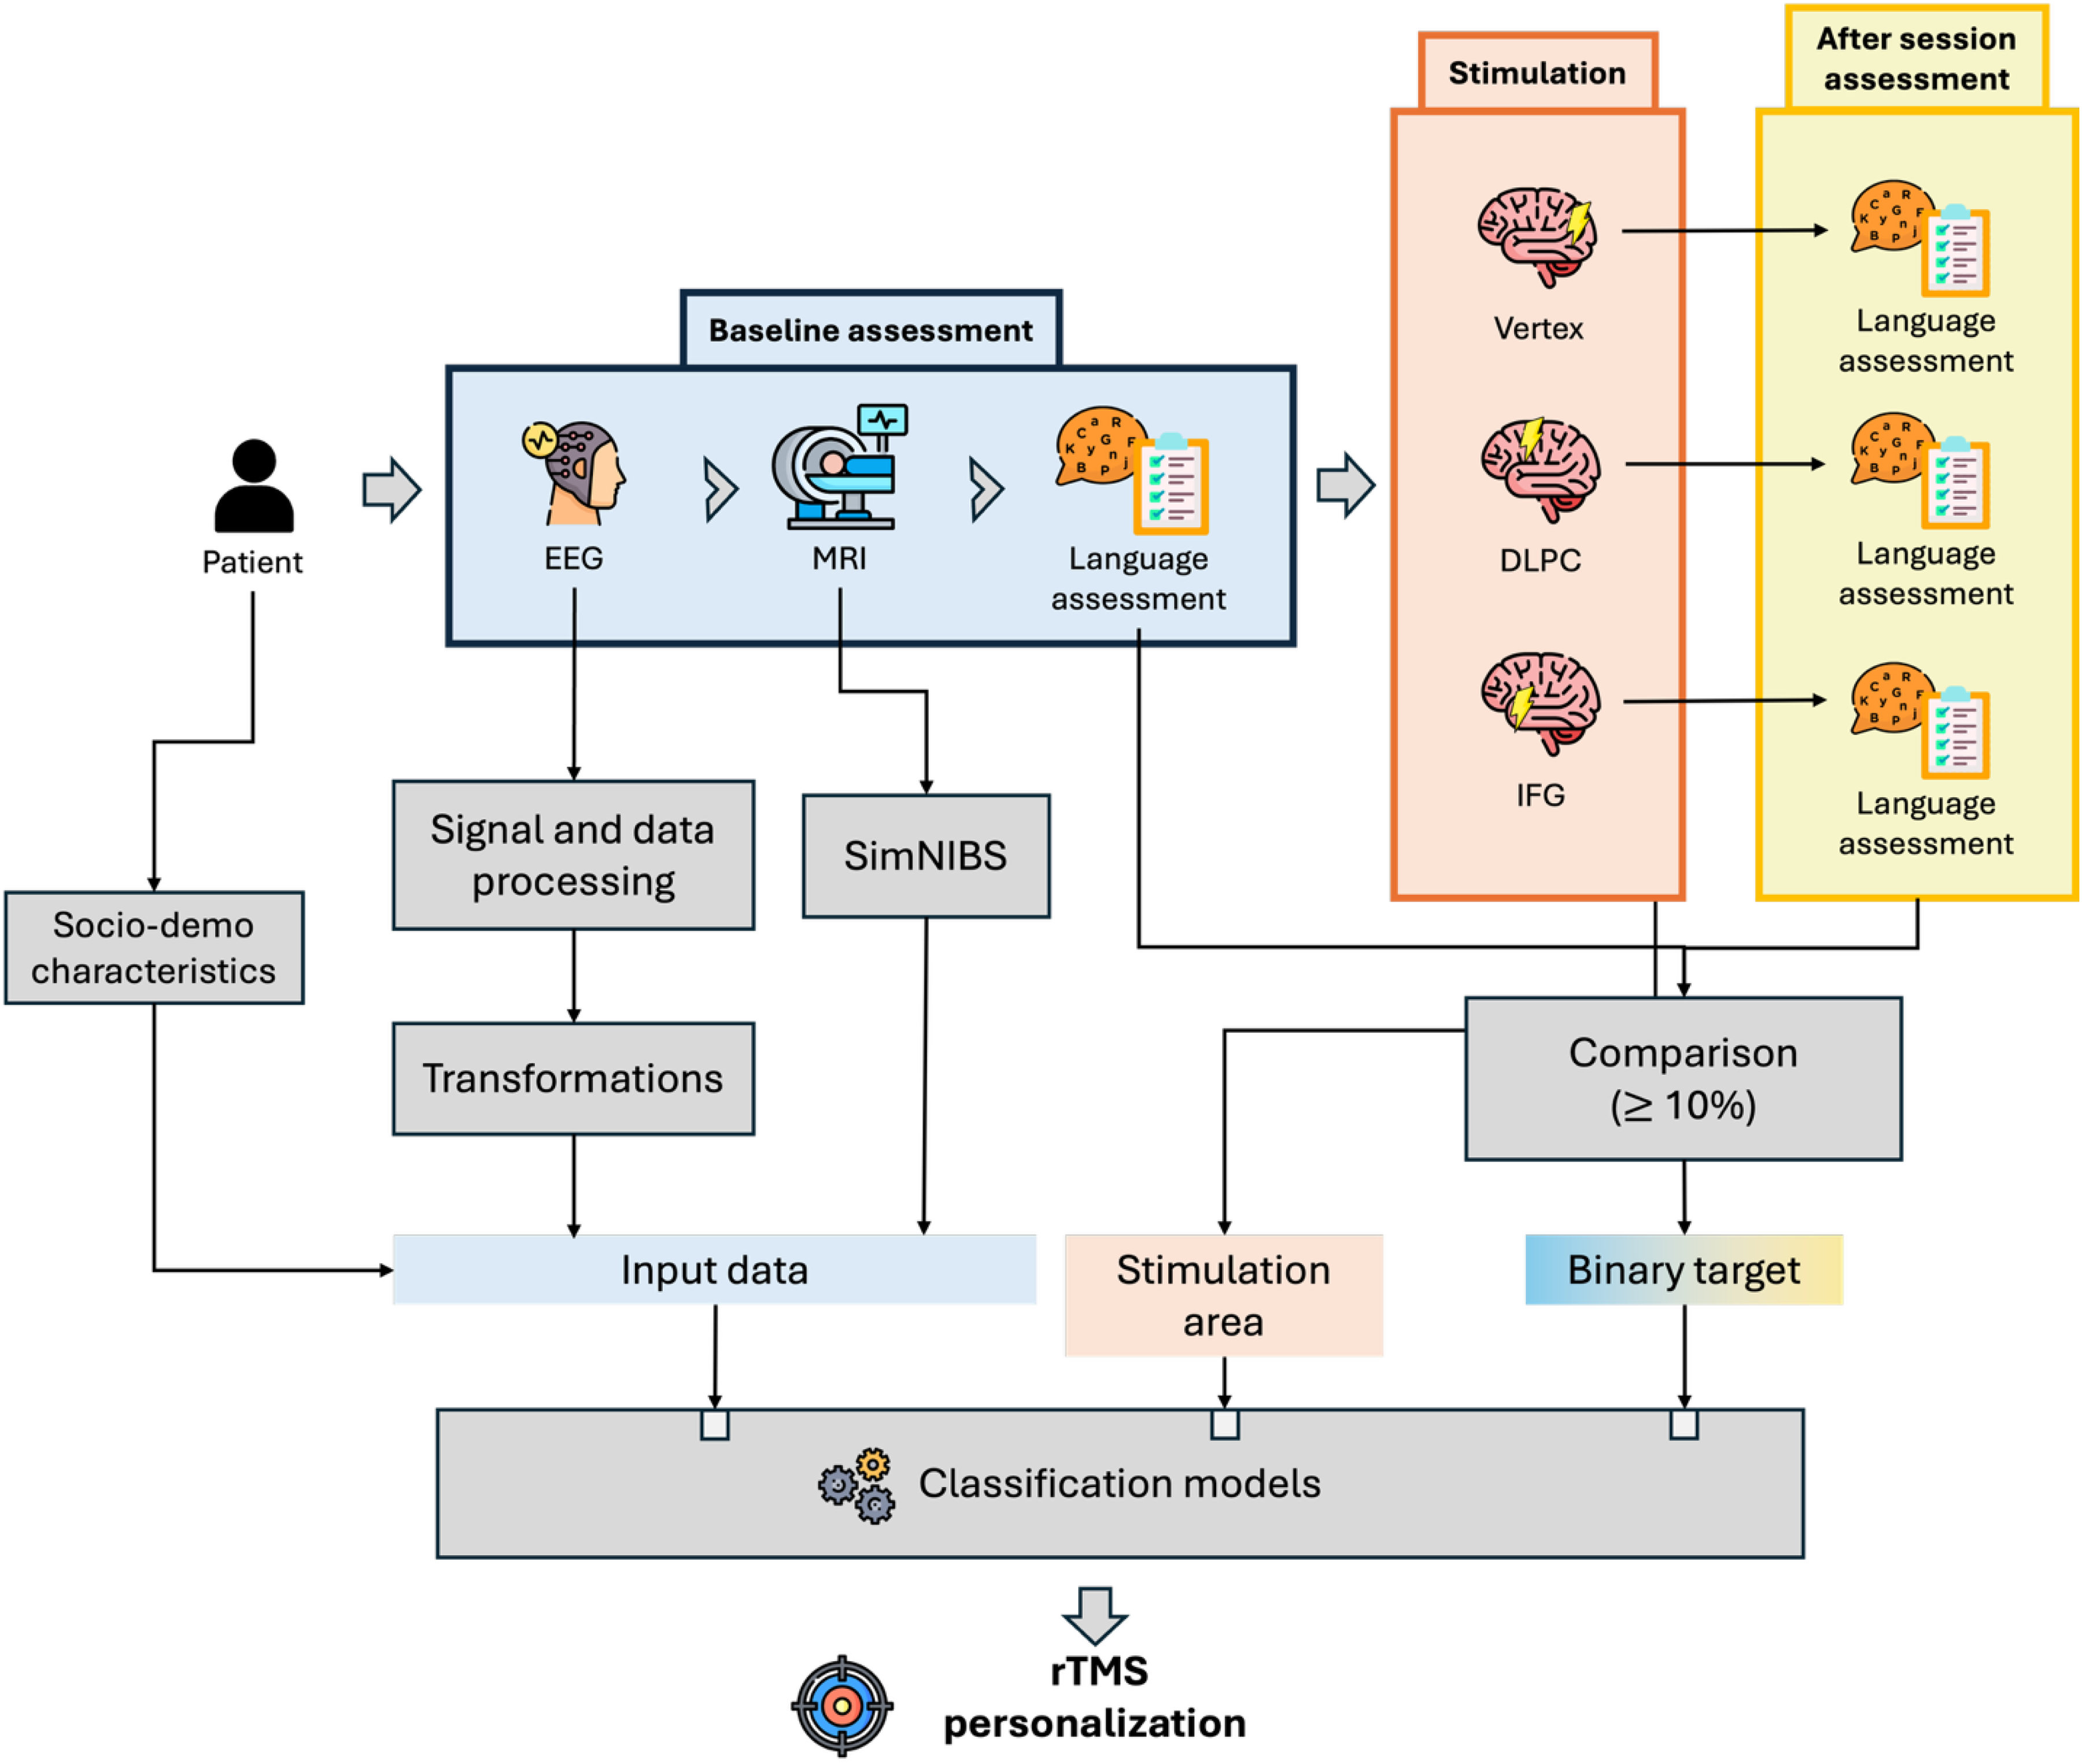
Summary of the data processing and feature selection pipeline for PPA patient data.
Each patient underwent three stimulation sessions, with each session considered an independent data point. This design yielded a potential total of 60 observations (20 patients×3 stimulation areas), enabling a more fine-grained analysis of rTMS effects within participants across sessions. However, not all completed the full protocol. Consequently, the final dataset for modeling comprised 54 valid observations.
Data and EEG acquisition
Electroencephalography (EEG) data were captured both pre- and post-stimulation sessions utilizing a NicoletOne EEG system, with 32 channels configured according to the international 10/20 system, with reference to electrode A1. 17 These recordings were undertaken in a controlled, resting state condition, asking participants to remain with their eyes closed, facilitating a consistent and undisturbed data collection environment for approximately 20 min.
EEG data preprocessing
To ensure the integrity and analytical quality of the EEG data, a comprehensive preprocessing protocol was applied, leveraging the capabilities of the EEGLAB toolbox within the Matlab environment. This preprocessing regimen was devised following the esteemed guidelines of Makoto's recommended EEG preprocessing pipeline,
18
a method revered for its systematic approach to EEG data conditioning. The sequence of preprocessing steps executed is visually summarized in Figure 2, comprising:
Selection of pertinent time ranges to focus analysis on the most relevant data segments. Application of a high-pass filter with a 1 Hz cutoff to remove low-frequency noise and drift. Utilization of the CleanLine plugin to eliminate electrical line noise. Re-referencing of EEG data to an average reference, enhancing signal comparability across channels. Implementation of a low-pass filter with a 40 Hz cutoff to exclude high-frequency artifacts. Execution of Independent Component Analysis (ICA) to identify and segregate artifact components from neural signals. Epoching of the continuous EEG signal into manageable, discrete time windows for detailed examination. Employing a detailed visual inspection for artifact rejection in the epoched data, ensuring the exclusion of non-neural activity.
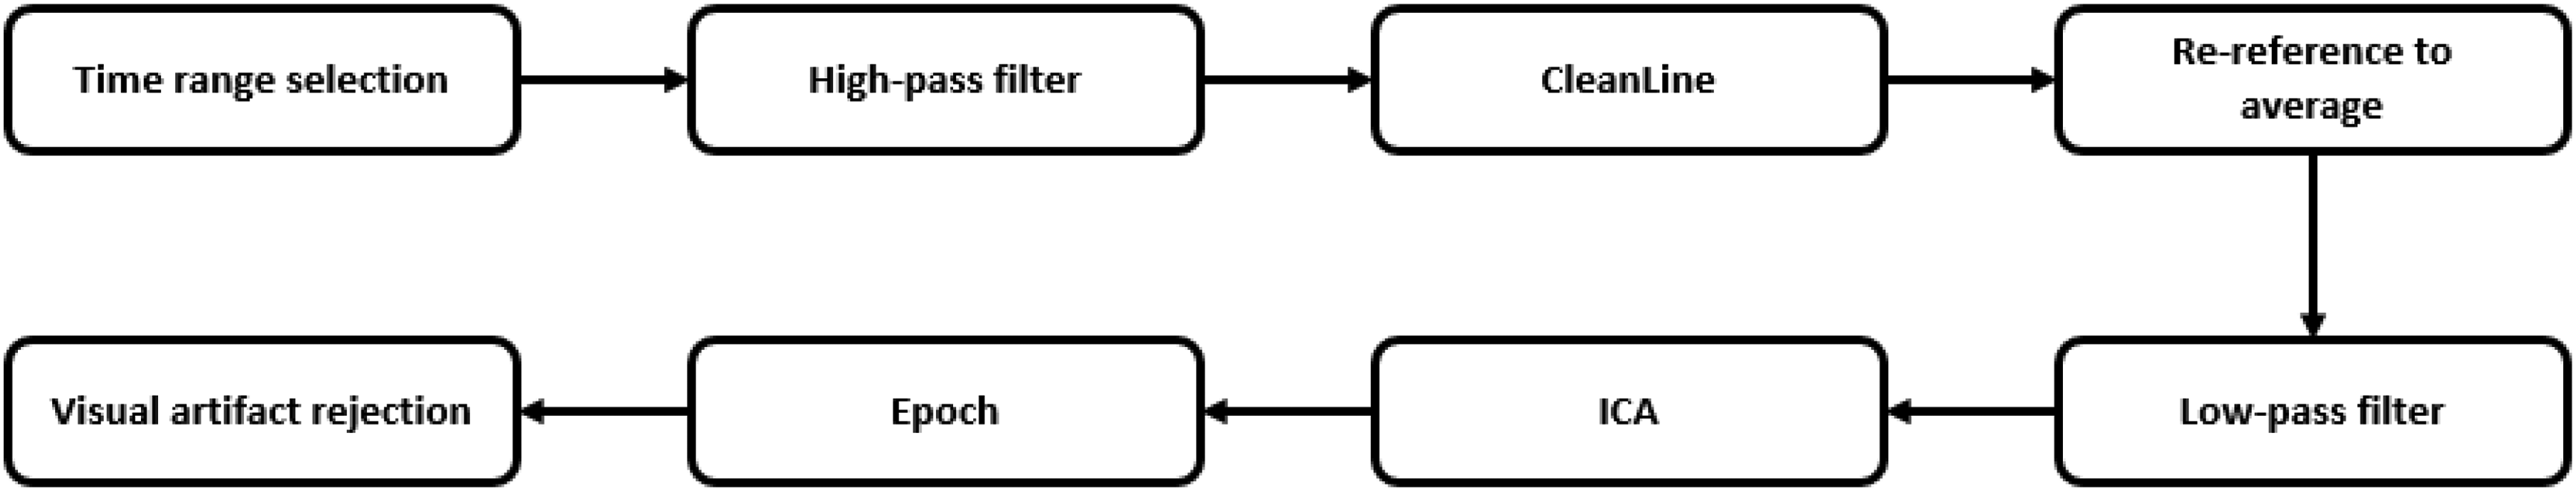
EEG preprocessing pipeline. A step-by-step visualization of the preprocessing workflow applied to EEG data. 17
For an in-depth discussion and rationale behind each preprocessing step, readers are directed to our previous publication, 17 where the methodology is described in detail.
MRI acquisition and individual electric field estimulation
MRI (1.5 T, SIGNA HDxt, GE Healthcare) was acquired before the start of the first rTMS session, and included the T1-weighted 3D fast spoiled gradient-echo.
SimNIBS (Simulation of Non-invasive Brain Stimulation), version 4.0.1 (2024), was used for computational modeling of electric fields.
19
MRI was processed using SimNIBS, including the following steps:
Segmentation: T1-weighted MRI scans are segmented into different tissue types (e.g., scalp, skull, cerebrospinal fluid, gray matter, and white matter) using advanced image processing algorithms. Mesh Generation: From these segmentations, SimNIBS creates a volumetric finite element mesh, representing the head's complex geometry and tissue conductivities. Tissue Properties: Each tissue type is assigned specific electrical conductivity values based on empirical data, allowing for realistic modeling of current flow.
We employed SimNIBS to calculate the electric field from the different targeted brain regions used in the study. Specifically, we performed the following procedures:
Initialization involved importing the T1-weighted MRI data into SimNIBS using the ‘charm’ function, generating a ‘headmesh’ object that accurately represented the anatomical features of each patient's head. Target regions for stimulation were precisely identified, and the appropriate coil positions were selected based on the intended area of impact. For example, to stimulate Broca's area, coil at F7 was chosen, while coil at F3 was used for targeting the DLPFC. The simulation execution yielded a new ‘headmesh’ object, incorporating the results of the applied stimulation. Utilizing the ‘get_fields_at_coordinates’ function, we extracted data on magnetic and electric fields at pre-determined coordinates, aligned with the 10–20 EEG system.
20
A comprehensive dataset was compiled, covering 213 unique coordinates in the patient's left hemisphere, utilizing the SPM12 software for spatial alignment.
The integration of SimNIBS into our study allowed us to analyze and include information about the electric fields within the brain, enhancing our original approach.
Feature generation
To enrich our dataset with a multifaceted understanding of each patient's neural activity, we implemented a series of data transformation techniques on the original EEG signals. These methods, elaborately detailed in our previous work,
17
included:
In addition to these EEG-derived features, we incorporated socio-demographic data from patients, such as age, years with symptoms, education years, etc; and data on simulated electric fields, generated through SimNIBS simulations, as a novel dimension in our analysis. Specifically, we extracted electric field measurements at 213 coordinates within the left hemisphere, as delineated in our EEG electrode mapping (refer to Figure 3(a)). To streamline their integration into our predictive model, these coordinates were aggregated into 11 distinct regions, each aligning with a standard 10–20 EEG system location, including Fp1, F7, F3, Fz, T3, C3, Cz, T5, P3, Pz, and O1.
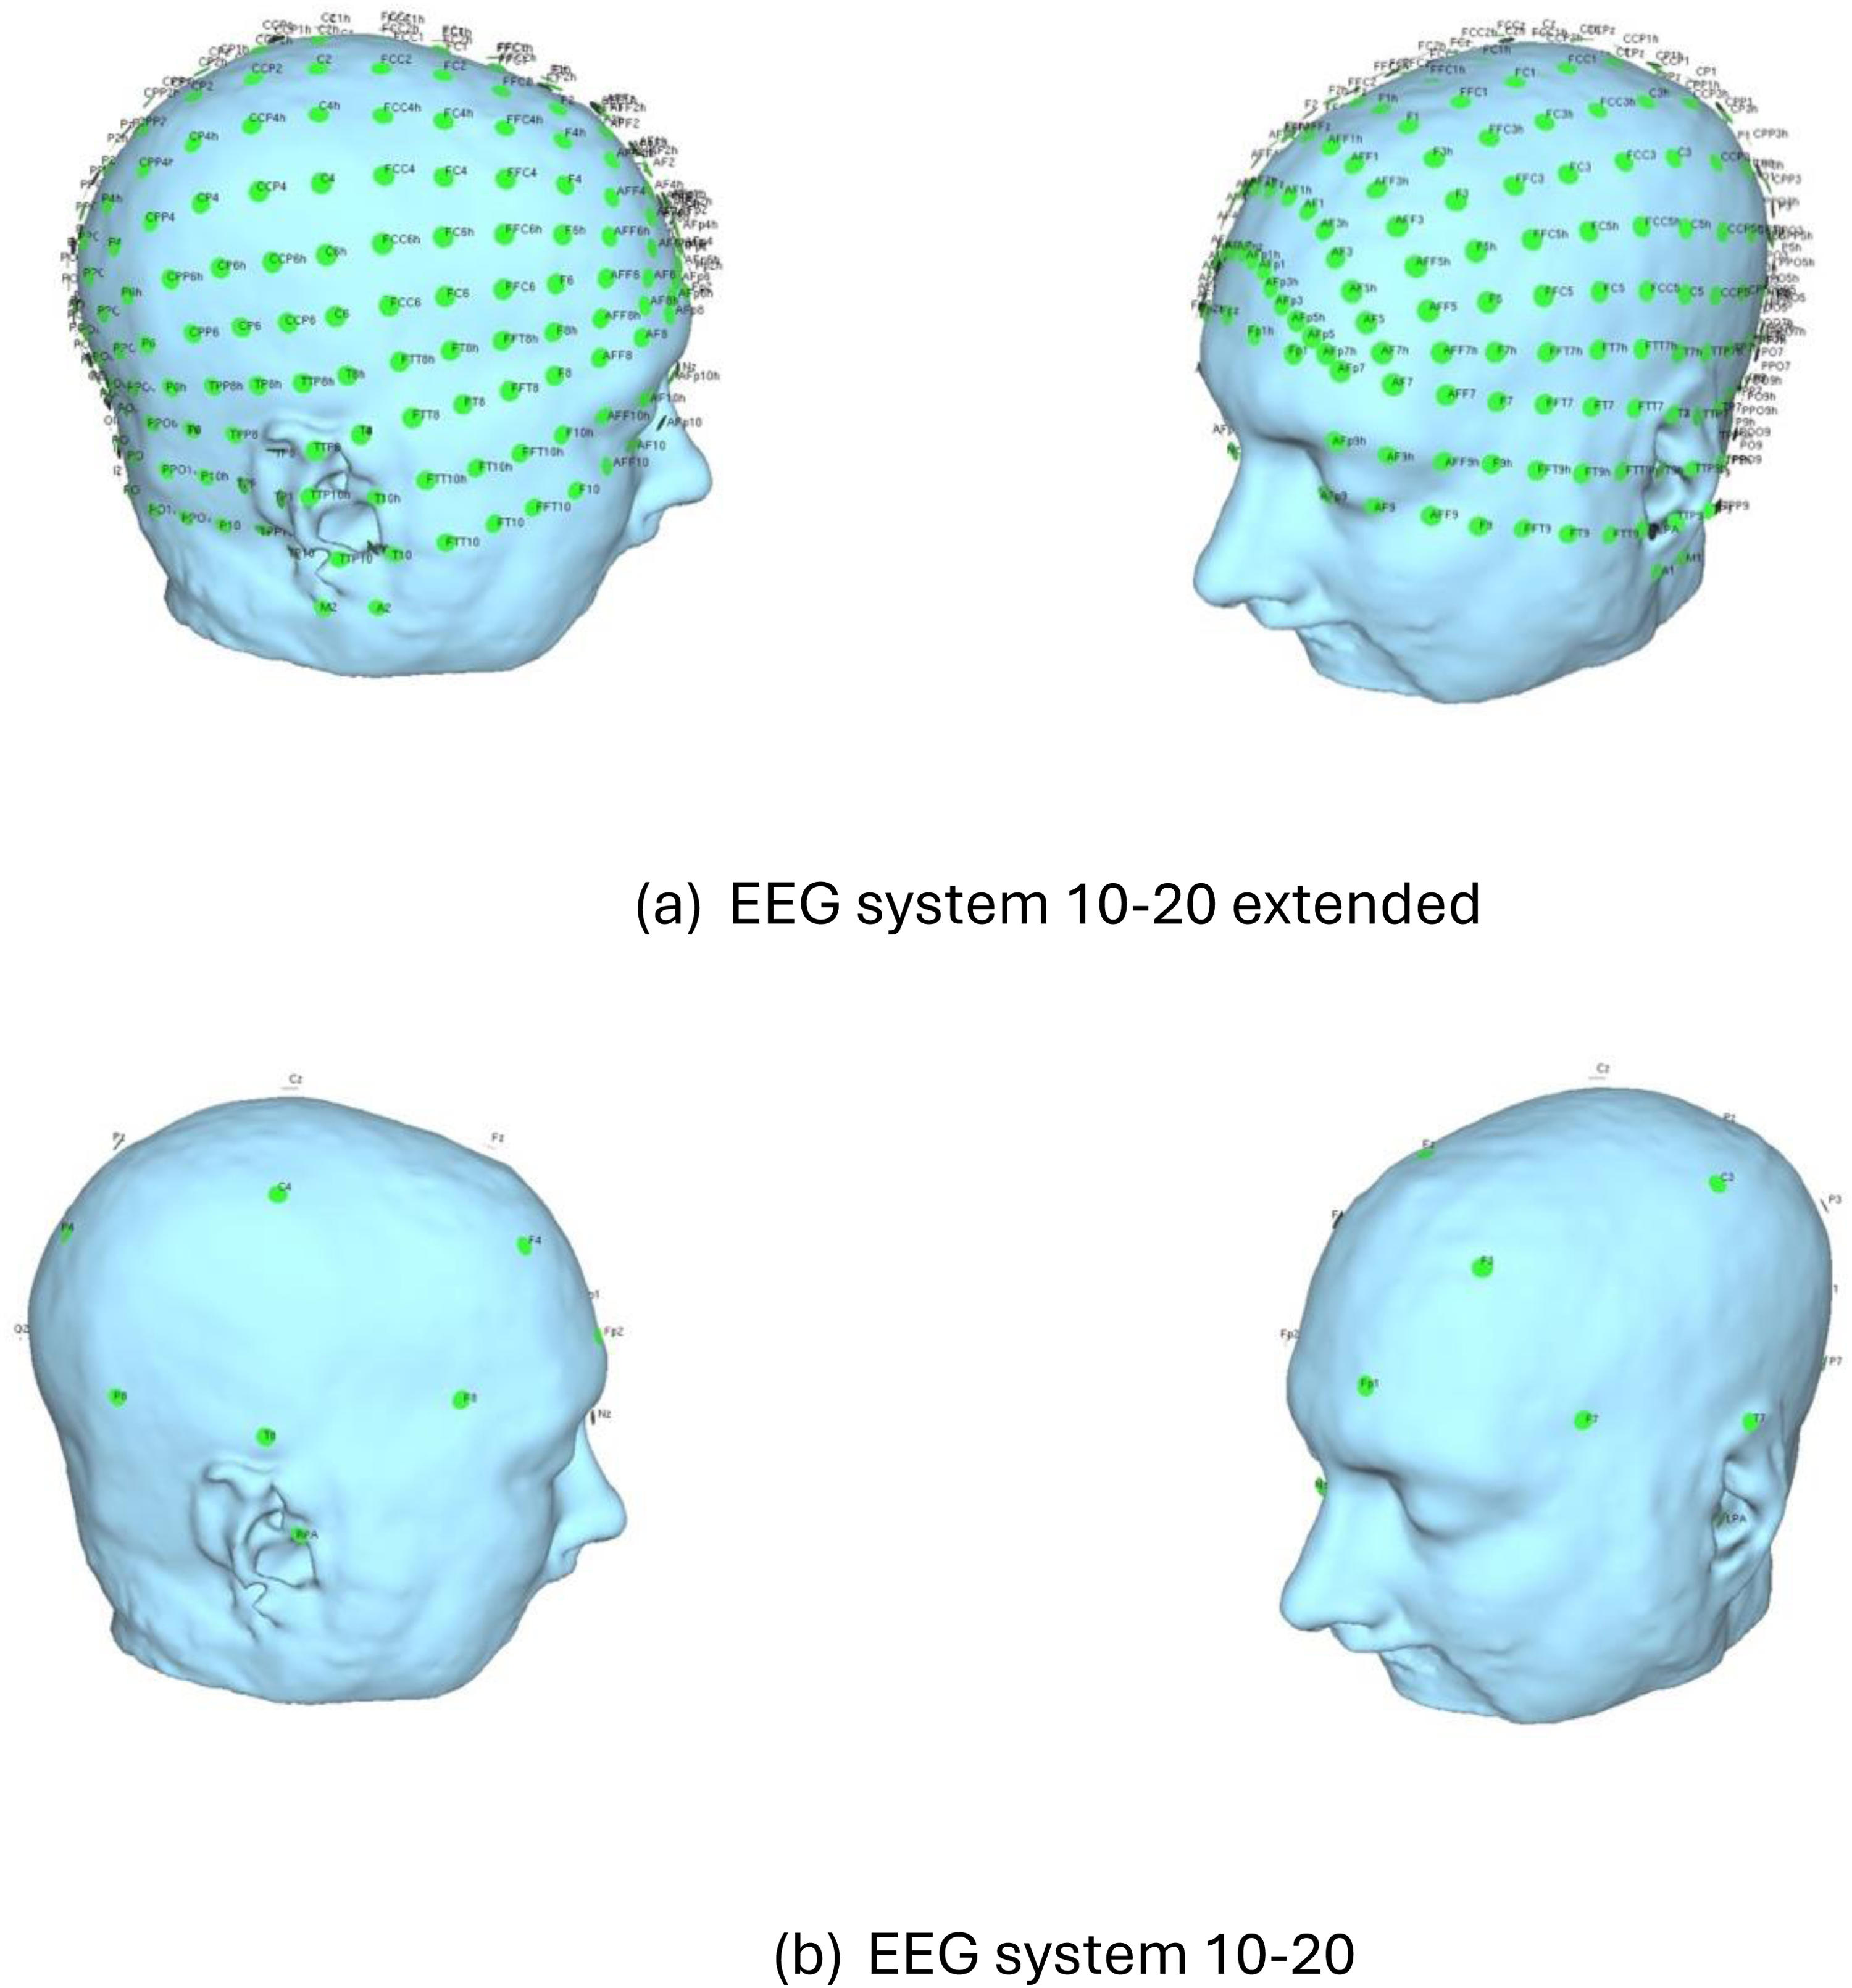
Comparison between the standard and extended EEG 10–20 systems.
The aggregation process involved identifying all coordinates within a 20 mm radius of each standard EEG location (Supplemental Table 1), and computing average electric field values for these grouped coordinates to obtain a single value representing each region. Initial experiments with a 30 mm radius suggested that a tighter 20 mm radius provided superior predictive performance, striking an optimal balance between model complexity and accuracy.
Clinical response evaluation
To systematically evaluate the clinical effects of each stimulation, patients were assessed before and after each session.11,21
The clinical variables can be categorized as follows:
The first set consisted of eight tasks designed to identify the general state of the patient before and after the stimulation phase. These tests included: ‘Words per minute’, ‘Naming accuracy’, ‘Naming latency’, ‘Dysdiadochokinesia’, ‘Reading accuracy’, ‘Reading efficiency’, ‘Words repetition’, and ‘Clinical impression of change’. For a deeper understanding of those tests, we recommend reviewing our previous research article.
13
The second set of clinical variables was derived from a comprehensive analysis of spontaneous language (Supplemental Table 2).
It is important to note that even though we got data from 49 different assessments, we did not use all of them in our modeling phase. From the first set, we selected ‘Words per minute’ and ‘Clinical impression of change’ to further analyze as they were the most relevant language assessments extracted from our previous analysis.11,13
To manage the complexity of the second set of language assessments, we applied principal component analysis (PCA) to reduce dimensionality. This process yielded six latent variables that captured over 70% of the total variance in the original dataset. To facilitate this reduction, we categorized the assessments into two groups based on how improvement was defined: assessments where improvement was indicated by an increase in the post-treatment score (e.g., more correct responses), and those where improvement was indicated by a decrease in the score (e.g., shorter completion time). Table 2 provides a detailed breakdown of this classification. PCA was performed separately on each group, extracting two principal components from the ‘improvement-as-increase’ group (‘Increase_component1’ and ‘Increase_component2’) and four components from the ‘improvement-as-decrease’ group (‘Decrease_component1’, ‘Decrease_component2’, ‘Decrease_component3’ and ‘Decrease_component4’).
Selected performance metrics for evaluating model efficacy.

Feature selection
With a dataset resulting in 340 features from an extensive feature generation phase, the challenge of dimensionality became apparent, especially given the limited sample size of our patient cohort. To streamline the feature set for effective modeling, we implemented a feature selection phase, focusing on reducing the feature space to a manageable number without sacrificing predictive power.
The technique of choice for this critical step was Recursive Feature Elimination (RFE). RFE operates by iteratively fitting a specified estimator to the data—here, we utilized a Decision Tree as our estimator—and pruning the least significant features step-by-step. The process begins with the full set of features, ranking them by importance, and systematically removing the least important ones. This iterative refinement continues until the designated number of features, 20 in our case, remains.
By integrating RFE into our methodology, we ensured that our final model was both efficient and robust, capable of gleaning significant insights from a refined subset of features meticulously chosen to represent the complexity of patient responses to treatment.
Modeling
Our study employed a targeted modeling strategy, focusing on predicting patient improvements based solely on pre-rTMS data. The hypothesis driving this approach was that baseline patient characteristics could serve as reliable predictors of treatment outcomes, measured as changes in language assessments. To test this, we developed four distinct modeling approaches, as referenced on Figure 4, each utilizing different sets of input features:

Illustration of the input data, set of features generated and ML models launched.
Additionally, all models included the targeted stimulation area as an input feature to indicate which brain region was stimulated.
Each model was designed to predict binary treatment outcomes based on clinical improvement. Post-rTMS clinical targets were converted into binary outcomes by comparing pre- and post-treatment scores. The direction of improvement depended on the specific assessment: for some measures (e.g., number of correct words), a higher post-treatment score indicated improvement, while for others (e.g., total pause time), a lower score reflected better performance (reference to Table 2). A relative improvement of 10% or more from baseline was classified as a positive response (assigned a value of 1), whereas smaller improvements or declines were labeled as non-responders (assigned a value of 0).
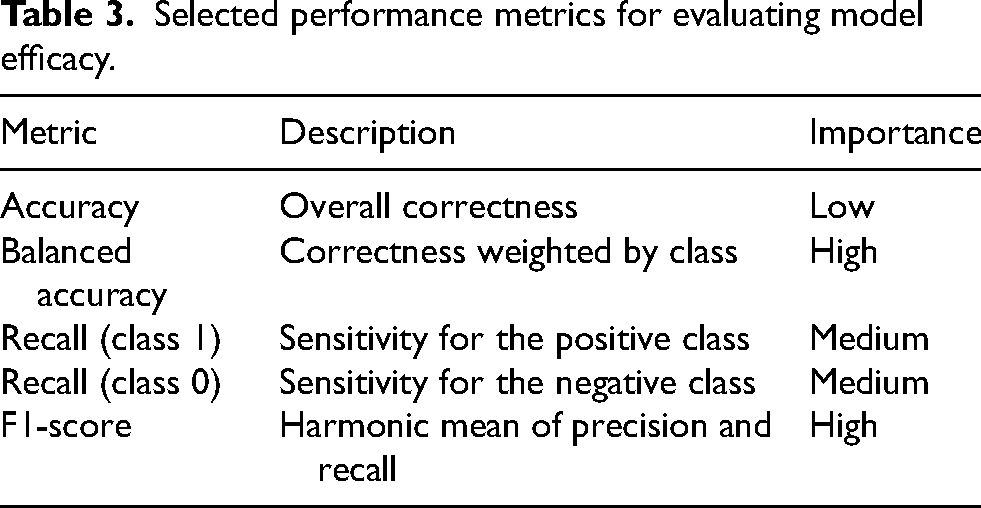
We tested four ML algorithms for each model: Logistic Regression, Decision Tree, Random Forest, and k-Nearest Neighbors (kNN). Performance metrics included accuracy, balanced accuracy, recall, and F1-score, with particular emphasis on balanced accuracy and F1-score to address class imbalances, as shown in Table 3.
Selected performance metrics for evaluating model efficacy.
Performance of socio-demographic model.
Performance of EEG model.
Performance of SimNIBS based model.
Considering the constrained size of our dataset, dividing it into conventional training, testing, and validation subsets would likely diminish their respective sizes, thereby risking skewed evaluations of model performance. To circumvent this issue and ensure robust assessment, we implemented a stratified 10-fold cross-validation technique. This method allowed us to preserve the integrity of performance evaluations by systematically rotating the dataset through a series of train-test splits. Performance metrics were then reliably computed by averaging the outcomes across all iterations within each fold, thereby maximizing the use of available data while minimizing potential biases. This stratified approach not only enhanced the validity of our model assessment but also provided a comprehensive view of model performance across various subsets of our data, reflecting a more accurate estimation of how our models would perform in real-world scenarios.
Ultimately, 96 models were developed across four sets of features and four different ML models, allowing us to evaluate the predictive power of various patient characteristics and clinical assessments in response to rTMS.
Technically, all the processing and modeling was implemented in Python, version 3.9.7, and mainly using the frameworks ‘scikit-learn’, version 1.6.1, ‘pandas’, version 2.2.3, and ‘numpy’, version 1.26.4.
Results
Socio-demographic model
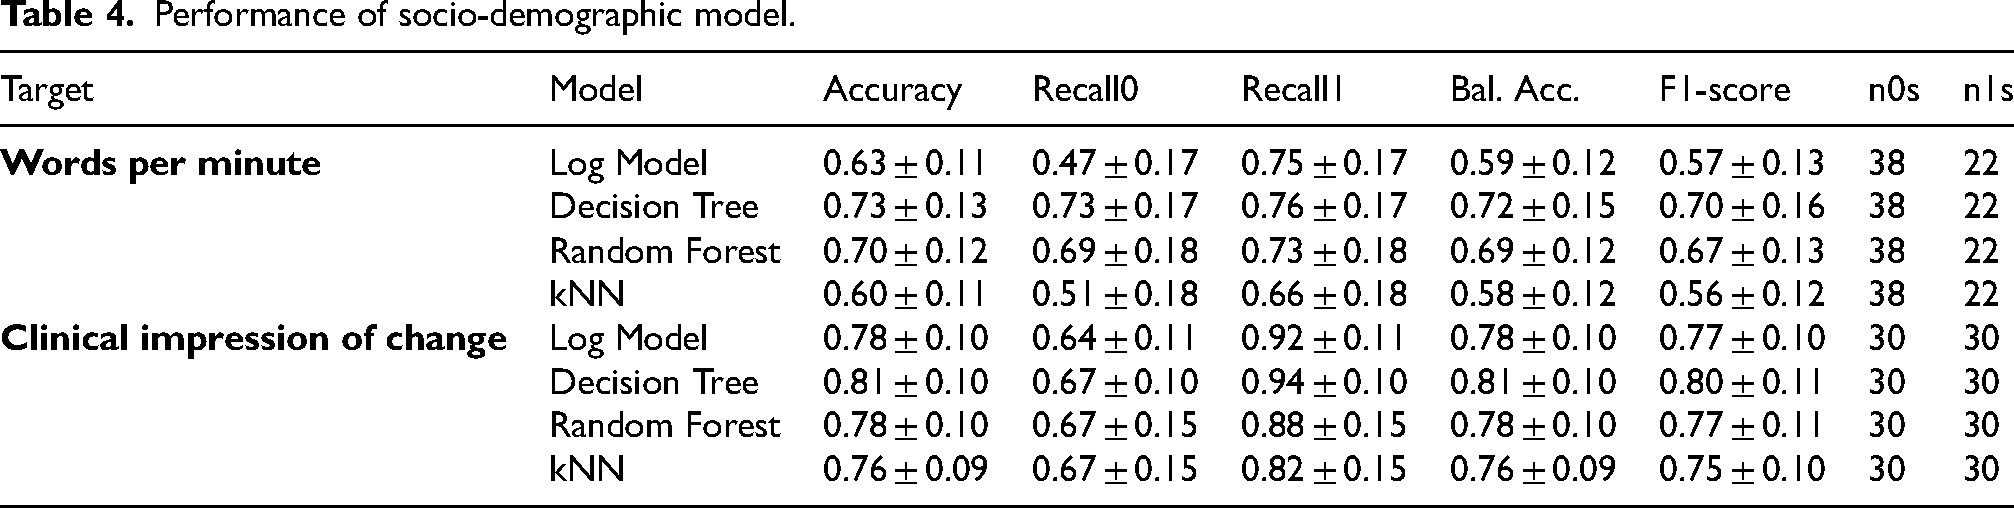
The model using ‘Words per minute’ as the target variable achieved its highest F1-score of 0.70 with the Decision Tree algorithm, while the lowest score was observed with the kNN model, closely followed by Logistic Regression. For the model targeting ‘Clinical impression of change’, the best F1-score reached 0.80, again with the Decision Tree. In this case, however, the performance across different ML models was more consistent, suggesting stronger predictive reliability for this target (Table 4).
When using the second set of variables (as presented in Supplemental Table 3), the model achieved notably high F1-scores for ‘Increase_component1’, ‘Decrease_component1’, and ‘Decrease_component3’, each reaching a peak value of 0.81. While other variables also yielded good results, their overall contribution was less significant. Among the machine learning models tested, Random Forest and Decision Tree consistently delivered the best performance.
EEG model
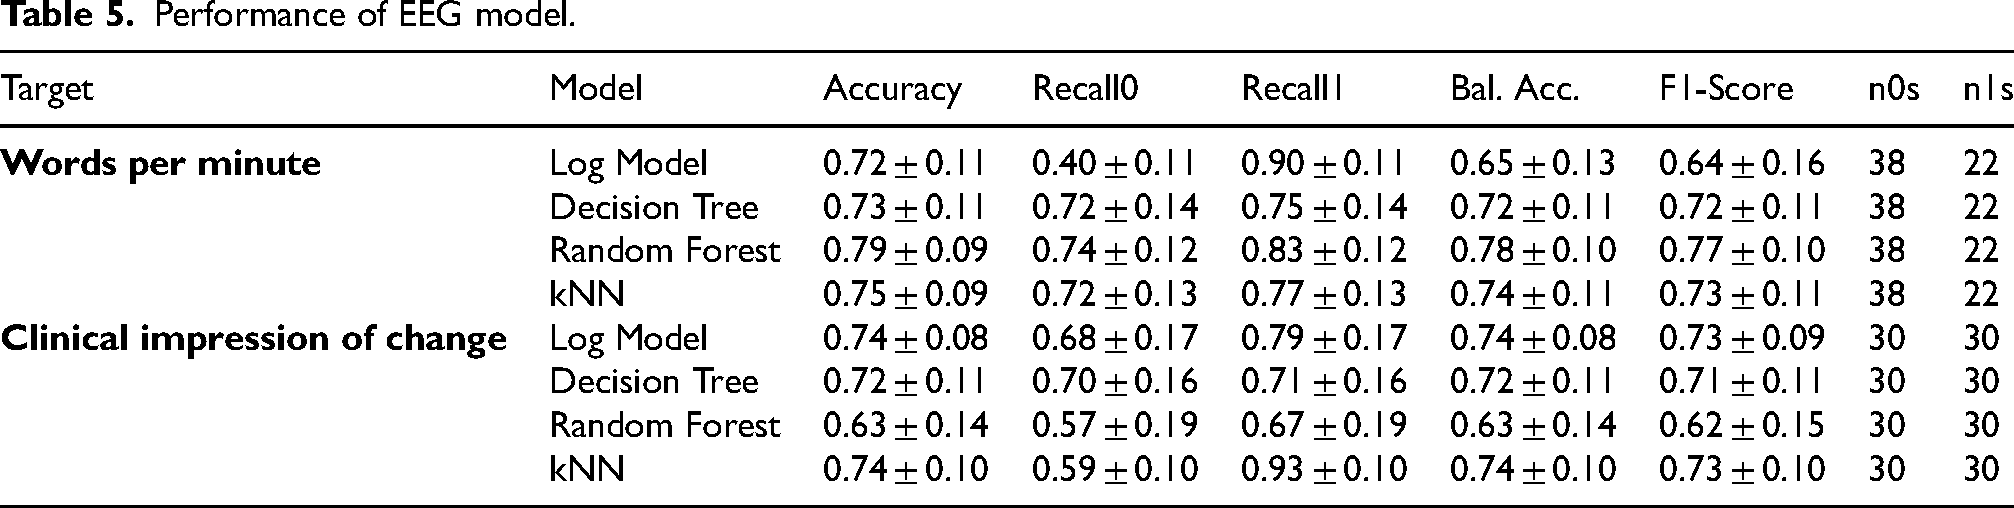
EEG-based models demonstrated robust predictive performance across the main clinical targets. The target ‘Words per minute’ reached an F1-score of 0.77 using the Random Forest model, while ‘Clinical impression of change’ achieved an F1-score of 0.73 with both the kNN and Logistic Regression models (Table 5).
When we expanded the input features with additional clinical evaluation variables (Supplemental Table 4), the model outperformed the socio-demographic version. Notable results include an F1-score of 0.89 for ‘Increase_component1’, an exceptional 0.92 for ‘Decrease_component1’, and 0.86 for ‘Decrease_component3’ - the same components highlighted previously in the socio-demographic model, but with significantly improved scores.
In terms of feature importance, most of the influential variables were derived from graph theory, reinforcing the significance of EEG connectivity patterns in predicting clinical outcomes.
SimNIBS model
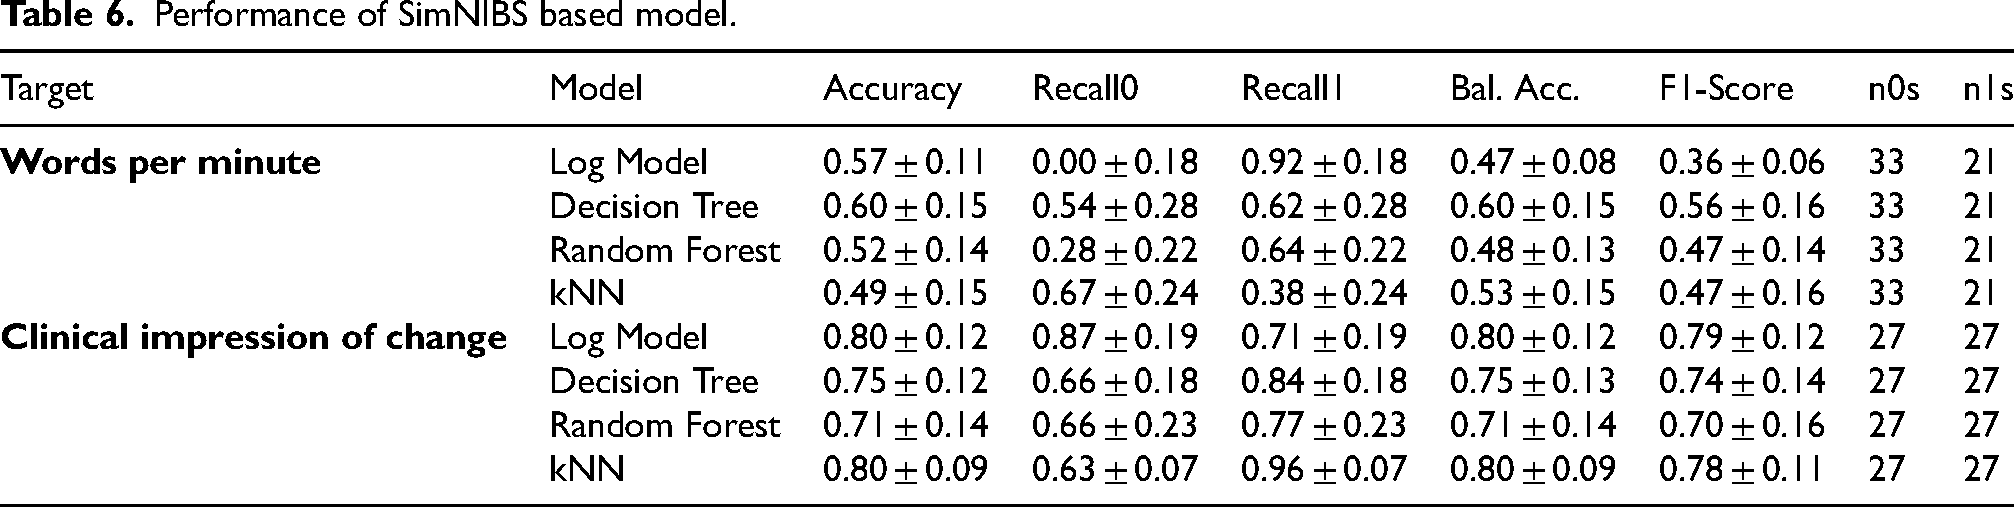
When focusing on the model based solely on SimNIBS-extracted features, we observed a general decline in predictive performance compared to the previous models based on socio-demographic and EEG features.
Despite the overall drop, the model still showed moderate performance. The target ‘Words per minute’ reached an F1-score of 0.56, representing a 27.3% decrease relative to the EEG-based model. In contrast, the model performed relatively well for ‘Clinical impression of change’, achieving an F1-score of 0.79 (Table 6).
Analysis of the extended variable set (Supplemental Table 5) revealed consistently lower performance across all components when compared to previous models. The highest F1-scores were observed for ‘Decrease_component4’ (0.57), ‘Increase_component1’ (0.56), and ‘Increase_component2’ (0.55)—values that, while modest, still represent the model's best outcomes within this feature set.
As in previous models, the most influential features were localized around the P7, T7, and C3 brain regions, suggesting these areas play a consistent role in predicting outcomes.
Full model
Our augmented model, enriched with all extracted features, maintains or increases the predictive power, as delineated in Table 7. Specifically, the variable ‘Words per minute’ reached an F1-score of 0.76 using the Logistic Regression model, while ‘Clinical impression of change’ achieved an F1-score of 0.78 with the kNN model.
Performance of full-feature model.
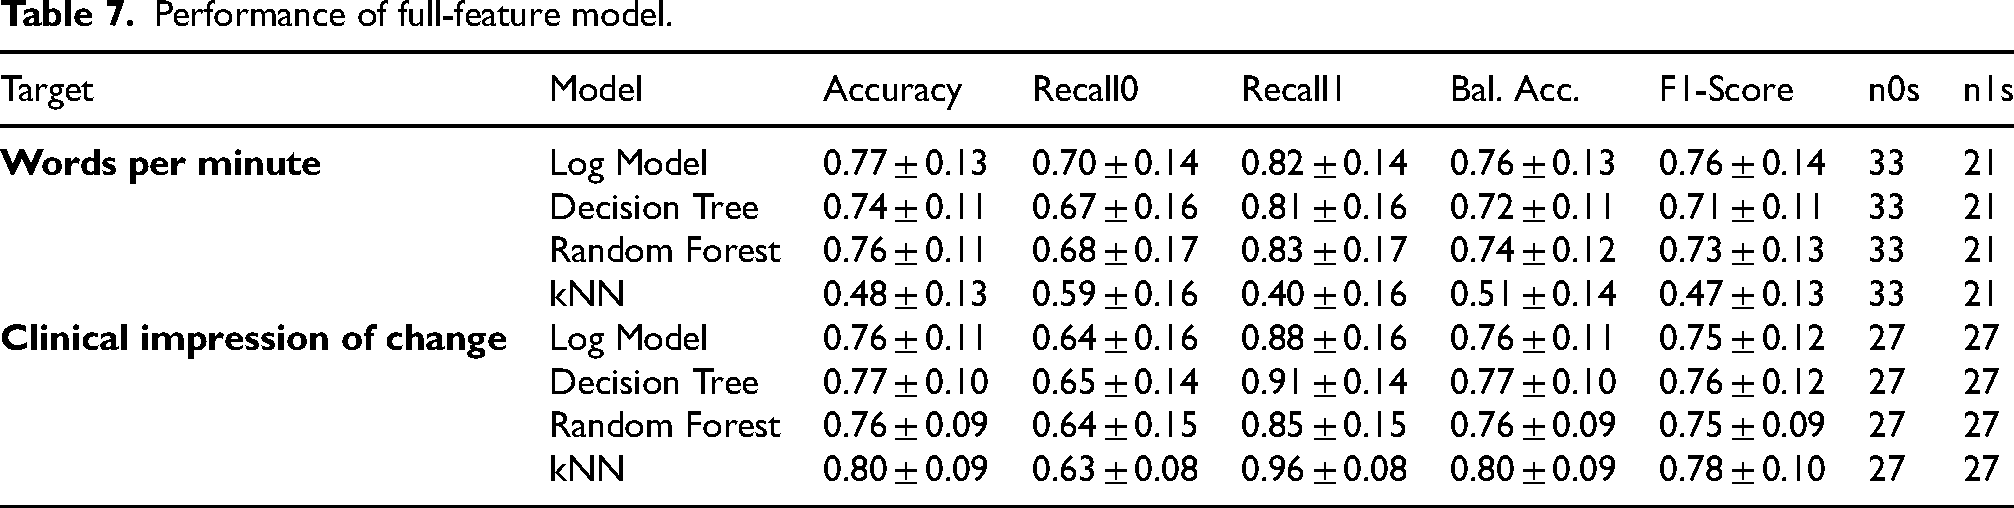
These results are consistent with the performance trends observed in the previously evaluated individual models. As shown in Figure 5, all four machine learning models yielded equal or improved performance for the ‘Words per minute’ clinical target when using the full set of features, compared to models trained on more limited feature subsets. Similarly, Figure 6 illustrates the outcomes for ‘Clinical impression of change’, revealing a comparable pattern. The enhanced performance of the all-features models likely stems from their ability to leverage a more comprehensive representation of the dataset, integrating diverse sources of information for improved predictive accuracy.

Results on words per minute target.
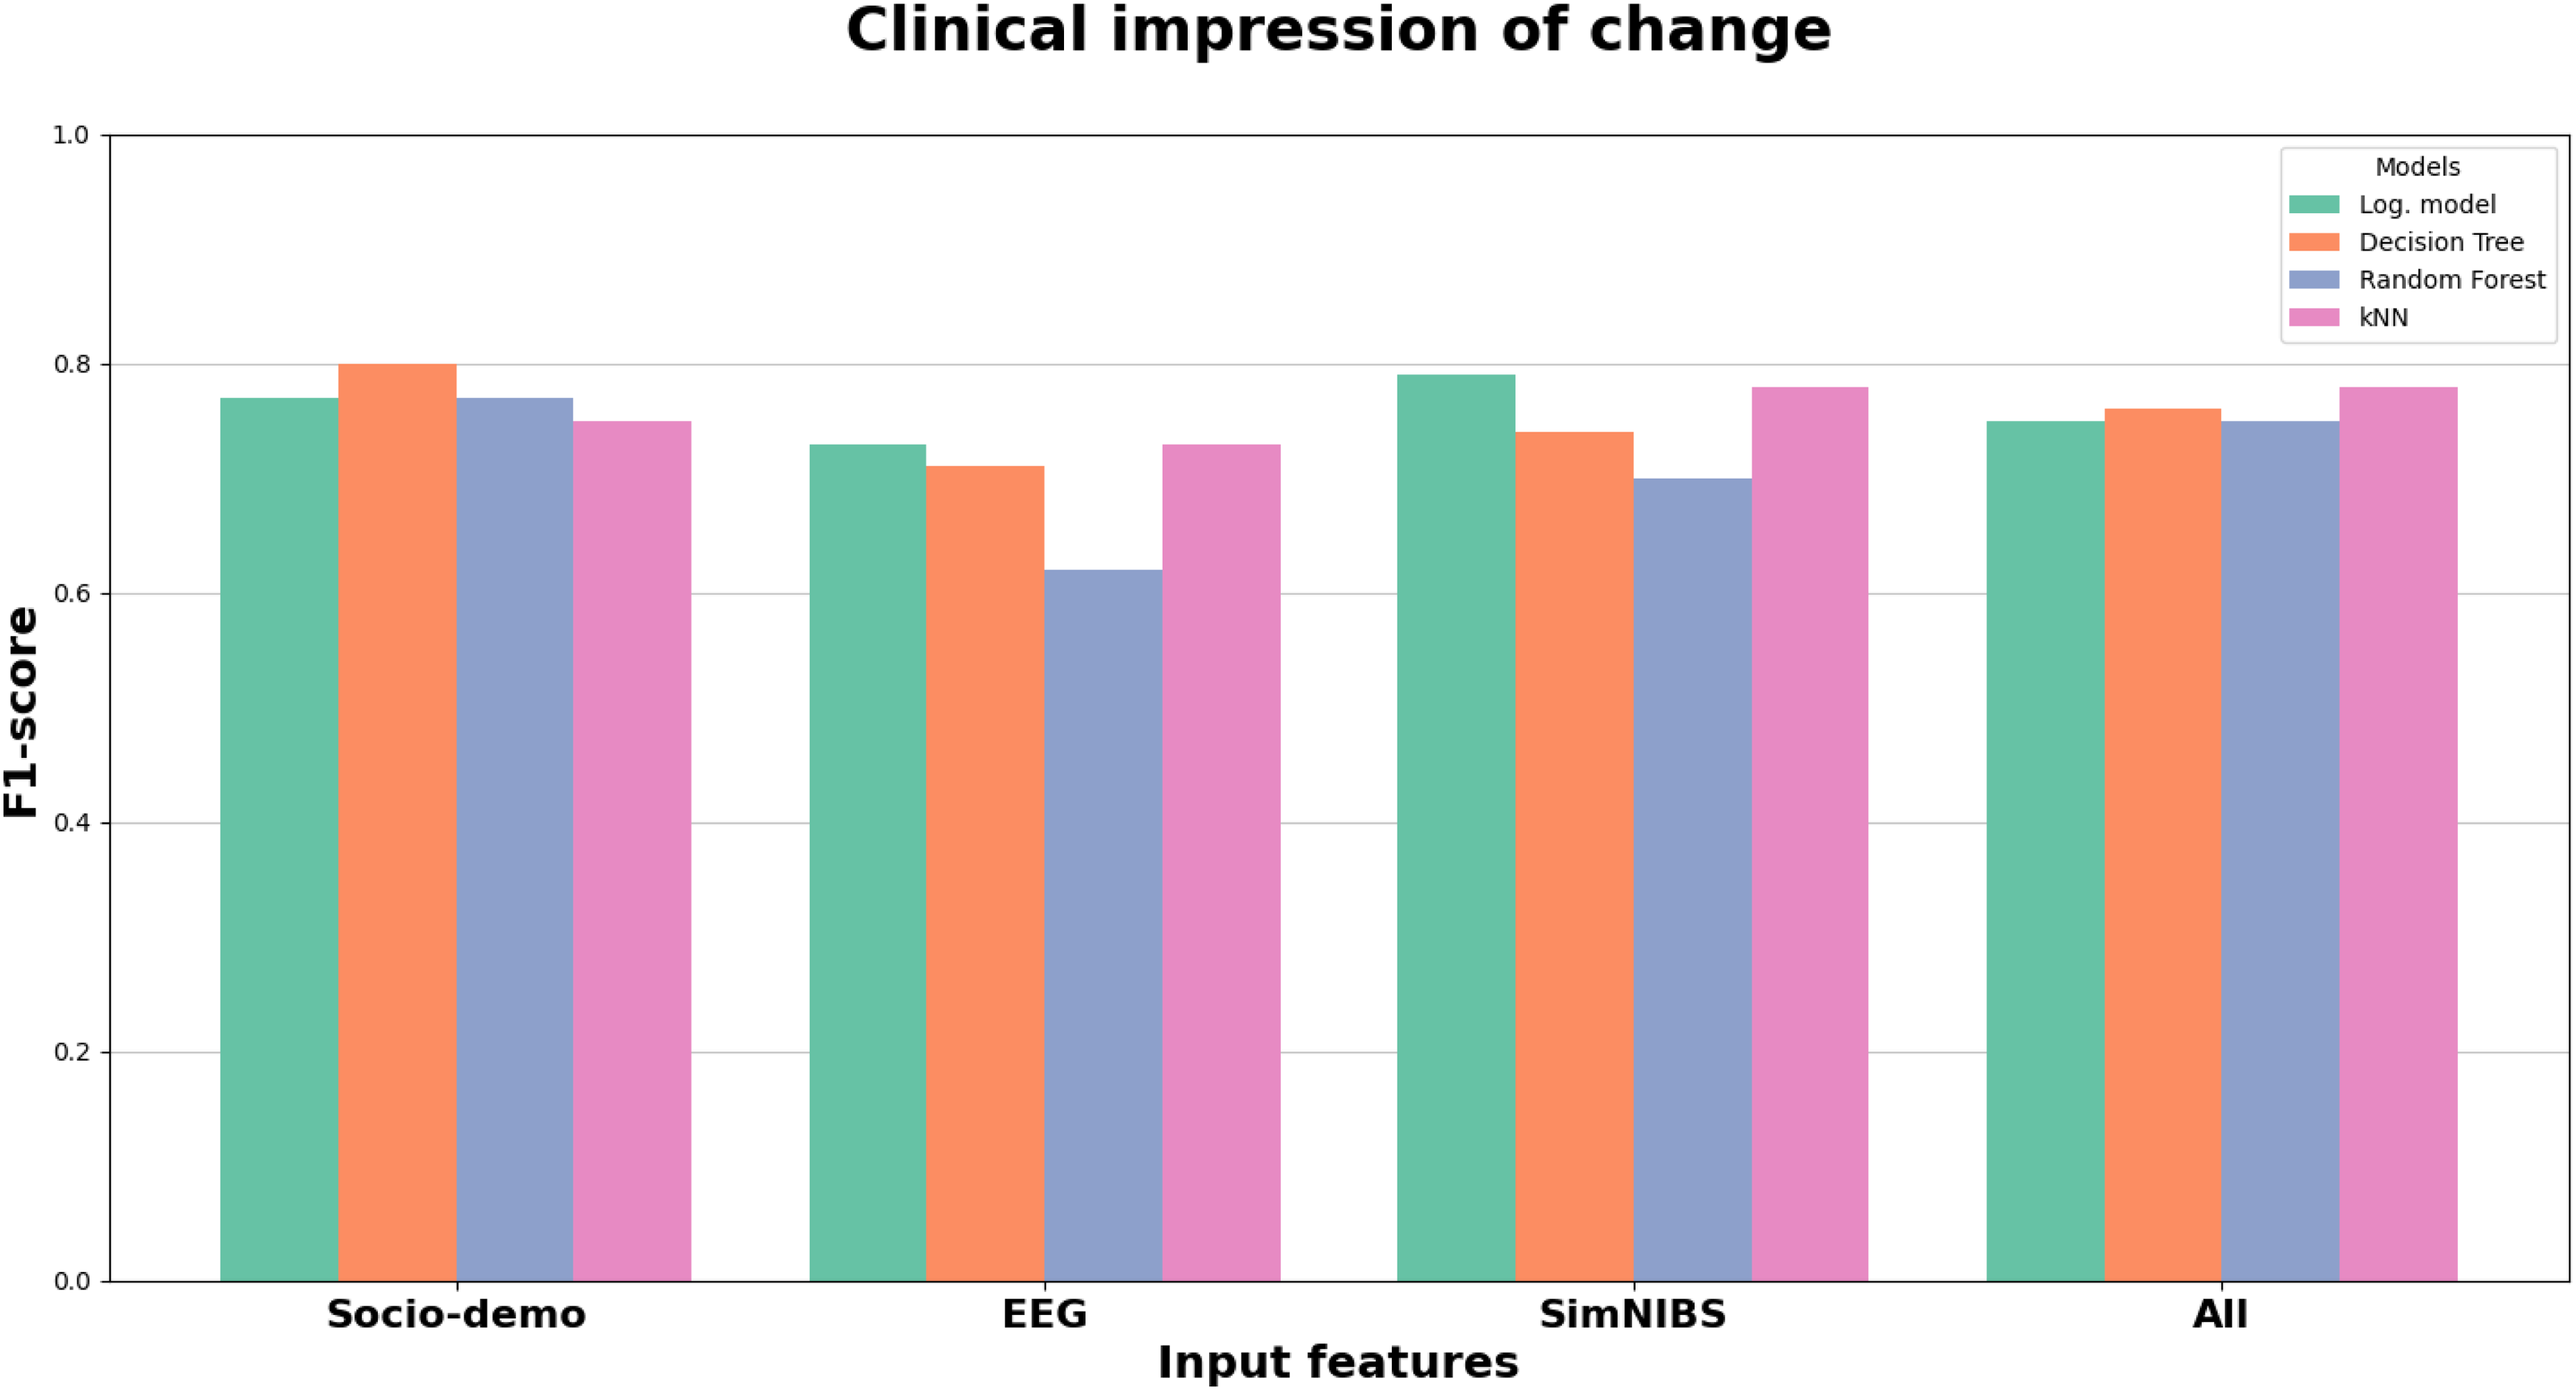
Results on clinical impression of change target.
The extended set of clinical variables, presented in Supplemental Table 6, reinforces the relevance of components such as ‘Increase_component1’, ‘Decrease_component1’, and ‘Decrease_component3’, all of which achieved high F1-scores comparable to the top-performing models previously tested. Interestingly, components that had lower predictive value in earlier models—such as ‘Increase_component2’ and ‘Decrease_component4’—now showed improved F1-scores, with ‘Increase_component2’ reaching 0.73 and ‘Decrease_component4’ reaching 0.67. This indicates that incorporating features from multiple domains can enhance the contribution of previously underperforming variables.
Discussion
In this study, we aimed to develop ML algorithms to predict the response to single-session rTMS in patients with PPA with non-fluent and semantic variants. Due to the differences in the clinical and language characteristics of patients with nfvPPA and svPPA, we based our analysis in predicting changes in two different kind of variables common to both PPA subtypes. On the one side, the clinical impression of change, reflecting the view of the caregivers after brain stimulation. And, on the other side, several variables evaluating semi-spontaneous speech, because this is a sensitive measure to the changes in all aphasia subtypes.
One of the main difficulties of the study was that we developed models to predict changes after only one single session of rTMS. Although we used variables previously showing statistically significant changes in Pytel et al., 11 the magnitude of the change and the variability of language assessments across sessions jeopardize the development of robust algorithms. Despite this, several algorithms obtained good and consistent levels of accuracy. It is worth mentioning that clinical impression of change was predicted with good accuracy. This finding could indirectly support the use of this type of scales and other outcomes based on patient and caregiver's views. Furthermore, the models were better when using a comprehensive analysis of spontaneous speech compared with only ‘Words per minute’. This suggests that a complete analysis is necessary to capture changes in language in PPA.
Regarding the different strategies used on input features, from the results of socio-demographic model we can remark the efficacy of leveraging these features in predicting rTMS treatment outcomes, achieving comparable performance to EEG-based models. The high F1-scores of the leading models suggest significant potential for employing such predictive models in clinical settings, offering a data-driven approach to optimizing patient care in the context of rTMS therapy. However, it is important to acknowledge the limitations of the socio-demographic model. The model relies solely on basic demographic information, which may not capture the full complexity of patient variability and response to rTMS. Additionally, the relatively small number of features used in this model limits its predictive power compared to more comprehensive models that include clinical data and biomarkers.
From the results of EEG based model, we may extrapolate the existence of a relationship between EEG signals and clinical responses to rTMS. This relationship may offer insights into the neural mechanisms underlying treatment efficacy. EEG features can reflect various aspects of brain activity, such as connectivity, oscillatory patterns, and neural synchrony, which are potentially influenced by rTMS. By identifying EEG biomarkers that correlate with clinical improvements, we could better understand how rTMS modulates brain function and tailor treatments to individual patients’ neural profiles. This approach not only improves predictive accuracy but also enhances our understanding of the neurophysiological basis of rTMS efficacy.
In the specific case of SimNIBS model, we detected that SimNIBS features alone may not be as robust as socio-demographic or EEG features in predicting rTMS outcomes, but they still provide valuable insights. Interestingly, when all features were combined, the model showed slight improvement in its metrics, suggesting that they provide distinct patient information from varying perspectives.
Our study has several limitations. First, we did not include patients with lvPPA and, thus, our results should be limited to the variants associated with frontotemporal degeneration. Second, the prediction was limited to evaluate the change after a single session of rTMS. Studies to determine whether the response to one single session is predictive of the response to a complete treatment including multiple rTMS sessions are necessary. Third, the sample size was relatively low due to the reduced incidence of the disease. However, this study represents a pilot initiative on the feasibility of predicting responses to rTMS, which can subsequently be extended to larger samples and longer follow-up periods. The development of models capable of predicting long-term outcomes, such as those observed in a recent six-month clinical trial, 22 remains of particular interest. Lastly, we only optimized one rTMS parameter, the stimulation target area. Due to the lack of patient data with varied stimulation configurations, we were unable to assess the impact of other parameters. However, the same predictive pipeline could be applied to more diverse datasets to allow a wider optimization of rTMS protocols.
In conclusion, this study demonstrates that changes following rTMS in PPA may be predicted primarily on the basis of clinical-demographic and EEG variables, and to a lesser extent by electric field models. The ability to predict changes after a single session opens the possibility of adaptive interventions, whereby stimulation parameters can be modified according to the observed and expected response, ultimately optimizing TMS treatment.
Supplemental Material
sj-docx-1-alr-10.1177_25424823261420785 - Supplemental material for Prediction of clinical and language changes after a single session of repetitive transcranial magnetic stimulation in primary progressive aphasia: A machine learning approach
Supplemental material, sj-docx-1-alr-10.1177_25424823261420785 for Prediction of clinical and language changes after a single session of repetitive transcranial magnetic stimulation in primary progressive aphasia: A machine learning approach by Carlos Moral Rubio, Lucía Fernández-Romero, Paloma Balugo, Adela Fraile-Pereda, Paz Suárez-Coalla, Maria Nieves Cabrera-Martin, Miguel Yus-Fuertes, Jordi A. Matias-Guiu and José L. Ayala in Journal of Alzheimer's Disease Reports
Footnotes
Acknowledgements
We are grateful to all the participants and their caregivers for their interest in our study.
Ethical considerations
The study was conducted with approval from the institutional review board (IRB).
Consent to participate
Written informed consent was obtained from all participants.
Consent for publication
Not applicable
Author contribution(s)
Funding
Jordi A. Matias-Guiu is supported by Instituto de Salud Carlos III through the project INT20/00079 and INT23/00017 (co-funded by the European Union).
Declaration of conflicting interests
The authors declared no potential conflicts of interest with respect to the research, authorship, and/or publication of this article.
Data availability statement
The datasets generated during and/or analyzed during the current study are available from the corresponding author on request.
Supplemental material
Supplemental material for this article is available online.
References
Supplementary Material
Please find the following supplemental material available below.
For Open Access articles published under a Creative Commons License, all supplemental material carries the same license as the article it is associated with.
For non-Open Access articles published, all supplemental material carries a non-exclusive license, and permission requests for re-use of supplemental material or any part of supplemental material shall be sent directly to the copyright owner as specified in the copyright notice associated with the article.