
Abstract
Background
Alzheimer's disease (AD) is a highly prevalent neurodegenerative disorder. Accumulating evidence suggests that short-chain fatty acids (SCFAs) can regulate the central nervous system, thereby affecting cognitive and behavior function.
Objective
This study aimed to investigate the association between the AD development and SCFA metabolism via bioinformatic analysis.
Methods
Gene expression profiles were obtained from the GEO database. 1243 genes related to SCFA were screened from Genecards database. Through weighted gene co-expression network analysis (WGCNA) and differential analysis, 10 SCFA hub genes were screened. Machine learning algorithms, including support vector machine recursive feature elimination (SVM-RFE) and least absolute shrinkage and selection operator (LASSO) regression models, were used to identify candidate biomarkers. The CIBERSORT algorithm was utilized to evaluate the infiltration of immune cells and its relationship with the potential biomarkers. The candidate biomarker chemicals were identified in the Comparative Toxicogenomics Database as underlying targeted drugs for treating AD.
Results
Five genes—EZR, SNCA, GFAP, NFKBIA, and SST—were identified as potential biomarkers for AD through LASSO and SVM-RFE analyses. These genes can also be used to predict the risk of AD and have good diagnostic effects. The candidate biomarkers are associated with plasma cells, activated dendritic cells, M1 macrophages and resting natural killer cells. Notably, valproic acid and tretinoin were found to target these candidate genes, suggesting a new treatment approach for AD.
Conclusions
This study identified EZR, SNCA, GFAP, NFKBIA, and SST as potential key SCFA-related genes associated with the progression of AD, providing new insights into the prevention and treatment of AD.
Introduction
Alzheimer's disease (AD) is the most common type of dementia, which today impacts in excess of 30 million people globally. 1 AD pathology is characterized by the extracellular accumulation of amyloid-β (Aβ) plaques and the intracellular accumulation of hyperphosphorylated tau as neurofibrillary tangles.2,3 The development of AD involves multiple risk factors, including genetic factors, neuroinflammation, immune dysregulation, aging, lifestyle, and environment. 4
Despite extensive research, the exact cause of AD remains unclear. This uncertainty is a major challenge to the development of effective treatments, highlighting the urgent need for a comprehensive and multidimensional strategy to tackle the disease.
The gut microbiota is comprised of a sophisticated community of microorganisms in the gastrointestinal ecosystem, including viruses, fungi, and bacteria, collectively encoding more than 3 million genes and producing multiple metabolites. 5 Recent studies have found a correlation between AD and the gut microbiota. The gut microbiota actively affects brain function through the gut–brain axis. 6 Studies have demonstrated remarkable differences in the composition of the gut microbiota between patients with AD and healthy controls. 7 Moreover, transplanting the gut microbiota from healthy mice into AD model mice improved cognitive dysfunction and reduced pathological changes. 8 The gut microbiota constitutes an important environmental factor for immune cells, particularly for microglia in the central nervous system (CNS) of the host. 9 Dysbiosis of the gut microbiota disrupts the integrity of the intestinal barrier, leading to the release of pro-inflammatory cytokines into blood circulation, which in turn promotes neuroinflammation in the brain.10,11 In conclusion, it is crucial to explore the influence of gut microbiota on the development of AD in order to better understand the causes of the disease and explore novel treatment strategies.
Through the generation and release of metabolites and neurotransmitters, including dopamine and short-chain fatty acids (SCFAs), the gut microbiota can affect the brain functions. 12 SCFAs are the most prevalent metabolites. SCFAs refer to a group of with carbon chain lengths that usually do not exceed six carbon atoms, including butyric acid, propionic acid and acetic acid.13,14 Research has revealed that SCFAs can cross the blood-brain barrier. 15 SCFAs can provoke extensive influences on CNS function, such as alterations in neurotransmitter production, mitochondrial function, immune activation, lipid metabolism, and gene expression.16,17 The biological effects of SCFAs are mainly achieved by binding to G protein-coupled receptors and inhibiting histone deacetylation. 18 By regulating tau pathology, neuroinflammation, and Aβ deposition, SCFAs participate in the pathogenesis of AD. Propionate has been reported to maintain neuronal mitochondrial division and autophagy homeostasis during AD pathologic process via GPR41 and GPR43. 19 Acetate's capacity to prevent microglial phagocytosis has a modifying effect on the progression of neurodegeneration. 20 SCFAs derived from the gut microbiota are pivotal in the microbiota-gut-brain axis and are considered potential therapeutic targets for AD. However, their clinical application requires further investigation.
The present study sought to investigate the effects of SCFAs on AD. This study utilized public datasets to identify five SCFA-associated genes linked to AD progression through integrated bioinformatics analysis and machine learning approaches. Furthermore, immune infiltration analysis was conducted to evaluate the correlation between these genes and immune cells in AD samples. Gene Set Enrichment Analysis (GSEA) was employed to investigate the potential biological functions of the five identified genes. Additionally, the Comparative Toxicogenomics Database (CTD) was leveraged to predict potential therapeutic drugs targeting these genes. This work offers new insights into the connection between AD and the gut microbiota, along with potential new treatment options for disorders of the CNS.
Methods
Data collection
First, “acetic acid, butyrate, propionic acid, and short-chain fatty acids” were utilized as search terms to recognize genes associated with SCFA metabolism from the GeneCard database (https://www.genecards.org/). The intersection of 4 gene sets is taken, and 1243 genes were identified. Five AD microarray datasets (including GSE132903, GSE5281, GSE28146, GSE1297, and GSE122063) along with corresponding patient clinical information were downloaded from the GEO database. GSE132903 includes 97 AD samples and 98 non-demented (ND) samples as the training set. GSE5281 includes 74 ND and 87 AD samples. GSE122063 is comprised of 44 ND and 56 AD samples. GSE28146 is comprised of 8 ND and 22 AD samples. GSE1297 is comprised of 9 ND and 22 AD samples. Four datasets (GSE5281, GSE28146, GSE1297, and GSE122063) were pooled into a combined validation set, comprising 187 AD patients and 135 control samples.
Weighted correlation network analysis (WGCNA)
Establishing the scale-free co-expression network was carried out with the WGCNA package. 21 To enhance the accuracy of the results, the top 25% of high-variance genes were selected from the data set as input data. The optimal soft threshold was selected to transform the correlation matrix into an adjacency matrix, from which the topology overlap matrix was subsequently constructed. Gene modules with more than 30 genes were identified through hierarchical clustering, and the relationship between the disease and module eigengenes was examined through Pearson's correlation coefficient.
Identification of SCFA-related hub gene
The “Limma” R package was applied to identify differentially expressed genes (DEGs) from the GSE132903 dataset, with p < 0.05 and |log2 fold change (FC)| > 0.7 serving as the selection criteria. This relatively lenient threshold was used to identify more potentially promising results. 22 The DEGs were intersected with genes within the key gene module and 1243 SCFA metabolism-related genes to identify SCFA-associated DEGs. Subsequently, the Least Absolute Shrinkage and Selection Operator (LASSO) and Support Vector Machine-Recursive Feature Elimination (SVM-RFE) algorithms were employed to further identify hub SCFA-associated genes. LASSO analysis was performed using the GLMNET package. A ten-fold cross-validation was implemented to train the model, with the minimum lambda value defined as the optimal value. SVM-RFE algorithm was performed with package “e107”. The final set of hub genes was determined by an intersection analysis of the results obtained from LASSO logistic regression and SVM-RFE, ensuring a robust and comprehensive selection.
Nomogram construction and receiver operating characteristic (ROC) curve evaluation
The nomogram, developed using the “rms” package, serves as a pivotal clinical tool designed to enhance diagnostic accuracy for AD by leveraging the identified hub genes. In this graphical model, each gene is assigned a specific score (“Points”), and the “Total Points” represent the cumulative score from all incorporated genes. This scoring system translates complex genetic data into an intuitive visual aid to support clinical decision-making. To evaluate the diagnostic efficacy of the nomogram, a ROC curve was constructed. The area under the curve (AUC) along with its 95% confidence interval (CI) were calculated to quantify diagnostic performance using the “pROC” package in R.
Functional enrichment analysis
Gene Ontology (GO) and Kyoto Encyclopedia of Genes and Genomes (KEGG) enrichment analysis were employed for functionally annotating gene modules, with the “clusterProfiler package” employed for the analysis. To investigate the potential functions of the hub genes, GSEA was performed using the gseKEGG function from the R package “clusterProfiler”, with p < 0.05 considered statistically significant.
Immune infiltration analysis
The relative percentage of immune cells in each sample was quantified via CIBERSORT. Immune molecules, including immune inhibitors, immune stimulators, and chemokines, were derived from the TISIDB database. The correlations between hub genes, immune cell infiltration, and immune molecules were calculated using Spearman's rank correlation.
Network construction
The network was constructed using the NetworkAnalyst tool (https://www.networkanalyst.ca/) and visualized with Cytoscape. The JASPAR database was exploited to build the TF-gene interaction network, whereas the gene-miRNA interaction network was constructed based on the miRTarBase database. Additionally, the CTD database (http://ctdbase.org/) was used to examine the interactions between chemical substances and hub genes. A threshold of more than 2 interactions was applied to screen for potential compounds.
Statistical analysis
R software was used for all every bioinformatics analysis. The Wilcoxon test was applied to determine the differences between different groups, while Spearman's correlation analysis was utilized to evaluate relationships. A p-value < 0.05 was considered statistically significant.
Results
Identifying modules associated with AD through the WGCNA
Co-expression network closely linked to AD was constructed and determined using WGCNA analysis. 7932 genes were extracted, and β = 16 was chosen as the soft threshold power (Figure 1A, B). Genes with comparable patterns of expression were grouped into co-expression modules via WGCNA; each module was given a distinct color, making a total of 10 modules (Figure 1C). The turquoise module exhibited the most significant correlation with the disease (Figure 1D) and was selected for further analysis. We used GO and KEGG pathway enrichment analyses to investigate the potential biological functions of AD-associated genes. The results exhibited that genes in turquoise modules were linked to synaptic vesicle-associated pathways, glutamatergic synapses, and GTPase activator activity (Figures 1E, F).

Screening for disease-related WGCNA modules in the AD cohort. (A, B) Soft threshold and scale-free topological fit index (R2). (C) Cluster dendrogram of genes. (D) The heat map of the association between clinical traits and gene modules. Blue denotes a negative connection, whereas red indicates a positive association. The matching correlation and p-value are displayed in each cell. (E, F) The GO and KEGG enrichment analysis of genes in turquoise modules.
Identifying of SCFA metabolism-associated genes in AD co-expression modules
First, 1243 SCFA-related genes were derived from the GeneCards database. Subsequently, 201 DEGs were identified in the GSE132903 dataset (Figure 2A). By overlapping DEGs, module genes and SCFA metabolic genes, 10 SCFA metabolism-related genes were obtained (Figure 2B). Two machine learning algorithms were employed for further feature gene selection. Specifically, LASSO regression analysis selected 7 statistically significant genes from the univariate analysis (Figure 2C, Supplemental Table 1), while the SVM-RFE algorithm identified 6 genes with the lowest error of 0.148 (Figure 2D, Supplemental Table 2). To establish a robust gene signature for AD, the overlapping genes from the aforementioned two methods were selected. Five genes, namely, EZR, SNCA, GFAP, NFKBIA, and SST, were identified and designated as the hub SCFA metabolism-associated genes. The boxplot indicated that AD group had high levels of EZR, GFAP, and NFKBIA, while the ND group had high levels of SNCA, and SST (Figure 2E).

Feature gene selection. (A) Volcano plot of the DEGs between the ND and AD groups. (B) Venn diagram based on DEGs, module genes and SCFA-related genes. (C) LASSO algorithm screening for important SCFA-related genes. (D) Signature gene expression was screened based on the support vector machine recursive feature elimination (SVM-RFE) algorithm. (E) Five hub gene expression in the ND and AD groups. *p < 0.05; **p < 0.01; ***p < 0.001.
Modeling and testing a diagnostic nomogram model for AD
A nomogram based on the five candidate hub genes was constructed (Figure 3A). The diagnostic specificity and sensitivity of each gene, and the nomogram itself, were evaluated using the ROC curve. The AUC was calculated for each gene. The results were as follows: EZR (AUC 0.824), GAFP (AUC 0.785), NFKBIA (AUC 0.833), SNCA (AUC 0.729), and SST (AUC 0.796) (Figures 3B-F). The AUC of the nomogram model was 0.911 in the GSE132903 and 0.846 in the validation set (Figures 3G, H). These findings, therefore, suggest that all candidate genes demonstrated have a good diagnostic value for AD, while the constructed nomogram demonstrated the highest diagnostic efficacy.

The nomogram construction and evaluating the diagnostic value. (A) Visualization of the nomogram for AD diagnosis. (B–F) ROC curve for each candidate gene (EZR, GFAP, NFKBIA, SNCA, and SST). (G, H) The nomogram in the training (GSE132903) and validation sets show its significant diagnostic value for AD.
Gene set enrichment of the hub genes
The potential biological function of the five hub genes was investigated in greater detail. Enrichment analysis was implemented to analyzed the underlying biological roles of these genes. The GSEA results of five genes (SST, GFAP, NFKBIA, EZR, and SNCA) revealed that they were associated with notch signaling pathway, oxidative phosphorylation, NF-kappa B signaling pathway (Figures 4A-E, Supplemental Table 3). These pathways are associated with AD pathogenesis, indicating that the genes identified may contribute to the pathogenesis of AD.

Enriched pathways of the hub genes. GSEA revealed the enriched pathways of the five hub genes. (A) EZR, (B) NFKBIA, (C) GFAP, (D) SNCA, and (E) SST.
Immune infiltration
The progression of the disease is related to the immune microenvironment, which is composed of inflammatory agents, immune cells, and different immune factors. In this research, the CIBERSORT algorithm was employed for estimating the proportions of 22 immune cell types in 98 ND and 97 AD samples, which can be seen in the histogram. The results, as shown in the histograms, indicated that the proportions of M1 macrophages and CD4 + naive T cells were markedly higher in the AD group, whereas the activated dendritic cells and plasma cells were markedly lower (Figure 5A, B). Furthermore, correlation analysis indicated that GFAP and NFKBIA were negatively correlated with plasma cells and activated dendritic cells, and positively correlated with M1 macrophages and resting natural killer cells, whereas SNCA and SST exhibited the opposite trend (Figure 5C). Significant relationships between the five hub genes and most immune factors, such as immunosuppressants, immunostimulants, and chemokines, were indicated by the correlation heatmaps (Figure 5D-F). According to these findings, hub genes play an important role in the immune microenvironment.
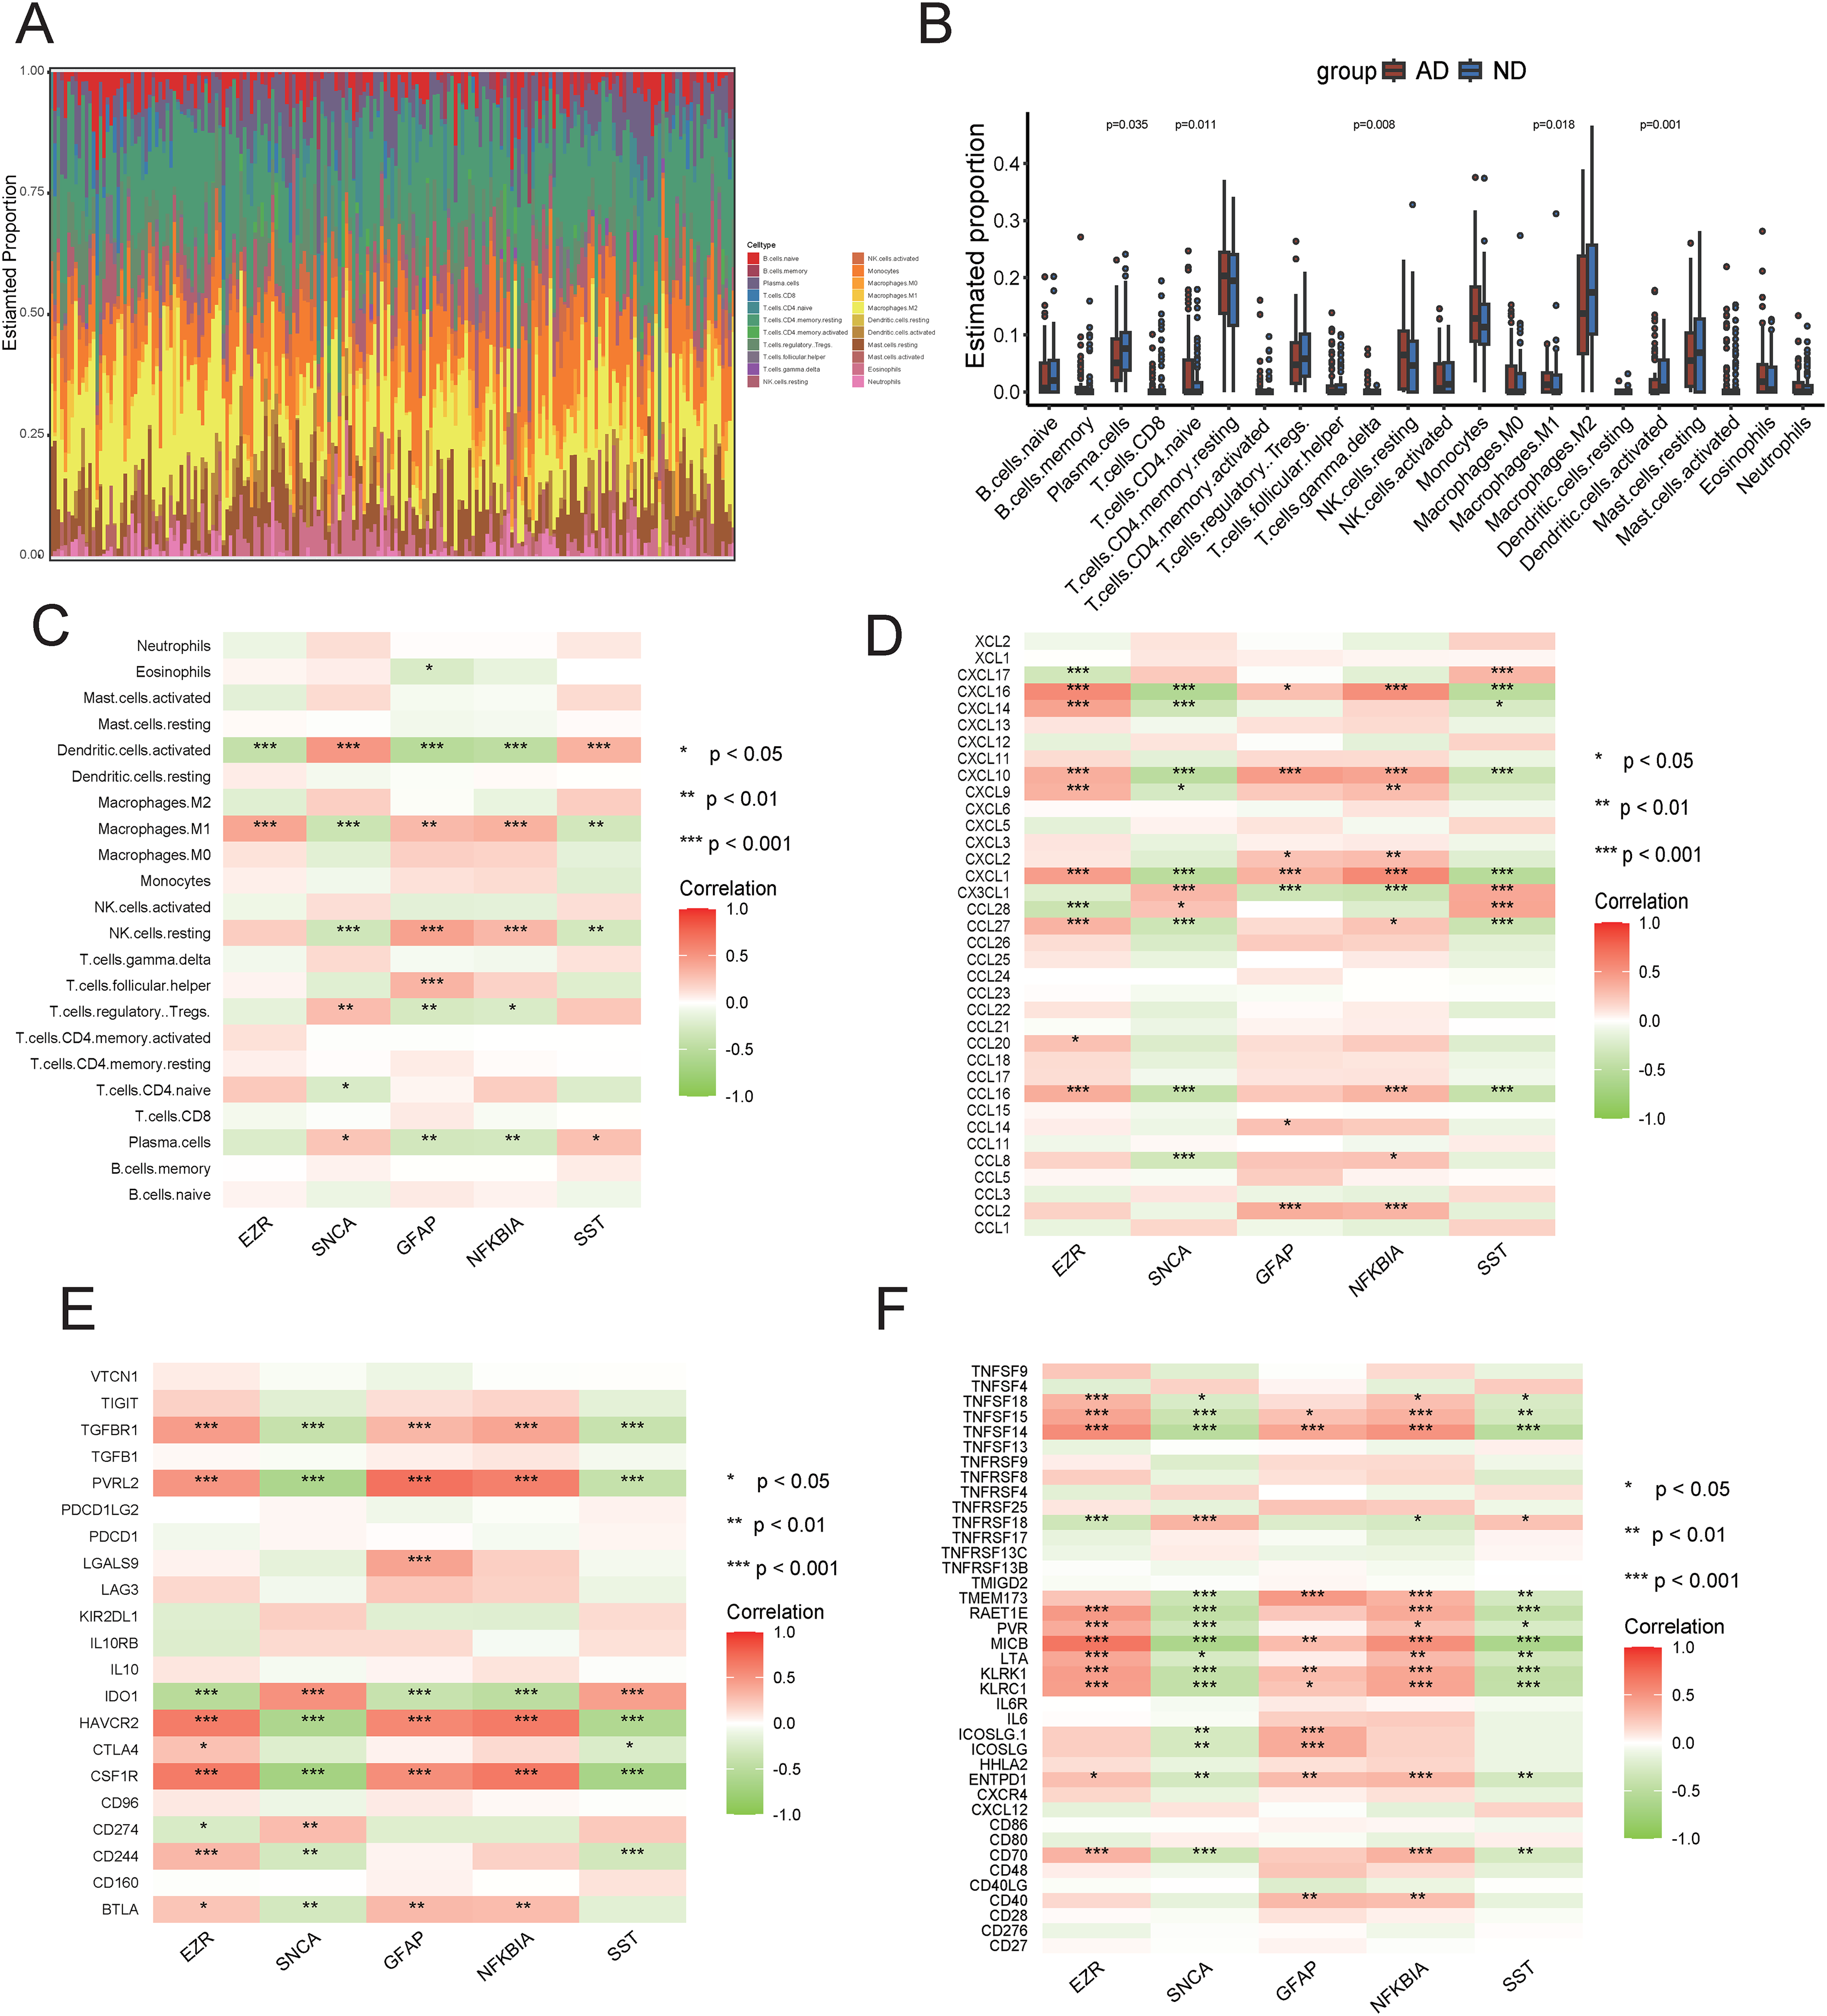
Immune Infiltration analysis. (A) Relative proportions of the 22 immune cell types in each sample. (B) Differences in immune infiltration between ND and AD samples. (C) The association between immune cells and hub genes. (D) The association between chemokines and hub genes. (E) The association between immunosuppressants and hub genes. (F) The association between immunostimulants and hub genes. *p < 0.05; **p < 0.01; ***p < 0.001.
Construction of hub gene interaction networks
We used the miRTarBase database to create an mRNA-miRNA regulatory network and identified the microRNAs associated with the key genes, which was visualized using Cytoscape software. Two hub genes and 13 microRNAs were part of this network (Figure 6A). We employed the NetworkAnalyst to explore the connection between the transcription factors (TFs) and hub genes for understanding the role of hub genes in TFs. This network comprises 5 hub genes and 32 TFs (Figure 6B). To identify candidate drugs as biomarkers for AD, we queried the CTD. We focused on the candidate drugs related to multiple of these hub genes. After eliminating the polluting chemical substances, it was found that valproic acid and tretinoin were associated with 4 of the hub genes. It is speculated that they can reverse or induce the expression of hub genes, thereby influencing the state of AD (Supplemental Table 4).
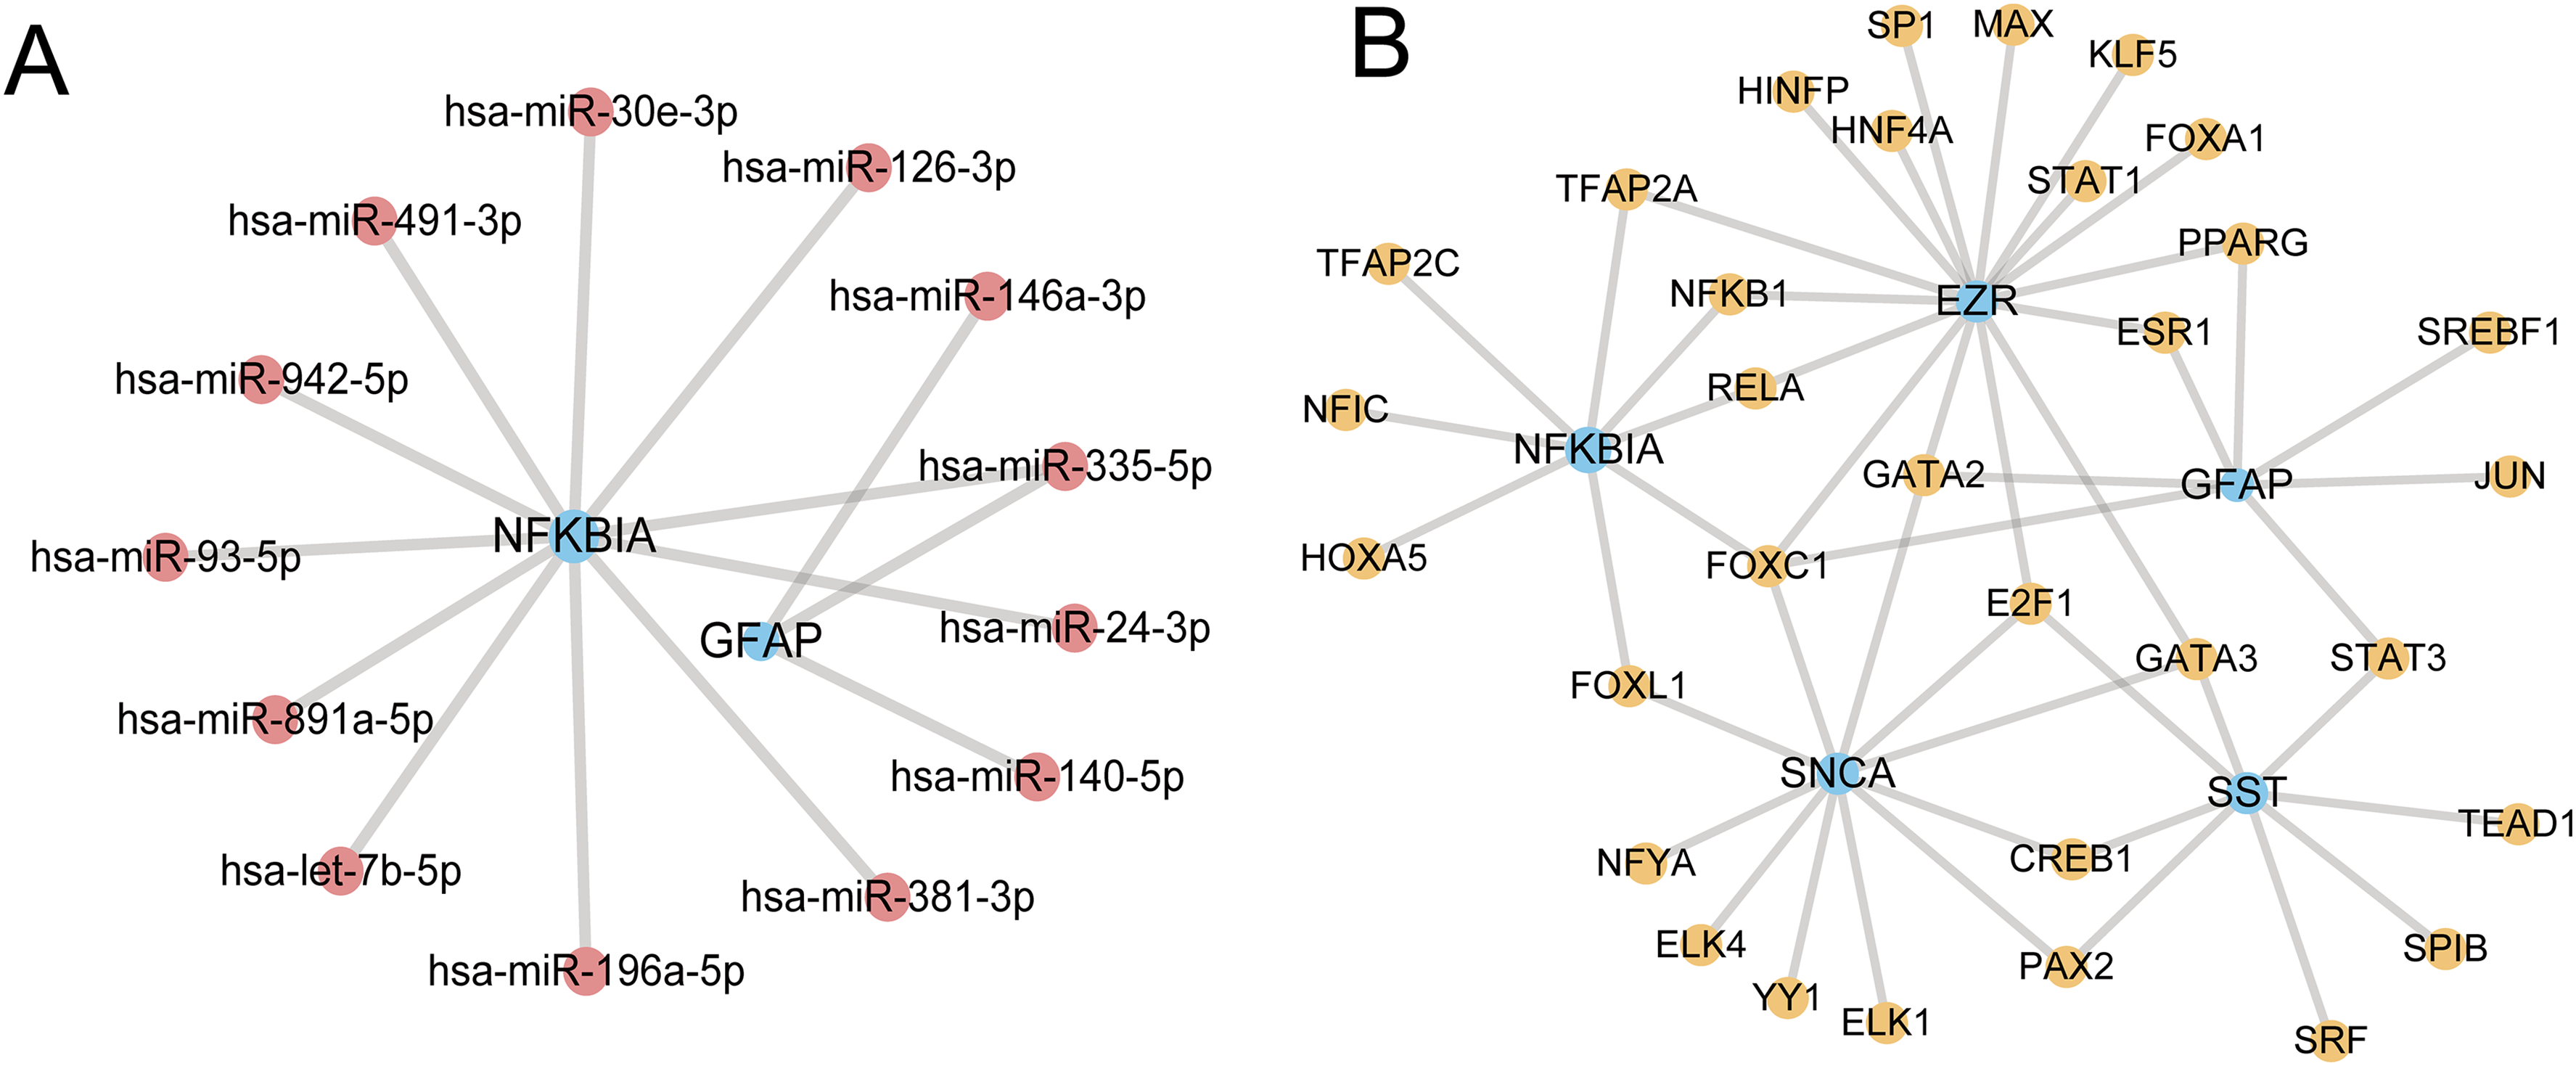
Regulatory network of hub genes. (A) The mRNA-miRNA regulatory network of the hub gene. miRNAs are displayed in pink blue and mRNAs in blue. (B) The mRNA-TF regulatory network of the hub gene. TFs are exhibited in orange and mRNAs in blue.
Discussion
AD is a neurodegenerative disorder that is characterized by progressive cognitive decline and is the most common cause of dementia. Until recently, strategies to slow or prevent its clinical progression have remained largely elusive. The significance of the gut microbiota along with its metabolites in the AD pathophysiology has been highlighted by more and more studies. Nevertheless, not enough research has been done on the mechanisms via which SCFAs are linked to AD.
In this research, we screened differentially expressed SCFA genes that are specifically related to AD in the GEO dataset and identified five SCFA hub genes (NFKBIA, GFAP, EZR, SST, and SNCA) through various bioinformatics analyses. Additionally, we examined the connection between these five genes and immune cells, along with seeking potential therapeutic targets and agents for AD.
Based on GSEA analysis, five SCFA hub genes were linked to the NF-κB signaling pathway, Notch signaling pathway, and oxidative phosphorylation (OXPHOS). Notch proteins exert a key role in vascular maintenance, and disruptions in this signaling cascade may induce vascular damage and leading to amyloid and hyperphosphorylated tau deposition, which subsequently contributes to cognitive decline. 23 Neurodegeneration is linked to the well-known inflammatory transcription factor NF-κB. 24 NF-κB signaling has been displayed to induce AD phenotype and brain aging. 25 OXPHOS dysfunction appears to be a common hallmark in many AD patients, with the OXPHOS system playing an important role in the mechanisms of Aβ-triggered synaptic failure and neurodegeneration.26,27 For the purpose of elucidating the specific mechanisms by which these five SCFA hub genes influence the course of AD, more research is needed.
NFKBIA, which is associated with inflammation and immunology, is increased in AD.28,29 The NFKBIA gene encodes IκBα, a member of the nuclear factor kappa B (NF-κB) inhibitor family, which plays a critical role in regulating NF-κB activity. 30 The SCFA butyrate exerts anti-inflammatory effects by suppressing NF-κB activation and inhibiting the degradation of IκBα, thereby reducing the expression of pro-inflammatory cytokines. 31 Glial fibrillary acidic protein (GFAP), a recognized biomarker for neuroinflammation, has been identified as a potential diagnostic biomarker for AD. Butyrate treatment has been shown to decrease hmTDP43 aggregates and GFAP protein levels in the mouse spinal cord and brain. 32 Somatostatin (SST) is a neuropeptide that can promote the clearance of Aβ in the brain and help prevent excessive tau phosphorylation and neurodegeneration.33,34 Valproic acid (VPA), a SCFA, has been reported to significantly regulate somatostatin at both the mRNA and protein levels. 35 Alpha-synuclein (αSyn) is a presynaptic protein of 140 residues, encoded by the SNCA gene. 36 Alpha-synuclein is regarded as a promoting factor for AD. 37 SCFAs can aggregates αSyn accumulation and neuroinflammation via GPR43-NLRP3 signaling pathway in a model Parkinson's disease. 38 A causal link between SCFAs and SNCA in the pathogenesis of AD has not been fully established and requires further study. It has been identified that Ezrin (EZR) is upregulated in tau-mediated neurodegeneration. 39 Separately, in Caco-2 cell monolayers, butyrate has been shown to promote tight junction assembly and enhance the intestinal barrier through activation of AMP-activated protein kinase (AMPK). 40 The multi-protein complex of CFTR–NHERF1–ezrin–actin plays a crucial role in maintaining the structure and barrier function of tight junctions. 41 In summary, these hub genes may be the key downstream targets through which SCFAs exert their anti-inflammatory effects and other functions.
Recent studies have found that both peripheral immune cells and intrinsic immune cells, for instance astrocytes and microglia, are essential to the pathophysiology of AD-related neuroinflammation.42,43 We further explored the relationship between SCFA metabolism and immune infiltration. Results showed that the percentage of M1 macrophages and CD4 naïve T cells increased in the AD group, while the proportion of plasma cells and active dendritic cells decreased significantly. Additionally, our study further revealed the correlation between five SCFAs gene and immune molecules. Interestingly, NFKBIA, GFAP, and EZR (upregulated in AD compared to normal samples) were positively correlated with most immune molecules, including CXCL10, CXCL1, and CSF1R. On the other hand, SNCA, and SST (downregulated in AD compared to normal samples) were negatively correlated with most immune molecules. Abnormal CXCL10 levels have been found in multiple neurodegenerative phenotypes, including AD. 44 CXCL10 is a key factor in microglia-mediated neuroinflammation. 45 Research by Xia et al. has shown that in the primary cortical neurons of mice, CXCL1 can stimulate tau protein hypermethylation. 46 Microglia survival are critically dependent on CSF1R signaling. 47 In conclusion, these results suggest that SCFAs may influence AD through immune pathways.
Recent studies underscore that TFs and microRNAs (miRNAs) orchestrate genetic regulatory networks through feed-forward or feedback loops. 48 TFs, which bind to promoter regions of target genes, regulate transcription, whereas miRNAs—small non-coding RNAs of approximately 19–25 nucleotides—mediate post-transcriptional repression of their targets via translational inhibition or mRNA degradation. 49 We examined the regulatory networks including TFs and miRNAs. It has been indicated that the increased levels of miRNA-140-5p can be detected in neuronal SHSY5Y cells following Aβ toxicity. 50 The inhibitor of miRNA-140-5p may regulate Pin1 to alleviate memory impairment caused by Aβ oligomers in the body. 51 miR-24-3p shows promise as a potential biomarker for the diagnosis of AD and its downregulation was reported to promote proliferation and suppress apoptosis. 52 miR-126-3p may play a role in the regulatory mechanisms through which folic acid modulates secretory enzyme expression, subsequently influencing the production of Aβ. 53 Network analysis predicts that GATA2 and EZR1 may regulate three hub genes. Previous studies have reported that GATA-2 can regulate the expression of endogenous neuronal α-synuclein. 54 In astrocytes, the overexpression of E2F1 drives tumorigenic transformation, a process accompanied by the downregulation of GFAP and p130 expression in the transformed cells. 55 Notably, our analysis identified FOXC1 (Forkhead Box C1), a transcription factor known to regulate cell cycle progression and brain development, as a potential regulator of four hub genes. 56 This finding suggests that FOXC1 may exert a unique regulatory function in the progression of AD, but this conclusion requires further research to be confirmed. Drug network analysis indicates that valproic acid has demonstrated neuroprotective effects in AD by reducing Aβ deposition and alleviating memory deficits in AD model mice, positioning it as a promising therapeutic agent for AD.57,58 The RARα/RXRα signaling pathway triggered by retinoic acid (tretinoin) directly inhibits the cleavage of amyloid-β protein precursor by γ-secretase, thereby suppressing the production of Aβ protein. 59 These findings improve our knowledge of disease and aid in the development of therapeutic strategies.
In summary, we have determined a number of hub genes associated with AD that may assist in diagnosis and comprehension of the disease's development. However, the research has some limitations that warrant further consideration. As our data is derived from public database and lacks more molecular or animal experiments, further clinical studies and higher-level evidence are still needed for support.
Supplemental Material
sj-xlsx-1-alr-10.1177_25424823261424808 - Supplemental material for Identification of potential short-chain fatty acid biomarkers in Alzheimer's disease through bioinformatics analysis
Supplemental material, sj-xlsx-1-alr-10.1177_25424823261424808 for Identification of potential short-chain fatty acid biomarkers in Alzheimer's disease through bioinformatics analysis by Yuting Yang, Yuchen Meng, Miaomiao Li, Ziyang Xu, Hengjing Wu, Qin Zhang, Suping Zhang, Fanbing Kong, Zhiyuan Wang, Xinling Li and Yihua Zhu in Journal of Alzheimer's Disease Reports
Supplemental Material
sj-xlsx-2-alr-10.1177_25424823261424808 - Supplemental material for Identification of potential short-chain fatty acid biomarkers in Alzheimer's disease through bioinformatics analysis
Supplemental material, sj-xlsx-2-alr-10.1177_25424823261424808 for Identification of potential short-chain fatty acid biomarkers in Alzheimer's disease through bioinformatics analysis by Yuting Yang, Yuchen Meng, Miaomiao Li, Ziyang Xu, Hengjing Wu, Qin Zhang, Suping Zhang, Fanbing Kong, Zhiyuan Wang, Xinling Li and Yihua Zhu in Journal of Alzheimer's Disease Reports
Supplemental Material
sj-xlsx-3-alr-10.1177_25424823261424808 - Supplemental material for Identification of potential short-chain fatty acid biomarkers in Alzheimer's disease through bioinformatics analysis
Supplemental material, sj-xlsx-3-alr-10.1177_25424823261424808 for Identification of potential short-chain fatty acid biomarkers in Alzheimer's disease through bioinformatics analysis by Yuting Yang, Yuchen Meng, Miaomiao Li, Ziyang Xu, Hengjing Wu, Qin Zhang, Suping Zhang, Fanbing Kong, Zhiyuan Wang, Xinling Li and Yihua Zhu in Journal of Alzheimer's Disease Reports
Supplemental Material
sj-xlsx-4-alr-10.1177_25424823261424808 - Supplemental material for Identification of potential short-chain fatty acid biomarkers in Alzheimer's disease through bioinformatics analysis
Supplemental material, sj-xlsx-4-alr-10.1177_25424823261424808 for Identification of potential short-chain fatty acid biomarkers in Alzheimer's disease through bioinformatics analysis by Yuting Yang, Yuchen Meng, Miaomiao Li, Ziyang Xu, Hengjing Wu, Qin Zhang, Suping Zhang, Fanbing Kong, Zhiyuan Wang, Xinling Li and Yihua Zhu in Journal of Alzheimer's Disease Reports
Footnotes
Acknowledgements
The authors thank all the participants of this study.
Ethical considerations
Not applicable
Consent to participate
Not applicable
Consent for publication
Not applicable
Author contribution(s)
Funding
The authors disclosed receipt of the following financial support for the research, authorship, and/or publication of this article: This work was supported by National clinical key specialty construction project of China (grant number Z155080000004), Shanghai Research Center of Rehabilitation Medicine (Top Priority Research Center of Shanghai) (grant number 2023ZZ02027), Shanghai Disabled Persons’ Federation Key Laboratory of Intelligent Rehabilitation Assistive Appliance and Technology, and Shanghai Songjiang District Science and Technology Research Project (grant number 2025SJKJGG104).
Declaration of conflicting interests
The authors declared no potential conflicts of interest with respect to the research, authorship, and/or publication of this article.
Data availability statement
The dataset used in this study can be found in the public database. The name of the database and the accession number(s) can be found in the article.
Supplemental material
Supplemental material for this article is available online.
References
Supplementary Material
Please find the following supplemental material available below.
For Open Access articles published under a Creative Commons License, all supplemental material carries the same license as the article it is associated with.
For non-Open Access articles published, all supplemental material carries a non-exclusive license, and permission requests for re-use of supplemental material or any part of supplemental material shall be sent directly to the copyright owner as specified in the copyright notice associated with the article.