
Abstract
Rural schools experience unique challenges, including teacher quality and teacher retention, limited resources, and availability of funding. Furthermore, access to professional development and, subsequently, implementation of evidence-based practices may also be limited in rural settings. One evidence-based framework for implementing evidence-based practices, School-Wide Positive Behavioral Interventions and Supports (SWPBIS), has been widely implemented, including in rural and urban schools. Yet, very little research has explicitly compared rural and urban schools implementing SWPBIS with regard to implementation and discipline. Therefore, we examined statewide data to evaluate differences between rural and urban schools implementing SWPBIS in Florida. We found that both rural and urban schools were equally likely to implement all the components of SWPBIS. When comparing schools, we found that rural schools implementing SWPBIS had more out-of-school suspensions than nonimplementing rural schools, while the opposite was true for urban schools. Limitations and future research are discussed.
Keywords
Rural schools face unique challenges, often including geographic isolation, concerns about teacher quality and teacher retention, limited resources and availability of funding, meeting new federal and state accountability requirements, and low student achievement (Arnold et al., 2005; Rude & Miller, 2018; Steed et al., 2013). Therefore, research is needed to identify specific issues constraining the implementation of evidence-based practices in rural schools and, subsequently, how to address those unique challenges for rural schools. Unfortunately, there is limited research that explicitly compares the implementation of evidence-based practices in rural and urban settings, and even fewer employing rigorous research methods (Cicchinelli & Beesley, 2017). To address this gap, we compared rural and urban schools’ implementation of universal School-Wide Positive Behavior Interventions and Supports in Florida using a post hoc quasi-experimental design and extensive statistical controls. The purpose of this article was to identify whether rural schools demonstrate implementation challenges and whether there are differences in implementation effects on school suspensions by urban locale (e.g., rural or urban).
Rural Education
According to the 2017–2018 data from the National Center for Education Statistics, a third of the approximately 130,000 K–12 schools in the United States are located in rural areas whereas a quarter of our nation’s schools reside in urban areas (De Brey et al., 2019). While rural schools outnumber urban schools across the country, rural student enrollment averages 40% fewer students than their counterparts. Yet, all states contain both rural and urban school districts regardless of size. For example, 51% of Florida’s school districts are rural, yet the state contains 50% of the top 10 largest urban school districts in the country. Extreme variabilities within a single state can present unique challenges, especially in rural settings. A review of research found that rural schools are challenged by geographic isolation, restricted budgets, limited salaries, high parent expectations of school leadership, and difficulty recruiting and retaining highly qualified teachers and principals (Preston et al., 2013). Furthermore, rural schools have limited access to the consistent, ongoing professional development needed to implement evidence-based practices with high levels of fidelity (Cavanaugh & Swan, 2015; Steed et al., 2013). Therefore, understanding similarities and differences in the implementation of evidence-based practices between rural and urban schools is needed. This information can then be used to develop novel professional development approaches targeting rural schools’ needs and addressing the unique geographic challenges, potentially through new technologies (e.g., Schmidt et al., 2015).
The quality of educational research has also been noted as a concern. Arnold et al. (2005) reviewed 498 research studies conducted in rural settings and found limited experimental or quasi-experimental research explicitly comparing rural and nonrural settings. The authors found only 21% of the studies used a comparative design and only 2% of studies were considered “high quality” comparative research. More recently, Cicchinelli and Beesley (2017) reviewed the research and found modest increases in rigorous research but apparent gaps between rural and urban education in identifying specific concerns and professional development targets. Thus, more research is needed in explicitly comparing and contrasting rural and urban implementation of evidence-based practices and determining if differences exist across the two locales for adequate support planning.
School-Wide Positive Behavioral Interventions and Supports (SWPBIS)
School-Wide Positive Behavioral Interventions and Supports (SWPBIS) is an evidence-based multitiered framework for implementing prevention and intervention practices in schools to reduce the occurrence of disruptive behaviors (Sugai & Horner, 2002). Prevention and intervention practices are delivered to all students at the universal level (Tier 1), to students nonresponsive to universal prevention (Tier 2), and to students with intensive problem behaviors (Tier 3). SWPBIS is implemented in more than 29,000 schools across the country (Center on PBIS, 2020), and extensive research has explored implementation processes (Mathews et al., 2014), scale-up efforts (Bradshaw & Pas, 2011), and student and school impacts (Pas et al., 2019). Lee and Gage (2020) conducted a meta-analysis of experimental and quasi-experimental research and found schools implementing SWPBIS had fewer discipline outcomes, including suspensions (d = -0.26), and higher academic achievement (d = 0.11).
SWPBIS has been implemented in Florida for nearly 20 years under the support of the statewide training and technical assistance project, Florida Positive Behavioral Interventions and Support Project (FLPBIS). FLPBIS has supported 62 of the 67 Florida school districts and trained more than 2,100 schools in Tier 1 PBIS. Given the expansive reach of PBIS across Florida districts, FLPBIS has worked with numerous schools of every demographic. The FLPBIS Project maintains a comprehensive evaluation system (i.e., implementation fidelity measures, student outcome measures) with a high response rate; an average of at least 70% of active PBIS schools submit a fidelity and outcome measure each year. In addition, schools that implement SWPBIS with fidelity have realized improved outcomes (FLPBIS, 2020).
SWPBIS in Rural Settings
Although there is extensive research exploring implementation and impacts of SWPBIS, there is limited research focusing on the implementation of SWPBIS in rural schools. For example, McCrary et al. (2012) described the implementation of SWPBIS in four rural West Texas schools. During their first year of implementation, the authors monitored implementation efforts and found schools reduced time spent in restrictive environments (i.e., in-school suspension, alternative school placement) and increased time in classroom instruction, yet fidelity data were not reported. McDaniel et al. (2020) conducted a systematic review of the SWPBIS literature base on underrepresented educational settings (e.g., schools serving majority non-White students and/or those from low-income backgrounds) and coded across 13 variables (e.g., geographic region, % race, % SPED, % ELL, underserved indicator). Criteria for inclusion did not imply rural locale yet shared many of the same variables that rural environments typically experience. Across the 46 eligible studies, SWPBIS outcomes demonstrated effectiveness in reducing disciplinary issues, but only four of the studies explicitly described “rural setting.”
One challenge in exploring the effects of urban locale in the SWPBIS research is that few studies describe SWPBIS differences by urban locale. Researchers may have described a setting as “rural” (e.g., Kartub et al., 2000; Lane et al., 2008) but not how the context influenced the implementation. For example, Curtis et al. (2010) describe a SWPBIS training for a leadership team in a rural school that showed reductions in out-of-school suspensions and fewer instructional days lost but did not specify how the “rurality” influenced the training. Others have adapted SWPBIS to reflect the local rural culture, such as shifting SWPBIS practices for a population that incorporated Native American cultural adaptations to its school-wide expectations (Jones et al., 2006). Nese et al. (2019) estimated predictors of latency to achieving implementation fidelity based on the measure used in each school’s state (e.g., Tiered Fidelity Inventory [TFI], Benchmarks of Quality [BoQ], Schoolwide Evaluation Tool [SET]). Using data from 708 schools across the United States, the authors examined urban locale as a predictor of latency to fidelity. The authors found that rural schools had the largest latency, taking an average of 2.3 years after initial training, but were less likely to abandon SWPBIS than urban schools. Others, including Gage et al. (2019) and Kim et al. (2018), include urban locale as a covariate in their statistical analyses to control for differences but do not explicitly compare implementation or effects by urban locale.
As limited research specifically comparing the implementation of SWPBIS in rural schools exists, we designed this study to fill this gap and explore differences in both fidelity of implementation and school suspensions by urban locale. We compare rural and urban schools as there is a clear geographic distinction between the two urban locales. Furthermore, we extend the rural education literature by using a rigorous post hoc quasi-experimental design to compare rural and urban schools implementing SWPBIS and explore interaction effects for urban locale and SWPBIS implementation. Our study was guided by the following research questions:
Method
We combined three different datasets from the 2015–2016 school year to create the analysis sample. First, we obtained data from the U.S. Department of Education’s Office of Civil Rights (OCR). Every other year, the OCR conducts the Civil Rights Data Collection (CRDC), which requires all U.S. public schools to report on specific discipline outcomes by gender, race, and disability. The CRDC includes hundreds of variables, but we focused exclusively on in- and out-of-school suspensions for this study. Second, we obtained data from the U.S. Department of Education’s National Center for Educational Statistics (NCES). NCES collects demographic data for all U.S. public schools, including urban locale based on U.S. Census criteria that define locales as (a) urban, (b) suburban, (c) town, and (d) rural (Geverdt, 2015). Finally, we obtained SWPBIS fidelity of implementation data and the number of years schools were implementing SWPBIS from the FLPBIS Project. We used both NCES identification numbers and school and district names to merge the three data sets. The full Florida data set contained 3,950 schools after merging.
Next, we reduced the data set to only schools in rural and urban locales based on the U.S. Census definition. The final analytic sample consisted of 1,627 schools. Of those, 511 were located in rural settings, while 1,116 schools were located in urban settings. Table 1 provides demographic characteristics for all schools, schools by rural or urban settings, and schools by rural or urban setting and SWPBIS implementation. In summary, there was a greater percentage of White students and students receiving free/reduced-price lunch (FRL) in rural schools than in urban schools. There were also more rural schools with different grade levels (e.g., K–12, 3–8), more alternative schools, and fewer charter schools in rural settings. Schools implementing SWPBIS had more students than schools not implementing SWPBIS. There were greater percentages of Hispanic students and smaller percentages of Black students in rural schools implementing SWPBIS than in urban schools implementing SWPBIS. Overall, there were very few charter schools implementing SWPBIS compared with schools not implementing SWPBIS.
School Characteristics by Urban Locale and School-Wide Positive Behavior Interventions and Supports Implementation.

Note. All values are means except those in parentheses, which are standard deviations. SWPBIS = School-Wide Positive Behavioral Interventions and Supports, FRL = free/reduced-price lunch, SPED = special education services, LEP = limited English proficiency.
Measures
Benchmarks of quality
We used the BoQ (Cohen et al., 2007; Kincaid et al., 2005, 2010) to measure treatment schools’ fidelity of implementation. The BoQ is a 53-item rating scale completed by a school’s SWPBIS team in consultation with a SWPBIS coach to measure Tier 1 implementation fidelity. The BoQ items are organized into 10 SWPBIS elements defined as critical indicators of adherence: (a) the SWPBIS team, (b) faculty commitment to SWPBIS implementation, (c) effective procedures for dealing with discipline, (d) data entry and analysis plan established, (e) expectations and rules developed, (f) reward/recognition program established, (g) lesson plans for teaching expectations/rules, (h) implementation plan, (i) classroom management systems, and (j) evaluation. The 53 items are scored between 0 and 3 points, with 12 items allowing for a score of 3 for fully-in-place and 43 items using a 2 as fully-in-place. The scores are then summed and divided by the total number of points possible (107) and scaled as a percentage. Cohen et al. (2007) defined fidelity as a score of 70% or above as they evaluated the psychometric properties of the BoQ. They found adequate total score internal consistency (α = .96), test–retest reliability (r = .94, p < .01), and interrater reliability (r = .87, p < .01). As noted earlier, the BoQ is part of standard practice for the FLPBIS Project’s comprehensive evaluation and is collected from all SWPBIS schools every spring.
Suspension from school
We focused on two types of suspensions: in-school suspensions (ISS) and out-of-school suspensions (OSS). The CRDC data set provides the number of students with one or more ISS and separates OSS into two types: (a) the number of students with only one suspension and (b) the number of students with more than one suspension. We retained both types of OSS and summed them for an overall OSS count. The CRDC also collects the number of days missed for OSS, which we used in this study. All data were from the CRDC database (see https://ocrdata.ed.gov/flex/Reports.aspx?type=school).
Covariates
We included a series of school- and district-level demographic variables. First, we included an indicator for the rural or urban setting of each school using NCES data based on the U.S. Census (Geverdt, 2015). Next, we identified schools by the grade levels they served as elementary, middle, high, and “other.” “Other” was defined as any grade span that did not fall within typical grade spans (e.g., grades 1–5, 6–8), such as schools serving K–12th or 5th–12th grades. We then included the total number of students enrolled in each school and the total number of full-time employees in the school. Student demographics included the percentage of students classified as (a) White, Black, or Hispanic; (b) receiving FRL, (c) receiving special education services, and (d) receiving limited English proficiency services. We aggregated the student demographic variables at the district-level to capture district-wide demographics. Finally, we included an indicator for the number of years a school had been implementing SWPBIS and the percentage of schools within a school district implementing SWPBIS.
Data Analyses
We used a series of multilevel models to answer all three research questions. All models were estimated with schools nested in districts. To answer the first two research questions, we limited the data to only schools implementing SWPBIS (n = 563), while models addressing Research Question 3 used all schools (N = 1,627). We transformed the suspension outcomes because they were significantly skewed. The skewness of total OSS, single OSS, multiple OSS, and ISS was 5.1, 4.6, 5.5, and 4.6, respectively, indicating a significant positive skew. We explored both square root and cube root transformations and found that cube root transformation improved skew for total OSS, single OSS, multiple OSS, and ISS was 0.8, 0.7, 0.6, and 0.6, respectively. The skewness of a normally distributed outcome is zero; thus, the closer to zero, the more normally distributed the variable is. We did not transform the fidelity measures as all skewness values were <2.0.
First, we estimated an intercept-only model to calculate the intraclass correlation coefficient (ICC), which describes the amount of variance within and between school districts. Next, we estimated four models for each outcome: (a) treatment only, (b) a treatment only with random slope, (c) school-level covariates, and (d) school- and district-level covariates. We evaluated model fit for each successive model using the loglikelihood ratio test. If no difference was found between the random intercept and the random intercepts and slopes models, we used the most parsimonious model (i.e., random intercept model) for subsequent models with covariates. We grand mean centered all continuous variables; all other variables were dichotomous or categorical. We also included an interaction term for school level (e.g., elementary) to compare differences by the grade levels served. All models were estimated in lme4 (Bates et al., 2015) in R.
Results
First, we examined the descriptive statistics of all dependent variables (see Table 2). The average fidelity of implementation score was 77%. The subscale with the highest percentage was Effective Procedures, while the lowest percentage subscale was Implementation Plan. Overall, there were very few differences between rural and urban schools on BoQ scores. The largest difference between rural and urban schools was for the Lesson Plan subscale, while the smallest difference was for Reward Program. Based on the total score, 73% of the schools implemented SWPBIS with fidelity (i.e., received a total BoQ score higher than 70%). Seventy-three percent of urban schools implemented with fidelity, while 74% of rural schools implemented with fidelity. The average OSS per 100 students was 10, while the average ISS per 100 students was nine. Based on the raw data, urban schools used more OSS and ISS than rural schools.
Descriptive Statistics for Fidelity of Implementation and Suspensions.
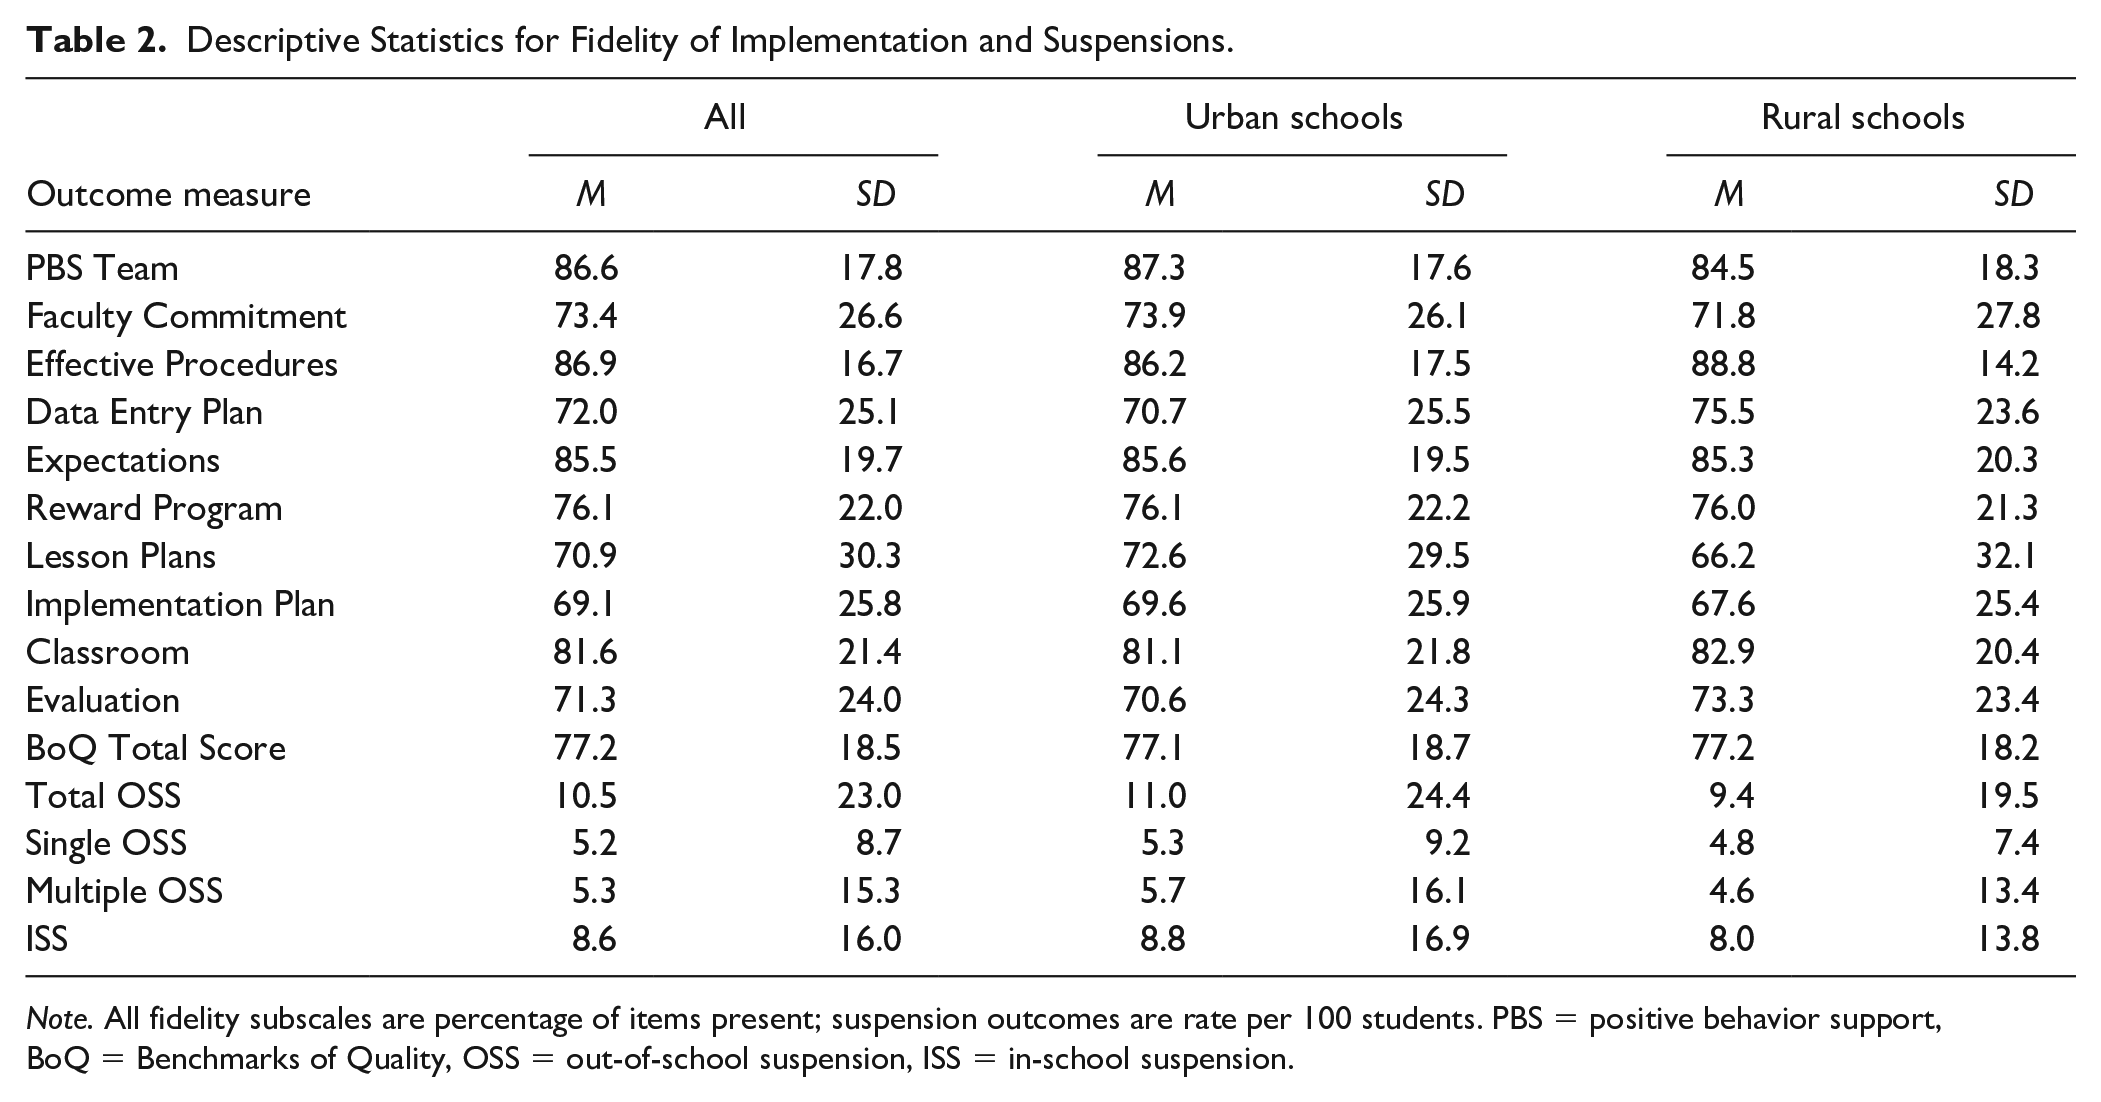
Note. All fidelity subscales are percentage of items present; suspension outcomes are rate per 100 students. PBS = positive behavior support, BoQ = Benchmarks of Quality, OSS = out-of-school suspension, ISS = in-school suspension.
Fidelity of Implementation in Rural and Urban Schools
We estimated a series of multilevel models using only data from schools implementing SWPBIS and reporting a BoQ score. There were 563 schools in 48 school districts that had available BoQ scores and were located in rural or urban settings. ICC values for the empty models ranged from 0.02 for the PBIS Team subscale to 0.10 for Evaluation. The ICC for the total BoQ score was 0.09. Overall, the values suggest that, on average, <10% of the variance for BoQ scores was between districts. Although the ICC values were low, we still used multilevel models to increase the accuracy and precision of the standard errors (Huang, 2018). (Full tables of results can be obtained from the first author.) The only subscale with significant differences between all rural and urban schools was the PBIS Team subscale (b = −6.09, p < .015). The interaction effect for school type revealed that rural high schools had significantly lower scores on the PBIS Team, Faculty Commitment, and Classroom subscales than urban high schools. Finally, we estimated a multilevel logistic regression model to evaluate differences in the likelihood a school implements SWPBIS with fidelity by urban locale (rural or urban). Results suggest that urban and rural schools have the same odds of implementing SWPBIS with fidelity (i.e., receiving a BoQ total score >70%; log[OR] = -0.15, p = .709).
Suspension Outcomes for Schools Implementing SWPBIS
Next, we estimated a series of models to compare the suspension outcomes for rural and urban schools implementing SWPBIS. The model results are presented in Table 3. However, as noted, we included interaction effects for school grade level but did not report them in the tables for parsimony. Overall, we found no statistically significant difference when comparing rural and urban schools implementing SWPBIS. However, we did find a significant effect for fidelity, indicating that schools with BoQ scores >70% had significantly fewer suspensions. We also found that middle and high schools used more suspensions than elementary schools. Alternative schools used suspensions more frequently, and schools with greater percentages of free/reduced-price lunch had more suspensions. Schools with greater percentages of students receiving special education services had more OSS but equal numbers of ISS. The only significant interaction effect was the three-way interaction for rural schools with the “Other” grade-level structure implementing with fidelity. These schools had significantly fewer ISS than other schools (b = −0.28, p = .009).
Rural and Urban Suspension Outcomes for Schools Implementing School-Wide Positive Behavior Interventions and Supports.
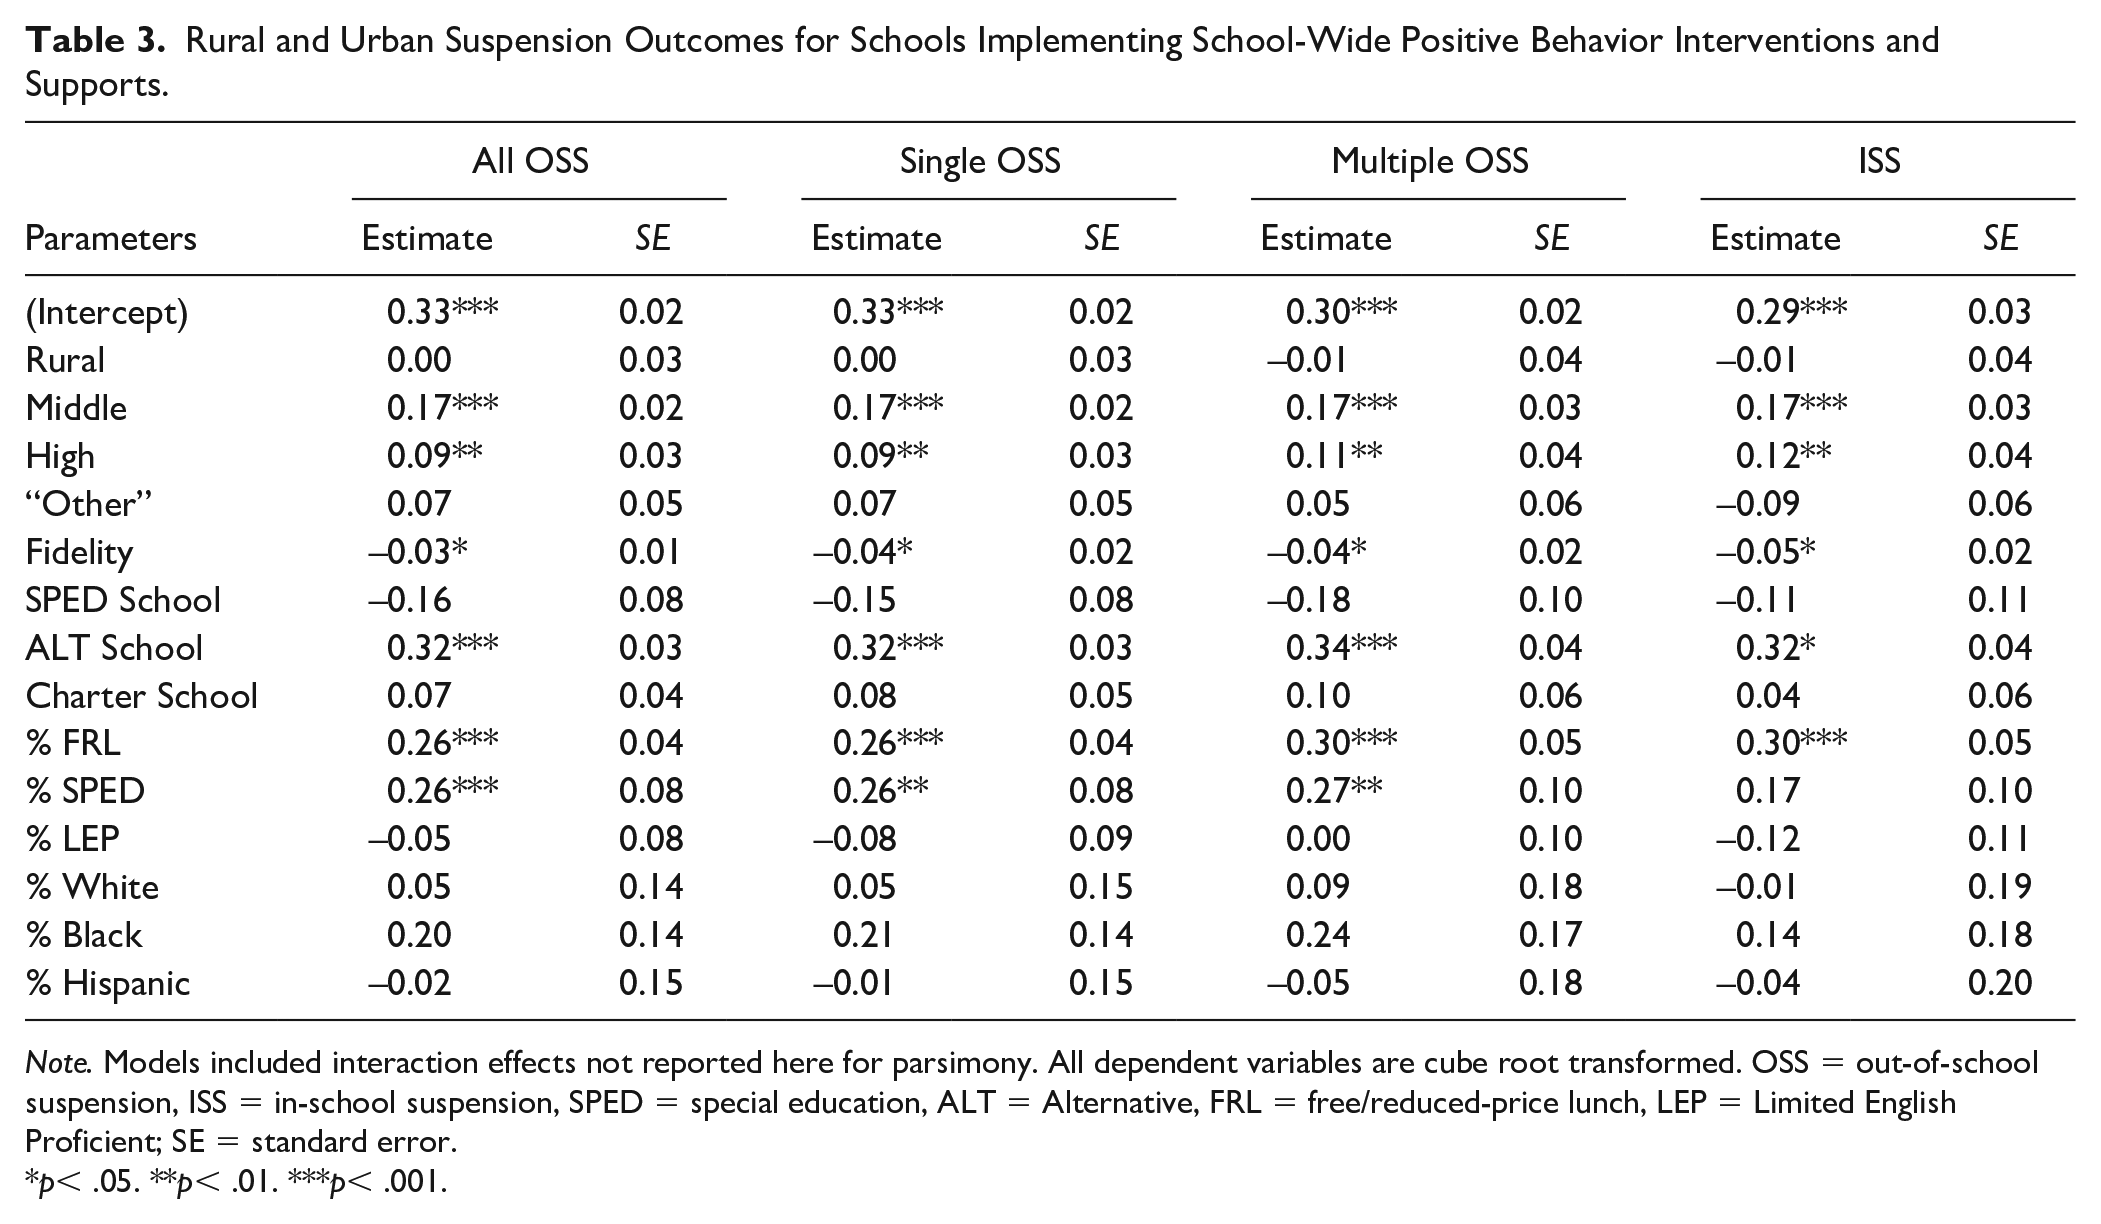
Note. Models included interaction effects not reported here for parsimony. All dependent variables are cube root transformed. OSS = out-of-school suspension, ISS = in-school suspension, SPED = special education, ALT = Alternative, FRL = free/reduced-price lunch, LEP = Limited English Proficient; SE = standard error.
p< .05. **p< .01. ***p< .001.
Suspension Outcomes for Schools Implementing and Not Implementing SWPBIS
Last, we compared schools implementing SWPBIS with schools not implementing SWPBIS in rural and urban settings. These models included treatment as an independent variable; therefore, we also estimated models with random slopes for treatment and compared the random intercept models to random intercept and random slope models. First, we estimated ICC values for all four outcomes. The average ICC for the three OSS outcomes was ~0.10, suggesting that only 10% of the variance in OSS was between districts. The ICC for ISS was 0.15, suggesting that only 15% of the variance was between districts. Next, we examined random slope models. The loglikelihood test suggested that the random slope models were significantly different than the random intercept-only models; therefore, we included a random slope for treatment in all subsequent models.
We ran a series of four models for each outcome. The first model estimated differences between schools implementing SWPBIS and schools not implementing SWPBIS in rural and urban schools, while the second added a third interaction for school grade level. We then reestimated the same models but used fidelity as the treatment indicator, meaning schools with BoQ scores >70%. Overall, we found no significant effects for the three-way interactions that included school grade level, so we focused on the models with the two-way interactions for SWPBIS and urban locale (rural or urban). Table 4 presents the results for the first models with SWPBIS implementation compared with non-implementation. We found that schools in rural settings used significantly fewer OSS than urban schools, while middle and high schools used significantly more OSS and ISS. We found a significant, positive interaction effect between rural settings and SWPBIS implementation. This suggests that schools implementing SWPBIS in rural settings use significantly more OSS than rural schools not implementing SWPBIS. However, this also indicates, and we confirmed, that urban schools implementing SWPBIS had statistically significantly fewer OSS than urban schools not implementing SWPBIS. No differences were found for ISS.
Rural and Urban Suspension Outcomes in Schools Implementing and Not Implementing School-Wide Positive Behavior Interventions and Supports.

Note. All dependent variables are cube root transformed. OSS = out-of-school suspension, ISS = in-school suspension, SWPBIS = School-Wide Positive Behavioral Interventions and Supports, SPED = special education, ALT = Alternative, FRL = free/reduced-price lunch, LEP = Limited English Proficient.
p< .05. **p< .01. ***p< .001.
Discussion
This study compared both implementation and suspensions for schools using SWPBIS in rural and urban schools. As noted, very little research has specifically compared rural and urban schools with regard to SWPBIS to determine if there are, in fact, differences in both implementation and outcomes. Overall, we found very few differences in universal implementation fidelity and that the odds of implementing with fidelity were equivalent for both rural and urban schools. We found that rural schools use fewer OSS than urban schools, regardless of SWPBIS implementation (i.e., implementing SWPBIS or not implementing). Finally, we found that rural schools implementing SWPBIS had more OSS than rural schools not implementing SWPBIS, while the opposite was true for urban schools; fewer OSS in schools implementing SWPBIS. Below, we connect these findings to research and recommendations for adapting professional development and planning technical assistance supports for rural schools.
Using a relatively large sample of schools implementing SWPBIS, we found the likelihood of reaching implementation fidelity at the universal level was the same for rural and urban schools. This suggests that the training strategies employed by FLPBIS are successfully meeting the implementation needs of rural schools. Yet, it is interesting that we did find a BoQ subscale difference. Notably, rural schools had significantly lower scores on the PBIS Team subscale, which includes only 3 items: “Team has administrative support,” “Team has regular meetings (at least monthly),” and “Team has established a clear mission/purpose.” There are several potential reasons for the difference when reviewing previous studies. In a study that looked at high needs schools, including rural schools, McDaniel et al. (2018) identified five factors to consider when implementing in high needs schools, including SWPBIS Readiness (e.g., buy-in and foundational skills) and Stakeholder Support (e.g., parents, administrators, teachers, and community). The results suggest that technical assistance with rural schools should consider these two factors as a high priority.
Adding to the complexity of perceptions versus outcomes, rural schools often have limited infrastructure such as personnel to facilitate a strong implementation process. It is common for SWPBIS teams to include specialized support personnel such as school psychologists, behavior analysts, and/or other district-supported staff. Therefore, limited support availability may lead to one person being responsible to do more things and serve multiple schools in a district, which may impact school teams meeting regularly. Berry et al. (2012) reported that rural districts struggle with hiring and retaining highly qualified special educators and Doss et al. (2017) indicated that there is a scarcity of school psychologists to meet the state’s needs. Despite limitations, some studies in rural schools have recognized and responded to the needs of a team by providing funding, time, and resources for SWPBS implementation in schools (Menendez et al., 2008). Oswald et al. (2005) reported that a middle school training included bi-monthly team meetings after school to reflect when they were able to meet and limited the meetings to 45 min. The need for dedicated team planning with skilled personnel appears to be critical for active SWPBIS implementation.
The absence of personnel with behavioral expertise to prevent and respond to behaviors may also contribute to our finding of higher OSS in rural schools compared with urban schools. Administrators in rural schools may be less likely to “buy-in” to SWPBIS and refrain from playing an active role in the implementation and team processes when consumed with discipline issues. Furthermore, Preston et al. (2013) noted that rural principals are less likely to be “highly qualified” and may have different, less evidence-based perspectives on school discipline. On the contrary, rural schools that implemented SWPBIS have reported strong administration support and buy-in (Curtis et al., 2010; Menendez et al., 2008). In one training across nine teams in a district, one of the schools was highlighted for its work and effective outcomes, including a 50% reduction in OSS (Fitzgerald et al., 2014). Among other practices, several included active principal participation: the principal was involved directly with the team, serving as the facilitator, and held a Principal’s Lunch once every quarter for students (one from each Grade 6–12) randomly selected for good behavior (Fitzgerald et al., 2014). The findings in this study both support and contradict earlier studies. Therefore, more research is needed, including qualitative and case study analyses, to better understand why there are discrepancies in the PBIS Team subscale, including any possible relation to administrative buy-in and support when compared to the level of implementation fidelity and student outcomes achieved. It is possible that SWPBIS training in rural schools may need to explicitly incorporate unique teaming approaches and incentives to support staff given the smaller number of personnel available in rural schools. For example, one rural district provided stipends to internal coaches for participation on the SWPBIS team (Cavanaugh & Swan, 2015). With more tasks expected across less personnel, careful consideration in providing effective and efficient support in rural settings is essential.
It is noteworthy that we found less faculty commitment and less classroom implementation in rural high schools than in urban high schools. Research on SWPBIS in high schools suggests it typically takes at least 3 years in high schools to reach implementation fidelity compared to 2 years in elementary schools (Nese et al., 2019). In addition, secondary educators often focus exclusively on academics rather than integrating behavior support, which might impact the adoption of classroom implementation (Flannery et al., 2013). Yet, when Bohanon et al. (2006) examined the SWPBIS implementation process in an urban high school, they found that staff perceived implementation as increasing in school-wide and classwide areas as the implementation progressed. Replication in a rural high school could provide insights as to whether the same perceptions exist and what might be needed to specifically support high schools in the implementation of SWPBIS in rural settings. Overall, more research is needed to explore differences in implementation levels and staff perceptions in rural high schools.
One of the primary reasons for implementing SWPBIS is to reduce disruptive behavior and, conjointly, reduce exclusionary discipline events, such as ISS and OSS. The results for schools implementing SWPBIS suggest that there are no differences in the rates of either of these disciplinary exclusions by urban locale (rural or urban). We also found that, although fidelity of implementation predicted decreased OSS and ISS, meaning better implementation results in fewer ISS and OSS, there was no significant interaction effect on fidelity by urban locale. Put differently, schools that implement with fidelity see fewer ISS and OSS, regardless of whether the school is rural or urban. This result becomes more relevant when paired with the finding for all rural and urban schools in Florida, which indicates urban schools use more OSS than rural schools. Contextualized as such, the results from the SWPBIS-only models would suggest that SWPBIS in urban schools must have a larger effect on OSS, and the models with all schools supported this finding. The full sample models’ results indicate that urban schools implementing SWPBIS are significantly reducing their use of OSS, while rural schools are not. We did not control OSS for prior years; therefore, the rural schools implementing SWPBIS may have used more OSS even before beginning to implement SWPBIS. This finding is intriguing given that Gage et al. (2018) found schools implementing SWPBIS with fidelity in Florida had reductions in OSS, specifically when disaggregated by race and disability status. It might be prudent to examine if there are differences in OSS rates that reflect the different demographical make-up of the rural settings compared with urban settings. It is also possible that as schools are trained in SWPBIS and map out their continuum of disciplinary practices, the suspension is included as an option that is less punitive than expulsion. If other alternatives are nonexistent and simply a more positive approach was adopted in the school setting, this might impact the number of suspensions used. Finally, schools that are trained in SWPBIS are asked to engage in data-based decision-making that promotes a system that collects and analyzes data. As schools reach higher rates of fidelity, ideally their outcomes should be more accurate. With that being said, it does not account for the reduction in the use of suspensions in urban schools, suggesting more research is needed to explore these differences in rural settings.
We believe that the last finding, indicating that rural schools implementing SWPBIS use more OSS than rural schools not implementing SWPBIS, suggests that rural schools may require more support to address OSS. This might include professional development that focuses on alternatives to suspension combined with additional training in preventive systems that would negate the use of suspensions as a disciplinary go-to. Gage and colleagues (2020) developed a series of recommendations for reducing suspensions, specifically when implementing SWPBIS. Among them are developing systematic alternatives for OSS and pairing any disciplinary practice with targeted intervention supports. For example, schools could emphasize more instructional approaches that include addressing the problem behavior in ISS, such as social skills or anger management programming, and then suggest that OSS be used for only the most extreme cases. In addition, one of the features of SWPBIS is that a continuum of approaches is used to address problem behavior, ideally starting with the least restrictive. It may be necessary to increase the training time for addressing this continuum in rural school settings to ensure positive instructional approaches are emphasized rather than more restrictive practices, such as the use of OSS. Given the findings from this study, training in SWPBIS for rural schools may benefit from intentionally emphasizing reductions in OSS as the desired outcome and systematically planning for explicit alternatives to suspensions.
Limitations
Although this study was designed to be statistically rigorous, some limitations necessitate discussion. First, all of the data were obtained from administrative records and cannot be independently confirmed. It is possible that schools under-reported their actual use of ISS and OSS, which would impact the results of the study. Second, we have no information about what behavior-related initiatives may have been implemented in the schools not implementing SWPBIS. Third, we do not have any information about the implementation of SWPBIS beyond universal (Tier 1) practices. OSS often results from more significant behaviors targeted by universal prevention practices. Therefore, schools implementing Tier 2 and Tier 3 interventions may actualize more significant impacts on OSS. Fourth, we included a series of covariates in all of our models, but there are other unmeasured or unavailable predictors. For example, having measures of OSS and ISS before schools began implementing SWPBIS would ensure that prior suspensions are not confounding the results. Last, we conducted this study in Florida. While the number of rural schools in this study was substantial, there are other states with more remote rural schools, such as Oregon or Montana. Therefore, the results may not generalize to other, more rural states.
Conclusion
To date, very little research has compared rural and urban schools’ implementation of SWPBIS. This study filled a clear gap in the literature, finding that overall, rural schools are just as likely to implement SWPBIS with fidelity as urban schools. However, some nuanced differences emerged, which should be explored with more refined research methods. We also found that there were no differences in OSS or ISS for urban and rural schools implementing SWPBIS. Yet, we also found that rural schools implementing SWPBIS use OSS more often than rural schools not using SWPBIS. As noted, urban schools implementing SWPBIS were using OSS significantly less than comparison urban schools. Therefore, with additional training, we believe that rural schools using SWPBIS can also decrease their OSS use.
Footnotes
Declaration of Conflicting Interests
The author(s) declared no potential conflicts of interest with respect to the research, authorship, and/or publication of this article.
Funding
The author(s) received no financial support for the research, authorship, and/or publication of this article.