
Abstract
We examined differences in the receipt and delivery of extended school year (ESY) services in the United States by locale as being rural, urban, or suburban. We found that there were significant differences in the percentage of students receiving ESY services according to locale, with rural local education agencies (LEAs) having a significantly lower percentage of students receiving ESY services. Additionally, we found that special education directors perceived the number of students receiving ESY services as generally being “about right” for their LEA. We also found that urban special education directors were significantly more likely to report that there should be less students receiving ESY services while rural special education directors were less likely to report this. We then found that rural LEAs generally reported providing significantly fewer types of ESY services offered than urban or suburban LEAs. Finally, we found that urban LEAs reported significantly higher attendance rates of students who attended ESY services as compared with rural LEAs.
In the United States, extended school year (ESY) services refer to those special education services provided by local education agencies (LEAs; e.g., school districts, cooperatives, and charter schools) that occur outside the typical 180-day school year (Burke & Decker, 2017; Sobeck, 2017). Not all students are eligible for ESY services yet criteria for determining eligibility for ESY services varies considerably by state and local education agencies (Queenan, 2015). As a result, the percentage of students receiving ESY services is also variable across LEAs (Barnard-Brak & Stevens, 2021), given this variability of criteria for determining eligibility for ESY services. In 2004, the Individuals with Disabilities Education Act (IDEA) was reauthorized and amended to specifically include the provision of ESY services to students with Individualized Education Programs (IEPs; i.e., 34 C.F.R. [Code of Federal Regulations] § 300.106). This revision to IDEA provided limited guidance as to what LEAs should do with respect to ESY services but more guidance as to what they cannot do in providing ESY services. Specifically, 34 C.F.R. § 300.106 (a) states with respect to ESY services:
(1) In implementing the requirements of this section, a public agency may not: (i) Limit extended school year services to particular categories of disability; or (ii) Unilaterally limit the type, amount, or duration of those services.
This legislative provision does not provide much guidance on how to determine eligibility for ESY services for states and their respective LEAs. Thus, a patchwork of federal case law preceding and after this 2004 reauthorization provides guidance to states and their respective LEAs (e.g., Armstrong v. Kline, 1979; Battle v. Pennsylvania [3rd Circuit], 1978; Johnson v. Independent School District No. 4 [1994 10th Circuit]; Reusch v. Fountain, 1994). From a review of this case law, there are two, frequently used criteria for determining eligibility for ESY services that have emerged across states and LEAs. The first criterion is the regression-recoupment standard, which states that eligibility for ESY services is warranted when a student experiences a substantial regression of skills and performance over the summer break and those skills or performance would not be readily recouped when returning to school (i.e., typically within the first six weeks of the school year; Queenan, 2015). The term substantial, in terms of regression, has not been explicitly defined in the case or legislative law; thus, what a state or LEA considers as substantial regression varies considerably. Barnard-Brak and Stevens (2021) surveyed a nationwide sample of special education directors of LEAs, where special education directors were asked to quantify substantial regression that is not readily recouped. The special education directors surveyed reported substantial regression that is not readily recouped within the first 6 weeks as being on average around 20% or 2 months (≈ 22%) loss in performance or skills.
The second criterion frequently used for determining eligibility for ESY services emphasizes the emergence of necessary or critical skills that a student may be at a pivotal point of acquiring. Thus, these emerging necessary or critical skills should be supported over the summer break via ESY services (Sobeck, 2017). These emerging necessary or critical skills can range from purely academic skills to behaviors but appear to more often be related to communication needs (i.e., speech therapy) or physical needs (i.e., physical or occupational therapy). There, however, is no clear definition as to what constitutes an emerging necessary or critical skill. Other less frequently used criteria for determining eligibility for ESY services include but are not limited to degree of impairment; educational structure at home; child’s rate of progress; availability of alternative resources; access to the inclusive environment; curricular areas that need continuous attention regardless of emerging critical or necessary skill; vocational needs; and any extenuating circumstances (e.g., Burke & Decker, 2017; Queenan, 2015; Sobeck, 2017). It appears that the current interpretation of ESY services is that these special education services over the summer break should not be provided to all students receiving special education services under IDEA as “summer school.” Rather, ESY services should serve as a means to provide a free, appropriate public education under IDEA by preventing substantial regression from occurring that would not be readily recouped or supporting the emergence of critical or necessary skills.
The number of students who should be receiving ESY services but are not is unknown. Barnard-Brak and Stevens (2019) noted that around 6% of students with IEPs nationwide received ESY services from the 2011 Kindergarten cohort of the Early Childhood Longitudinal Study (2011 ECLS-K; Tourangeau et al., 2018). This estimate was similar to what Barnard-Brak and Stevens (2021) subsequently found when surveying special education directors, with an estimate of 8% of students with IEPs receiving ESY services. Barnard-Brak and Stevens (2019) then estimated the number of students with IEPs who should be receiving ESY services but were not by examining academic achievement data of third- to fourth-grade and fourth- to fifth-grade students with IEPs using the 2011 ECLS-K data. Barnard-Brak and Stevens (2019) estimated that approximately 15% of students with IEPs should be receiving ESY services when considering regression in academic achievement scores over the summer break at 20% or more that was not readily recouped in the following fall semester from the 2011 ECLS-K data. This study, however, was limited to academic achievement scores when using the 2011 ECLS-K data and did not consider physical, communication, or behavioral outcomes in terms of regression without recoupment. Additionally, the 2011 ECLS-K data contained no variables identifying emerging critical or necessary skills. So, conservatively, there appears to be at least twice as many students with IEPs who should be receiving ESY services as Barnard-Brak and Stevens (2019) estimated that 6% of students with IEPs received ESY services when 15% should be receiving such. This estimate of students who should be receiving ESY services would be much higher than double when considering outcomes outside of academic achievement scores.
This discrepancy in the number of students who should be receiving ESY services versus the number of students with IEPs who are actually receiving services is not surprising considering the challenges that LEAs face in delivering ESY services. In studying ESY services in the state of Texas, Barnard-Brak et al. (2018) noted several challenges experienced by LEAs in delivering ESY services. These challenges included finding qualified personnel willing to work over the summer break, parental non-compliance, difficulty in determining eligibility for ESY services, and limited financial resources. In addition, these challenges appeared to be more pronounced in rural areas. Barnard-Brak et al. (2018) noted that rural special education directors reported significantly more barriers to providing ESY services as compared with their nonrural counterparts. Rural special education directors were also reported as having more difficulty in finding qualified personnel than nonrural special education directors (Barnard-Brak et al., 2018). The study was limited to special education directors in the state of Texas, which may not be generalizable to the nation as a whole, and noted the need for a broader study inclusive of more states. These challenges reported by special education directors, such as the need for better ability to determine eligibility for ESY services, also appeared to be associated with a significantly lower percentage of students receiving ESY services (Barnard-Brak & Benner, 2020).
The purpose of the current study was to examine differences in the receipt and delivery of ESY services nationwide by locale (rural, urban, or suburban). There is a clear need to identify whether there is a discrepancy in the number of students receiving ESY services in rural, suburban, and urban areas of the United States. To achieve this purpose, we examined four research questions in a study of special education directors from LEAs across 43 states. First, we examined whether there were differences in the percentage of students receiving ESY services according to whether the locale of the LEA was identified as being rural, urban, or suburban. Second, we asked special education directors about their perception as to the number of students receiving ESY services in their LEA with the response choices of “about right,” “should be less,” or “should be more” and then examined whether there were differences in the response of special education directors by locale (rural, urban, or suburban). Third, we examined whether there were differences in the types of ESY services offered by LEAs according to their locale. Fourth, we examined whether there were differences in the percentage of students eligible to receive ESY services who attended as reported by special education directors according to locale.
Method
Sample
The sample consisted of 835 special education directors across the United States who provided information about ESY services and the locale of their LEA via an online survey. The e-mail addresses of special education directors of LEAs were obtained via public record requests at the state level. A total of 43 states were represented in the sample with 10,043 e-mail addresses, of which all were contacted to participate in the survey. The response rate was approximately 8%, which was reasonable given it was an online survey without any incentive to participate. The remaining seven states not represented in the sampling frame could not (i.e., state did not maintain a list of LEA special education directors) or would not (i.e., state did not provide this information per law) provide the e-mail addresses of special education directors at LEA level. The mean number of years as a special education director was 7.70 (SD = 6.87). The mean number of years as an educator was 23.92 (SD = 8.99). As for locale, approximately 29% (n = 244) of special education directors reported being in a predominantly urban area while 59% (n = 491) reported being in a predominantly rural area and 12% (n = 108) reported being in a predominantly suburban area.
Measures
Special education directors responded to a survey delivered online via Qualtrics, which contained all measures derived in part from past research on ESY services (e.g., Barnard-Brak & Benner, 2020; Barnard-Brak et al., 2018; Barnard-Brak & Stevens, 2021). To assess locale, we asked special education directors to identify their LEA as predominantly rural, urban, or suburban. To calculate the percentage of students receiving ESY services, we asked special education directors to identify the number of students who received special education services via an IEP as per IDEA and the number of students with IEPs who received ESY services. We then divided the reported number of students who received ESY services by the number of students who had IEPs to discern the percentage of students receiving ESY services. This procedure to calculate the percentage of students receiving ESY services has been utilized in other research studies (e.g., Barnard-Brak & Benner, 2020; Barnard-Brak et al., 2018; Barnard-Brak & Stevens, 2021), given the lack of state or federal data sets on the receipt of ESY services. For the second research question, we asked special education directors whether the number of students receiving ESY services should be “less,” “more,” or was “about right.” This response was entirely self-reported by special education directors. For the third research question, we asked special education directors what services they offered as part of ESY services. These services included the categories of life skills; workplace or vocational skills; behavioral interventions; academic interventions; physical therapy; occupational therapy; speech therapy; and credit recovery. We should note that several special education directors later noted that credit recovery was not considered part of ESY services for their LEA. We also provided an open-ended response option of “Other” for special education directors to provide services not previously listed. This open-ended response leads to the creation of two additional categories of ESY services: orientation and mobility and social skills interventions. Table 1 provides the overall frequencies of each ESY service as reported by special education directors.
Percentages and Frequencies of ESY Services.
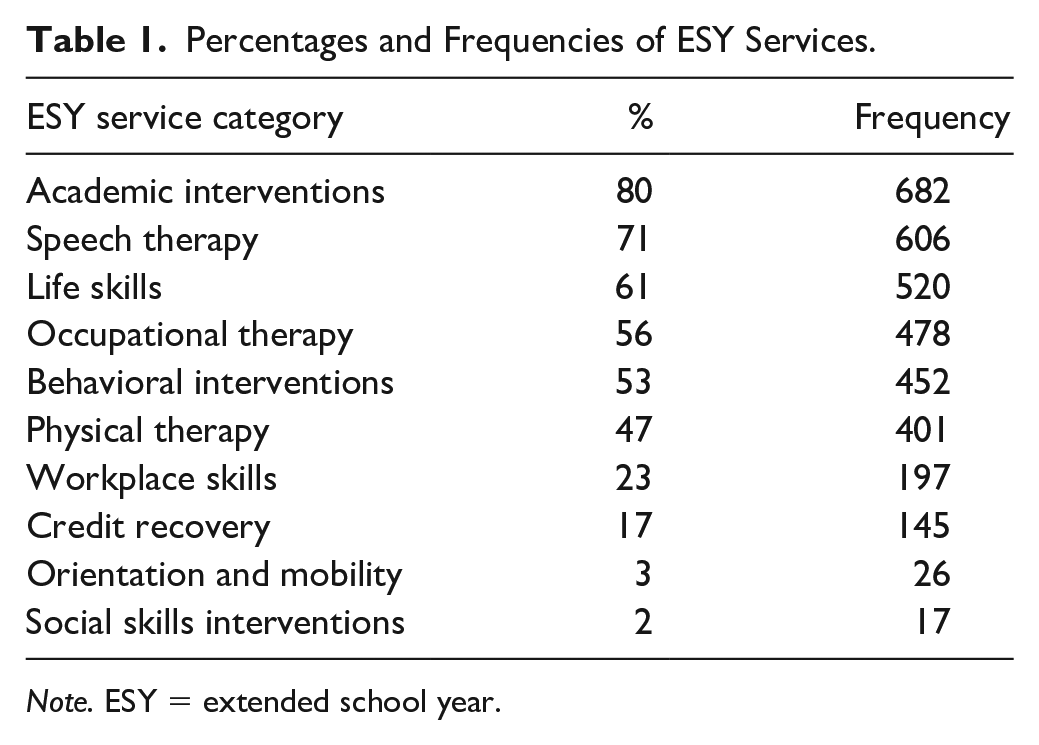
Note. ESY = extended school year.
For the fourth research question, we asked special education directors to identify the percentage of students eligible to receive ESY services who attended. Overall, special education directors reported 74% as the average percentage of students who were eligible to receive ESY services and attended.
Analyses
To answer the first and fourth research questions, we performed an analysis of variance (ANOVA). In evaluating the homogeneity of variances, this assumption was found not to be tenable, F(2, 852) = 19.57, p < .001. In situations where the assumption is violated, the degrees of freedom are adjusted and an alternative calculation of the F statistic (i.e. Welch’s) is utilized (Field, 2013). To measure effect size, we calculated Cohen’s f and d as the measures of effect size as appropriate. Values of Cohen’s f of 0.10, 0.30, and 0.50 and greater may be considered small, medium, and large, respectively (Cohen, 1988). Values of Cohen’s d of 0.20, 0.50, and 0.80 and greater may be considered as small, medium, and large, respectively (Cohen, 1988). To answer the second and third research questions, we performed chi-square (χ2) tests for independence. To measure the degree of association, we calculated phi (Ф) coefficient values where values of 0.10, 0.30, and 0.50 and greater may be considered as small, medium, and large, respectively (Cohen, 1988). The statistical significance (α ≤ .05) of individual table cells was evaluated according to the values of the standardized residuals being greater than the absolute value of |1.96| for significance at the .05 level or less.
Results
Percentage of Students Receiving ESY Services
The mean percentage of students receiving ESY services in rural areas was 9% (SD = 0.13) while for urban, the mean was 16% (SD = 0.22) and for suburban areas, the mean was 13% (SD = 0.18). In testing whether there were differences in the percentage of students receiving ESY services by locale, we found statistical significance, F(2, 791) = 13.58, p < .001, f = 0.17. Special education directors from predominantly rural LEAs reported a significantly lower percentage of students receiving ESY services as compared with predominantly urban LEAs, p < .001, d = 0.38. There was no statistically significant difference in the percentage of students receiving ESY services when comparing predominantly urban and suburban LEAs. In conducting subsequent analyses for the third research question, we statistically controlled for the percentage of students receiving ESY services as reported by special education directors.
Perception About ESY Services
Overall, special education directors reported overwhelmingly that the number of students receiving ESY services in their LEA was “about right” with 74% (n = 608) responding this way. Approximately 11% (n = 90) of special education directors reported that the number of students receiving ESY services in their LEA should be less while approximately 15% (n = 126) stated that there should be more students receiving ESY services. When we asked special education directors about their perception as to the number of students receiving ESY services in their LEA, there were statistically significant differences according to locale with respect to the response choices of “about right,” “should be less,” or “should be more” as to the number of students receiving ESY services, χ2(4) = 28.76, p < .001, Cramer’s V = 0.13. Special education directors of urban LEAs were more likely to report that there should be less students receiving ESY services. Conversely, special education directors of rural LEAs were significantly less likely to report that there should be less ESY services. Table 2 provides the percentages and frequencies for these responses by locale.
Percentages and Frequencies of Responses Regarding Number of Students Receiving Services by Locale.

ESY Service Type
Overall, rural LEAs were significantly more likely not to offer ESY services at all as compared with urban LEAs as reported by special education directors, χ2(2) = 23.88, p < .001, Ф = 0.17. Rural LEAs were significantly less likely to offer life skills as an ESY service as compared to urban LEAs as reported by special education directors, χ2(2) = 29.31, p < .001, Ф = 0.19. Rural LEAs were also significantly less likely to offer workplace or vocational skills as an ESY service as compared to urban LEAs as reported by special education directors, χ2(2) = 33.14, p < .001, Ф = 0.20. This trend of urban LEAs being more likely to offer ESY services than rural LEAs continued across service type such as: physical therapy, χ2(2) = 19.32, p < .001, Ф = 0.15; occupational therapy, χ2(2) = 18.44, p < .001, Ф = 0.14; speech therapy, χ2(2) = 15.49, p < .001, Ф = 0.14; behavioral interventions, χ2(2) = 50.95, p < .001, Ф = 0.25; and academic interventions, χ2(2) = 26.22, p < .001, Ф = 0.18. There were no significant differences in LEAs offering credit recovery, orientation and mobility services, or social skills interventions by locale as reported by special education directors.
Percentage of Students Attending ESY Services
There were statistically significant differences in the percentage of students who attended ESY services according to locale as reported by special education directors, F(2, 776) = 9.68, p < .001, f = 0.14. Urban LEAs reported significantly higher percentages of students who attended ESY services as compared with rural (d = 0.36) and suburban LEAs (d = 0.44) as reported by special education directors. Urban LEAs reported an average 81% attendance rate as compared with an average 71% attendance rate for rural LEAs and an average 70% attendance rate for suburban LEAs as reported by special education directors.
Discussion
As the majority of special education directors of LEAs reported the percentage of students receiving ESY services was “about right,” this result indicates that special education directors do not perceive that any more students should be receiving ESY services under their state and local guidelines. This perception may be one part of why more students do not receive ESY services despite estimates indicating that many more students (at least twice as many) should be receiving ESY services (Barnard-Brak & Stevens, 2019). The status quo of a minimal number of students receiving ESY services may have become ingrained as an organizational norm. Organizational norms can be difficult to challenge, especially when special education directors can face far more pressing challenges in a typical school year. As evidence, it is interesting that the challenges identified by special education directors in providing ESY services have not included the number of students attending these services. For instance, Barnard-Brak et al. (2018) noted that special education directors reported having difficulty in finding qualified personnel, determining eligibility (at the state level as well; Barnard-Brak & Benner, 2020), and coordinating transportation but not in the actual number of students who should attend (Barnard-Brak et al., 2018). In this way, the status quo can be a function of perceived organizational capacity such that special education directors could perceive that the number of students receiving ESY services was “about right” when considering the context of their organization’s capacity to provide these services in terms of finding qualified personnel, transportation, and a myriad of other factors. An organization’s perceived capacity can permeate the expectations of its personnel to achieve its goals. However, it should be noted that there may be a myriad of other factors that could be influencing the perception by special education directors that the percentage of students receiving ESY services was “about right.”
Additionally, a special education director’s perception of ESY services received may also derive from comparison with nearby, similar LEAs in their state such as overall performance or locale being rural, urban, or suburban. Perceptions of special education directors about the receipt of ESY services appeared to align with the percentage of students receiving ESY services by locale—rural, urban, or suburban. For instance, special education directors of urban LEAs were more likely to report that there should be less students receiving ESY services and their percentage of students receiving ESY services was correspondingly higher than rural LEAs. The vice versa occurred for special education directors of rural LEAs, who were significantly less likely to report that there should be less students receiving ESY services. Special education directors from rural LEAs then reported a significantly lower percentage of students receiving ESY services as compared with predominantly urban LEAs. Given this finding, it is no surprise that Barnard-Brak et al. (2018) found that rural special education directors reported significantly more barriers to providing ESY services as compared with their nonrural counterparts.
Results also indicate that special education directors from rural LEAs were significantly more likely to report not offering ESY services at all as compared with urban LEAs. Rural LEAs were also significantly less likely to offer many types of ESY service as compared with urban LEAs as reported by special education directors. Urban LEAs also reported significantly higher percentages of students who attended ESY services as compared with rural and suburban LEAs as reported by special education directors. These results are not surprising when considering that special education directors from rural LEAs have reported more challenges to providing ESY services than their urban counterparts (Barnard-Brak et al., 2018). Rural LEAs in general appear to be less well-resourced than their urban counterparts. Additionally, the lower population density and geographical expanse of rural LEAs could preclude the efficient and effective delivery of ESY services over the summer break. These findings further support the hypothesis that ESY services are a function of locale and any response to interventions for students must consider how their geographical location may be influencing whether and the type of services that are provided. Rural special education directors have also been reported as having more difficulty in finding qualified personnel than non-rural special education directors (Barnard-Brak et al., 2018), which may contribute to the issue of types of services such as physical therapy or speech therapy requiring specialized personnel.
Limitations
Two primary limitations emerged as part of conducting the current study. First, we asked special education directors if the percentage of students receiving ESY services should be “less,” “more,” or was “about right,” but not why they thought this was the case. Qualitative research should follow-up with special education directors to discern why they had this perception. This perception could be based upon an understanding of their LEA’s capacity to provide these services or some other narrative. Second, we asked special education directors to self-identify their LEA as rural, urban, or suburban. The identification of their locale could be inaccurate. In comparing percentages reported against a report from the National Center for Education Statistics (NCES, 2013), it appears that the report of locale of LEAs was somewhat accurate. The NCES (2013) reported that approximately 57% of LEAs being rural, 23% of LEAs as being located in cities/towns (i.e., urban), and 20% being located in suburban areas. Our sample consisted of approximately 29% of LEAs being urban, 59% being rural, and 12% being suburban. Discrepancies do appear in the identification of suburban versus urban LEAs, which is understandable. Yet, the identification of LEAs as rural by special education directors at 59% was pretty close to the national statistics reporting 57% of LEAs being rural.
Conclusions
We examined differences in the receipt and delivery of ESY services nationwide by locale as being rural, urban, or suburban. We found that there were significant differences in the percentage of students receiving ESY services according to locale with rural LEAs having significantly lower percentages. Next, we found that special education directors perceived the number of students receiving ESY services as generally being “about right.” We also found that urban special education directors were significantly more likely to report that there should be less students receiving ESY services while rural special education directors were less likely to report this. We then found that rural LEAs generally provided significantly fewer types of ESY services offered than urban or suburban LEAs. Finally, we found that urban LEAs reported significantly higher attendance rates of students who attended ESY services as compared with rural LEAsT.
Footnotes
Declaration of Conflicting Interests
The author(s) declared no potential conflicts of interest with respect to the research, authorship, and/or publication of this article.
Funding
The author(s) received no financial support for the research, authorship, and/or publication of this article.