
Abstract
Background
Tube current is an important determinant of radiation dose and image quality in X-ray-based examination. The combined automatic tube current modulation technique (ATCM) enables automatic adjustment of the tube current in various planes (x-y and z) based on the size and attenuation of the body area scanned.
Purpose
To compare image quality and radiation dose of the ATCM with those of a fixed tube current technique (FTC) in CT of the abdomen and pelvis performed with a 16-slice multidetector row CT.
Material and Methods
We reviewed 100 patients in whom initial and follow-up CT of the abdomen and pelvis were performed with FTC and ATCM. All acquisition parameters were identical in both techniques except for tube current. We recorded objective image noise in liver parenchyma, subjective image noise and diagnostic acceptability by using a five-point scale, radiation dose, and body mass index (BMI, kg/m2). Data were analyzed with parametric and non-parametric statistical tests.
Results
There was no significant difference in image noise and diagnostic acceptability between two techniques. All subjects had acceptable subjective image noise in both techniques. The significant reduction in radiation dose (45.25% reduction) was noted with combined ATCM (P < 0.001). There was a significant linear statistical correlation between BMI and dose reduction (r = –0.78, P < 0.05).
Conclusion
The ATCM for CT of the abdomen and pelvis substantially reduced radiation dose while maintaining diagnostic image quality. Patients with lower BMI showed more reduction in radiation dose.
Recent advances in computed tomography (CT) have greatly increased the clinical application of CT, especially since the advent of multidetector row CT (MDCT) technology (1, 2). However, increasing radiation doses to the population have raised a compelling case for reduction of radiation exposure from CT (2–4). The risk of radiation induced cancer would increase in a linear fashion at lower dose without a ‘safe’ threshold (5, 6). Increasing awareness of risks associated with radiation exposure mandates lowest possible radiation exposure to patients from CT studies while maintaining optimum image quality (7).
Tube current is an important determinant of radiation dose and image quality in X-ray-based examination. When all other factors are held constant, the radiation dose is linearly related to the current-time value (3). Automatic tube current modulation in CT is analogous to the automatic exposure control, which has been used in conventional radiography for automatically terminating radiographic exposure once the predetermined radiographic density has been obtained. In the automatic tube current modulation (ATCM) technique, tube current can be decreased automatically for regions with lower attenuation while maintaining an acceptable level of image noise and improving radiation dose efficiency. The ATCM technique enables automatic adjustment of the tube current in various planes (x-y and z) based on the size and attenuation of the body area scanned (8–13).
The purpose of our study was to compare image quality, diagnostic acceptability, and radiation dose of the ATCM technique with those of a fixed tube current (FTC) technique in CT of abdomen and pelvis performed in the same patient with a 16-slice MDCT.
Material and Methods
Patient and examination protocol
Our institutional review board of the hospital approved this retrospective study with a waiver of informed consent. Between February 2007 and May 2009, 100 consecutive adult patients who underwent follow-up contrast-enhanced CT examination of the abdomen and pelvis with a 16-slice MDCT (Somatom Sensation 16, Siemens Medical Solutions, Erlangen, Germany) by using both FTC techniques and combined or x-y and z axes ATCM techniques (CARE Dose 4D, Siemens) in the same patient were identified. Initial and follow-up CT examinations were indicated for assessment of abdominal or pelvic pathology in all patients. A total of 54 men and 46 women (mean age 60 ± 14 years, age range 21–87 years) were included in this study. Body mass index (BMI, kg/m2) of subjects in the study group had been recorded prior to CT. Mean weight and BMI of the patients recorded prior to CT with combined ATCM was 58.36 ± 9.59 kg (range of 39.5–83.9 kg) and 22.56 ± 3.06 kg/m2 (range of 16.04–30.16 kg/m2), respectively. The mean interval between the two examinations was 5.6 ± 3.69 months (range 1–15 months). There was no significant change in body weight of the patients between two CT exams with ATCM and FTC technique (P = 0.6327).
Fixed or constant tube current techniques were used with an effective milliampere-second value of 165 mAs. Combined or x-y and z axes modulation techniques were used with an image quality reference of 160 mAs for scanning the same patients. The effective milliampere-second setting can be defined as the tube current–time product divided by the pitch factor. The range of tube current in the ATCM technique was 75–142 mAs (minimum and maximum value for the 100 patients).
CARE Dose 4D (Siemens) was used as the ATCM technique, which controls and modulates the current in the x, y, and z directions to achieve and maintain a uniform user selected image quality in the images. For the z-axis modulation component, an attenuation profile along the patient's long axis (z-axis) is measured in the direction of the projection on the basis of a single localizer radiograph. The attenuation profile consists of information regarding the patient's size, anatomic shape, and density at each position in the z-axis. On the basis of these attenuation profiles, axial tube current values are calculated to adapt tube current for z-axis modulation. An analytic function defines the correlation between attenuation profile and tube current for slice position in the z-axis and adapts the tube current to patient size and attenuation changes. Tube current adjustment is based on a user-defined image quality reference milliampere-second setting to maintain the desired image quality in all images along the scanning direction (z-axis modulation component). On the basis of these levels, the technique also modulates the tube current during each tube rotation according to the patient's angular attenuation profile (angular modulation component). The image quality reference mAs value is selected according to the diagnostic requirements and the preference of the radiologist. For a given scanning protocol, this value reflects the effective mAs that is used for a reference patient defined as a typical adult weighing 70–80 kg (for adult protocols). The combined modulation technique adapts tube current to the size of the individual patient on the basis of the image quality reference mAs value, which is changed only if an adjustment to image quality is required and not for individual patient size. The software determines whether a patient is slim or obese from the localizer radiograph and modulates the dose based on the preselected modulation strength for these patients. Image quality and radiation dose can be controlled by selecting an appropriate setting of combined modulation and image quality reference mAs value (12, 14).
Other scanning parameters were in constant use. These included a tube voltage of 120 kVp (peak), 0.5 s gantry rotation time, 16 × 1.5 mm detector configuration, 24 mm table feed per gantry rotation, 5 mm reconstructed slice thickness, 5 mm slice interval, and B31 medium soft tissue reconstruction kernel, and modulation setting with a strong increase setting for obese patients and a weak decrease modulation for slim patients.
Image quality
Image quality was assessed on the contrast-enhanced portal phase images. Quantitative evaluation of image quality was based on an evaluation of image noise. Image noise was recorded for each examination in the liver parenchyma at the level of the porta hepatis. For measurement of the image noise, a circular or ovoid region of interest with a size of 1.0 cm2 was placed in a homogeneous region of liver parenchyma without obvious vessels or focal liver lesions. The standard deviations (SDs) of the attenuation in these regions of interest were measured three times in three different places and the mean value of SDs was recorded. The SD, in Hounsfield units, of the attenuation in a particular region of interest was used as a noise measurement (8, 12, 14). Qualitative image scoring was performed independently by two subspecialty radiologists (one with 12 years of experience and the other with 4 years of experience) who were unaware of the scanning techniques used. Each radiologist was shown CT image stacks in random order one by one. They independently scored CT images for subjective image noise and diagnostic acceptability by using a five-point scale at five anatomic levels (i.e. the upper liver at the level of the diaphragm, porta hepatis, right kidney hilum, iliac crest, and upper margin of the acetabulum) in an absolute manner. These subjective image quality parameters were selected on the basis of prior studies (12, 14–16).
The readers were asked to score subjective image noise on a 5-point scale: 1, too much noise; 2, more than acceptable noise; 3, acceptable noise; 4, better than average noise; and 5, very little noise. Image noise was considered as acceptable if there was average mottle or graininess with acceptable visualization of anatomic structures and interfaces between structures with different attenuation.
The readers were also asked to rate diagnostic acceptability using the following 5-point scale: 1, unacceptable; 2, below average; 3, average; 4, above average; 5, excellent. Diagnostic quality was considered as acceptable if sharpness of different structures, contrast resolution, and lesion visualization were satisfactory. Diagnostic quality was described as unacceptable if these image attributes were unsatisfactory, or as excellent if visualization was considerably superior. Images from all examinations were assessed at the same window level and window width (40 and 400 HU, respectively). The degree of graininess or mottle on the image was the main factor considered in the scoring of image noise. Diagnostic acceptability was graded on the basis of confidence in diagnosis of disease at that level. A score of greater than or equal to 3 was considered as an acceptable level of artifacts or as constituting adequate diagnostic acceptability.
Radiation dose
We recorded the CT dose index volume (CTDIvol) and dose–length product (DLP) for contrast-enhanced portal phase images as a CT radiation dose descriptor for comparison of radiation exposure with ATCM and FTC techniques. Dose reduction (mGy) was calculated by equation of CTDIvol of FTC – CTDIvol of ATCM, and percentage dose reduction by (CTDIvol of FTC – CTDIvol of ATCM)/CTDIvol of FTC *100.
Statistical analysis
Objective image noise of ATCM and FTC was compared by using Wilcoxon signed rank test and statistical software (PASW 17.0, by SPSS Inc., Chicago, IL, USA). Image quality scores for subjective image noise and diagnostic acceptability between ATCM and FTC were compared by using the generalized estimating equations method with Bonferroni's correction (17, 18). CTDIvol and DLP of two different techniques were also compared by using paired t-test. Correlation between patient BMI and CTDIvol, DLP, and dose reduction in ATCM compared to FTC were evaluated by using Spearman correlation analysis with Bonferroni's correction.
The cut-off level of BMI of significant dose reduction with preserved quantitative image quality was analyzed by using minimum P value approach with Miller and Siegmund correction to prevent for false-positive error to be inflated due to multiple testing (19). This is the method to find the cut-off value with the minimum P value adjusting inflated false-positive error due to multiple testing. The degree of inter-observer concordance was determined with calculation of κ statistics. A P value of less than 0.05 was considered to indicate a statistically significant difference.
Results
Image quality
The values of objective image noise and the scores of subjective image noise and diagnostic acceptability for studies performed with ATCM and FTC are summarized in Tables 1 and 2. There was no significant difference in the objective image noise values between two acquisition techniques (P = 0.684). There was no significant difference in scores for subjective image noise and diagnostic acceptability between images obtained with two different techniques in both readers (P = 0.6252 and P = 0.6832 in reader 1, and P = 0.8356 and P = 0.7142 in reader 2, respectively). All of these qualitative image scores were more than 3 considered as an acceptable level of artifacts or as constituting adequate diagnostic acceptability.
Comparison of average CT dose index volume (CTDIvol), dose-length product (DLP), and objective image noise between ATCM (automatic tube current modulation) and FTC (fixed tube current) techniques
Comparison of subjective image noise and diagnostic acceptability
*Median (range, minimum and maximum value)
ATCM = automatic tube current modulation; FTC = fixed tube current
Radiation dose
The average and SD values of CTDIvol and DLP for CT examinations performed with different tube current techniques are summarized in Table 1. A significant reduction in radiation dose was noted with the ATCM compared with the FTC technique (P < 0.0001). There was a reduction (from 12.87 to 7.05 mGy) in radiation dose for ATCM. The average reduction in radiation dose with ATCM was 45.3 ± 8.06% compared with the FTC technique (range 22.5–59.2%). The example case with radiation dose reduction of 57.6% using the combined ATCM is illustrated (Fig. 1).
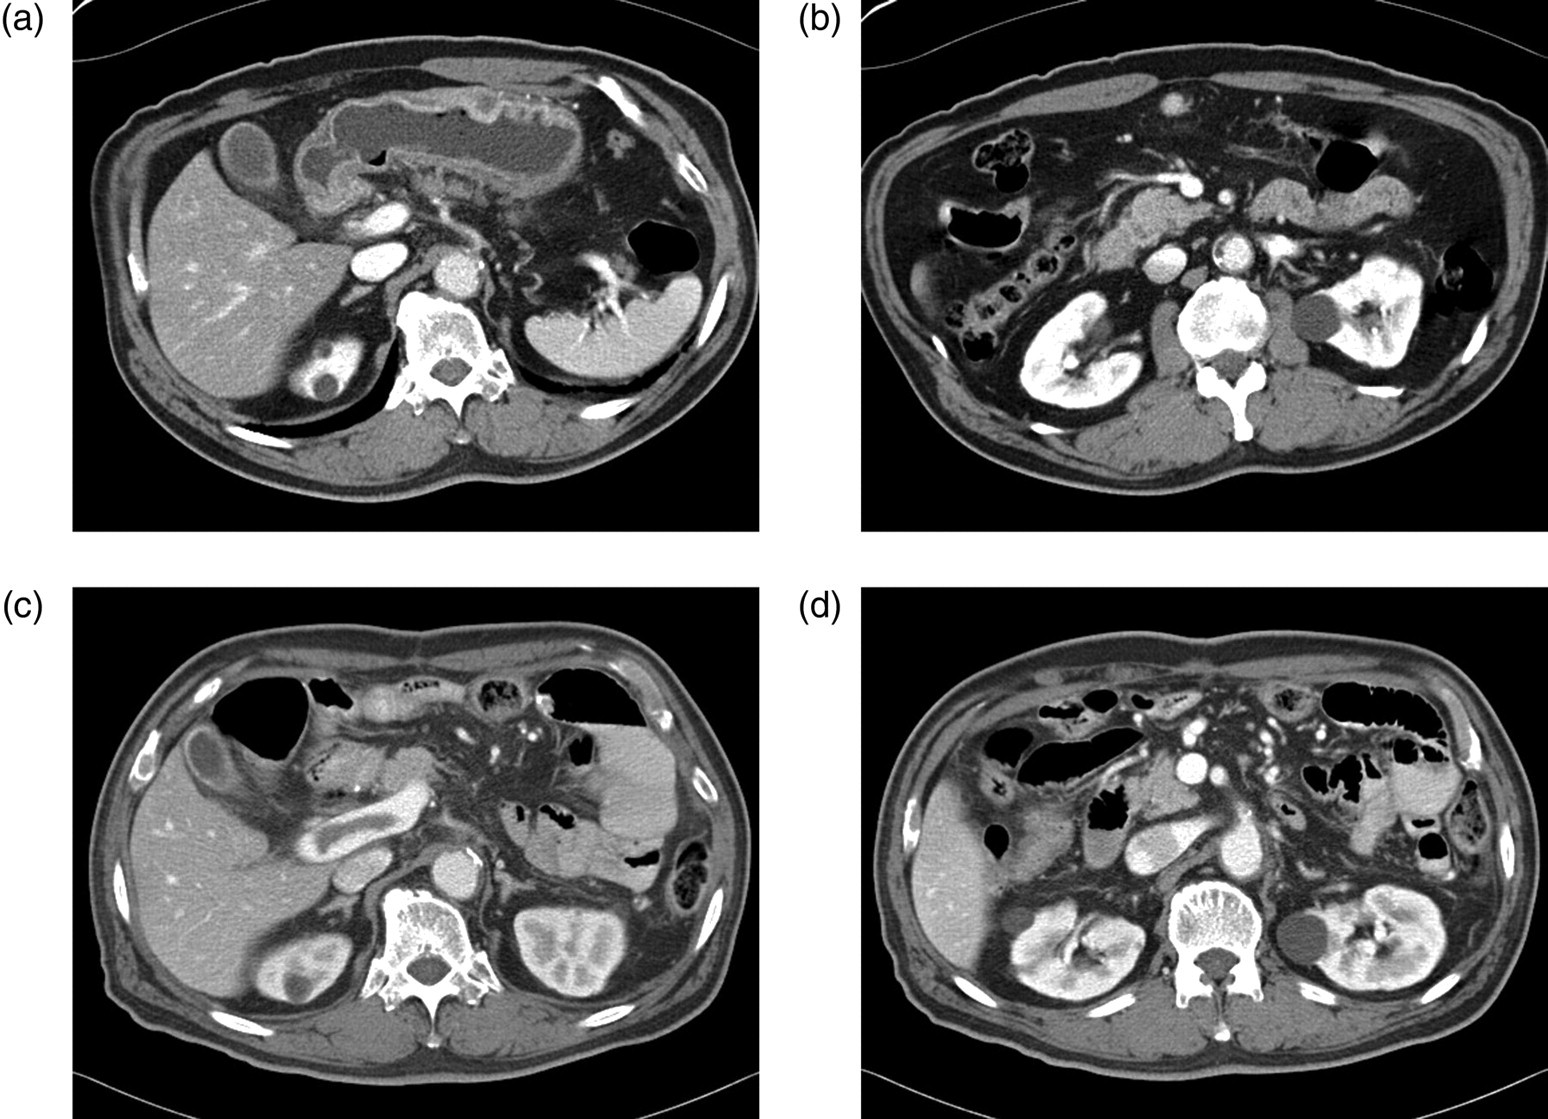
Transverse CT images acquired with ATCM (a, b) and FTC technique (c, d) in a 66-year-old man (BMI 29.09 kg/m2, 69 kg). Objective image noise for ATCM and FTC were 12.03 and 13.5, respectively, and all qualitative image scores were more than 3 in two readers. Radiation dose reduction of 57.6% was noted with the combined ATCM
For examinations performed with ATCM technique, a significant linear statistical correlation between patient BMI (kg/m2) and CTDIvol (r = 0.78, P = 0.0006) was found (Fig. 2). Significant linear correlations was also found between patient BMI (kg/m2) and radiation dose reduction in CTDIvol (r = −0.78, P = 0.0006). For examinations performed with FTC technique, statistical analysis was not possible for correlation between patient BMI and CTDIvol because CTDIvol with FTC were same in all patients. The cut-off level of BMI of significant dose reduction with preserved quantitative image quality was 21.8 kg/m2 (P < 0.0001) using ATCM. Patients with less than 21.8 kg/m2 showed more significant dose reduction compared to them with more than 21.8 kg/m2. Objective image noise in patients with more than 21.8 kg/m2 BMI was higher than that in patients with lesser than the cut-off level of BMI (13.137 ± 1.86 vs. 12.18 ± 1.43, P = 0.0006). No significant difference were found in subjective image noise (P = 0.96 in reader 1 and P = 0.10 in reader 2) and diagnostic acceptability scores (P = 0.34 in reader 1 and P = 0.80 in reader 2) between the patients with less than 21.8 kg/m2 and them with more than 21.8 kg/m2 in ATCM technique.
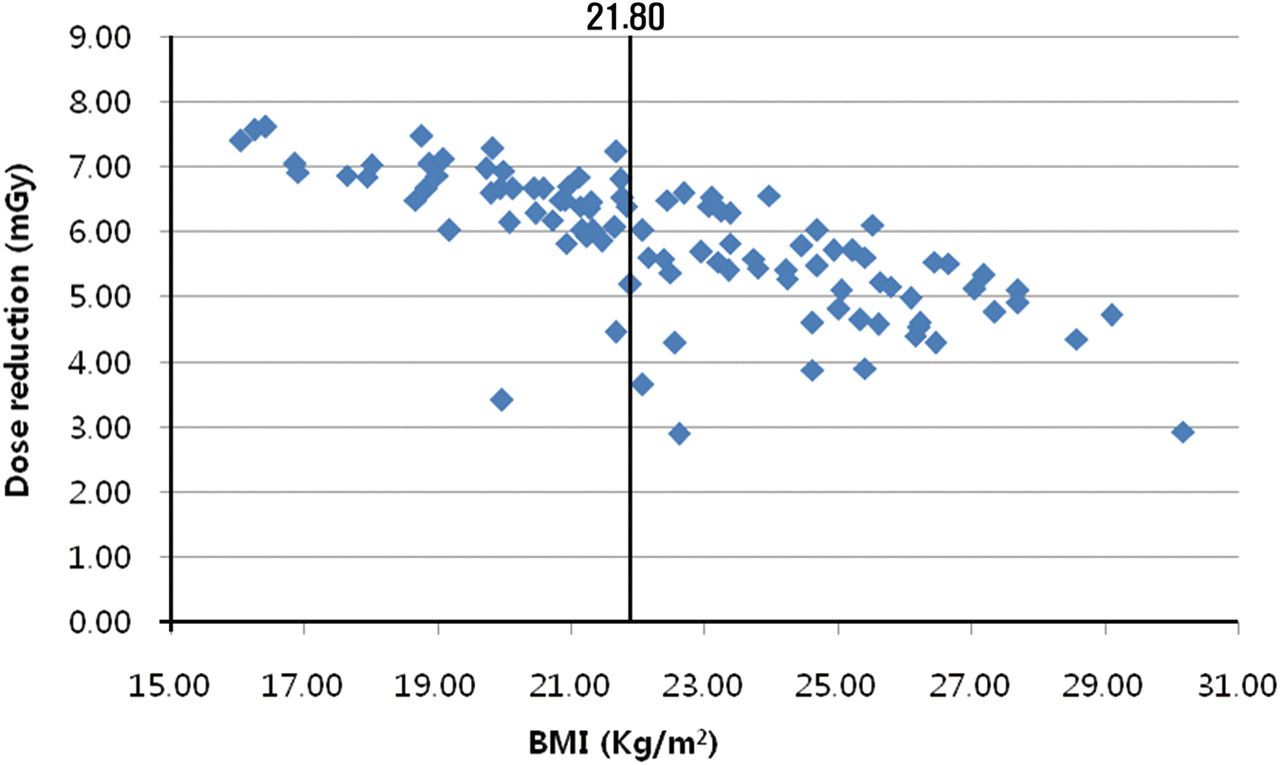
Linear statistical correlation between patient BMI (kg/m2) and radiation dose reduction in CTDIvol (mGy). Patients with less than 21.8 kg/m2 showed more significant dose reduction compared to those with more than 21.8 kg/m2
Inter-observer agreement
There was a good inter-observer agreement between the two radiologists for assessment of both subjective image noise and diagnostic acceptability (weighted κ coefficient 0.87 and 0.83, P < 0.0001).
Discussion
Optimization of scanning techniques to maintain diagnostic image quality at the lowest possible radiation dose has become very important with the concerns about increasing uses of CT and the associated radiation dose (1, 20). Angular or x-y modulation techniques automatically adjust the tube current for each projection angle to the attenuation of the patient to minimize X-rays in a particular scanning plane, for example, lower tube current is used in the anteroposterior projection compared to the lateral projection. The z-axis modulation technique adjusts the tube current from section to section, depending on regional body anatomy. Combined, or x-y and z axes, automatic tube current modulation techniques vary the tube current both during gantry rotation and along the z-axis of the patient. This is one of the most comprehensive approaches to CT dose reduction because the X-ray dose is adjusted according to patient-specific attenuation in all three planes (8–13).
Results of previous studies with the angular ATCM technique have reported a substantial reduction in radiation dose ranging from 15–50% (21–25). Likewise, the effects of z-axis modulation on image quality and radiation dose had been reported. Kalra et al. reported 33% of mean tube current-time product reduction with similar noise and diagnostic acceptability for abdominal and pelvic CT by using z-axis ATCM compared with FTC technique (16). Radiation dose reduction of 56–77% for urinary tract stone CT study and of 18–26% for chest CT study with use of z-axis ATCM without compromising diagnostic acceptability was reported (9, 26).
Rizzo et al. reported that the use of a combined modulation technique resulted in a substantial reduction (42–44%) in the radiation dose, with acceptable image artifacts and diagnostic acceptability, compared with using a constant tube current, in scans of the abdomen and pelvis, but different patients were assessed for each technique. They also reported a linear correlation between patient weight and CTDIvol for studies performed with combined modulation (12). Implementation of the x-y and z-axis dose modulation (ATCM) technique for neuroradiology CT examinations also revealed substantial dose reduction (50.4%) while maintaining image quality, compared with no dose modulation or z-axis modulation only (27). Lee et al. reported similar results (18% reduction) comparing ATCM with FTC technique in different patients for each technique. They did not correlate the image quality and radiation exposure with patient weight or cross-sectional dimensions (14).
This study is in agreement with the prior reports for the effects of ATCM on image quality and radiation dose (12, 14, 27, 28). The results suggest that ATCM technique for CT of abdomen and pelvis provided substantial reduction in radiation dose with constant diagnostic image quality compared with the FTC technique. To the best of our knowledge, this is the first study to compare image quality and radiation dose associated with CT of the abdomen and pelvis using both ATCM and FTC technique in the same patient.
In our study, there was no statistically significant difference in objective image noise and scores for subjective image noise and diagnostic acceptability between images obtained with ATCM and FTC, which meant preserved diagnostic performance at images of ATCM. All of qualitative image scores were more than 3, which considered as an acceptable level of artifacts or as constituting adequate diagnostic acceptability.
Our result showed a significant linear statistical correlation between patient BMI and CTDIvol with ATCM technique, which corroborates the findings of other studies (12, 16, 29). In addition, negative linear correlation between patient BMI and radiation dose reduction was found. In other words, patients with lower BMI showed more reduction in radiation dose with ATCM technique. There was no previous report in which correlation between BMI and the amount of reduction in radiation dose at ATCM was investigated. The cut-off level of BMI of the most significant dose reduction with preserved quantitative image quality in this study was 21.8 kg/m2. The reduction in radiation dose was noted with the ATCM compared with the FTC in all patients with a range of 22.5–59.2%. Even in one patient with the largest BMI more than 30 kg/m2 (30.16 kg/m2), dose reduction of 22.77% with 4 points of subjective image noise and 3 points of diagnostic acceptability scores, representing acceptable image quality was noted with the ATCM. These findings may justify the use of the ATCM technique for standard CT of abdomen and pelvis, and especially for the patients with BMI lower than 21.8 kg/m2.
There were two limitations in this study. We did not estimate the effective dose for ATCM and FTC techniques. However, CTDIvol and DLP are currently the standard parameters used to describe CT-associated radiation doses; thus, we considered these parameters useful in assessing the radiation dose (12, 14, 30, 31). Obese patients with BMI more than 30 kg/m2 were not included except one patient (30.16 kg/m2), because majority of our study group were oncologic patients undergoing regular follow-up CT scanning.
In conclusion, the ATCM technique for CT of abdomen and pelvis substantially reduced radiation exposure dose and maintained diagnostic image quality. Patients with lower BMI showed more reduction in radiation dose, and patients with BMI less than 21.8 kg/m2 showed more significant reduction in radiation dose. These results justify the use of the ATCM technique for standard CT of abdomen and pelvis, and especially for the patients with BMI less than 21.8 kg/m2.
Footnotes
ACKNOWLEDGEMENTS
The authors thank Suk Hee Kim and Seon Ha Yun for their help with the manuscript preparation.