
Abstract
OBJECTIVES:
Since body mass index (BMI) affects medical imaging quality or noise due to penetration of the radiation through bodies with varying sizes, this study aims to investigate and determine the optimal BMI-adjusted noise index (NI) setting on the contrast-enhanced liver CT scans obtained using 3D Smart mA technology with adaptive statistical iterative reconstruction (ASIR 2.0) algorithm.
MATERIALS AND METHODS:
A total of 320 patients who had contrast-enhanced liver CT scans were divided into two equal-sized groups: A (18.5 kg/m2≤BMI<24.9 kg/m2) and B (24.9 kg/m2 ≤ BMI ≤34.9 kg/m2). The two groups were randomly divided into four subgroups with an NI of 11, 13, 15, and 17. All images were reconstructed with 50% ASIR 2.0. Signal-to-noise ratio (SNR) and contrast-to-noise ratio (CNR) were calculated after the late arterial, portal venous, and equilibrium phases were completed. Images were evaluated by two radiologists using a subjective 0 –5 scale. Mean CT dose index of volume, dose-length product, and effective dose (ED) were calculated and compared using one-way ANOVA.
RESULTS:
In group A, the best-quality images obtained at the lowest ED were scanned at an NI of 15 in the late arterial phase, and at an NI of 17 in the portal venous and equilibrium phases. In group B, the best results were obtained at an NI of 13 in the late arterial phase, and at an NI of 15 in the portal venous and equilibrium phases.
CONCLUSION:
Adjusting NI and iterative reconstruction algorithm based on body mass index can help improve image quality on contrast-enhanced liver CT scans, even at low radiation dose.
Introduction
Contrast-enhanced liver CT is very common, and responsible for exposure of the patient population to considerable radiation. Radiation and its risks raise important safety and health concerns [1, 2]. To reduce the radiation dose while maintaining image quality, radiologists have been taking efforts to optimize current CT scanning protocols. One strategy to reduce the radiation dose is to reduce the current generated in the electron beam (the so-called X-ray tube current) [3, 4]. However, reducing the tube current can increase noise and decrease image quality.
The three-dimensional (3D) Smart mA and similar technologies allow a reduction of the tube current with no compromise to image quality. By enabling Smart mA, the noise index (NI) parameter can be adjusted to control the tube current; hence, the NI can also be used as an indirect measure of image quality. One such algorithm is the adaptive statistical iterative reconstruction (ASIR) algorithm [5, 6]. In a study of chest CT screening, Chen et al. [7] were able to reduce radiation dose while maintaining image quality by combining ASIR with different NI values.
A high body mass index (BMI) affects CT image quality [6, 8]. However, to the best of our knowledge, no previous studies have investigated and/or determined how the NI values vary with BMI. In this study, we investigated the relationship between the image quality and radiation dose using contrast-enhanced liver CT images scanned and reconstructed with ASIR algorithm at different BMI-adjusted NIs. Thus, from the data analysis, the objective of this study is to determine the optimal BMI-adjusted NIs for each CT image scanning phase.
Materials and methods
Patient characteristics
From February to December 2015, 320 patients (183 men, 61.6±22.4 years; 137 women, 63.3±21.8 years) with suspected liver disease had contrast-enhanced liver CT examinations. The patients were divided into two equal-sized groups of 160 patients each: group A (18.5 kg/m2 ≤ BMI <24.9 kg/m2) and group B (24.9 kg/m2 ≤ BMI ≤34.9 kg/m2). The two groups were randomly divided into four subgroups of 40 patients each with an NI of 11, 13, 15, and 17, respectively. All patients were injected with iohexol contrast media (Omnipaque 350; GE Healthcare, WI, USA) at an injection rate of 3.0 mL/s via the median cubital vein. A contrast media volume of 0.9 mL/kg body weight was used. All patients were injected with a saline chasing bolus of 30 mL at 3.0 mL/s after injection of the contrast media.
CT scanning protocols
All 320 patients underwent contrast-enhanced liver CT scanning (late arterial, venous portal, and equilibrium phases) with the new Gemstone detector to derive 128 slices per rotation on a high-definition Discovery CT750 HD (HDCT; GE Healthcare). The timing of the late arterial phase scan was determined with the Smart Prep technique by placing a region of interest (ROI) on the abdominal aortic at the level of the porta hepatis. The late arterial phase scanning started automatically 15 s after the attenuation coefficient of the abdominal aortic blood reached 80 HU. Portal venous and equilibrium phase scans were obtained 70 s and 180 s, respectively, after the start of contrast administration [9, 10]. The scan coverage was from 1 cm above the liver to 1 cm below the inferior border of the liver. The scan ranged from 150 mm to 220 mm. All patients were trained how to breathe before the examination, and were required to hold their breath during the examination. The scan parameters included: helical CT; 0.6 s tube rotation time; pitch factor 0.984 : 1; 36 cm DFOV; table speed 78.75 mm/s; and tube voltage 120 kVp. The CT scanning protocols employed the weight-based adjustment of the combined modulation type (3D Smart mA; GE Healthcare) of the automatic exposure control technique. This technique adapts the tube current based on the patient’s attenuation at different projection angles in the x and y axis (angular or x-y automatic exposure control) and along the z-axis at different table positions along the patient’s length (z-axis automatic exposure control). The technique is intended to achieve the desired image quality as specified by the user in the form of an NI with a user-selected minimum and maximum mA range, and a tube current range of 30–650 mA.
The recommended NI for the liver is 10 as per the manufacturer’s instructions. However, in this study, the NI was set gradually. The quality of images scanned at NI 10 in 30 patients with BMI 18.5–34.9 kg/m2 was considered excellent. Next, we set the NI at 11, 13 and 15 for patients of group A. Because an NI of 11, 13, and 15 provided images of acceptable quality, we increased the NI further to 17. Values of NI >17 were not applied for fear of excessive noise. A similar procedure was followed for patients of group B. All images were reconstructed with 50% ASIR [11, 12], i.e., 50% filtered back projection (FBP) blending with 50% ASIR.
ASIR 2.0 is a new iterative reconstruction (IR) technique for reducing image noise and improving image quality so that a lower radiation dose can be used without sacrificing image quality. It focuses primarily on modeling the system noise statistics, objects, and physics, which are the main contributors to the reduction of both images noise induced by the lower tube current and artifacts in the reconstructed images and the improvement of image quality. This reconstruction approach improves image quality and has been used successfully to significantly lower the radiation dose. By omitting the most time-consuming component and focusing on other factors during the IR process, ASIR 2.0 significantly improves image quality while reducing the radiation dose.
The CT dose index volume (CTDIvol) and dose-length product (DLP) were recorded from the scanner. We converted the DLP to the effective dose (ED) in millisieverts (mSv). The ED was calculated according to the formula: ED = DLP×0.015, where 0.015 denotes the conversion factor [13].
Data processing and analysis
Images were reconstructed by using a dedicated workstation at 120 kVp and 3D Smart mA at different NI values. A circular ROI with an area of 20±2 mm2 was placed at different spots to measure the mean CT values and image noise (Fig. 1). These areas included the right anterior, right posterior and left medial segments of the liver, the erector spine muscle, and the abdominal wall fat in the same slice. Areas of focal changes in liver parenchymal attenuation, large vessels, and prominent artifacts, if any, were carefully avoided. For all measurements, the size, shape, and position of the ROIs were kept constant across images by application of a copy-and-paste function at the workstation. The CNR was calculated according to the formula [14]: CNR = (CTliver – CTerector spine muscle)/SDabdominal wall fat, where CTliver denotes the mean CT value of the four measurement areas of the liver; CTerector spine muscle denotes the mean CT value of the erector spine muscle in the same slice and SDabdominal wall fat denotes the mean abdominal wall fat noise. The SNR was calculated according to the formula [14]: SNR = CTliver/SDliver, where SDliver denotes the mean liver noise. The CNR and SNR measurements were obtained from the images for the objective evaluation of image quality.
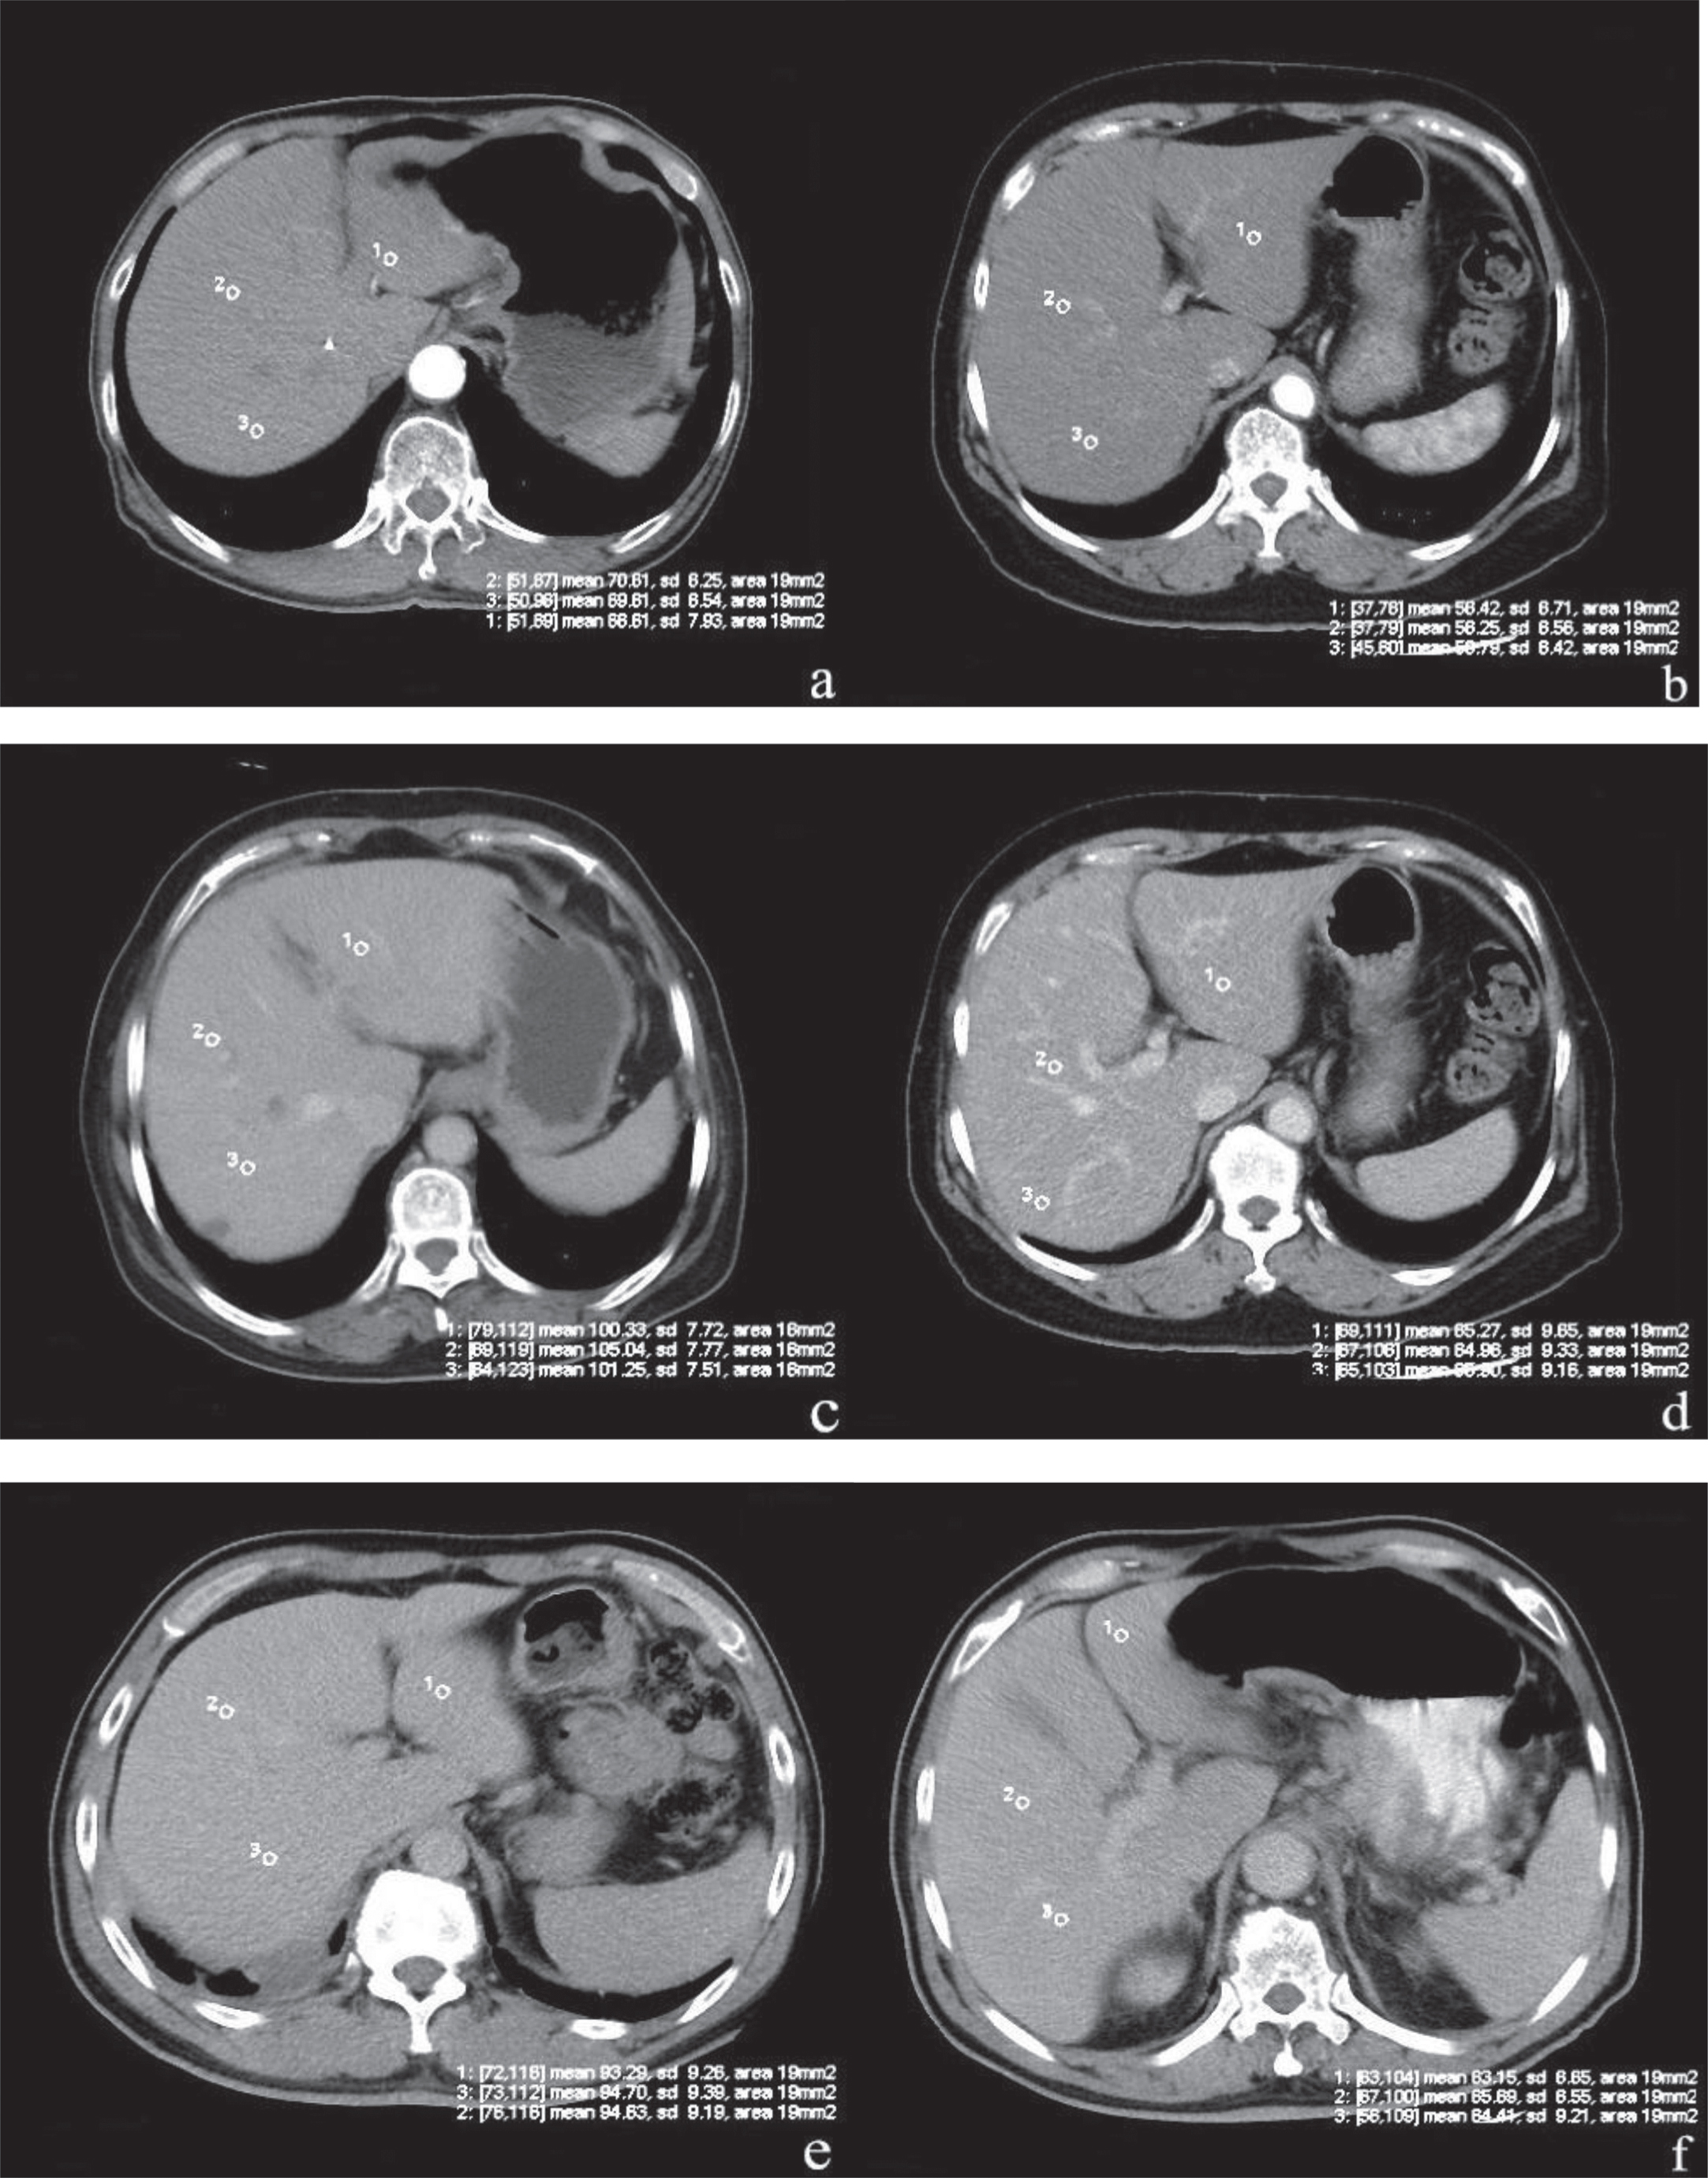
Comparison of image qualities. (a-f) provide examples of images obtained using NI = 15 with a BMI of 22.32 kg/m2 in arterial phase (a), NI = 17 with a BMI of 23.17 kg/m2 in arterial phase (b), NI = 15 with a BMI of 26.56 kg/m2 in portal phase (c), NI = 17 with a BMI of 27.15 kg/m2 at arterial phase (d), NI = 15 with a BMI of 30.68 kg/m2 in equilibrium phase (e) and NI = 15 with a BMI of 32.71 kg/m2 in equilibrium phase (f). Signal intensity was measured with a ROI tool as the CT value of the left and right liver and image noise as the standard deviation of the left and right liver. Typical mean signal intensity values are noted as 69.81 HU (a), 58.52 HU (b), 102.16 HU (c), 85.63 HU (d), 94.37 HU (e) and 84.12 HU (f). The signal intensity of NI = 17 (b) in the arterial phase was lower than signal intensity value of NI = 15 (a) at 18.5 kg/m2 ≤ BMI <24.9 kg/m2 (p < 0.01). The signal intensity of NI = 17 in the portal phase (d) and the equilibrium phase (f) was lower than signal intensity value of NI = 15 (c and e) at 24.9 kg/m2 ≤ BMI <34.9 kg/m2.
All images were interpreted by two independent radiologists with at least ten years of experience in abdominal imaging. The two radiologists evaluated the overall diagnostic image quality on a diagnostic PACS workstation with the same brightness and resolution settings of the same viewing monitor over a period of two weeks. The overall diagnostic image quality for the liver was evaluated using a 5-point scale [15–18]: 1, non-diagnostic image quality (noise and artifact affecting image interpretation); 2, substandard image quality; 3, standard image quality; 4, better-than-standard image quality; and 5, excellent image quality. Image noise was also evaluated using a 5-point scale: 5, unacceptable noise affecting image interpretation; 4, above-average noise; 3, average noise; 2, standard or less-than-average noise; and 1, little or no noise. Artifacts were graded on a 5-point scale: 5, obvious artifacts affecting diagnosis; 4, artifacts producing substandard image quality; 3, standard or minor artifacts; 2, minor artifacts not affecting diagnosis; and 1, no artifacts. The visibility of anatomical structures, including the liver, the abdominal wall, the wall of the celiac artery, the intrahepatic portal vein and the extrahepatic portal vein was graded on a 5-point scale: 5, sharp; 4, better than average; 3, average; 2, suboptimal; and 1, no visibility.
All the images were randomized, and the readers were blinded to the NIs. The two radiologists pre-assessed the image quality of five cases according to the 5-point rating scales prior to our study; the five cases were randomly selected from a series of contrast-enhanced liver CT scans. The purpose was to train radiologists to be familiar with the evaluation process and criteria so as to reduce inter-observer variability. If case of discrepancy, agreement was reached through open discussions. Subsequently, the case was re-assessed to reduce inter-observer variability [19].
Statistical analysis
All statistical calculations were performed with the software package SPSS 19.0 (SPSS Inc., Chicago, IL) with P < 0.05 indicating a statistically significant difference. The characteristics of the eight patient subgroups (age, sex, height and weight), image quality scores (subjective image quality), CTDIvol, DLP, and ED were compared using one-way analysis of variance (ANOVA). The SNR and CNR of the images of liver were compared using repeated measures ANOVA. If data were homogeneous between the two groups A and B, the least significant difference (LSD) test was performed. If data were heterogeneous, Dunnett’s T3 test was performed. Interobserver variability was assessed with k value of concordance to measure the degree of agreement between the two radiologists for various parameters. Agreement was determined according to the value of k: <0, no agreement; 0–0.2, slight agreement; 0.21–0.40, fair agreement; 0.41–0.60, moderate agreement; 0.61–0.80, substantial agreement; and 0.81–0.10, almost perfect agreement.
Results
As shown in Table 1, there were no differences in patients’ age, sex distribution, weight, and height among the eight subgroups (all P > 0.05). In the quantitative analysis of images, in group A, the mean signal intensity value, SNR and CNR of late arterial phase images of the NI = 17 subgroup were significantly lower than those of the NI = 11, NI = 13 and NI = 15 subgroups (P < 0.01), but those of NI = 11, NI = 13 and NI = 15 were similar (P > 0.05). The mean signal intensity value, SNR and CNR of images of other phases (venous portal and equilibrium) were similar among NI = 11, N = 13, N = 15 and N = 17 (P > 0.05) (as shown in Table 2, Figs. 1 and 2).
Patient characteristics
Patient characteristics
Objective image quality with different NI setting at different BMI for R2
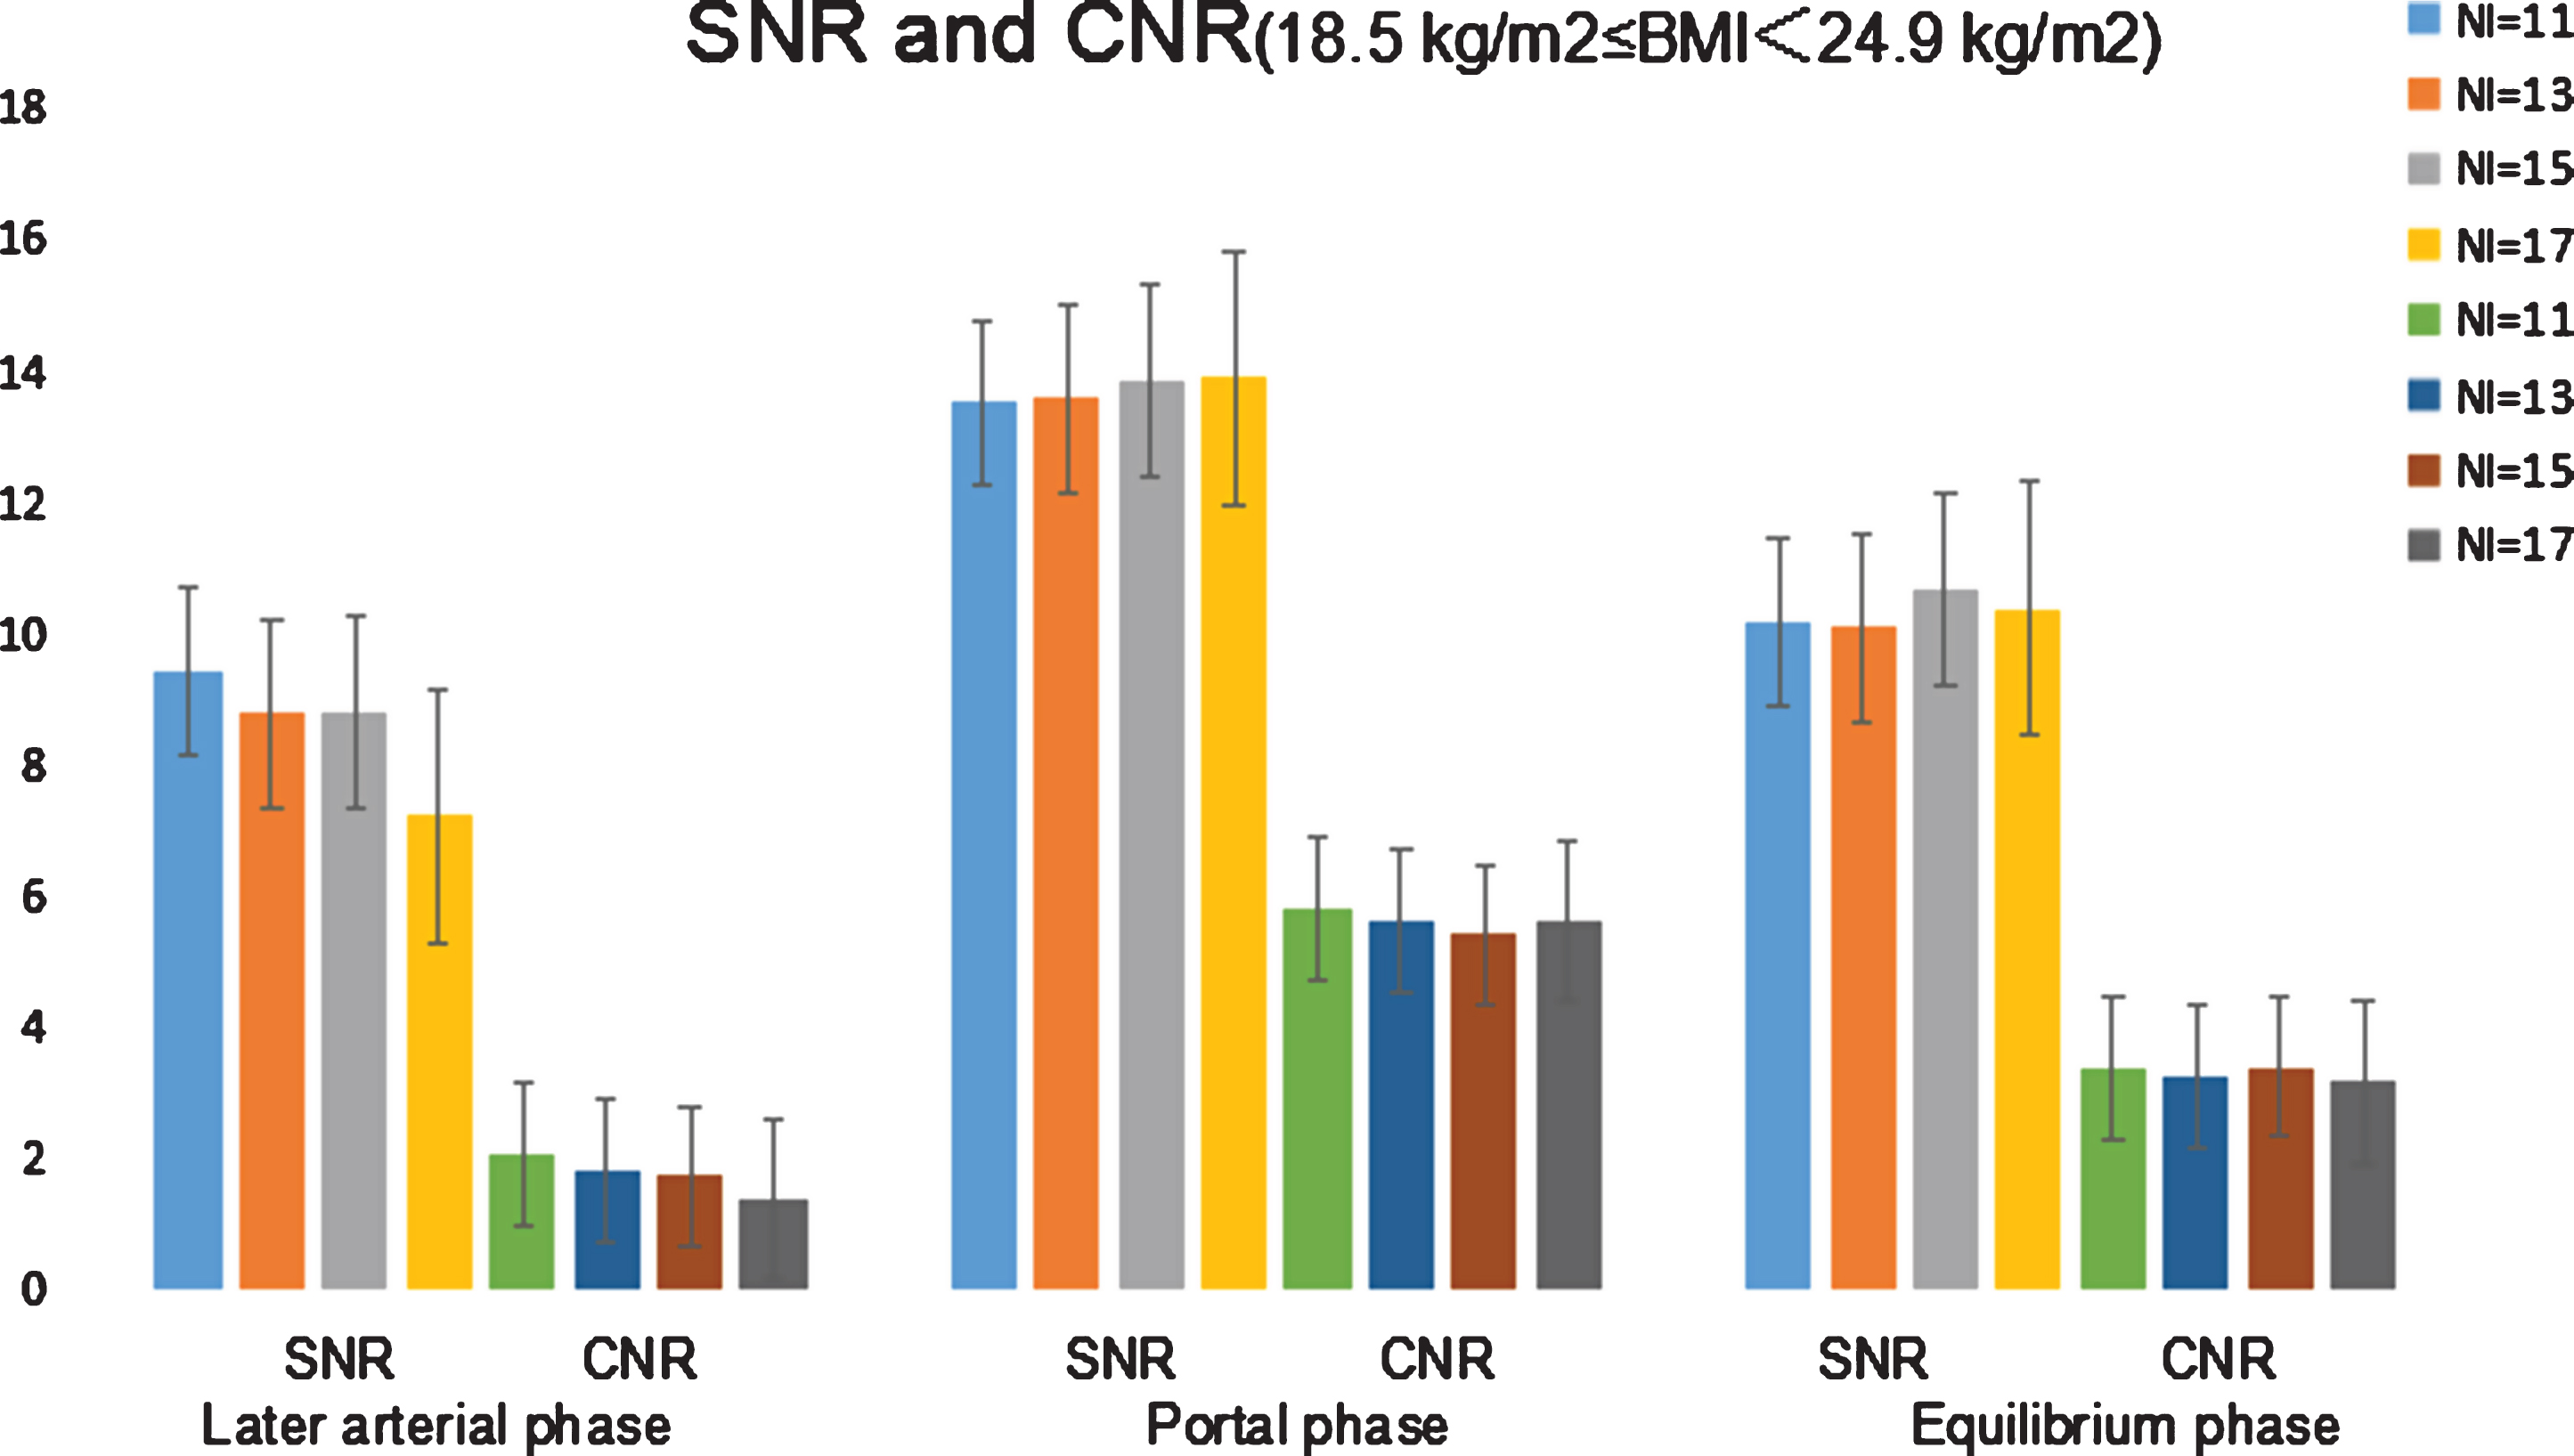
SNR and CNR of contrast-enhanced CT images of the liver of patients with 18.5 kg/m2 ≤ BMI <24.9 kg/m2. The images were scanned at different NIs. Late arterial phase images scanned at an NI of 17 had significantly lower SNR and CNR. There were no differences in SNR and CNR among the four subgroups for the other phases.
In group B, the mean signal intensity value, SNR and CNR of late arterial phase images of NI = 15 were significantly lower than those of NI = 11 and NI = 13 (P < 0.01), but those of NI = 11 and NI = 13 were similar (P > 0.05). The mean signal intensity value, SNR and CNR of images of all threephases were significantly lower in N = 17 than in NI = 11, N = 13 and N = 15 (P < 0.01) (Table 2, Figs. 1 and 3), because of increased noise at N = 17, which affected image quality.

SNR and CNR of contrast-enhanced CT images of the liver of patients with a BMI 24.9–34.9 kg/m2. The images were scanned at different NIs. Late arterial phase images scanned at an NI of 15 or 17 had significantly lower SNR and CNR. Images scanned at NI 17 also had significantly lower SNR and CNR at venous portal and equilibrium phases.
Study results showed that in the subjective evaluation of image quality, there was moderate to substantial inter-observer agreement between the two radiologists for subjective liver CT image quality criteria (k = 0.61–0.8). Overall image quality, noise, artifacts and visibility scores of images scanned at different NIs are summarized in Table 3. In group A, noise and artifacts scores of late arterial phase images were significantly higher in the NI = 17 subgroup than in the other subgroups (P < 0.05), the visibility and overall image quality of late arterial phase images were significantly worse in the NI = 17 subgroup than in the other subgroups (P < 0.05), but those of NI = 11, N = 13 and N = 15 were similar (P > 0.05). The overall image quality, noise, artifacts and visibility scores of images of other phases (venous portal and equilibrium) were similar among NI = 11, N = 13, N = 15 and N = 17 (P > 0.05) (Table 3, Fig. 4).
Subjective image quality with different NI setting at different BMI for R2
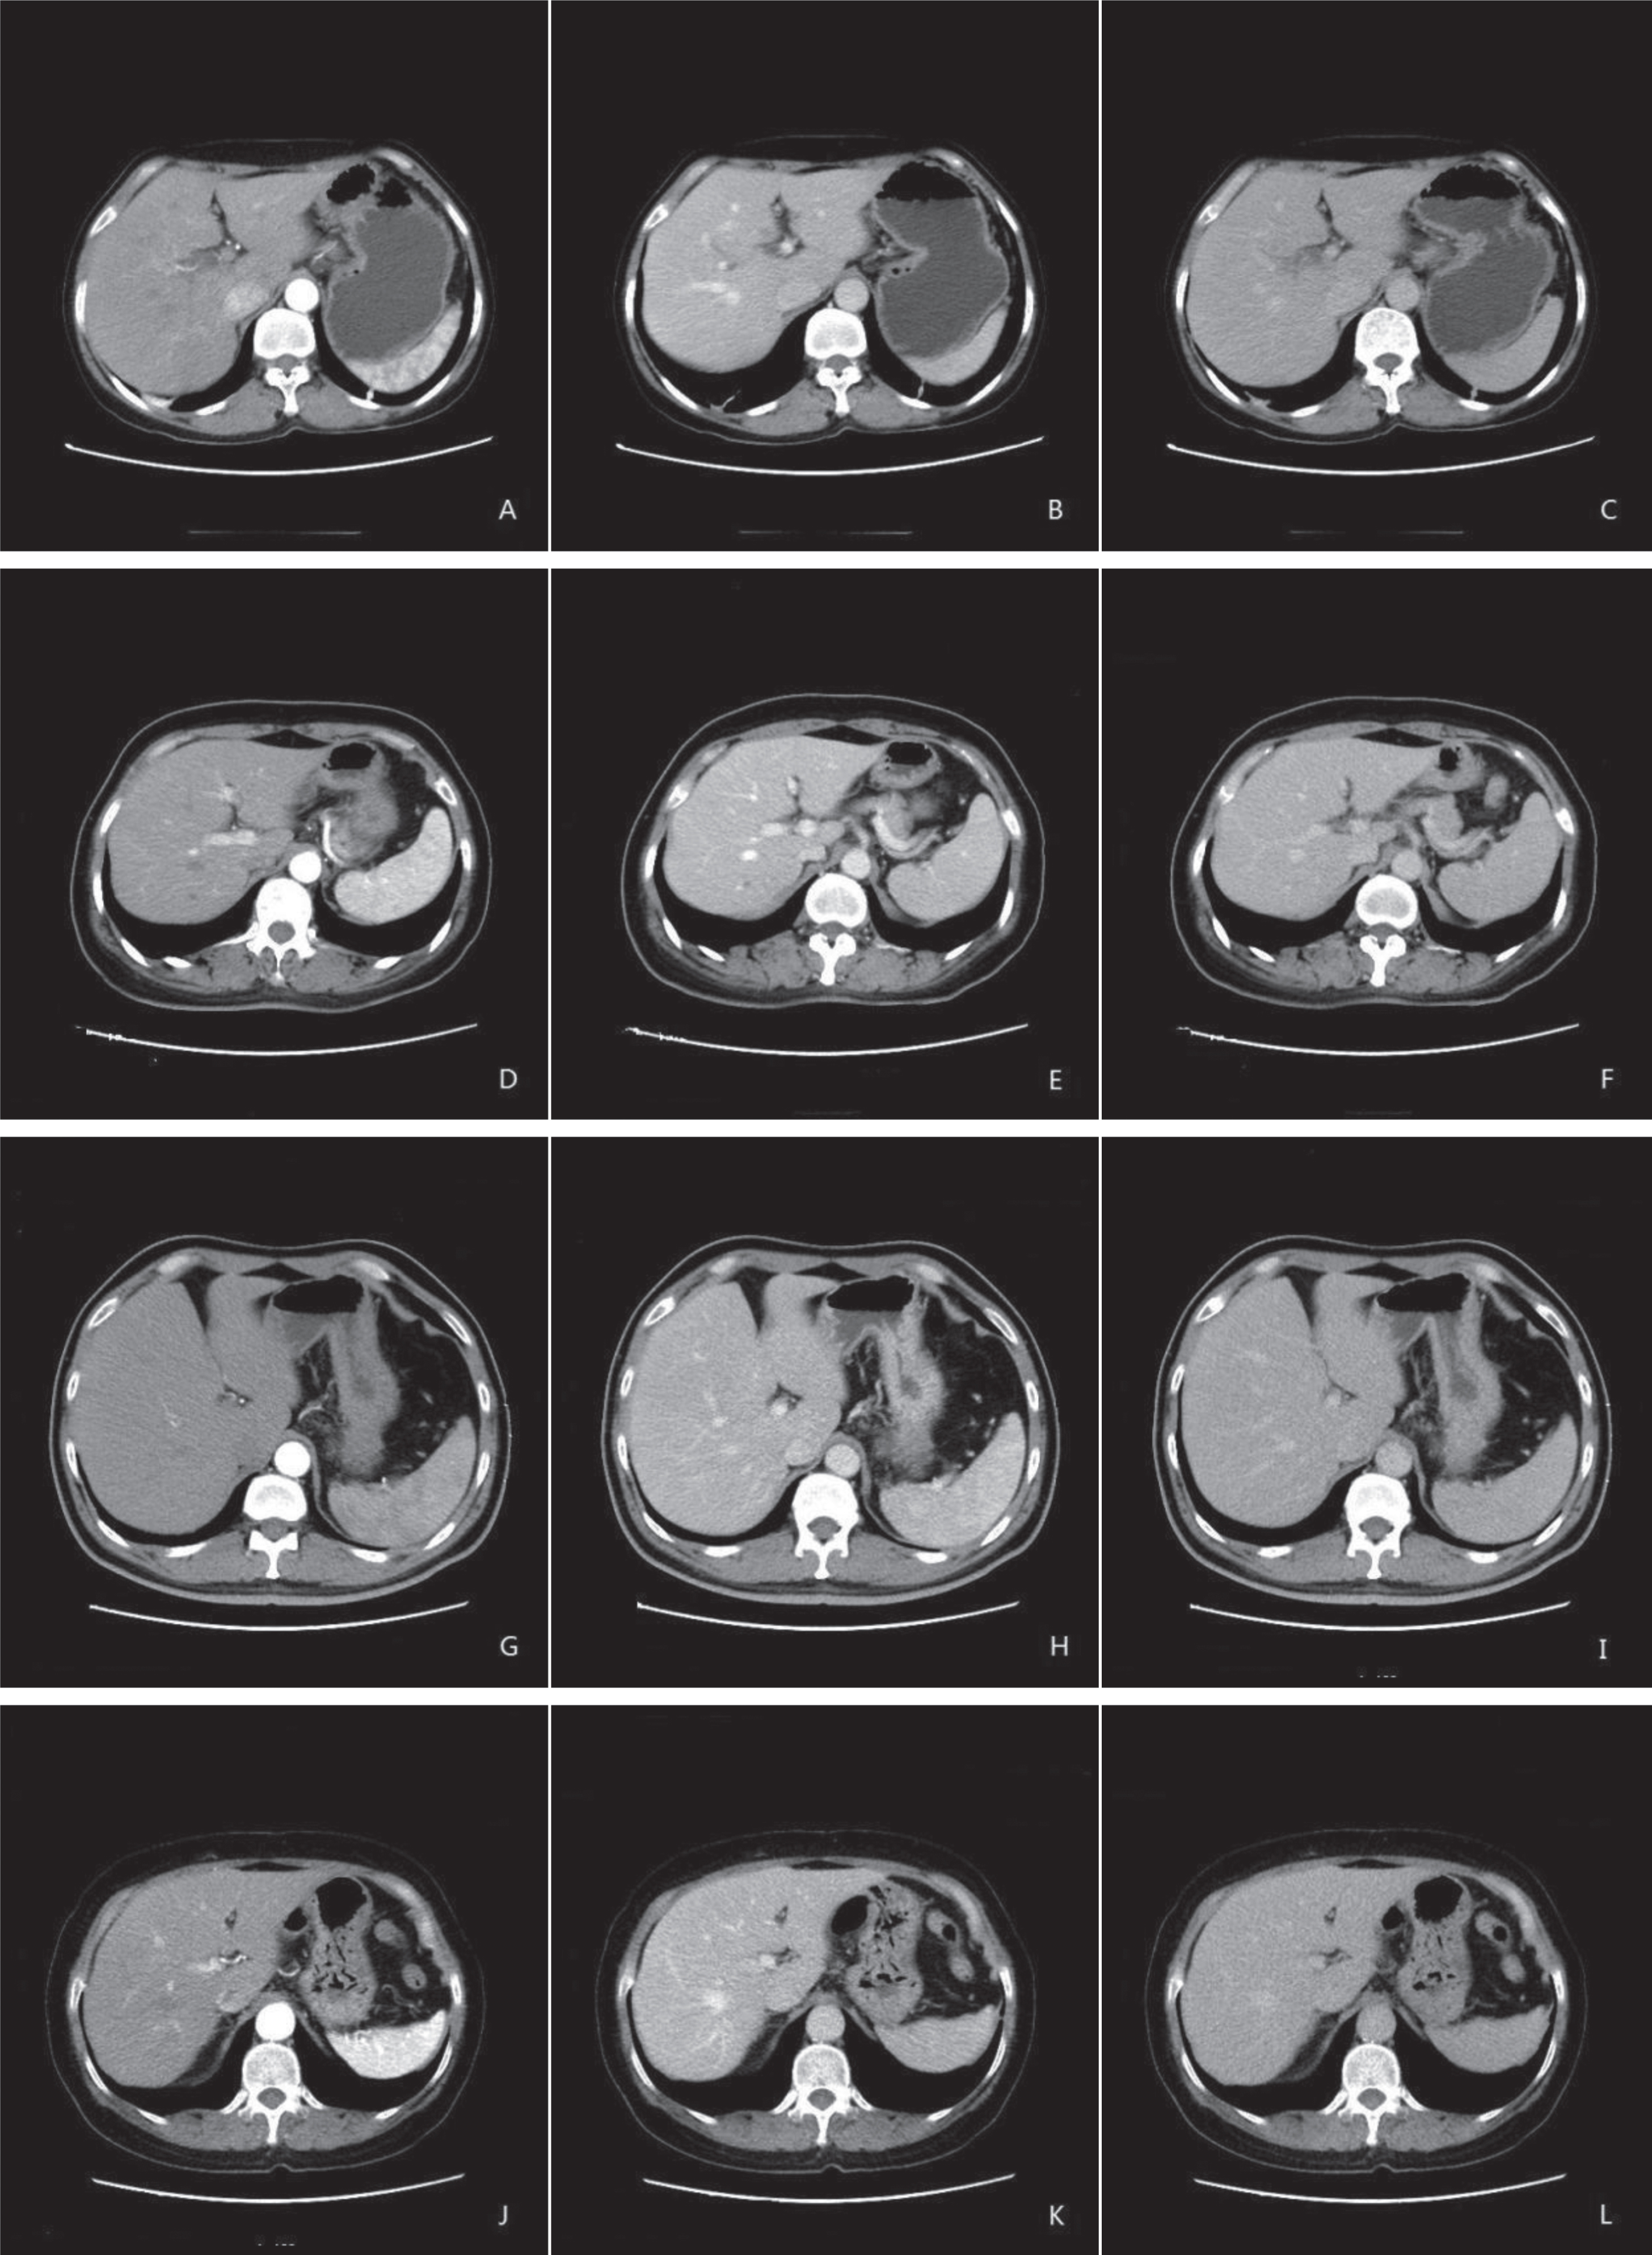
Representative transverse contrast-enhanced CT images of the liver of patients with 18.5 kg/m2 ≤ BMI <24.9 kg/m2. The images were scanned at (A,D,G,J) late arterial, (B,E,H,K) venous portal, and (C,F,I,L) equilibrium phases with an NI of (A–C) 11, (D–F) 13, (G–I) 15, and (J–L) 17. The images shown in A, D, and G have better quality than that in J. There were no other remarkable differences.
In group B, noise and artifacts scores of late arterial phase images were significantly higher in the NI = 15 and NI = 17 subgroups than in the NI = 11 and NI = 13 subgroups (P < 0.01), and the visibility and overall image quality of late arterial phase images were significantly different between NI = 15 and NI = 17 and between NI = 11 and NI = 13 (P < 0.05). However, noise and artifacts scores of late arterial phase images were similar between NI = 11 and NI = 13 and between NI = 15 and N = 17 (P > 0.05). Noise and artifacts scores of images of other phases (venous portal and equilibrium) were significantly higher in the NI = 17 subgroups than in the other subgroups (P < 0.05), and the visibility and overall image quality were significantly worse in the NI = 17 subgroups than in the other subgroups (P < 0.05). Noise, artifacts scores, visibility and overall image quality of images of other phases (venous portal and equilibrium) were similar among NI = 11, N = 13 and N = 15 (P > 0.05) (as shown in Table 3 and Fig. 5).
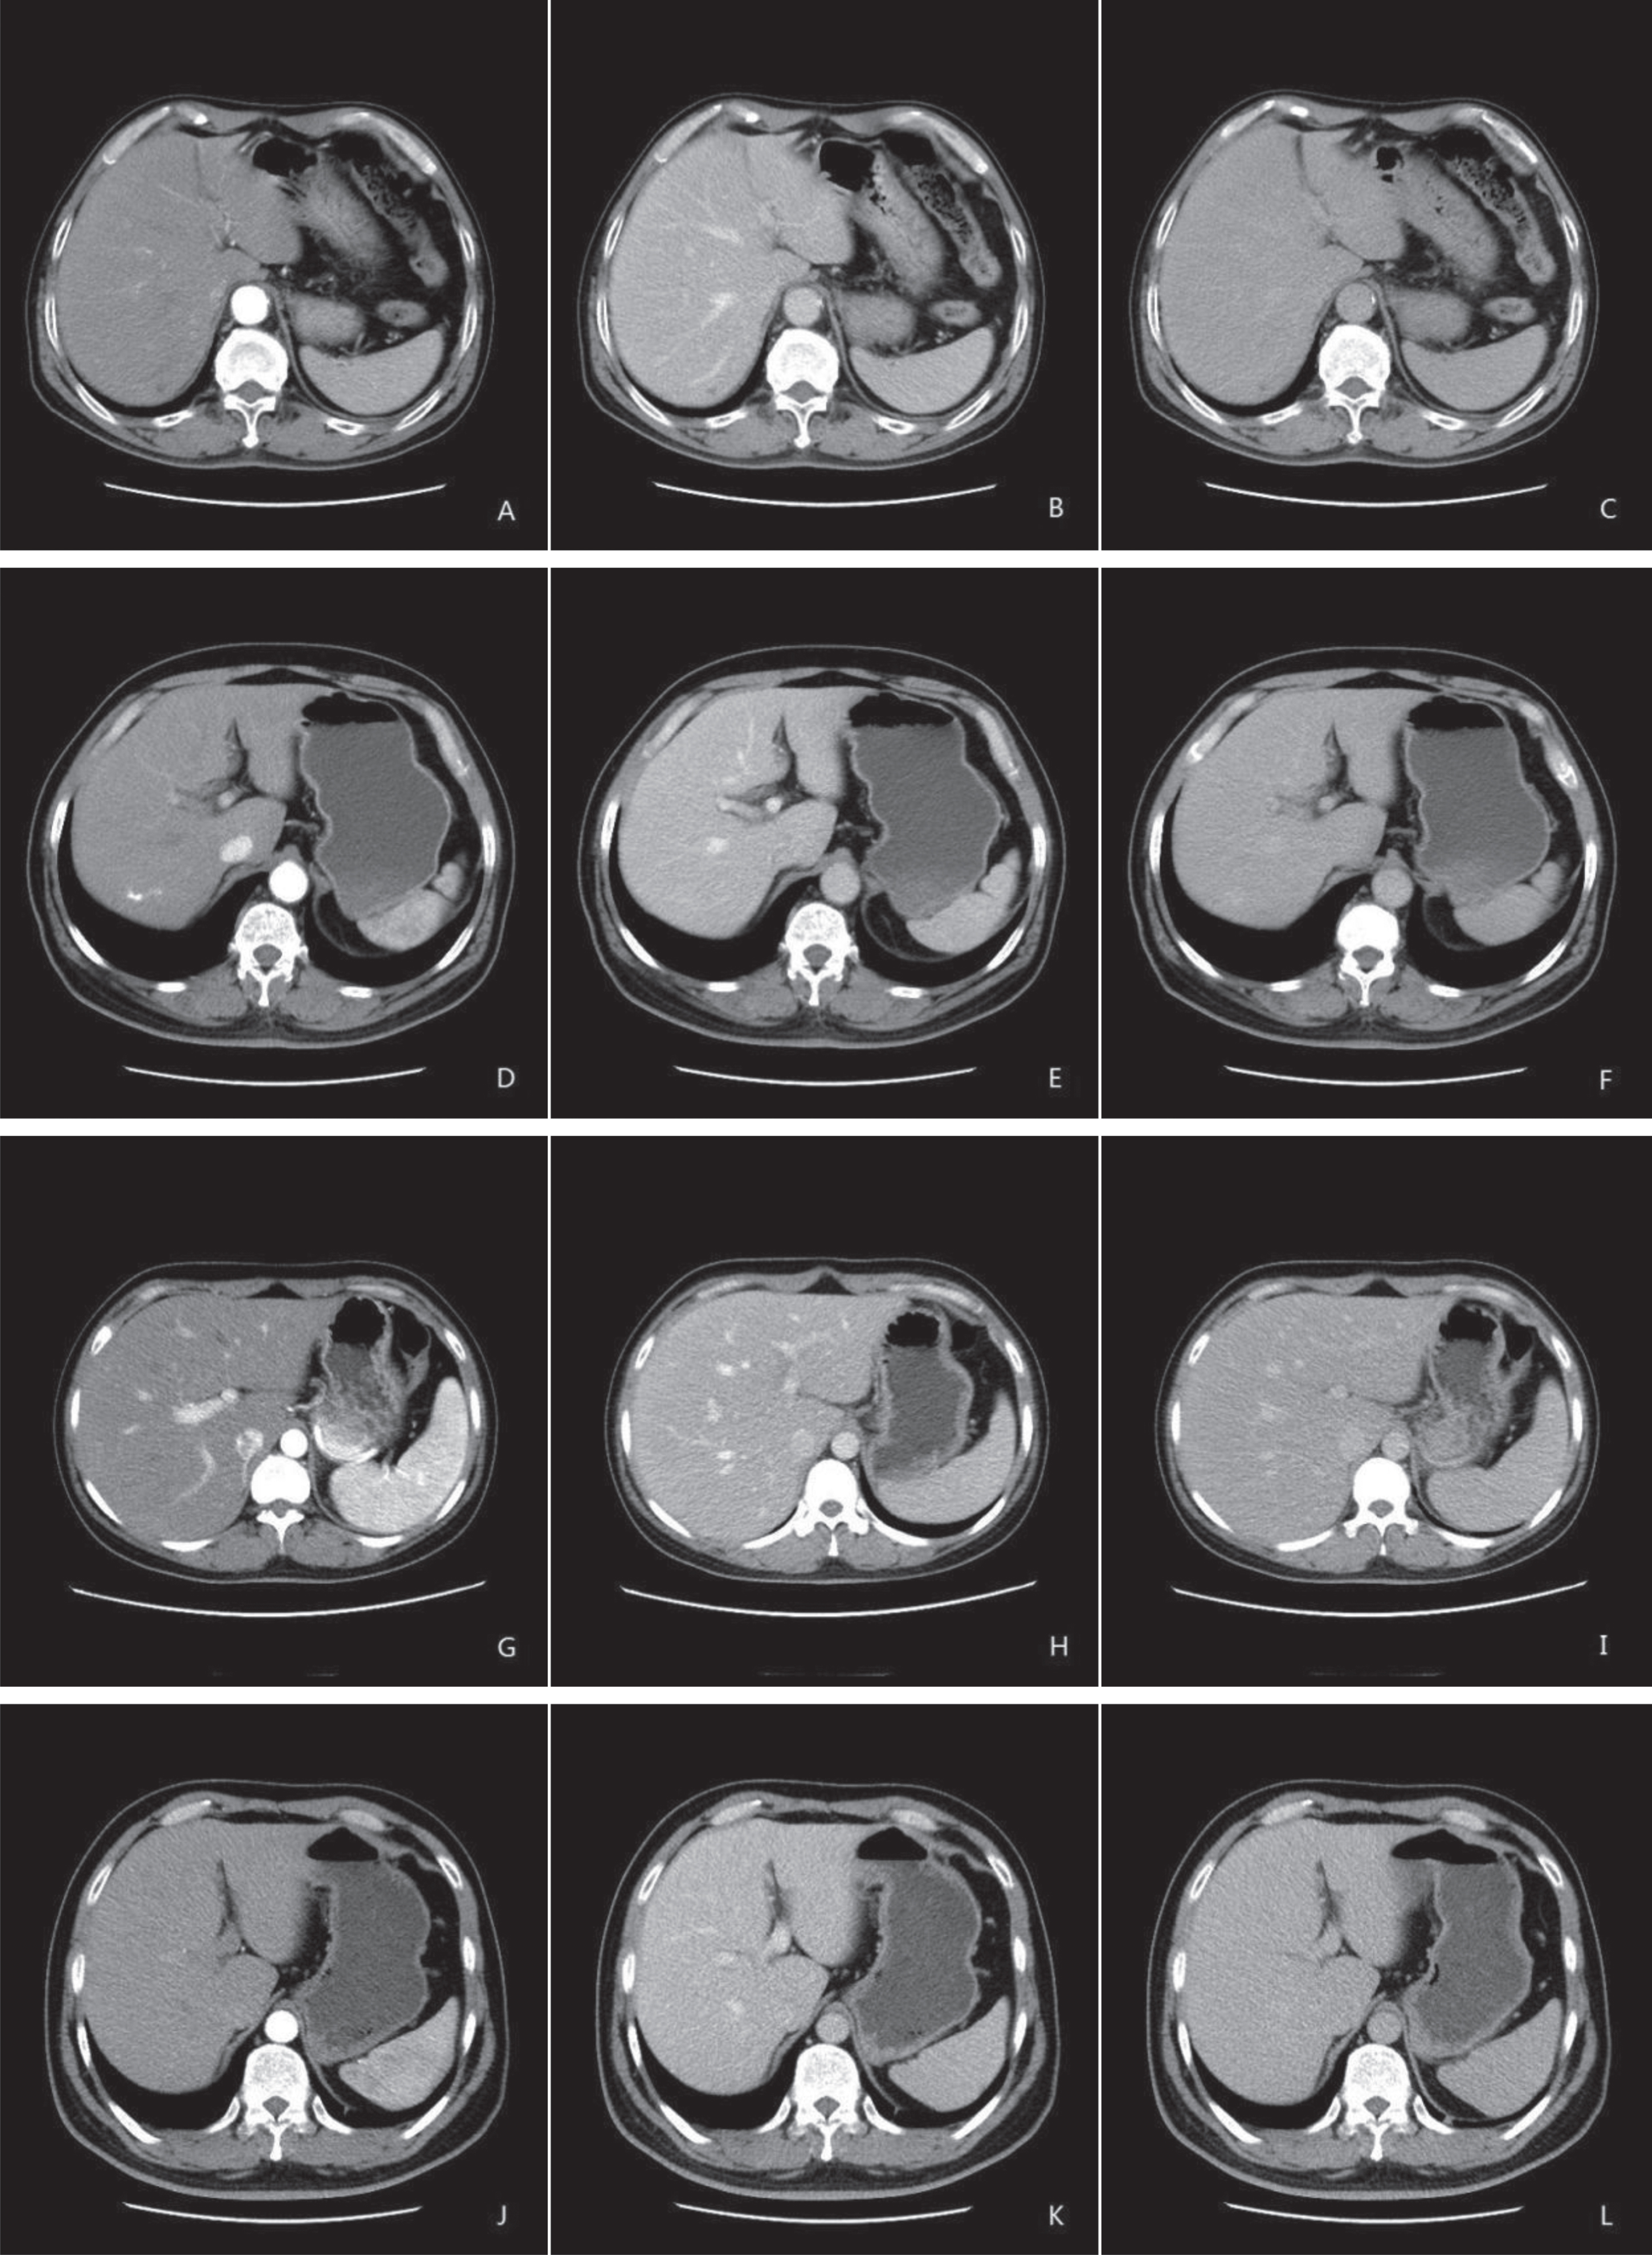
Representative transverse contrast-enhanced CT images of the liver of patients with a BMI 24.9–34.9 kg/m2. The images were scanned at (A,D,G,J) late arterial, (B,E,H,K) venous portal, and (C,F,I,L) equilibrium phases with an NI of (A–C) 11, (D–F) 13, (G–I) 15, and (J–L) 17. The images shown in G, and J have worse quality than that in A, and D; B, E, and H have better quality than K; and C, F and I have better quality than L.
In assessing radiation dose, the study showed that in group A, the CTDIvol, DLP and ED were significantly lower in the NI = 15 and N = 17 subgroups than in NI = 11 and N = 13 (Table 4). Specifically, the ED of NI = 15 and NI = 17 was reduced by 58% and 62% as compared to NI = 11, respectively. In group B, the CTDIvol, DLP and ED were significantly different among the four subgroups (Table 4). The ED of NI = 13 and NI = 15 was reduced by 26% and 45% as compared to NI = 11, respectively.
Radiation dose with different NI setting at different BMI
All date: compare between * and NI = 11, P < 0.05; compare between # and NI = 13, P < 0.05; compare between Δ and NI = 15, P < 0.05.
In this study, we found that the BMI affected the quality of images scanned at different NIs. Based on our data analysis results, we suggested that applying a BMI-adjusted NI combined with the application of an iterative reconstruction algorithm (ASIR 2.0) enabled to maintain high image quality on liver CT, even at low radiation dose.
In the last decade, CT examination was reconstructed with FBP. FBP technique reduces reconstruction time but leads to higher image noise and artifacts [20]. However, iterative reconstruction techniques, such as ASIR 2.0, can be a solution to lower image noise in standard or improved resolution of images [21–23]. Our study confirmed that it was possible to reduce the radiation dose for most patients using different BMI-adjusted NIs because of ASIR 2.0 algorithm [24], which reduced the quantum noise without tradeoff in spatial resolution [25]. ASIR 2.0 make acquisitions at high NI values (low radiation dose) feasible with little or no increase in image noise [26, 27]. Hence, although tube current and radiation dose were reduced in high NI values, the image quality was not affected and even improved using ASIR 2.0. In contrast-enhanced liver CT examination, the application of ASIR 2.0 can lower the lofty image noise caused by low radiation dose and improve SNR and CNR, thereby obtaining equal or better image quality than the conventional dose combined with FBP [28–30].
In the past, different technical methods have been introduced into clinical routine to reduce radiation dose [31–35]. The initial dose reduction strategies for CT focused on decreasing tube current because there is a corresponding linear reduction in radiation dose [36]. With 3D Smart mA combination with different NI setting a new technique has recently been developed for the latest CT scanner. In this study, we evaluated the radiation dose and image quality in 3D Smart mA combining different NI setting with ASIR 2.0. The NI is a parameter with 3D Smart mA technique that adjusts mA and corresponds to the relative noise in the images. A higher NI value means the images will contain more noise and will be obtained with a lower mA (kV is not altered) and therefore a lower radiation dose. A lower NI value means the images will contain more X-ray photon and will be obtained with a higher mA (kV is not altered) and therefore a higher radiation dose, so we should use different NI values in the different BMI of patients to reduce the radiation dose [37].
The BMI affected the NI setting used to obtain the best-quality images at the lowest radiation dose. We found that a higher NI (NI = 15) led to a 58% reduction of the radiation dose compared to the conventional NI value (NI = 11) for contrast-enhanced liver CT images scanned in the late arterial phase with 3D Smart mA modulation and ASIR in patients with 18.5 kg/m2 ≤ BMI <24.9 kg/m2. Using an even higher NI (NI = 17) reduced the radiation dose by 62% compared to NI = 11 in the same BMI range, but the image quality was not improved. In fact, the image quality in the N = 15 subgroup was considered better than that in the NI = 17 subgroup. Typically, the NI in the late arterial phase is lower than that in the venous portal phase and the equilibrium phase because images in the late arterial phase require better resolution and lower noise. In patients with a BMI of 24.9–34.9 kg/m2, an NI of 15 led to a 26% reduction of the radiation dose compared to NI = 11 for contrast-enhanced liver CT images scanned in the late arterial phase. An NI of 15 reduced the radiation dose by 45.31% compared to NI = 11 in the venous portal and equilibrium phases, but the image quality was not improved. We also found that the NIs applied in patients with higher BMI were lower than those in patients with lower BMI in the same scanning phase. A possible explanation is that the images of patients with higher BMI were noisier. Therefore, a lower NI could reduce image noise in patients with high BMI. On the other hand, a higher NI could result in poor image quality. Moreover, in this study, we found that small lesions (<6 mm) can be missed at high NIs (NI > 15) in late arterial phase images in patients with a BMI of 24.9–34.9 kg/m2. Our results are consistent with the work of Vardhanabhuti et al. [38]. They found that diagnostic confidence is decreased because of an extensive noise reduction at a lower dose level when a high NI reduces the tube current output. However, a higher NI can be used in patients with 18.5 kg/m2≤ BMI ≤ 24.9 kg/m2 to reduce the radiation dose in all three CT scanning phases while maintaining image quality. We also found that the SNR and CNR of venous portal phase images were higher than in the late arterial and equilibrium phases, possibly because the liver receives double blood supply and there was more iodine in the liver parenchyma in the venous portalphase.
Our study has several limitations. First, this study included a small sample size. Second, patient scans were not acquired consecutively; however, patient demographics (age, sex, height and weight) were similar between the groups. Third, ASIR is a first-generation reconstruction algorithm; the most recent ASIR-V is an advanced algorithm that can reduce radiation dose more efficiently. However, our CT scanner was not equipped with the ASIR-V. Fourth, in this paper, we followed the conventional method of evaluating subjective image quality, we did not mention the detail subjective image evaluation, and we are planning the next study phase that do include the lesion details.
In conclusion, it is useful to use BMI-adjusted NIs in liver CT examination, even at low radiation dose. Patients with 18.5 kg/m2 ≤ BMI ≤ 24.9 kg/m2 can be scanned at NI 15 in the late arterial phase, and at NI 17 in the portal venous and equilibrium phases. Patients with a BMI of 24.9–34.9 kg/m2 can be scanned at NI 13 in the late arterial phase, and at NI 15 in the portal venous and equilibriumphases.
Conflict of Interest
None.