
Abstract
Background
In chest tomosynthesis, low-dose projections collected over a limited angular range are used for reconstruction of an arbitrary number of section images of the chest, resulting in a moderately increased radiation dose compared to chest radiography.
Purpose
To investigate the effects of learning with feedback on the detection of pulmonary nodules for observers with varying experience of chest tomosynthesis, to identify pitfalls regarding detection of pulmonary nodules, and present suggestions for how to avoid them, and to adapt the European quality criteria for chest radiography and computed tomography (CT) to chest tomosynthesis.
Material and Methods
Six observers analyzed tomosynthesis cases for presence of nodules in a jackknife alternative free-response receiver-operating characteristics (JAFROC) study. CT was used as reference. The same tomosynthesis cases were analyzed before and after learning with feedback, which included a collective learning session. The difference in performance between the two readings was calculated using the JAFROC figure of merit as principal measure of detectability.
Results
Significant improvement in performance after learning with feedback was found only for observers inexperienced in tomosynthesis. At the collective learning session, localization of pleural and subpleural nodules or structures was identified as the main difficulty in analyzing tomosynthesis images.
Conclusion
The results indicate that inexperienced observers can reach a high level of performance regarding nodule detection in tomosynthesis after learning with feedback and that the main problem with chest tomosynthesis is related to the limited depth resolution.
The fundamentals of tomosynthesis were first described by Ziedses des Plantes in 1932 (1), but were not implemented until the first tomosynthesis equipment was constructed by Garrison in 1969 (2). Even so, it was not until recently that the introduction of flat panel detectors made chest tomosynthesis feasible in healthcare. Chest tomosynthesis refers to the technique of acquiring low-dose projections of the chest over a limited angular range and using these projections to reconstruct an arbitrary number of section images of the chest (3–5). Compared to computed tomography (CT), the limited angular range used in tomosynthesis results in a reduction in depth resolution, in turn enabling a substantial reduction in radiation dose (6, 7). Compared to chest radiography, however, the disturbance of overlapping anatomy, which is the main limiting factor for detection of pulmonary nodules in chest radiography (8–15), is considerably reduced in chest tomosynthesis at a modest increase in radiation dose.
Since December 2006, chest tomosynthesis equipment has been available for clinical use at the thoracic radiology department at our hospital. A description of the first two years of clinical experience of chest tomosynthesis, including a summary of scientific evaluations conducted, has been given by Johnsson et al. (16). Regarding detection of pulmonary nodules, it was shown in a previous study that the detectability was significantly higher for chest tomosynthesis than for chest radiography (17), especially for small nodules, although the observers – experienced thoracic radiologists – had limited experience of chest tomosynthesis (6 months). In a follow-up study (18), the effect of additional clinical experience of chest tomosynthesis on the detectability of pulmonary nodules was evaluated by comparing the results of the previous study (17) with the results from an additional reading of the same tomosynthesis cases, conducted one year later. During the year separating the two readings, the thoracic radiologists were analyzing tomosynthesis images in their daily work. As no significant difference was found between the two readings, the results were interpreted as indicating that experienced thoracic radiologists can take advantage of tomosynthesis for detection of pulmonary nodules after only a short period of clinical experience of the technique. However, a reason for the lack of improvement could be that the observers were not provided feedback in the clinical routine (i.e. the observers were not informed about the accuracy of their analyses of the tomosynthesis images) and that a reference, such as CT, was not systematically provided for comparison during the clinical work. To further investigate the learning effect of tomosynthesis regarding detection of pulmonary nodules, the present study aimed at evaluating if systematic feedback could lead to improved performance for both experienced and inexperienced observers.
Because chest tomosynthesis is a rather new technique, its advantages and limitations have not been thoroughly investigated. In order to understand the shortcomings of the technique and to gain knowledge of how to analyze the images, it is important to identify potential pitfalls and to explain the reasons for erroneous analyses. Another important issue related to the introduction of a new technique is the need of clinical optimization. In order to enable optimization of a given technique based on visual grading (19–21), quality criteria suitable for the examination are needed. The European Commission has established such quality criteria for chest radiography (22) and chest CT (23), but no quality criteria for chest tomosynthesis have been published. Thus, the multiple purposes of the present study were to examine the effect of learning with feedback on the detectability of nodules for observers with different experience in chest tomosynthesis, to identify potential pitfalls regarding nodule detection in chest tomosynthesis and present suggestions for how to avoid them and, finally, to adapt the European quality criteria for chest radiography and chest CT to chest tomosynthesis.
Material and Methods
Study set-up
In this study, observers analyzed the same group of tomosynthesis cases (n = 89) for presence of pulmonary nodules in two reading sessions, with the purpose of measuring the difference in performance due to learning with feedback between the two sessions. The reading sessions were separated by a collective learning session, at which the observers were given feedback on their analyses on an additional set of tomosynthesis cases (n = 25). The collective learning session also served the purpose of identifying pitfalls and formulating suggestions on how to avoid them, as well as adapting the European quality criteria for chest radiography (22) and chest CT (23) to chest tomosynthesis. Six observers, with different degrees of experience in chest tomosynthesis, participated in this study. A description of the experience of the observers is given in Table 1. The purpose of including less experienced observers in the session was both to promote elaborate discussions on difficulties in how to correctly analyze chest tomosynthesis images – encouraging the experienced observers to explain in more detail what could be implicitly understood by experienced radiologists – and to evaluate the benefit of learning with feedback on the detectability of nodules for less experienced observers. The purpose of including a medical physicist, with no formal training in analyzing tomosynthesis images, was to increase this effect.
Position and experience of the observers
Image collection
The Regional Ethical Review Board approved this study and all participants gave informed consent. Two groups of patients were used in this study. The first group, containing the same image material from 89 patients (42 with and 47 without pulmonary nodules) used in two previous studies (17, 18), were used for testing the performance of the observers before and after learning with feedback. (Refer to the two previous publications for detailed descriptions of the collection of this image material.) The second group included new cases, and was used for the learning with feedback. Between May 2007 and April 2008, 27 patients, 16 with pulmonary nodules and 11 without pulmonary nodules were included in the second group. For CT examinations at our department, standard of care at the time of the study was to include a chest radiography examination. For study purposes, an additional tomosynthesis examination was added. Twenty-three out of 27 patients in the second group were examined with both techniques the same day, the remaining four patients within one week. Two patients were excluded due to having more than 20 nodules. The total number of nodules was 131 in the first group and 31 in the second group.
All except five of the patients included in the second group were examined with a beta version of a commercially available product for chest tomosynthesis, VolumeRAD (GE Healthcare, Chalfont St Giles, UK) and the remaining five patients were examined with the final commercial product. For both versions, 60 low-dose projection images were acquired over an angular range from –15° to +15° around the standard orthogonal PA projection. The detector position was fixed, whereas the X-ray tube performed a vertical continuous movement within a time period of 10 s. The tube voltage was 120 kV and the tube load was determined by a scout view (PA projection). The tube load used for the scout view, as determined by the automatic exposure control (AEC), was multiplied by a factor of 10 and equally distributed between the projections. According to Båth et al. (7), the effective dose to the standard-sized patient from a chest tomosynthesis examination using these settings is approximately 0.13 mSv (including the scout view). Each examination resulted in coronal section images covering the entire chest, with a reconstruction interval of 4 mm (beta version) and 5 mm (VolumeRAD) without overlap.
Reference method
Multidetector computed tomography (MDCT) examinations served as reference for nodule detection. The examinations were performed on 16- or 64-channel equipment (LightSpeed Pro 16 and LightSpeed VCT; GE Healthcare, Chalfont St Giles, UK) according to the standard protocol at our department, including axial, coronal, and sagittal reformations. The tube voltage was 140 kV and dose modulation was used, resulting in an effective dose estimated to 3.9 mSv for the LightSpeed Pro 16 and 4.1 mSv for the LightSpeed VCT for a standard-sized patient (17). The original slice thickness was 1.25 (LightSpeed Pro 16) and 0.6 mm (LightSpeed VCT), with a slice interval of 0.6 mm. The reconstructed axial images were 5 mm thick, with an increment of 5 mm, and the coronal and sagittal images were 4 mm thick, with an increment of 3 mm.
The MDCT reference was created by two experienced thoracic radiologists (more than 10 years of experience of thoracic radiology) in consensus. The nodules were identified using axial, coronal, and sagittal reformations in all cases. The largest diameter in the axial reformations was assessed. Identical magnification was used for the measurements (zoom factor 2). The images were analyzed using a PACS system (Centricity RA600; GE Healthcare, Chalfont St Giles, UK).
Detection study
The observers analyzed the 89 tomosynthesis cases in the first group for detection of pulmonary nodules using the free-response receiver-operating characteristics (FROC) paradigm (24). They were told that there was a ∼50/50 ratio of nodule to non-nodule cases and that there could be multiple nodules per case. No further patient history information was given. The observers were allowed to change window width and window level and to use the pan and zoom functions. They were instructed to mark the nodules on the images and to grade the confidence of presence for each marked nodule on a 4-point rating scale, where 4 represented the highest degree of confidence (definitely a nodule) and 1 the lowest (probably not a nodule). Each nodule was to be marked in only one image and in the most prominent location. The cases were analyzed using the in-house-developed software ViewDEX (25, 26), especially designed for the purpose of displaying medical images in observer performance studies, and were shown anonymized in random order for each observer. Before analyzing the tomosynthesis images, the observers were instructed to go through a set of demonstration cases in order to get used to the appearance of the images.
After learning with feedback (see below) the observers re-analyzed the 89 cases in the first group and the difference in performance before and after learning with feedback was calculated for each observer. The two readings of the 89 cases were separated by a time period of at least one month. A description of the study set-ups for the present study and the two previous studies (17, 18) is given in Fig. 1. In the first study (17), the 89 tomosynthesis cases were analyzed in order to compare the difference in performance between chest tomosynthesis and chest radiography. In the second study (18), the reading of the 89 cases of the first study was compared to a new reading of the 89 cases performed after one year of additional clinical experience. Finally, in the present study, two readings of the 89 cases were performed, separated by learning with feedback. The three experienced thoracic radiologists participated in all three studies, and for these observers the reading of the 89 cases after additional clinical experience in the second study was used as the first reading in the present study.
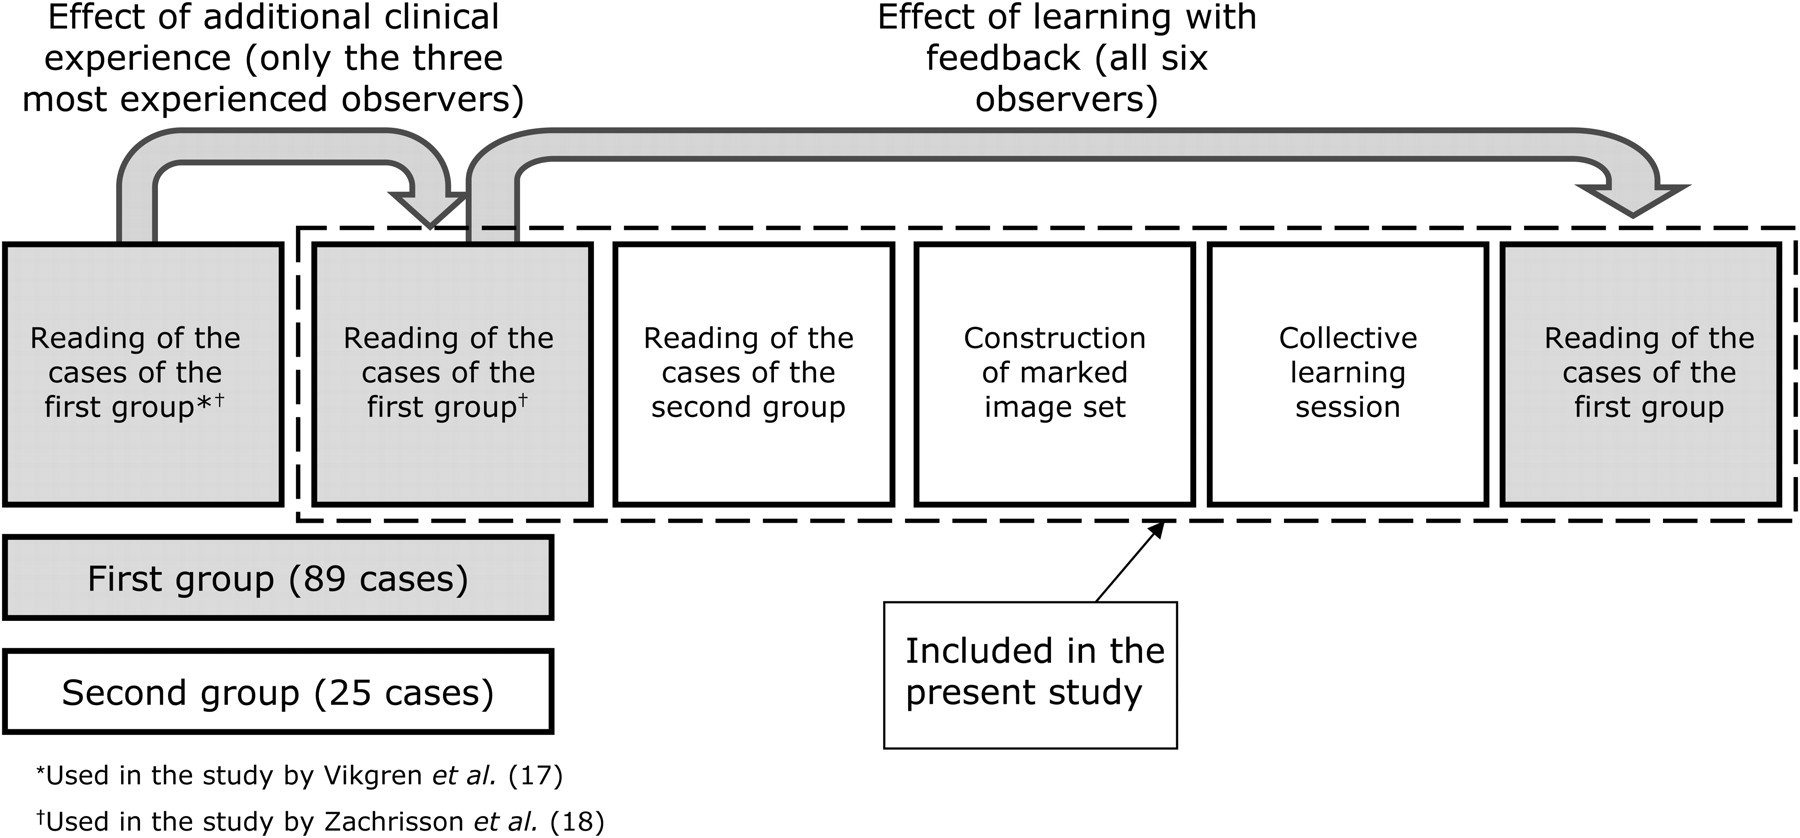
Description of study set ups for the present and the two previous studies (17, 18). The readings and analyses surrounded by a broken line were included in the present study. The three inexperienced observers participated in the last two readings of the 89 cases, which were included in the present study, whereas the three experienced observers participated in all three readings of the 89 cases
Learning with feedback, potential pitfalls, and quality criteria for chest tomosynthesis
As part of the learning with feedback, the observers analyzed the 25 tomosynthesis cases in the second group in a setting identical to the analysis of the 89 cases (see ‘Detection study’). In order to be displayed to the observers at the collective learning session, the marks made by any of the six observers in the 25 cases (including the ratings given by all observers), along with all true nodules according to the CT reference, were marked in the tomosynthesis images. Before the collective learning session, the observers were given the opportunity to go through the marked image set in order to prepare themselves.
At the collective learning session, which took approximately eight hours, the marked image set (consisting of the 25 cases) was displayed on large video screens using ViewDEX, along with the corresponding CT images for comparison (displayed using the PACS system [Centricity RA600; GE Healthcare, Chalfont St Giles, UK]). All authors participated in the collective session and discussed each mark. The observers – six of the authors – gave their reasons for making false-positives (i.e. falsely marking structures that were not nodules), making false-negatives (i.e. missing true nodules) or giving low ratings to true nodules. The reasons for making analysis errors were compiled and – together with the clinical experience of chest tomosynthesis as described by Johnsson et al. (16) – used to formulate suggestions on how to avoid pitfalls in tomosynthesis regarding detection of pulmonary nodules. These suggestions were used as support for the observers at the second reading of the 89 cases.
Based on the European guidelines on quality criteria for chest radiography (22) and chest CT (23), and taking into account the clinical experience of chest tomosynthesis (16), a preliminary proposal of quality criteria adapted to chest tomosynthesis had been formulated prior to the collective learning session. The preliminary quality criteria were further modified at the collective learning session, using normal tomosynthesis cases as test objects. In this discussion, especially the three experienced observers and the radiologists included in the consensus panel participated, although all authors participated in the session. The final criteria were divided into positioning criteria and image quality criteria. The positioning criteria were based on the European quality criteria for chest radiography (22), as the positioning of the patient was identical for the two techniques. The image quality criteria were mainly based on the European quality criteria for CT (23), although an adaptation to anatomical structures considered relevant for tomosynthesis was made. The definitions of degree of visibility used were ‘reproduction’ and ‘clear reproduction’. The latter is a revision of the definition ‘visually sharp reproduction’ in accordance with the revisions of the European quality criteria proposed by Hemdal et al. (27) (mammography), Carlander et al. (28) (pediatric chest radiography), and Larsson et al. (29) (chest radiography).
Statistical analysis
The locations and the ratings of the marks given by the observers were extracted from the log files produced by ViewDEX and compared with the true locations defined by the CT consensus panel. Based on the nodule localization in the CT images, the nodules were marked in the tomosynthesis images to obtain the true locations. Some of the nodules could not be seen in the tomosynthesis images, but were marked in the locations where they should have been, according to the CT images. Each mark was thus classified as a true-positive (i.e. a mark coinciding with a true lesion) or a false-positive (i.e. a mark not coinciding with a true lesion). (Throughout this paper, false-positives and true-positives refer to marks on the lesion level if not otherwise stated.) In order to automatically be classified as a true-positive, the distance between a mark and the closest true location had to be less than or equal to half the nodule size. However, dubious marks were visually inspected in order to compensate for uncertainties in the marks of the true lesions, the limited depth resolution of tomosynthesis and the fact that the nodules were not perfectly spherical.
The FROC data were analyzed using jackknife alternative free-response receiver-operating characteristics (JAFROC), described in several recent papers (30–35) and implemented in the software JAFROC_V3g (36). The software calculates a figure of merit (FOM) that is defined as the trapezoidal area under the alternative free-response receiver-operating characteristics (AFROC) curve. The AFROC curve is the plot of the cumulative distributions of the lesion localization fraction (LLF) and the false-positive fraction (FPF) against each other, where LLF is the fraction of nodules detected and FPF is defined in the same way as in traditional ROC. The FOM can also be described as the probability that a lesion is rated higher than the highest rated false-positive in a normal case (34). JAFROC_V3g calculates the FOM of each modality and the difference between the means with 95% confidence intervals (37). The importance of a nodule can be considered in the statistical analysis by giving each nodule a weighting factor. In the present study the clinical importance of the nodules was not analyzed, and thus the weighting factors were identical for all nodules within the same case.
Since traditional ROC is the current gold standard, the area under the ROC curve (AUC) was calculated as an additional measure of detectability. The highest rating of all marks in a given case – for each reading and for each observer separately – was used as the ROC rating. Cases without marks were assigned the value 0. The area under the ROC curve was determined using JAFROC_V3g, which calculates the trapezoidal area under the ROC curve and the difference between the means with 95% confidence intervals.
Results
Detection study
The JAFROC FOMs for each observer for the 89 cases in the first group, before and after learning with feedback, are shown in Fig. 2. There was a significant increase in FOM between the first and the second reading for Observer 4 (p = 0.008), the gastrointestinal radiologist, and for Observer 6 (p = 0.002), the medical physicist. For the other observers, no significant difference was found between the two readings. Regarding differences between the observers, at the first reading Observer 6 performed significantly worse than all other observers (p ≤ 0.01 for all comparisons), but at the second reading this observer could not be statistically separated from any of the others (p ≥ 0.08 for all comparisons). However, at the second reading, Observer 3 performed significantly worse than all observers (p ≤ 0.02) except Observer 6 (p = 0.17).

The jackknife alternative free-response receiver-operating characteristics (JAFROC) figure of merit (FOM) – for the 89 cases in the first group – before (dark gray bars) and after (light gray bars) learning with feedback for the experienced thoracic radiologists (1–3), the gastrointestinal radiologist (4), the radiology resident (5) and the medical physicist (6). Uncertainty bars represent 95% confidence intervals
The traditional ROC analysis showed no significant differences between the two readings of the 89 cases for any observer, but a trend similar to that of the JAFROC analysis was seen for all observers.
Potential pitfalls and quality criteria for chest tomosynthesis
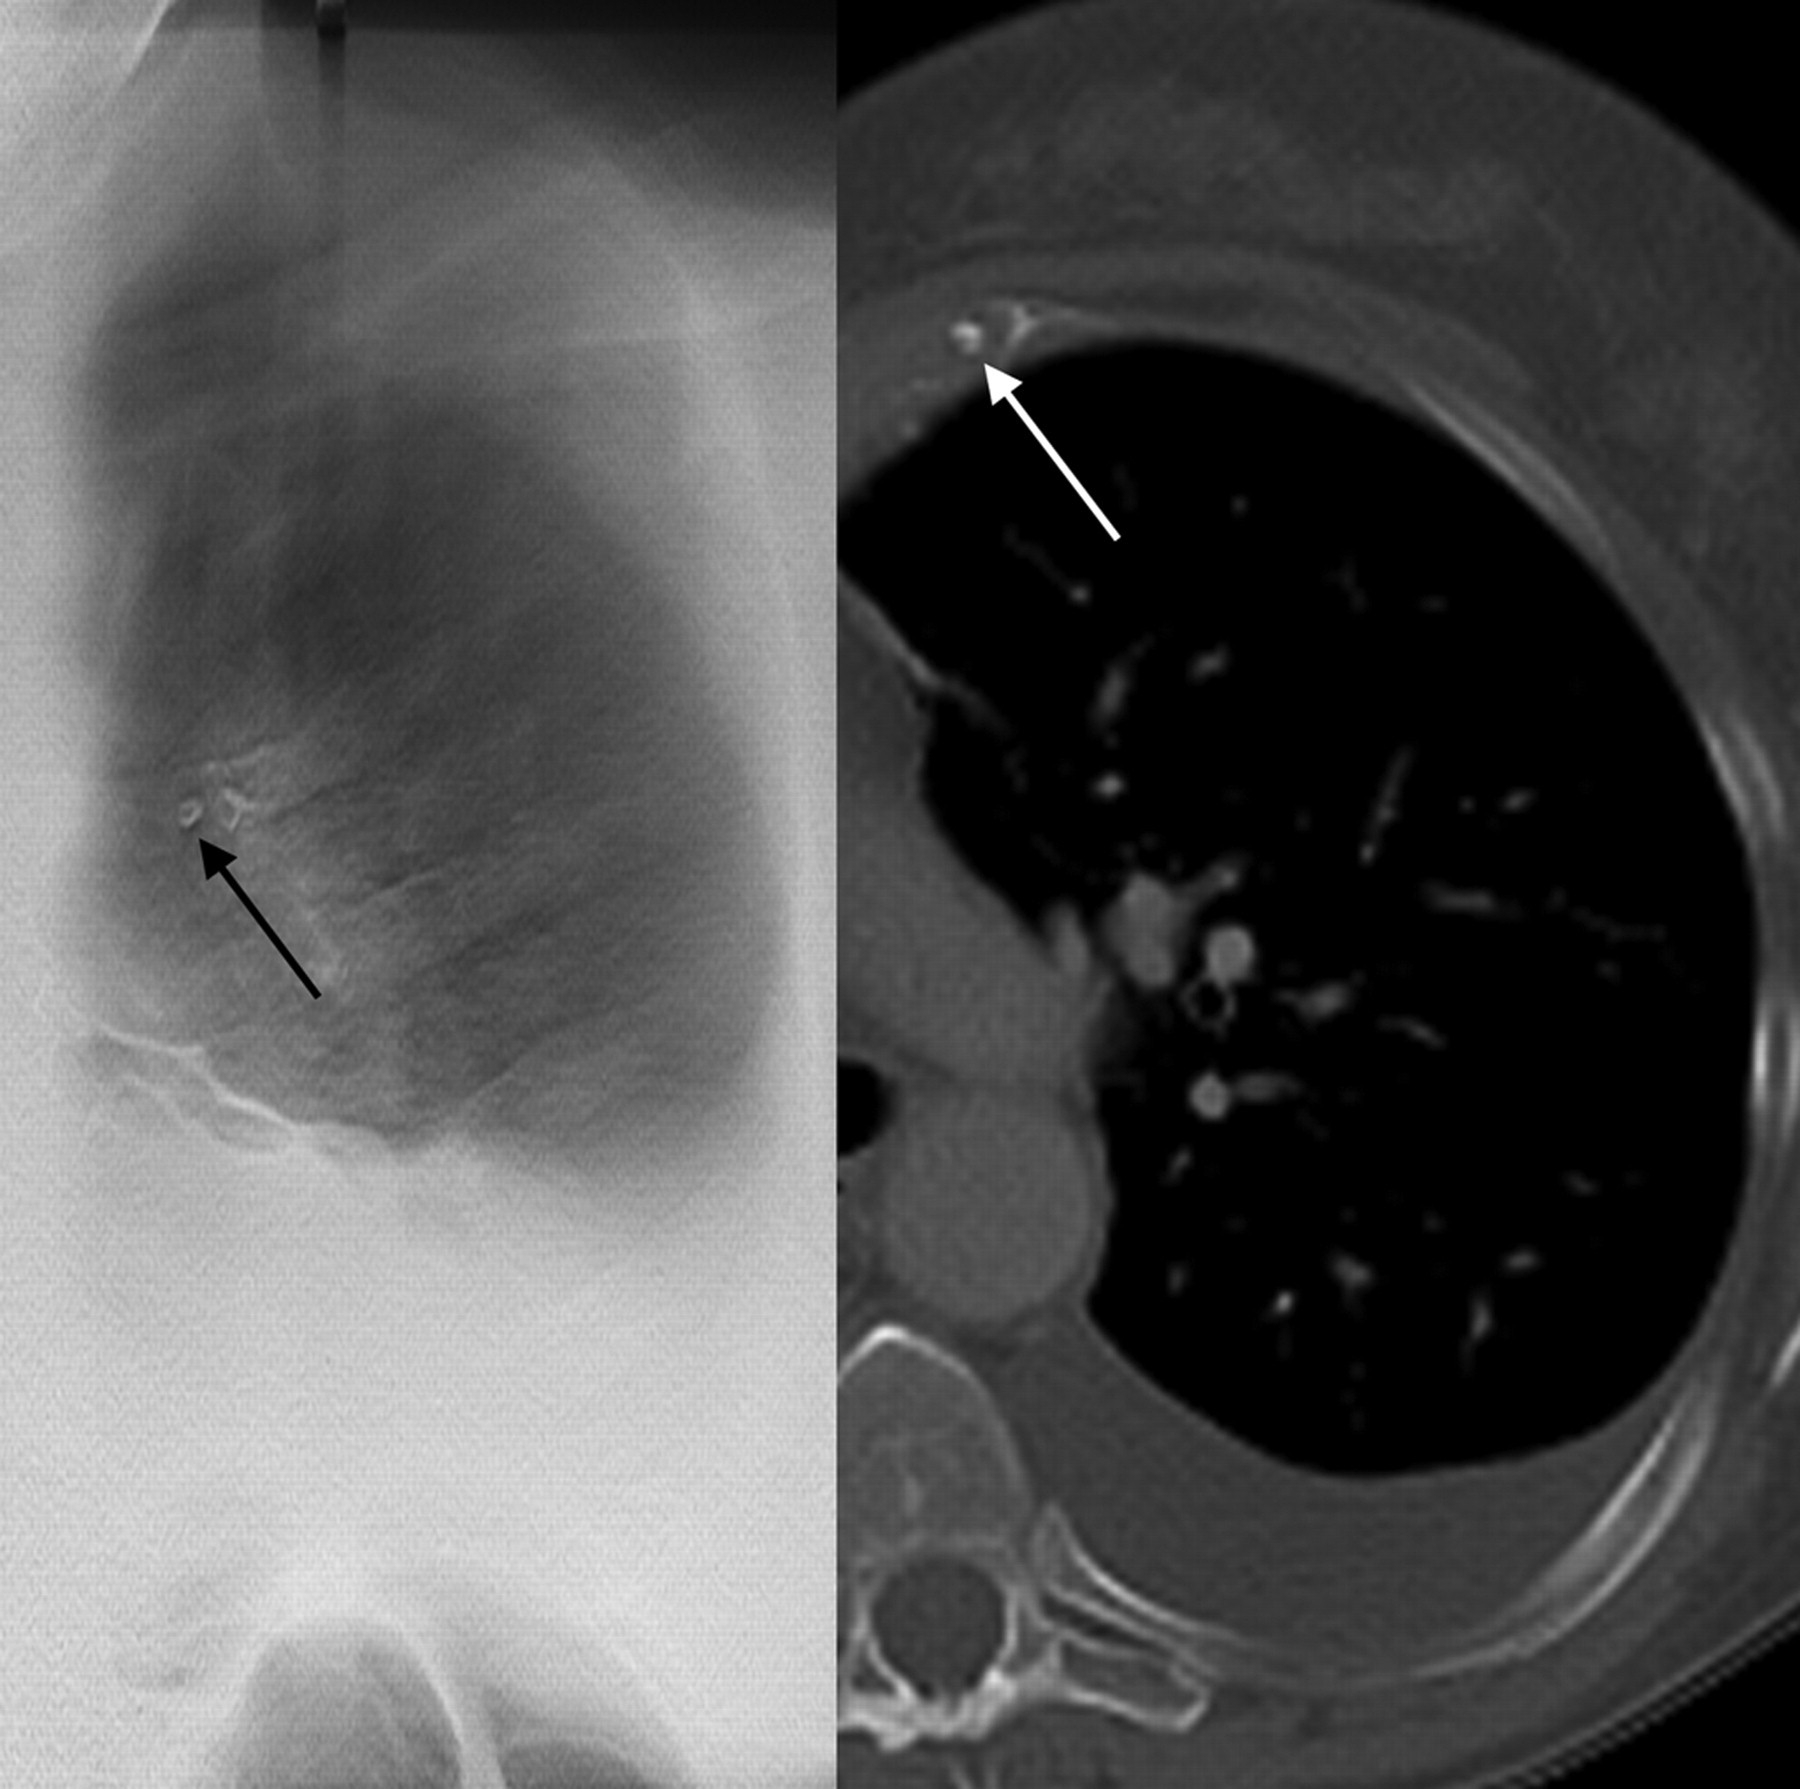
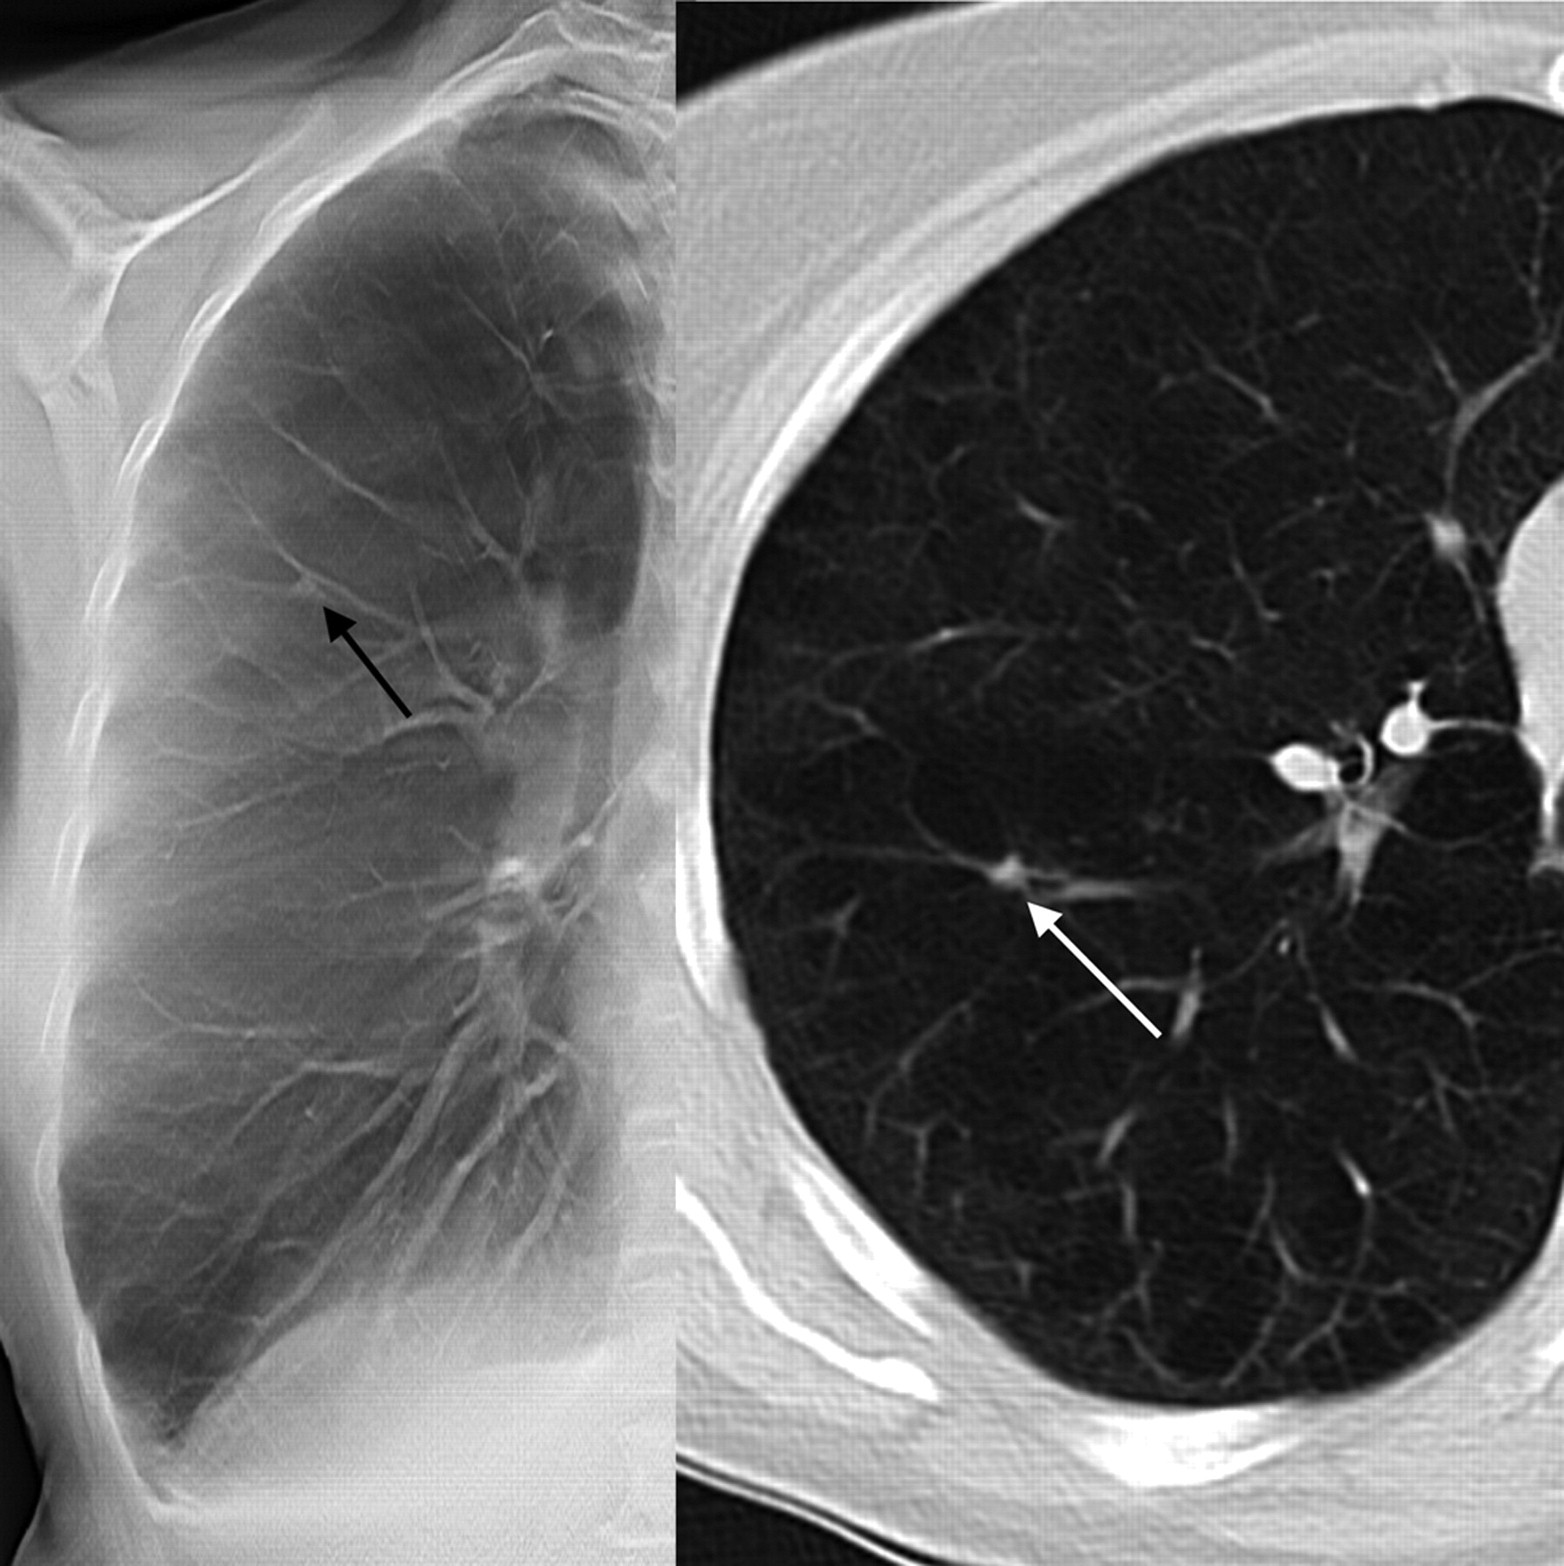
Potential pitfalls and suggestions on how to avoid them are shown in Table 2. At the collective learning session, it was found that false-positives and false-negatives had often been made near pleural borders. Hilar and mediastinal lymph nodes and skeletal changes, including costochondral calfications, had occasionally been interpreted as nodules. In some cases, nodules situated close to vessels had been misinterpreted as part of the vessel itself, especially at branching points. Very small nodules (2–3 mm) were usually depicted well with tomosynthesis, although they had sometimes been discharged by the thoracic radiologists as unspecific findings. Examples of pitfalls in tomosynthesis are shown in Figs. 3–7, along with the corresponding CT images. The proposed quality criteria for tomosynthesis are shown in Table 3. Note that the criterion ‘reproduction of the whole rib cage’ refers in tomosynthesis also to the reconstructed volume and not only to the positioning of the patient, as is the case in chest radiography.
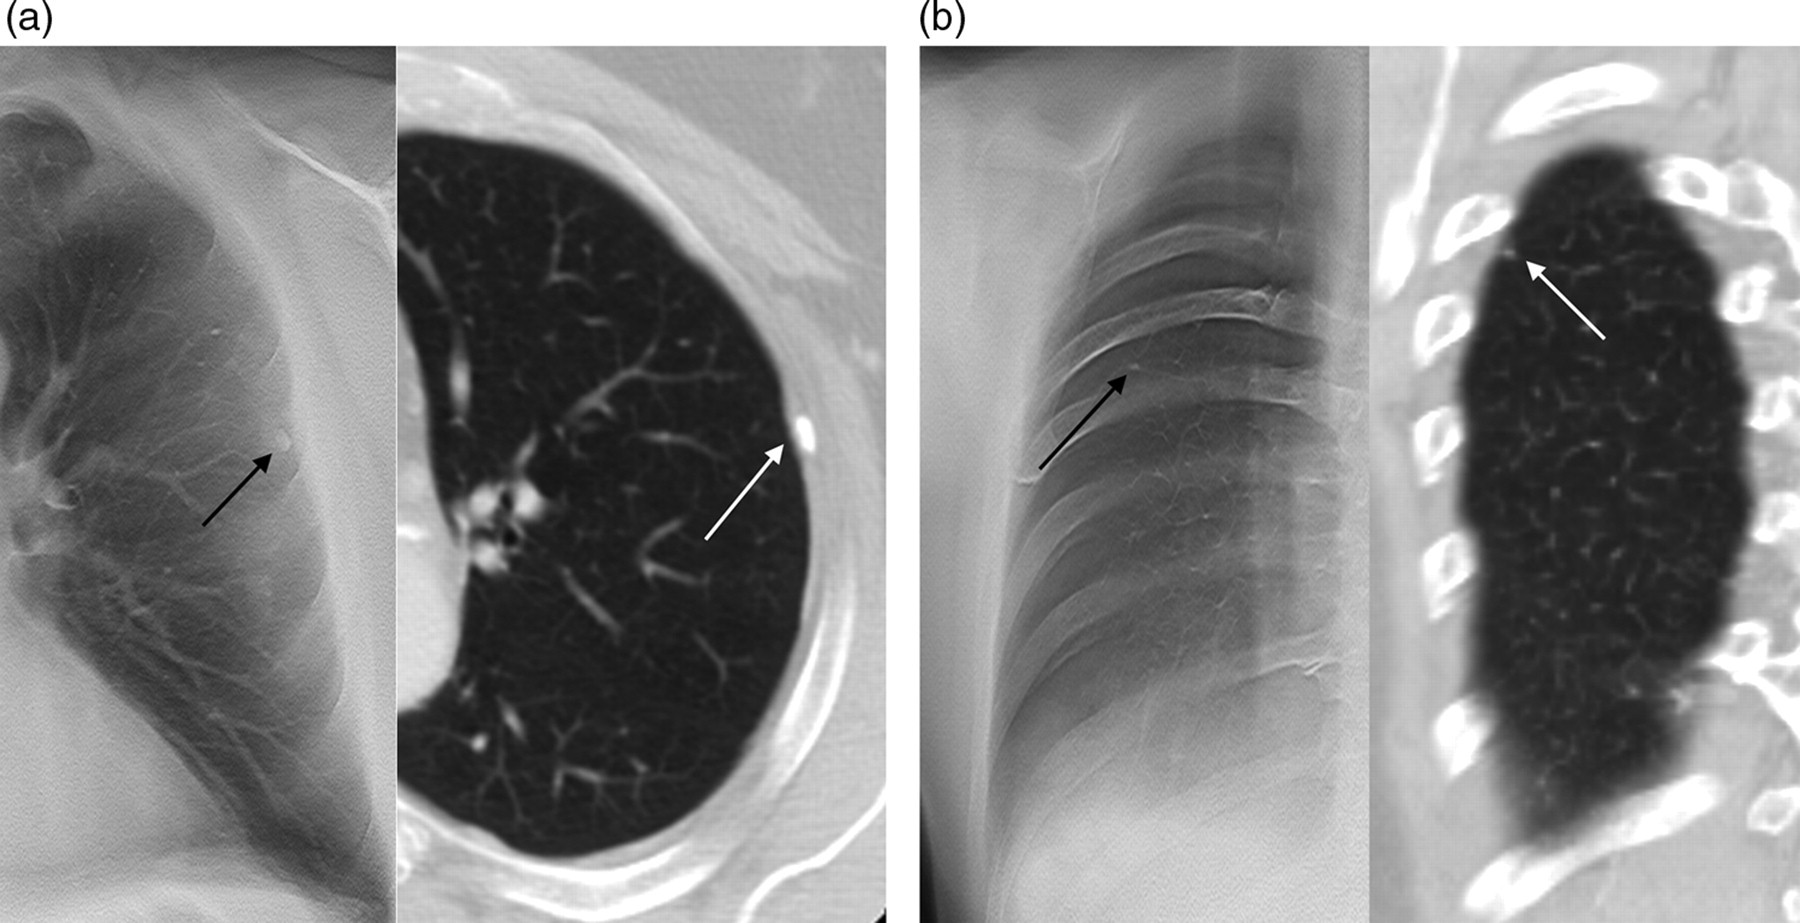
Examples of pleural structures, which may be mistaken for pulmonary nodules; a pleural plaque (a) depicted by tomosynthesis (left) and CT (right), and a nodular thickening of the interlobar fissure (b) depicted by tomosynthesis (left) and CT (right)
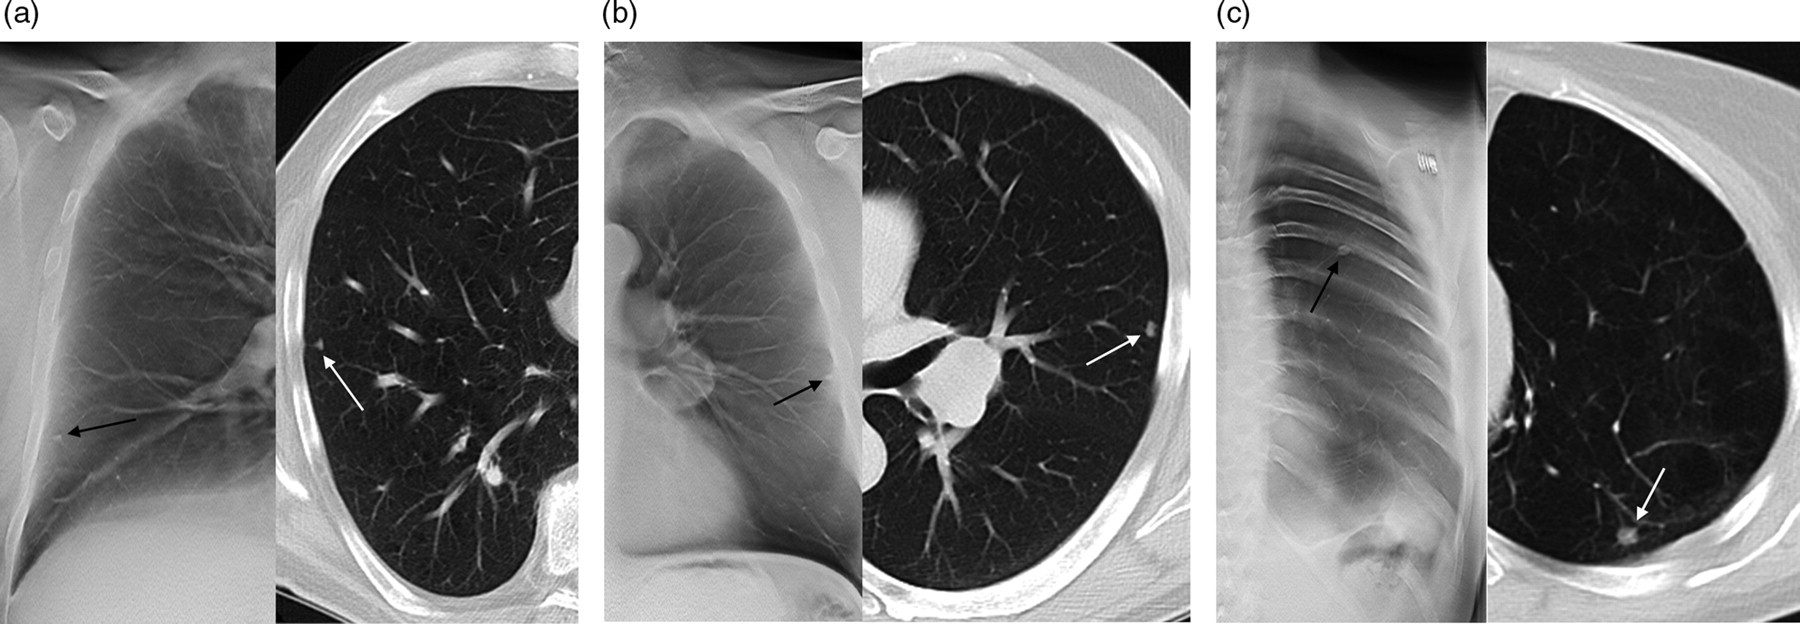
Examples of nodules situated close to the pleura border (representing different degrees of difficulty); where the direction of the radiation beam is tangential to the ribs (a) depicted by tomosynthesis (left) and CT (right), where the direction of the radiation beam is not perfectly tangential to the ribs (b) depicted by tomosynthesis (left) and CT (right) and where the direction of the radiation beam is not tangential to the ribs (c) depicted by tomosynthesis (left) and CT (right)
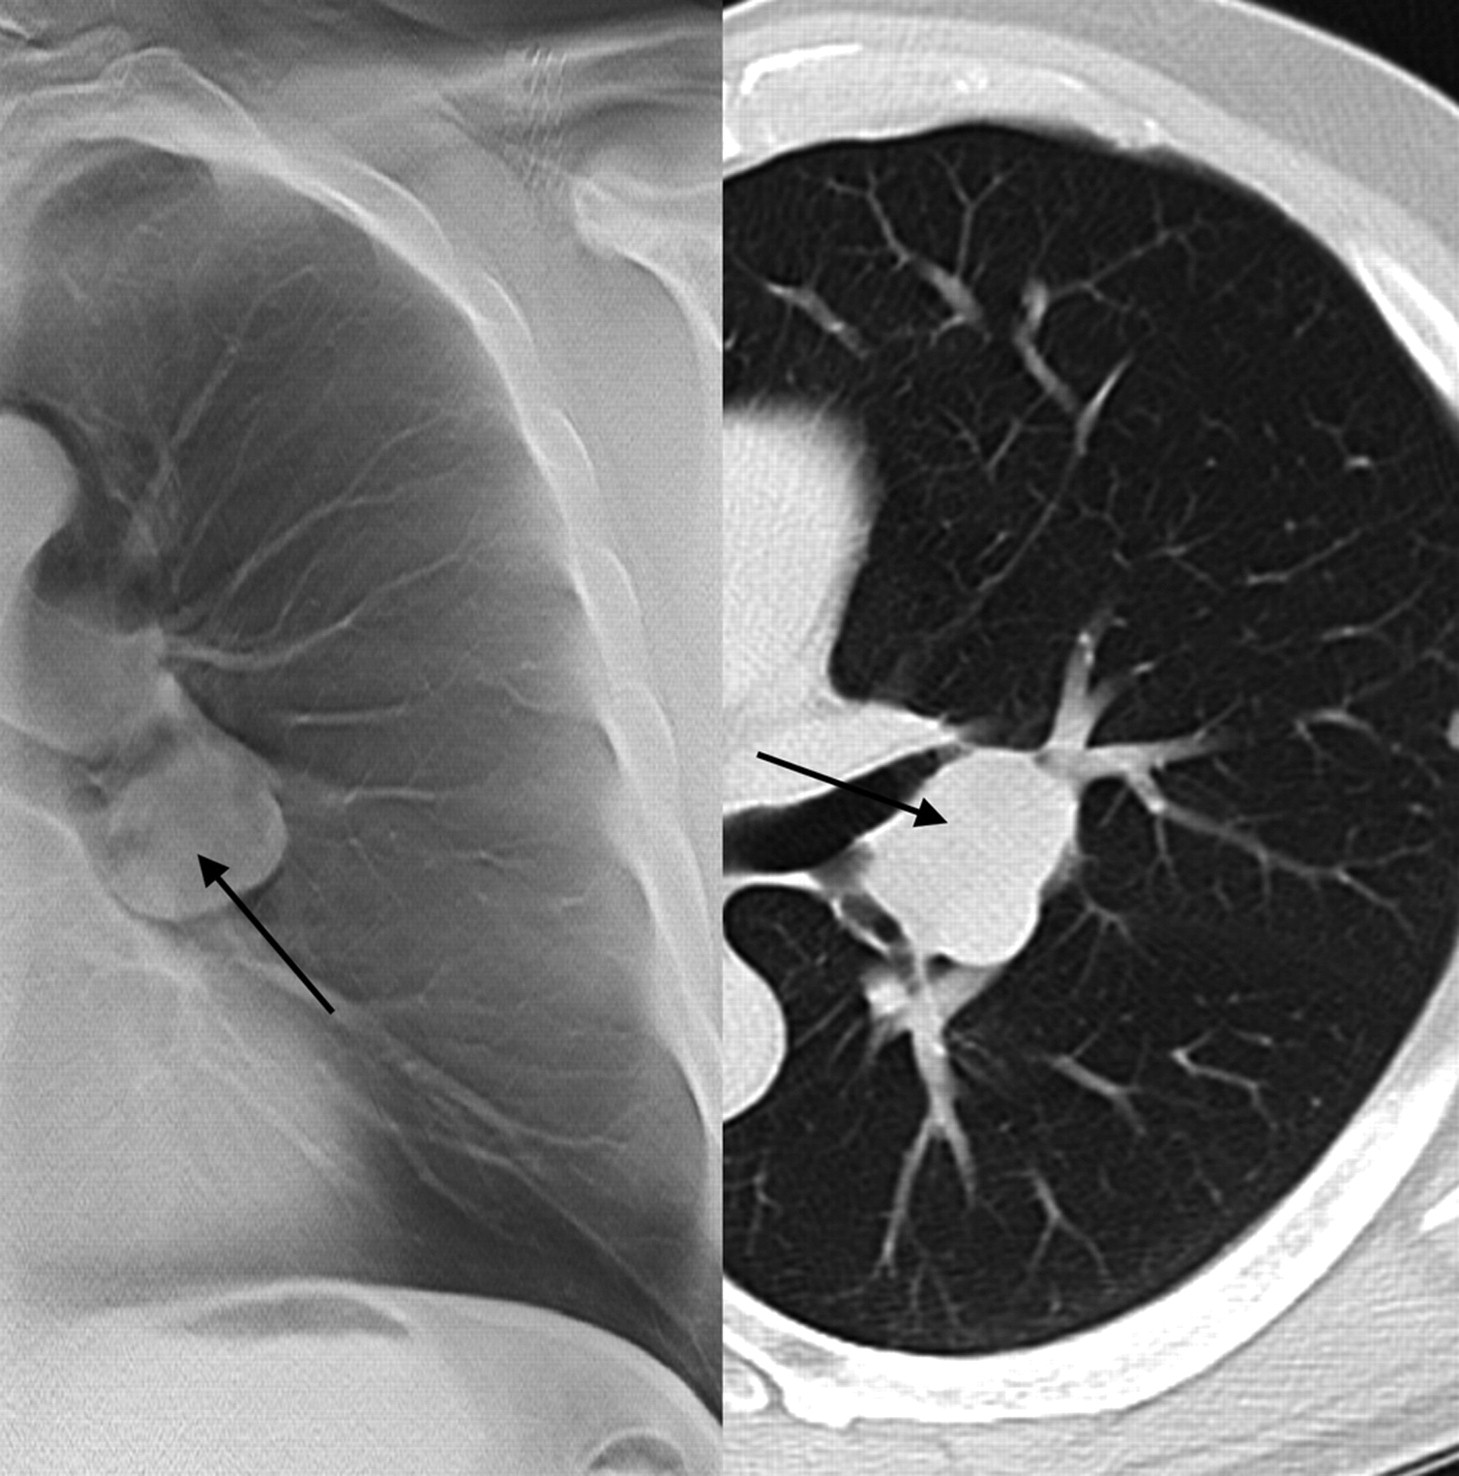
Example of hilar lymph node, which may be mistaken for a nodule in tomosynthesis, depicted by tomosynthesis (left) and CT (right)
Example of a costochondral calcification, which may be mistaken for a nodule, depicted by tomosynthesis (left) and CT (right)
Example of nodule in vessel branching point, which may be mistaken for an enlarged vessel in tomosynthesis, depicted by tomosynthesis (left) and CT (right)
Suggestions on how to avoid potential pitfalls regarding nodules in chest tomosynthesis
Proposed positioning and image quality criteria for chest tomosynthesis
Discussion
As chest tomosynthesis has recently been introduced to healthcare, the effects of learning of the new technique have not yet been fully investigated and knowledge regarding the difficulties in analyzing the images has not yet been compiled. In this study, one aim was to evaluate the effect of learning with feedback on the detectability of pulmonary nodules. The results showed no significant difference in detectability for the experienced thoracic radiologists. This result strengthens the interpretation of our previous study (18) that such observers can take advantage of tomosynthesis for detection of pulmonary nodules after only a short period of clinical experience of the technique. In this study, however, the observers inexperienced in tomosynthesis benefited more from the learning with feedback and could reach a level of detectability similar to that of an observer experienced in tomosynthesis.
Observer 5 (the resident) did not improve after learning, something that might seem contradictory to the results of the two other inexperienced observers. However, an explanation for the lack of improvement may be that the experience of tomosynthesis for this observer was enough for reaching a level of performance that could not be improved further by additional learning, as this observer performed at a high level even before learning with feedback.
Tomosynthesis is sometimes called ‘limited angle CT’ because, as in CT, section images of the body are obtained. In tomosynthesis, however, a limited angular range is used and therefore the sampling of the signal in the frequency domain is limited for tomosynthesis compared to CT (i.e. the whole frequency domain is not sampled) (3, 38). Because of this, the depth resolution is poorer in tomosynthesis than in CT. However, the resolution in the plane of the reconstructed images is better for tomosynthesis than for CT, mainly due to the higher resolution of the detectors used in tomosynthesis (corresponding to a better sampling of the signal in the x–y plane [detector plane] in the frequency domain). The difficulties associated with analyzing the tomosynthesis images presented in Table 2 are mainly a result of the limited depth resolution in tomosynthesis. For example, false-positives and false-negatives were often made near pleural borders. A plausible explanation for this is that the position of a structure in this area is difficult to establish when the direction of the X-ray beam is not tangential to the pleural border. Especially ribs overlapping a nodule may lead to misinterpretations of whether the structure is situated in the parenchyma or in the pleura. Fig. 3a shows an example of a pleural plaque depicted with tomosynthesis, which may be mistaken for a nodule because it appears as being fully surrounded by lung parenchyma. In the corresponding CT image, however, it is apparent that the structure is not situated in the parenchyma. Fig. 3b shows an example of a nodular thickening of the interlobar fissure depicted with tomosynthesis, which may be mistaken for a nodule. In the corresponding CT image, it is shown that the structure is much closer to the pleura than it seems to be according to the tomosynthesis image. Fig. 4 shows three examples of nodules that are situated near pleural borders. The first nodule (Fig. 4a), situated where the direction of the X-ray beam is tangential to the ribs, appears as separated from the pleura in the tomosynthesis image as well as in the CT image. The second nodule (Fig. 4b) is situated at a similar distance from the pleura as the nodule in Fig. 4a according to the CT image, but at a location where the X-ray beam is not perfectly tangential to the ribs, and therefore it appears as being closer to the pleura in the tomosynthesis image than in the CT image. The third nodule (Fig. 4c) is situated posteriorly and is overlapped by a rib; a situation where accurate localization in tomosynthesis may be difficult. However, by relating the location where the ribs are in focus to the position of the nodule (Table 2) one might realize that the structure is situated in the parenchyma. Regarding lymph nodes, the limited depth resolution may also lead to misinterpretations of whether there is a nodule situated closely to the hilar or mediastinal regions or if there is an enlarged lymph node present. An example of a structure, which may be misinterpreted as a nodule in tomosynthesis and which, according to the corresponding CT image, is a hilar lymph node is presented in Fig. 5. This problem may, however, also occur in CT. Fig. 6 shows an example of a structure, which – once again because of the limited depth resolution – may be mistaken for a nodule in tomosynthesis, but which is a costochondral calcification according to the corresponding CT image. Awareness of the effects of the limited depth resolution, especially at the difficult regions posteriorly and anteriorly, is of great clinical importance in order to differentiate nodules – which by definition are restricted to the parenchyma – from structures that are situated in the pleura. In Fig. 7, an example of the difficulty of differentiating nodules close to vessels from the vessel itself is shown. In this case, a nodule is situated in a vessel branching point, possibly giving the observer the impression of an enlarged vessel. The corresponding CT image shows that there is a nodule in proximity to the branching vessel. This misinterpretation can partly be explained by the limited depth resolution in tomosynthesis, but the use of contrast medium in CT can also result in a higher differentiation between nodules and vessels in CT than in tomosynthesis. Whether the use of contrast medium is beneficial also in chest tomosynthesis remains to be investigated.
The suggestions on how to avoid pitfalls are intended primarily for radiologists inexperienced in tomosynthesis, such as Observer 4. As an example of improvement for this observer, the number of errors due to summation of overlaying anatomy, for which there was no morphological correlate in CT, decreased from three in the first reading to zero in the second reading. It should also be noted that for those false-positives that were identical for all experienced observers, there were in all but one case (in which there was some breathing artifacts) a morphological correlate (other than a nodule) found in the CT reference. Thus, it seems as if the difficulties in analyzing chest tomosynthesis images are not only related to the determination of presence of a structure, but also to the localization – and in turn the characterization – of the structure. Tomosynthesis has, however, not only drawbacks compared to CT, but has also the advantage of high resolution in the x–y plane. At the collective learning session it was found that small nodules of 2–3 mm in size were often well-depicted with tomosynthesis, sometimes even better than with CT (with thick slices, i.e. 4–5 mm), especially if they were calcified.
In a previous study (18), JAFROC1 was used for the statistical analysis. In this study, however, we used JAFROC (also called JAFROC2), as JAFROC1 has recently shown an incorrect statistical behavior for datasets containing much fewer false-positives on abnormal image than on normal images. Although this may seldom be the case – and it was not the case in the present study – JAFROC1 is exclusively recommended for studies including abnormal cases only. For studies including both normal and abnormal cases, JAFROC is now recommended (39). The results of the previous study, in which JAFROC1 was used, would not have been affected by the incorrect statistical behavior since the number of false-positives in abnormal images was not fewer than that in normal images.
In this study, the JAFROC analysis resulted in significant differences between the two readings for two observers while the ROC analysis did not. This is not surprising, as traditional ROC previously has been shown to have an inferior statistical power compared to the JAFROC methods (30, 31).
The cases in the second group contained a higher number of pleural and subpleural structures than the cases in the first group. This might have given the observers the impression that the misinterpretations of pleural and subpleural structures are more common than they are in general. This should be kept in mind when studying Table 2. However, correct characterization of these structures is, nevertheless, of great importance and they are still the most difficult structures to analyze.
It should be noted that the suggested quality criteria for tomosynthesis presented in this work were not subject to a detailed investigation similar to the development and evaluation of the European quality criteria for chest radiography (22) and chest CT (23). The procedure to adapt the European quality criteria to chest tomosynthesis in the present study had more resemblance with the modification of the European quality criteria performed by Hemdal et al. (27), Carlander et al. (28), and Larsson et al. (29). Therefore, the criteria proposed here may be subject to change.
In this study relatively thick CT images (5-mm axial and 4-mm sagittal and coronal) were used as reference, according to standard protocol for chest CT at our department. Fischbach et al. (40) showed that the detectability was 40–50% lower with 5-mm images than with 1.25-mm images for nodules 2–5 mm and 10–20% lower for nodules 6–10 mm, although these numbers are uncertain because of few observers and cases. This implies that the number of true nodules may have been underestimated in this study, leading to an over-estimation of the true-positive fraction. However, small nodules reported by the observers in the tomosynthesis images may have been erroneously classified as false-positives, leading to an over-estimation also of the number of false-positives. Thus, it is not obvious that the JAFROC FOM – taking into account both true-positives and false-positives – would have been substantially reduced had a different reference been used. In either case, the relationship between the two readings of tomosynthesis would most likely remain unchanged. For this study, the 1.25-mm and 0.6-mm CT images were not available, but in future studies such CT images will be used for the reference method to avoid these situations.
For the learning with feedback, a larger number of cases would have been preferable. There are most definitely more pitfalls in chest tomosynthesis than reported in this study, and the use of a larger number of cases would have increased the possibility of finding these.
Regarding limitations of the present study, since the tomosynthesis cases used for testing the detectability before and after learning with feedback (the 89 cases in the first group) were identical to the ones used in two previous studies (17, 18), it may be argued that there is a risk of recall bias between the readings. However, since the observers were never informed about the localization of the nodules, it seems unlikely that such bias would affect the detectability. Furthermore, the readings were separated by a time period of at least one month.
In conclusion, the present study indicates that observers inexperienced in chest tomosynthesis can reach a high level of performance regarding detection of pulmonary nodules in a short period of time by going through learning with feedback. In the present paper, an attempt to condense the knowledge gained at the collective learning session into potential pitfalls regarding detection of pulmonary nodules in chest tomosynthesis, and suggestions on how to avoid them, has been made. The main problem with chest tomosynthesis seems to be the limited depth resolution, as this may lead to difficulties in the interpretation of for example pleural and subpleural nodules or structures. Finally, based on established quality criteria for chest radiography and chest CT, quality criteria intended for optimization of chest tomosynthesis are proposed in the paper.
Footnotes
ACKNOWLEDGEMENTS
The authors would like to acknowledge Dev P Chakraborty for statistical advice on JAFROC analysis, Lena Olbers for organizing the image collection and Gerhard Brunst for valuable comments on the manuscript. This work was supported by grants from the Swedish Radiation Safety Authority, the King Gustav V Jubilee Clinic Cancer Research Foundation, and the Health & Medical Care Committee of the Region Västra Götaland.