
Abstract
Background
Simulated pathology is a valuable complement to clinical images in studies aiming at evaluating an imaging technique. In order for a study using simulated pathology to be valid, it is important that the simulated pathology in a realistic way reflect the characteristics of real pathology.
Purpose
To perform a thorough evaluation of a nodule simulation method for chest tomosynthesis, comparing the detection rate and appearance of the artificial nodules with those of real nodules in an observer performance experiment.
Material and Methods
A cohort consisting of 64 patients, 38 patients with a total of 129 identified pulmonary nodules and 26 patients without identified pulmonary nodules, was used in the study. Simulated nodules, matching the real clinically found pulmonary nodules by size, attenuation, and location, were created and randomly inserted into the tomosynthesis section images of the patients. Three thoracic radiologists and one radiology resident reviewed the images in an observer performance study divided into two parts. The first part included nodule detection and the second part included rating of the visual appearance of the nodules. The results were evaluated using a modified receiver-operating characteristic (ROC) analysis.
Results
The sensitivities for real and simulated nodules were comparable, as the area under the modified ROC curve (AUC) was close to 0.5 for all observers (range, 0.43–0.55). Even though the ratings of visual appearance for real and simulated nodules overlapped considerably, the statistical analysis revealed that the observers to were able to separate simulated nodules from real nodules (AUC values range 0.70–0.74).
Conclusion
The simulation method can be used to create artificial lung nodules that have similar detectability as real nodules in chest tomosynthesis, although experienced thoracic radiologists may be able to distinguish them from real nodules.
Chest tomosynthesis has recently been introduced to healthcare as a low-dose alternative to computed tomography (CT) or as a tool for improved diagnostics in chest radiography at only a modest increase in radiation dose to the patient. Chest tomosynthesis refers to the technique of acquiring low-dose projections of the chest over a limited angular range and using these projections to reconstruct an arbitrary number of section images of the chest (1–3). Compared to CT, the limited angular range used in tomosynthesis results in a reduction in depth resolution, in turn enabling a substantial reduction in radiation dose (4, 5). Compared to chest radiography, however, the disturbance of overlapping anatomy, which is the main limiting factor for detection of pulmonary nodules in chest radiography (6–13), is considerably reduced in chest tomosynthesis.
The introduction of new technologies in medical imaging is of great value for healthcare, but in many cases it might be difficult to find the optimal use of the new technology in daily clinical practice. In order to accomplish such a task, the diagnostic outcome of using the new technique must be thoroughly investigated, and the benefits of using the new technique, compared to using established routines, should be analyzed. One way to evaluate an imaging technique and compare it to other techniques available is to perform observer performance studies with detection tasks. The most clinically relevant results from such a study are obtained when clinical images are used (14, 15). It might however be difficult to collect clinical images that meet the desired requirements for study inclusion. For example, the time necessary to obtain an image material containing a variation in pathology suitable for an observer study may be unsatisfactorily long. The use of so-called hybrid images, i.e. anatomical images containing simulated pathology, has proven to be a valuable complement to clinical images in such cases (8, 10, 12, 16–20). One of the advantages of using simulated pathology is that the size, attenuation, and location of the pathology can be controlled, allowing for a systematic investigation of the limitations in detectability for the imaging system. In order for a study using hybrid images to be valid, it is however important that the hybrid images reflect the clinical situation in a realistic way, i.e. it is important that the simulated pathology matches the detectability and visual appearance of real pathology.
Evaluation of a method of simulating pathology can be performed in different ways. A common approach is to conduct observer performance experiments, in which both real and simulated lesions are included (21–27). For example, Saunders et al. (23, 24) presented a method of simulating mammographic lesions. The visual appearance of the simulated lesions was validated by conducting an observer performance experiment using 200 mammographic images containing either real or simulated pathology. Three experienced radiologists reviewed the image material and for each lesion, real or simulated, the observers rated their confidence for the lesion being real on a 100-point scale. The results showed high agreement between real and simulated lesions. However, no evaluation of the detectability of the lesions was made. Li et al. (26) presented a method for three-dimensional simulation of lung nodules for paediatric multidetector array computed tomography (MDCT). In total 93 image sets, each containing zero or one (either real or simulated) nodule, were evaluated by four experienced paediatric radiologists. For each image set the observers had to determine if a nodule was present and, in that case, identify the nodule and grade their confidence for the nodule being real on a scale from 0 (definitely not real) to 100 (definitely real). The detectability of the nodules was evaluated by comparing the percentage detection rate and percentage false detection rate of real and simulated nodules. The results revealed that the detection rate was higher for real than for simulated lesions, but the observers had difficulties in visually separating the simulated lesions from real nodules.
Our research group recently described a method of simulating pulmonary nodules in chest tomosynthesis images (28). Using this method, three-dimensional artificial nodules are created and thereafter inserted into the projection images of a tomosynthesis examination before reconstruction of the section images. Feedback from experienced thoracic radiologists indicated that they had difficulties in separating the simulated nodules from real nodules, but no scientific study supporting this claim was conducted. The purpose of the present work was therefore to perform a thorough evaluation of the method, comparing the detection rate and appearance of the artificial nodules with those of real nodules in an observer performance experiment.
Material and Methods
Image collection
The Regional Ethical Review Board in Gothenburg, Sweden, for the Region of Västra Götaland approved the study and all participating patients gave written informed consent. Patients from an oncology department, referred for CT examination of the chest, were consecutively invited to participate in the study. At the time of the study, the standard procedure was to combine the CT examination with a chest radiography examination. For study purposes, also an additional chest tomosynthesis examination was included. All patients were investigated with all three techniques on the same day.
Chest radiography and chest tomosynthesis examinations
Both the chest radiography examinations and the tomosynthesis examinations were performed using the GE Definium 8000 X-ray system with VolumeRAD option (GE Healthcare, Chalfont St Giles, UK). The chest radiography examination included both a posteroanterior (PA) view and a lateral view. The PA images were collected using a tube voltage of 125 kV and a filtration of 3 mm Al + 0.1 mm Cu, while the lateral views were collected using a tube voltage of 140 kV and a filtration of 3 mm Al + 0.2 mm Cu. The focus-detector distance was 180 cm for both views and automatic exposure control (AEC) was enabled for the collection of both the PA and lateral images.
During a chest tomosynthesis examination using this system the detector position is fixed, whereas the X-ray tube performs a vertical continuous sweeping movement from −17.5° to +17.5° relative to the standard orthogonal PA projection. During this sweep, 60 low-dose projection images of the patient are collected in the angular interval of −15° to +15° during a time period of approximately 10 s. The focus-detector distance is 180 cm in the standard orthogonal PA projection and a tube voltage of 120 kV and a filtration of 3 mm Al + 0.1 mm Cu is used. For the GE Definium 8000 VolumeRAD system, the X-ray output during a tomosynthesis examination is determined by an initial scout image (a PA chest radiograph) of the patient, collected using AEC. The exposure used to acquire the scout is multiplied by a constant factor (commonly 10), and distributed over the 60 angular projections. The resulting exposure for each projection is then rounded down to the closest mAs setting possible, using the constraint of a minimum tube load of 0.25 mAs per projection. The detector size is 2022 × 2022 pixels, with a pixel size of 0.2 × 0.2 mm2. The focal spot size is 1.25 × 1.25 mm2. The acquired projection images are used to reconstruct tomosynthesis coronal section images. In the present work the tomosynthesis section images were reconstructed using a nominal slice thickness of 5 mm without overlap.
CT examination
The multidetector CT (MDCT) examinations were performed with 16- or 64-section equipment (Lightspeed Pro 16 and Lightspeed VCT, GE Healthcare, Milwaukee, WI, USA) according to the standard protocol at our department (140 kV and 120–500 mA). For the 16-detector row scanner the detector configuration was 16 × 1.25-mm section gap and pitch 1.375:1. For the 64-detector row scanner the detector configuration was 64 × 0.63-mm section gap and pitch 0.984:1. Thin section images (1.25 mm) were reconstructed with an interval of 0.6 mm. Additionally, coronal and sagittal reformations (4 mm thickness with an interval of 3 mm) were reconstructed.
Reference method
The MDCT examinations served as the reference method for nodule detection. Two thoracic radiologists, both with more than 10 years of experience of thoracic radiology and approximately 4 years of experience of chest tomosynthesis, individually assessed the CT images, marking suspicious nodular lesions. One of the radiologists used the commercially available computer-aided detection (CAD) software Lung Volume Computed Assisted Reading (Lung VCAR; GE Healthcare, Milwaukee, WI, USA) at a General Electric Advantage Windows 4.4 workstation (GE Healthcare, Milwaukee, WI, USA) for the image evaluation. To reduce the number of false-positives commonly associated with the use of CAD, Lung VCAR was configured to only highlight suspicious nodules with a diameter larger than 3 mm. All highlighted markings were then visually evaluated and for each identified nodule the size was determined by manual measurements in three orthogonal planes (transverse plane, sagittal plane, and coronal plane). The other radiologist reviewed the thin-slice CT images without guidance from CAD software and made manual measurements of nodule sizes as described above. Nodules marked by both radiologists were automatically included as true nodules in establishing the reference. Nodules marked by only one of the radiologists were reassessed by the two radiologists in a joint session to reach a consensus decision. During the creation of the reference, patients with other disturbing pathology and extensive radiation-induced lung injury were excluded from the study. Also patients with more than 30 detected nodules in the CT images were excluded. The final patient material consisted of 64 patients; 38 patients with a total of 129 identified pulmonary nodules and 26 patients where no pulmonary nodules could be found. The locations of each of the 129 nodules in the tomosynthesis section images were then identified. Some of the nodules were not visible in the reconstructed tomosynthesis section images. The locations of these nodules in the tomosynthesis section images were instead approximated using guidance of surrounding anatomy. In Fig. 1 the size distribution of the 129 nodules found in the patient material is given.
The size distribution of the nodules included in the present study. The volume of each real nodule was estimated as the volume of an ellipsoid, with axes lengths equal to the manual measurements of the nodule diameter in each orthogonal plane in the CT images. The diameters presented in the figure are the diameters of spheres with the same volumes as the corresponding ellipsoids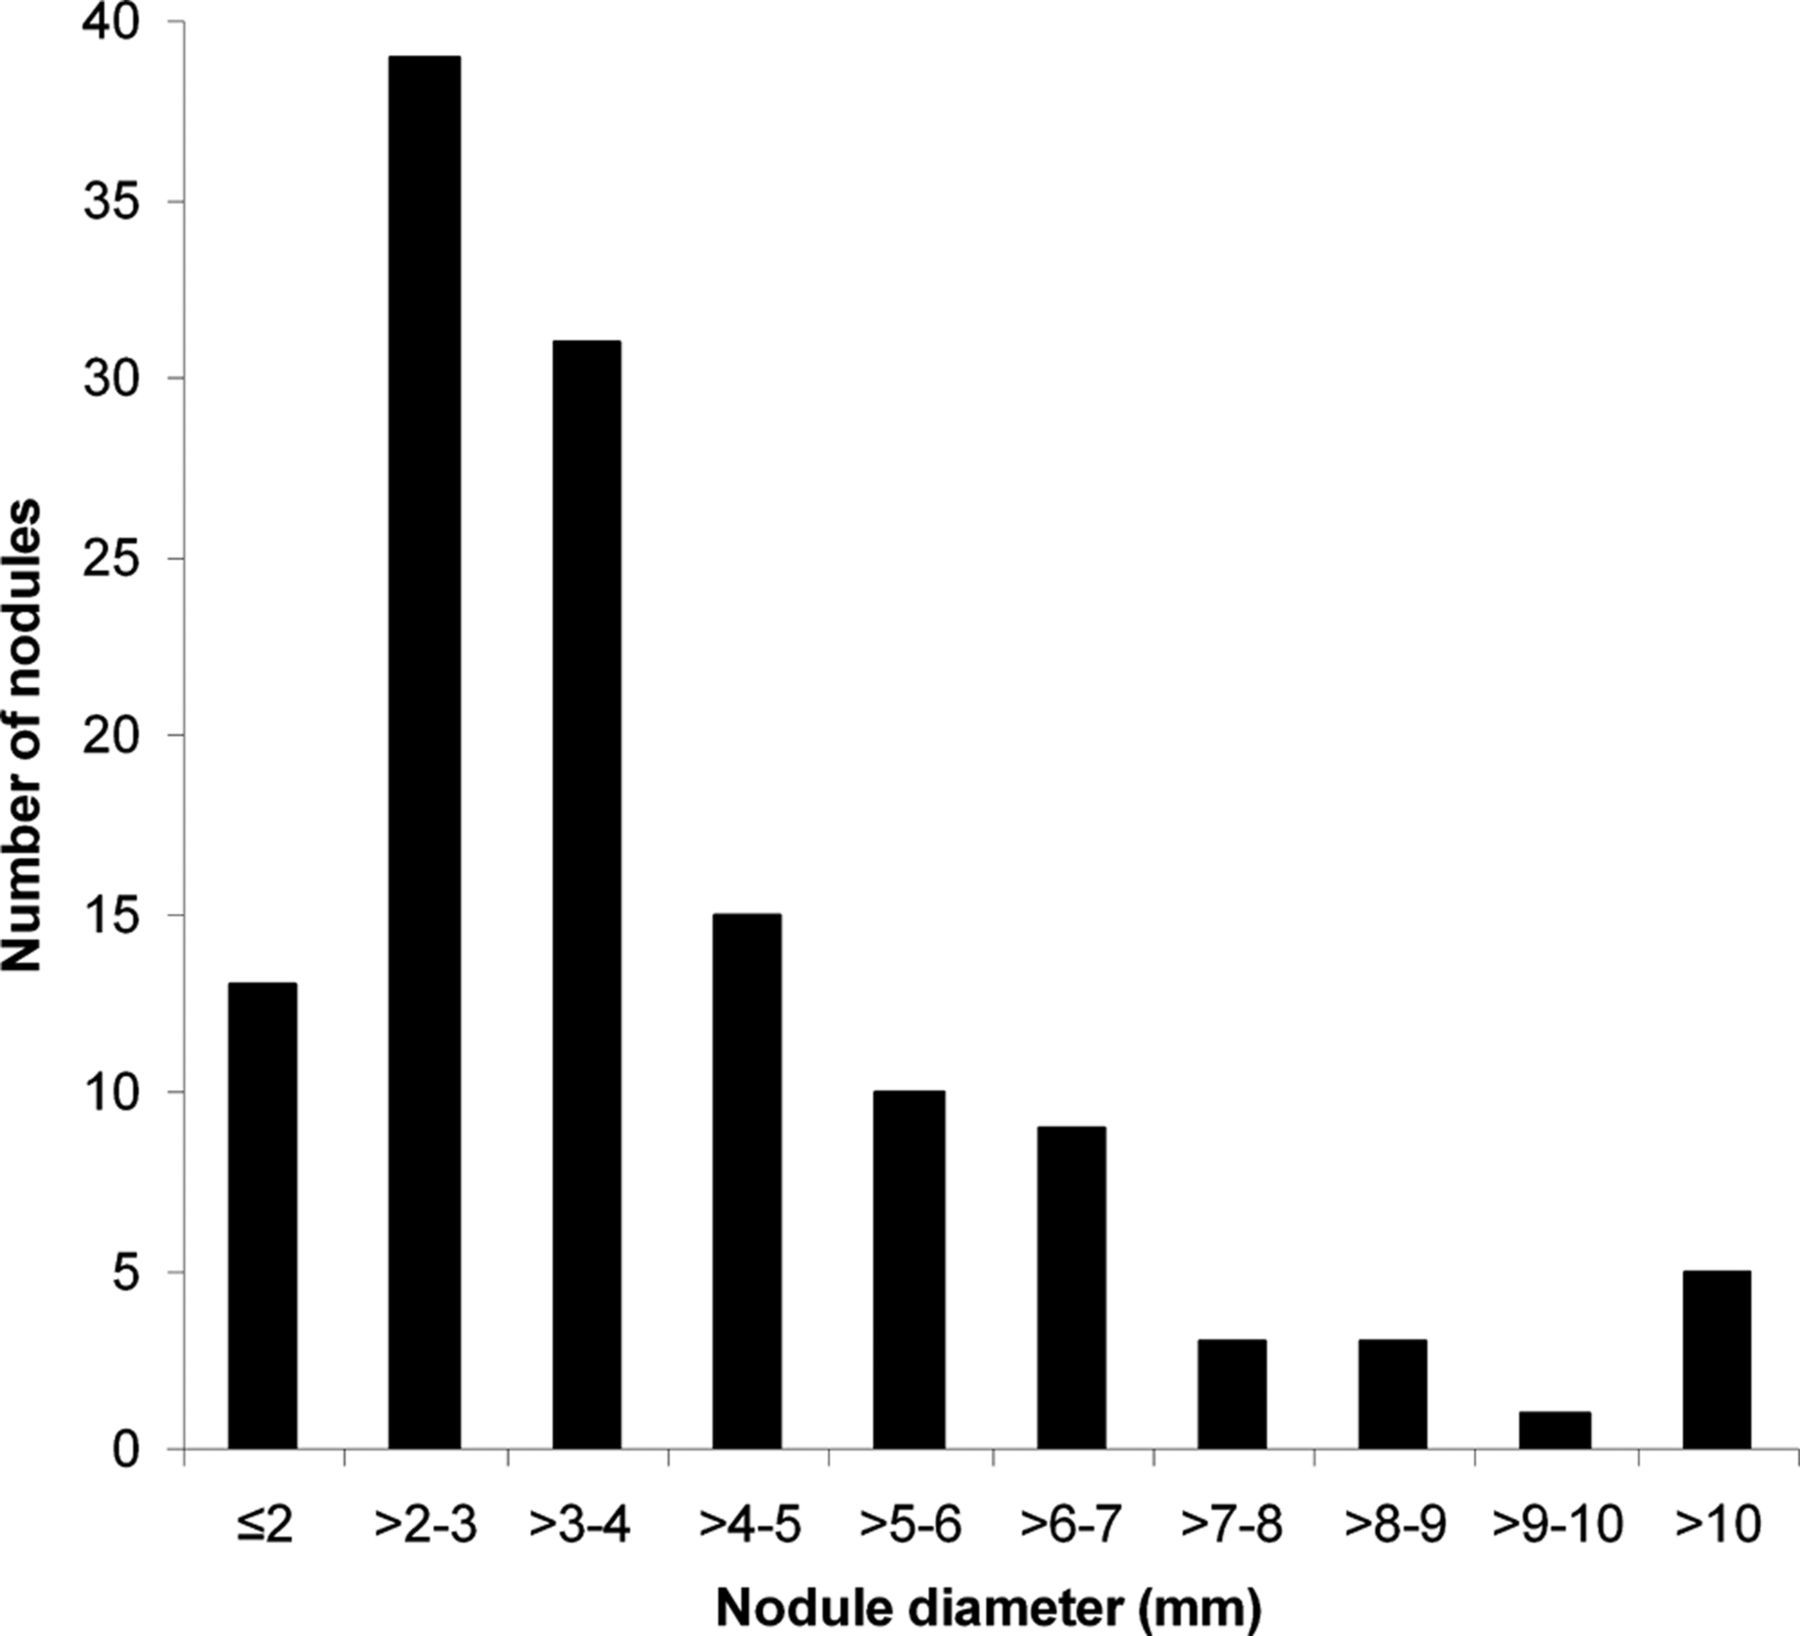
Nodule simulation method
The method of simulating lung nodules in chest tomosynthesis evaluated in the present paper is a modified version of the method described by Svalkvist et al. (28). The reader is referred to that paper for a thorough description of the method. Here, only a short description of the method and details regarding the modifications of the method will be given. The modifications regard the attenuation coefficient of the nodules and the scatter-to-primary ratio (SPR) used when inserting the simulated nodules into the tomosynthesis projection images.
Short description of the method
The method of simulating lung nodules in chest tomosynthesis uses the approach of adding a number of additional, smaller spheres to a larger original sphere, in order to create simulated nodules with irregular shape and surface structure (28). The irregular shape of each nodule is created by randomly shifting the center of the additional, smaller spheres relative to the center of the original sphere. By randomizing the number and size of the spheres added to the original sphere, different appearances of the simulated nodules are obtained.
The simulated nodules are projected into projection images of a tomosynthesis examination before reconstruction of the tomosynthesis section images. For a given desired position of the simulated nodule in the patient, the geometry of the tomosynthesis acquisition is used to calculate the corresponding position of the nodule in each projection image. The insertion of the nodule into each projection image is then performed by tracing the photons that are emitted from the focal spot, passes through the nodule and reaches the detector. By assuming homogeneous nodules, the radiation path through the nodule can be neglected and only the distance between the entrance and exit points is used for calculating the attenuation of the radiation inside of the nodule. In the insertion process, the blurring caused by the focal spot size and the signal spread in the detector, as well as the contrast loss due to scattered radiation, are taken into account.
In order to account for blurring due to patient motion the position of the nodule is randomly shifted between each insertion of the nodule into a projection image. The amount of shift relative to the original location is randomized according to a normal distribution with a given standard deviation (SDmotion) (28). The direction of the shift is randomized according to a uniform distribution over all directions. In Fig. 2a an example of a created nodule is given and in Fig. 2b the visual appearance of the simulated nodule in a reconstructed tomosynthesis patient image is shown.
An example of a created simulated nodule (a) and the visual appearance of the simulated nodule in a reconstructed tomosynthesis patient image (b)
Attenuation coefficient
In the description of the method by Svalkvist et al. (28), a constant attenuation coefficient (μnodule) of 0.20 cm−1 was used for all simulated nodules. As real, clinically found, nodules vary in mean density, the use of a constant attenuation coefficient for all simulated nodules will not reflect the reality. In the present study the CT number of the real nodules identified in the patient image material was determined using regions of interest (ROIs) placed over the area of the nodule in each of the adjacent thin CT slices where the nodule could be identified. The CT number of each nodule was determined as the mean of the CT numbers from all slices. By assuming linearity between CT number and attenuation coefficient, the corresponding attenuation coefficient for each nodule could be determined using an attenuation coefficient of 0.1928 cm−1 for water, which corresponds to a CT number of zero (mean photon energy 70 keV) (29). In Fig. 3 the distribution in CT number and corresponding attenuation coefficient for the nodules included in the present work is presented.
The distribution of the CT number and corresponding attenuation coefficient of the nodules included in the present study. In the figure, each data point represents one unique nodule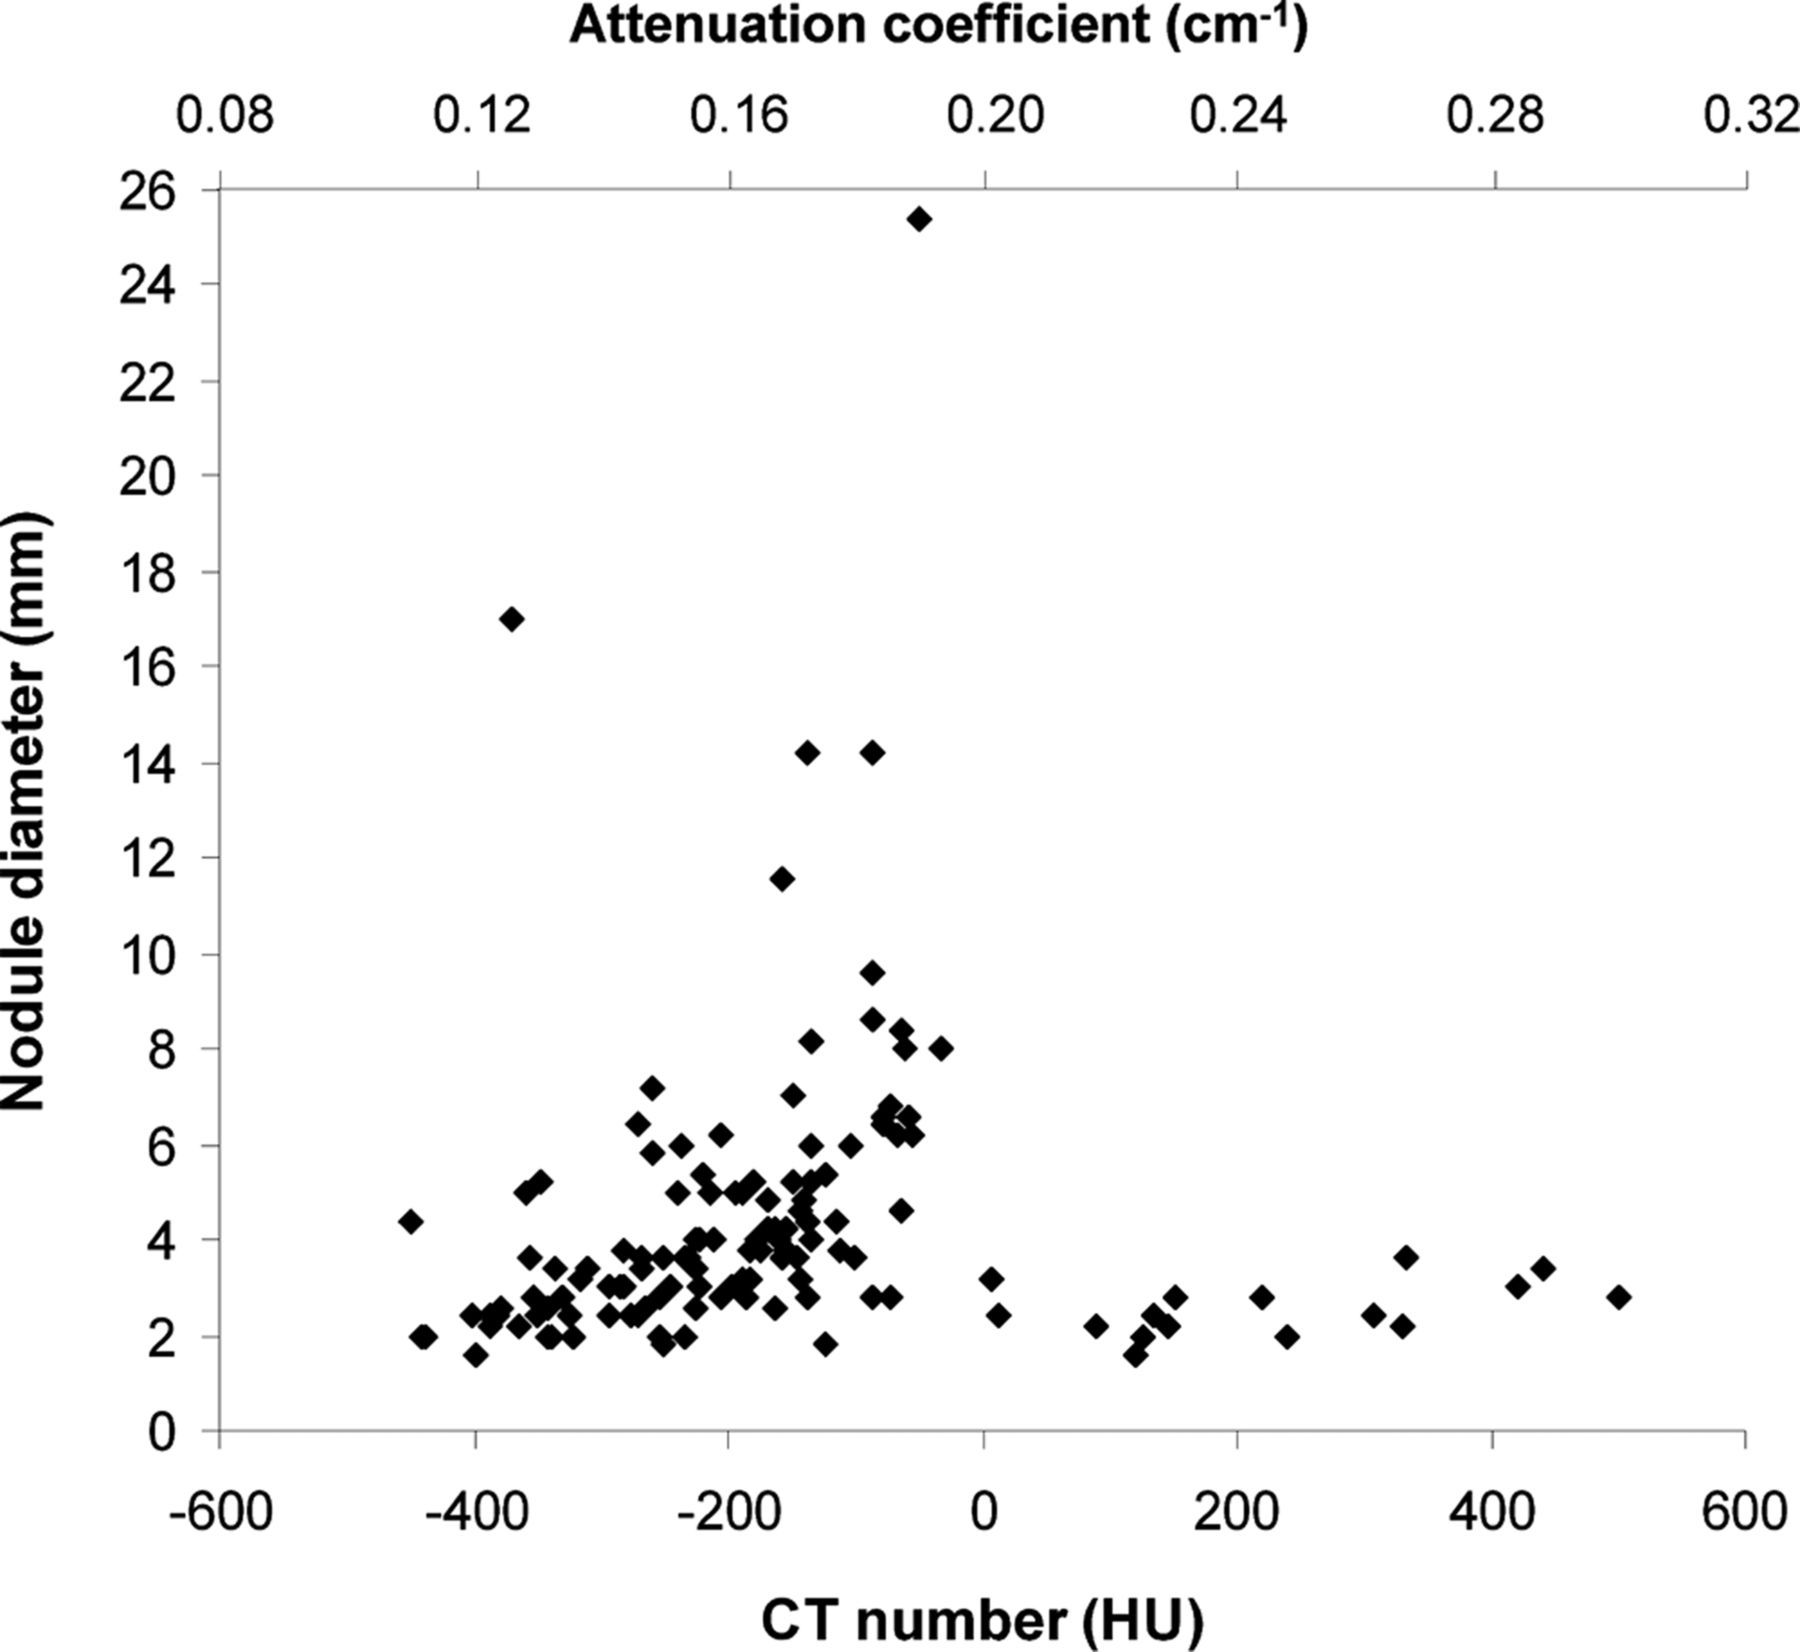
As the simulated nodules are to be inserted into the lung parenchyma of real patients, the attenuation in the existing anatomy at the nodule location should be compensated for to obtain a realistic image contrast. This can be achieved by subtracting the attenuation coefficient of lung tissue from the attenuation coefficient of the nodule in the simulations. In Svalkvist et al. a value of 0.05 cm−1 was used for the attenuation coefficient of average lung tissue (30), which corresponds to a CT number of approximately −750 HU and is obtained when measuring the average CT number in the lung region, including many of the large bronchi. However, as no nodules are located inside bronchi, manual measurements of the CT number in lung tissue were performed in the present work. The ROIs used for these measurements were placed in the lung region, avoiding areas with larger bronchi present. The obtained CT number (−850 HU) corresponded to an attenuation coefficient of approximately 0.03 cm−1, which was used in the simulations.
Scatter-to-primary ratio
The loss of nodule contrast due to scattered radiation is accounted for by adjusting the signal strength of the projected nodule according to:
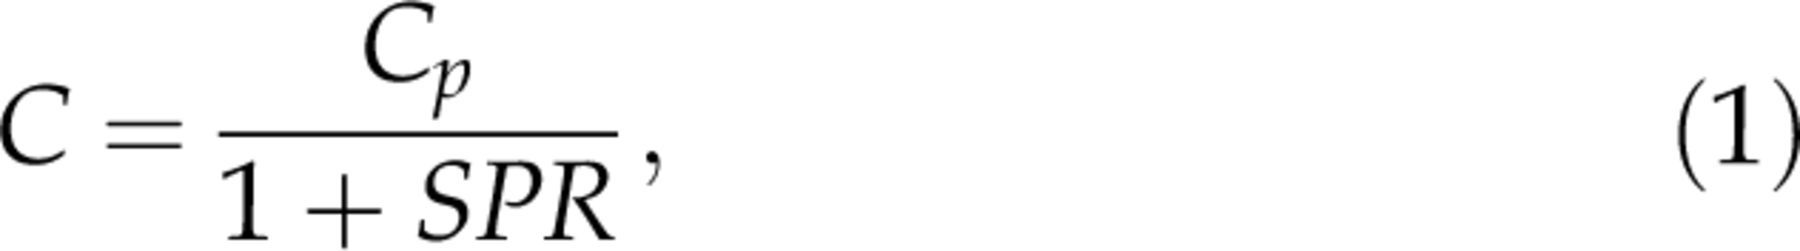
The use of Monte Carlo simulations is one way to obtain more knowledge about how the scatter fraction varies over different areas of the lung. Ullman et al. (34) performed Monte Carlo simulations of the tomosynthesis system used in the present work. The Monte Carlo simulations were performed using a voxel phantom, created using CT images of an anthropomorphic chest phantom (PBU-X-21, Kyoto Kagaku Co. Ltd., Kyoto, Japan) and threshold segmentation with a step density function. The signal contributions from scattered photons for each tomosynthesis projection image were calculated in a grid of 40 × 40 points and compared with the signal contribution from primary photons – calculated analytically – to obtain an estimation of the SPR in each grid point. In the present work, the SPR values from Ullman et al. were used to take the variation in SPR, both between different tomosynthesis angles and different regions of the lung, into account. To match the resolution of the tomosynthesis projection images, the 40 × 40 grid was interpolated to 2022 × 2022 points using bilinear interpolation.
According to the manufacturer, the anthropomorphic phantom (Kyoto Kagaku PBU-X-21) used for the Monte Carlo simulations in the work by Ullman et al. (34) has a size corresponding to a lean, 160 cm tall, Asian male. This is relatively small compared to a standard sized patient and also compared to the sizes of the patients included in the present study. Jordan et al. (32) determined the scatter fractions in patients undergoing erect PA and lateral chest radiography examinations. The examinations were performed using a tube voltage of 120 kV and the mean weight of the patients was 73 kg (range, 52–113 kg) with a PA chest diameter of 28 cm (range, 26–34 cm). In Ullman et al. the mean SPR in the lung region of the zero degree projection image of the anthropomorphic chest phantom was determined to be 0.18 (grid ratio 13:1), which is much lower than the mean SPR of 0.37 (range, 0.23–0.56) reported by Jordan et al. (grid ratio 12:1). Furthermore, a previous study (35) has shown that the SPR varies both between different areas of the lung and between the different angular projections that is included in the tomosynthesis examination using the GE VolumeRAD system. In order to obtain a higher validity of the simulated nodules it would be beneficial to take these SPR variations into account in the nodule simulation. To adjust the SPR values obtained from the Monte Carlo simulations by Ullman et al. according to patient size, the PA chest diameter of the patients included in the present study were determined by manual measurements in the lateral chest radiographic images. After correction for magnification, the measurements resulted in a mean PA diameter of 28.4 cm, which corresponds well to the mean PA diameter of the patients included in the study by Jordan et al. (28 cm). By making the assumption that the relative variations in SPR, both between different areas of the lung and different angular projections, are independent of patient size, the results presented by Jordan et al. for various patient sizes could be used to scale the SPR values given by Ullman et al. (34) according to the PA diameter of the patients included in the present study. In this way, the variation in SPR both over different regions of the lung and between different angular projections could be accounted for without introducing a bias due to the small-sized voxel phantom used in the simulations performed by Ullman et al.
Evaluation of the method
Nodule simulation

The range of possible values for the mean filter used for smoothing the shape (“Smooth shape”) and the surface structure (“Smooth surface”) of the simulated nodules. A uniform distribution was used for the randomization
Creation of study material
The major part of the patient image material (57 patients) was divided into three equally sized groups: patients with only real nodules (n = 19); patients with only simulated nodules (n = 19); and patients with both real and simulated nodules (n = 19). The rest of the patients (n = 7) were used as normal cases (cases without the presence of lung nodules) in the study. The distribution of the simulated nodules among the patients was randomized with the constraints that a simulated nodule should not be inserted into the same patient as the corresponding real nodule and that no more than 25 nodules in total should be present in one patient. The location of each simulated nodule was chosen to mimic the location of the corresponding real nodule, i.e. if one of the real nodules was located close to the heart and at the end of a vessel, the simulated nodule (with the same size and attenuation as the real nodule) was inserted into a similar anatomical location in a different patient.
After determining a location in a patient for the insertion of a simulated nodule, the corresponding location in the Monte Carlo simulated tomosynthesis images of the voxel phantom was identified. In this way, the most appropriate SPR values for the insertion of the nodules into the projection images could be established, using the method described above. The patient motion used for each nodule insertion was adjusted according to the overall patient motion at the location where the nodule was to be inserted. Suitable values of SDmotion were obtained empirically by visually matching the blurring of the nodule to the blurring of nearby anatomical structures. On average an SDmotion of 0.19 mm was used (range, 0.13–0.32 mm). More motion was generally applied to nodules located close to the heart.
In order to certify that no discrepancies in size existed between real and simulated nodules, all nodules were manually measured (longest diameter) in the tomosynthesis section images by a medical physicist. The nodules were presented in random order without information about the nodules being real or simulated. These measurements did not indicate any bias in size between the real and simulated nodules (P value 0.33 for a paired samples t-test).
Study set-up
Experience of the observers participating in the study
The images were evaluated using the in-house developed software ViewDEX (36, 37), which is designed especially for observer performance studies using medical images. The images were displayed in a unique random order for each observer. During the image evaluation the observers had the possibility to use the pan and zoom functions and also to change the window width and window level of the images. The image evaluation was divided into two sessions. The first session was a detection study, focused on comparing the sensitivity between real and simulated nodules. The observers were instructed to detect and mark nodules in the images, according to the free-response receiver operating characteristics (FROC) paradigm (38). For each marking the observers were given the task of rating their confidence of the marking being a nodule on a four-level rating scale from 1 (probably not a nodule) to 4 (definitely a nodule). The second session was focused on the visual appearance of the nodules. For this session, the tomosynthesis section images covering each nodule were extracted, and in each of these images the location of the nodule was pointed out to the observers. The image stacks of each nodule were then presented to the observers in random order. For each nodule the observers were given the task of rating their confidence of the nodule being real on a five-level rating scale from 1 (definitely a simulated nodule) to 5 (definitely a real nodule). In the case of a non-visible nodule in the second session, the observers were instructed to make a notation and these nodules were then removed from further analysis of visual appearance. No information about the distribution of nodules in the patient material was given to the observers prior to the study. They were however told that the patient material consisted of both normal and abnormal cases.
Statistical analysis
In session 1, each marking made by the observers in the images was classified either as a true-positive (TP) or a false-positive (FP). In order for a marking to be classified as a TP, the distance between a marking and the corresponding nodule centre had to be smaller than or equal to the nodule radius. As the tomosynthesis section images have a limited depth resolution, dubious marks were visually inspected to determine whether the marking should be classed as a TP or a FP.
As a given FP cannot be connected to any specific group of nodules (real or simulated), the analysis was focused only on the TPs. The true-positive fraction (TPF) – or sensitivity – was determined for each confidence threshold. By plotting the TPF for real nodules against the TPF for simulated nodules, a curve resembling a traditional ROC curve was obtained. The AUC was used to quantify the similarity in sensitivity for real and simulated nodules. Consequently, an AUC equal to 0.5 corresponds to equal sensitivity for real and simulated nodules, while an AUC >0.5 indicates higher sensitivity for real nodules and an AUC <0.5 indicates a higher sensitivity for simulated nodules. The modified ROC curves were generated using the ROCKIT software (C Metz, University of Chicago), which also reported AUC and its standard deviation.
In the evaluation of the visual appearance of the nodules (session 2), histogram plots were used to visualize the rating distributions for real and simulated nodules. For each of the observers, the observer rating distributions of real and simulated nodules were also statistically analyzed using a slightly modified ROC analysis, as previously employed by Saunders et al. (24) and Li et al. (26). Using a definition of real nodules as positive cases, the TPF was the likelihood of real nodules being rated as real and the false-positive fraction (FPF) the likelihood of simulated nodules being rated as real. For this modified ROC analysis, an AUC equal to 1.0 indicates perfect separation between real and simulated nodules whereas an AUC equal to 0.5 indicates equal ratings for real and simulated nodules (the observer cannot separate simulated nodules from real nodules). As above, the modified ROC curves were generated using the ROCKIT software.
Results
Fig. 4 shows examples of three real nodules (left) together with the corresponding simulated nodules (right). As can be seen, the location, size, and contrast of the simulated nodules visually agree well with those of the real nodules. Note that as the nodules are inserted into different patients, the amounts of scattered radiation and patient motion may differ.
Examples of real nodules (left) and the corresponding simulated nodules (right), matched according to size, attenuation and location but inserted into different patients (not matched according to patient motion or scattered radiation)
In the first session of the observer performance study the average detection rates (including all confidence levels) for real and simulated nodules were 24.2% (range, 18.6–29.5% for the different observers) and 29.3% (range, 25.6–34.9%), respectively. For no observer, the difference in detection rate was significant (P >0.18 for all observers). In Fig. 5, an ROC curve comparing the sensitivity of real and simulated nodules is given for each of the observers. Also, the AUC and its standard deviation is given for each of the observers. It should be noted that and AUC equal to 0.5 corresponds to equal sensitivity for real and simulated nodules. For all observers, the AUC was close to 0.5 (range, 0.43–0.55), indicating that the sensitivities for real and simulated nodules were comparable.
Results from the ROC analysis of nodule detectability. For each observer the AUC and its standard deviation is given. An AUC of 0.5 corresponds to identical sensitivity for real and simulated nodules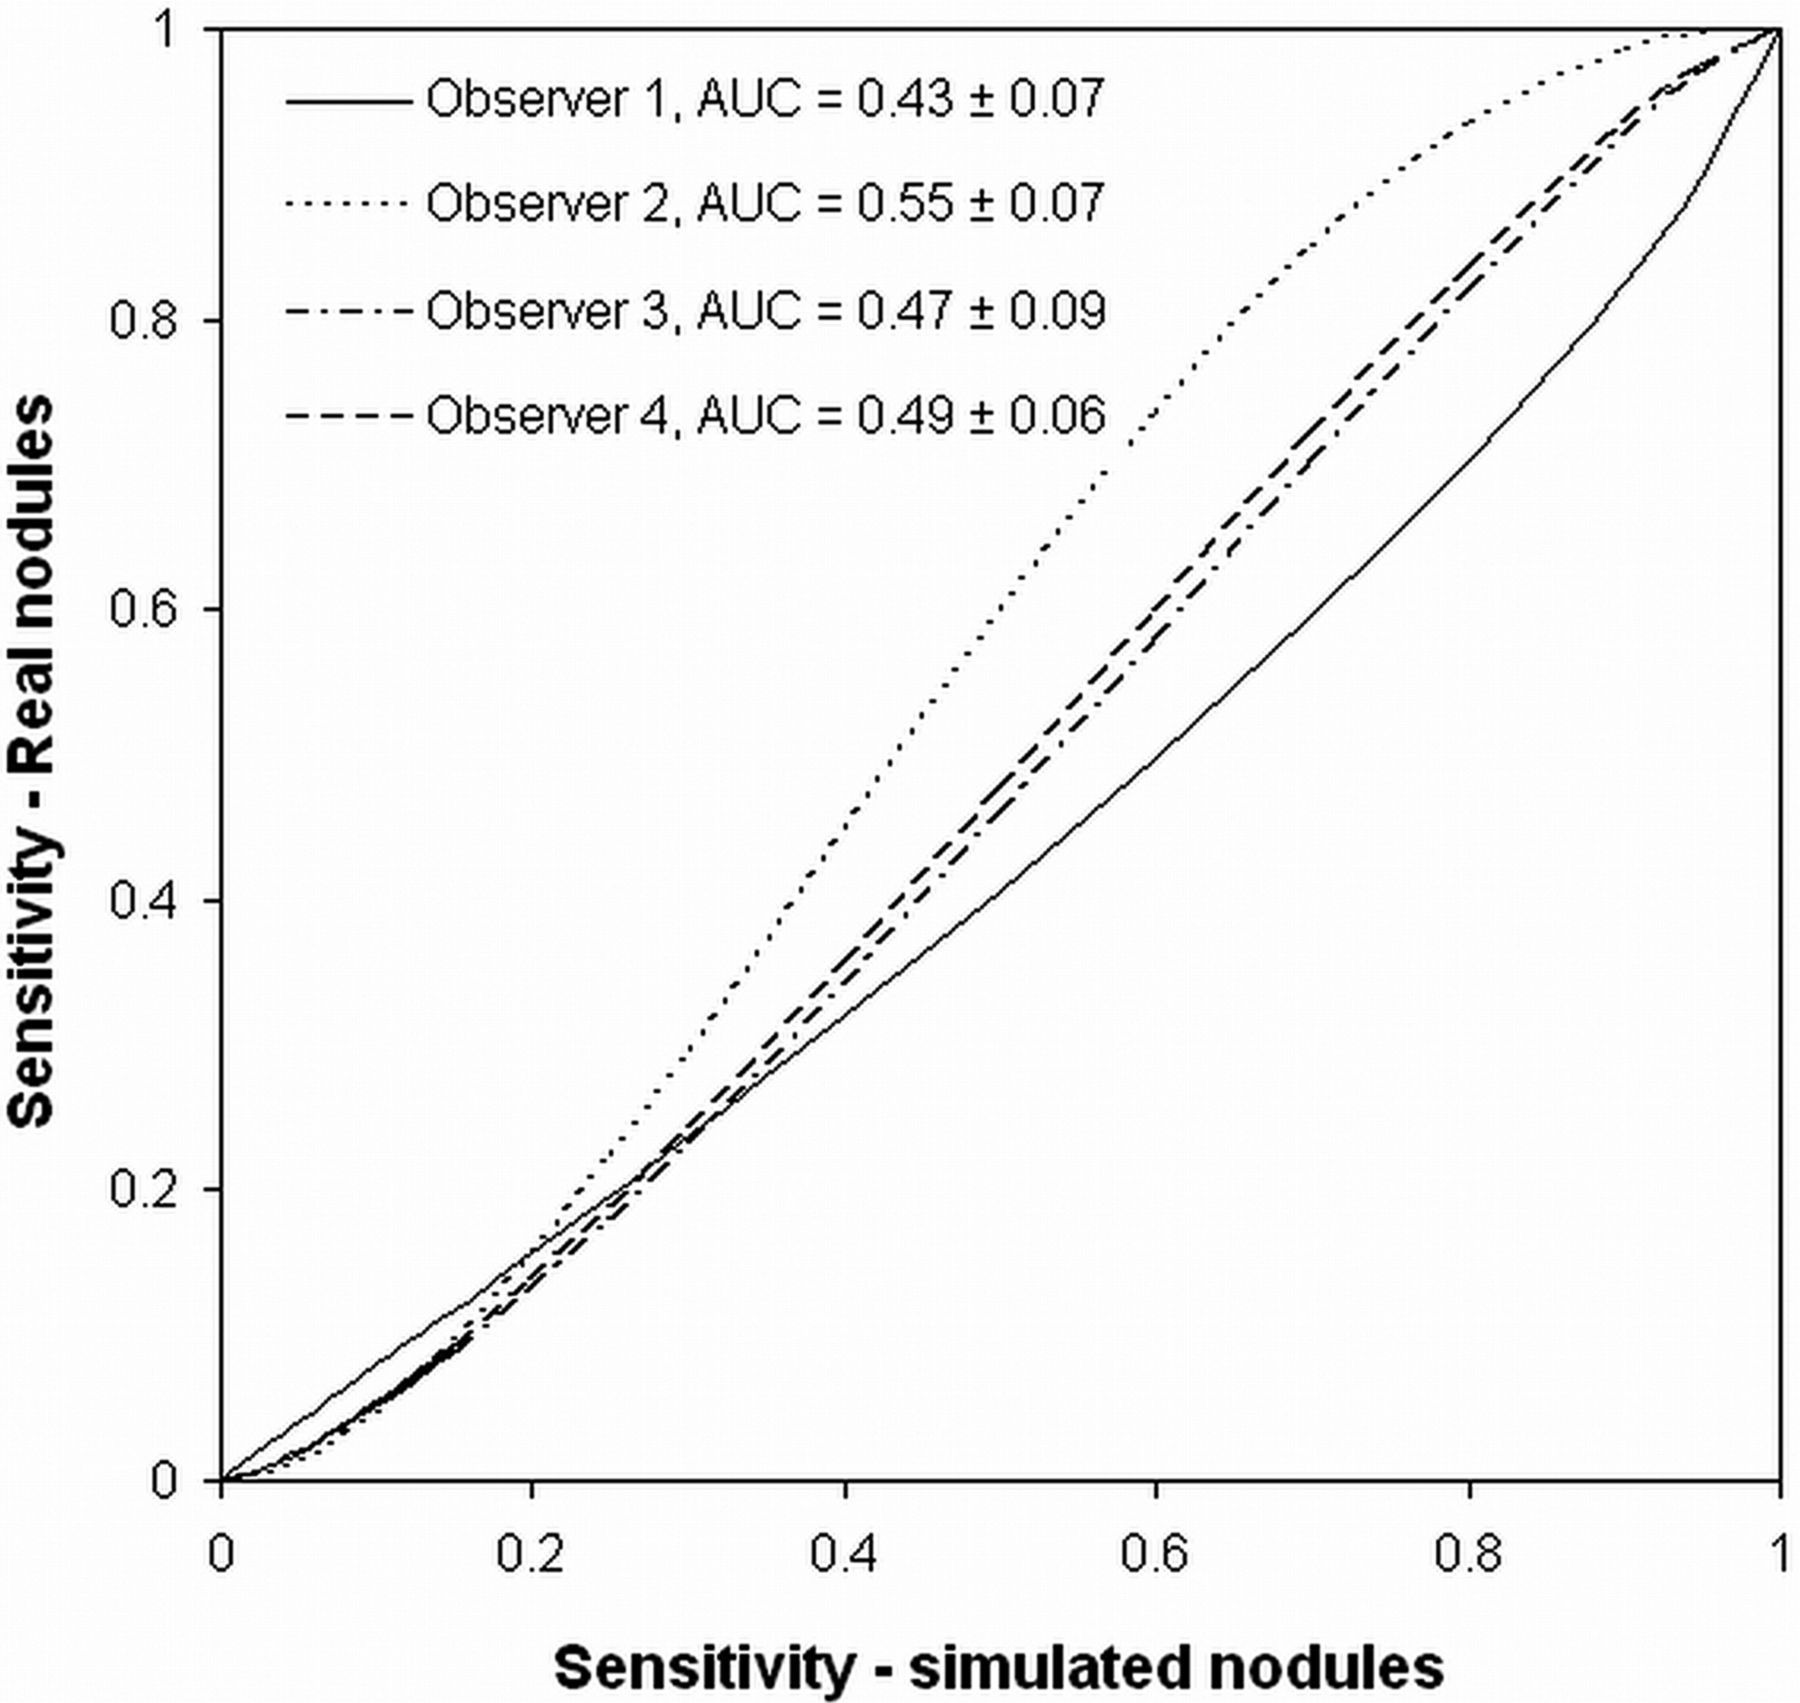
The AUC (and corresponding standard deviation) resulting from the modified ROC analysis of the visual appearances of real and simulated nodules, shown for each observer
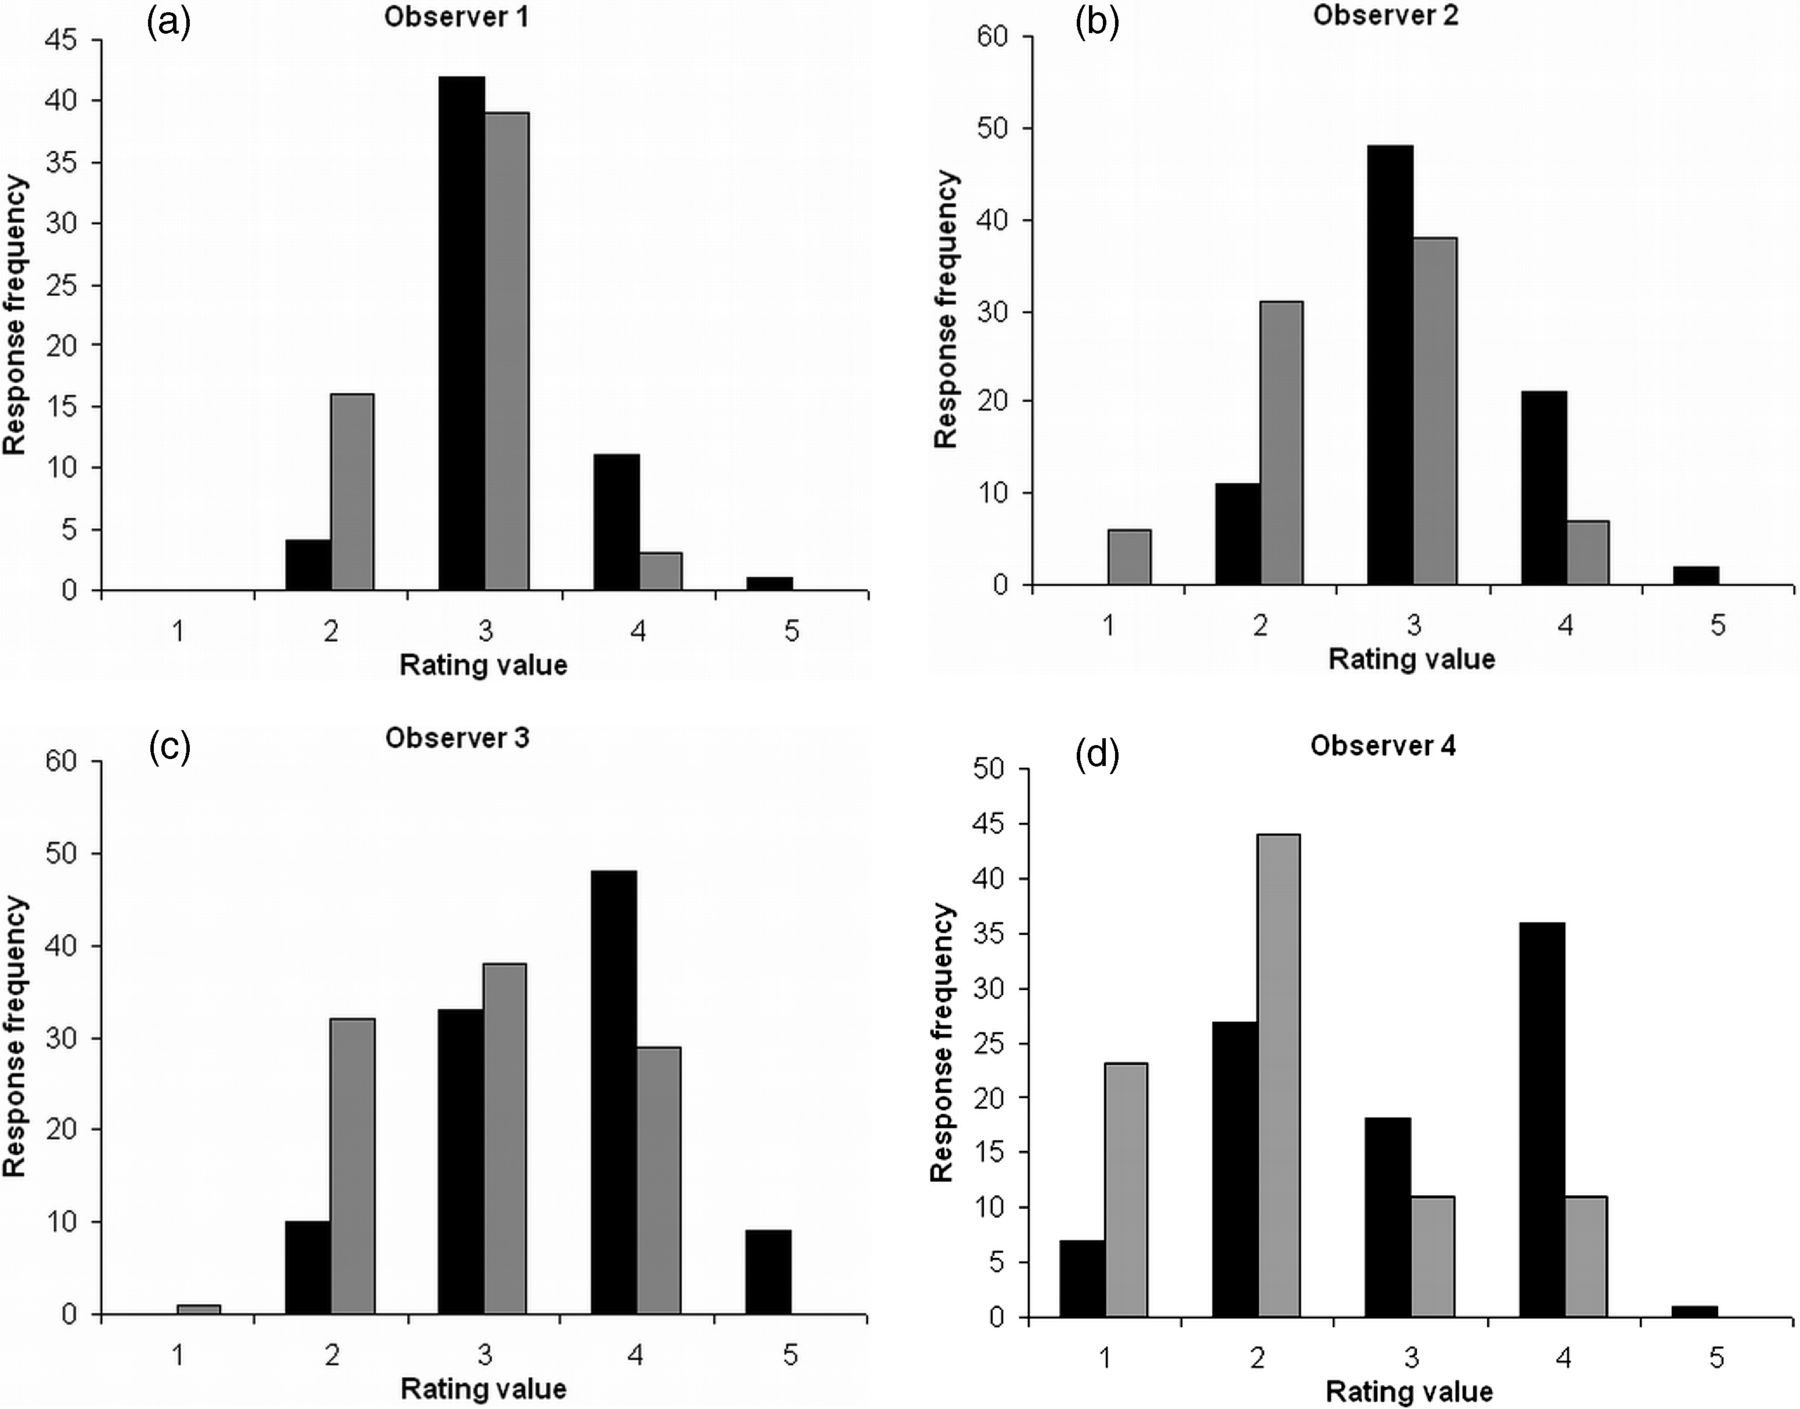
The rating distributions for real (black) and simulated (grey) nodules for each of the four observers
Discussion
In the present paper an improved method of simulating lung nodules in chest tomosynthesis has been described and evaluated. The method of nodule simulation presented in the present paper is a modified version of a method previously described by Svalkvist et al. (28). The changes are mainly related to the attenuation coefficient of the simulated nodules and the amount of scattered radiation that is applied when inserting the simulated nodule into patient images. The resulting method was evaluated by using a clinical patient material, consisting of patients with both normal and abnormal findings in regard to pulmonary nodules. Simulated nodules, matching the real, clinically found nodules, were created and randomly inserted into the patient material. Observer studies were conducted, with the tasks of both detecting pulmonary nodules and rating the realistic appearance of the nodules. The results revealed that the detectability of the simulated nodules was comparable to the detectability of the real nodules (Fig. 5), although, on average, the simulated nodules were graded lower than the real nodules when the observers rated their confidence of a nodule being real (Table 3).
Evaluations of methods for creating simulated pathology are in many cases focused on investigating the differences in visual appearance between real and simulated pathology (21–27). Only a few studies also investigate the sensitivity of the simulated pathology compared to that of real pathology. Li et al. (26) reported the differences in detection rate between real and simulated lung nodules in the case of paediatric CT examinations. A slightly higher detection rate was found for real nodules compared to simulated nodules (86.8% and 78.2%, respectively). The average detection rate for real and simulated nodules in the present study was 24.2% and 29.3%, respectively, while the comparison of sensitivity using the modified ROC analysis resulted in AUC values ranging from 0.43 to 0.55 for the different observers. As the AUC values were close to 0.5 for all observers it is indicated that the sensitivity for real and simulated nodules is comparable. As mentioned before, it is desirable to use clinical images when conducting observer performance studies with the goal of evaluating an imaging modality. The use of simulated pathology increases the possibilities for a thorough evaluation, as a clinical patient material that fulfils the desired requirements for study inclusion in many cases are difficult to collect. If the purpose of the evaluation is to investigate the limitations in detection of pathology it is important that the sensitivity of simulated pathology is comparable to that of real pathology. If this is not the case, the results from such an evaluation are of minor clinical interest.
In the present paper the evaluations of differences in visual appearance between real and simulated nodules were performed both qualitatively and quantitatively. In Fig. 6 it can be seen that the rating distributions of real and simulated nodules overlap considerably. However, the modified ROC analysis indicated a small difference between the distributions. The results from the present study should be compared to the results presented by Li et al. (26) who reported no difference in visual appearance between real and simulated nodules in pediatric CT images. In the study by Li et al. the AUC values ranged from 0.40 to 0.63. Saunders et al. (24) also reported results using the modified ROC analysis when comparing the visual appearance of real and simulated lesions in mammography. In the study by Saunders et al. AUC values ranging from 0.62 to 0.68 were reported and based on this it was concluded that the simulated lesions had a realistic appearance. The AUC values reported in the present study are slightly higher than the values reported by Saunders et al., but taking the similar sensitivity between real and simulated nodules into account, the results indicate that the present method can be used to create nodules that are realistic enough to be used in investigations of the detection limits of chest tomosynthesis.
Real, clinically found nodules are seldom completely homogenous and the internal composition of a nodule is often used when assessing the risk for malignancy in CT images (39–41). The method for nodule simulation described in the present paper can only be used for creating homogeneous nodules. By simulating homogeneous nodules, the radiation path through the nodule can be neglected and only the distance between the radiation entrance point into the nodule and the radiation exit point out of the nodule is used for calculating the attenuation of the radiation inside of the nodule. Due to the many projection images included in a tomosynthesis examination and the high resolution of each projection image the simulation time was quite long (approximately 10 min for a nodule with a diameter of 5 mm), even for this simplified method. In order to create non-homogenous simulated nodules the attenuation coefficient must be varied in the nodule, resulting in a much more complex calculation of the radiation passing through the nodule and reaching the detector, resulting in substantially longer simulation times. Furthermore, as the nodule internal composition often is quite complex, including calcifications, cavities, or air bronchograms (39, 41), realistic irregularities of simulated nodules are difficult to create. For example, Li et al. (26) developed a method of simulating lung nodules for pediatric MDCT, creating internal nodule irregularities by modelling a three-dimensional nodule as multiple two-dimensional masks on sequential MDCT slices. The contrast profiles of the two-dimensional profiles were defined according to Samei et al. (42) and Burgess et al. (43). Even though an observer performance experiment revealed that pediatric radiologists had difficulties in visually separating simulated nodules from real ones, Li et al. concluded that the irregularities in contrast profile of real nodules was not fully modelled using this method, as the internal variation of real nodules is more complex. However, due to the limitation in depth resolution in the tomosynthesis section images, it can be argued that the visual difference between a simulated homogenous nodule and the corresponding real non-homogenous nodule probably will be smaller in the case of tomosynthesis than in the case of CT. In the present study, the densities of the real, clinically found nodules were determined by measuring the CT number in ROIs placed over the area of the nodules. The measured value of a non-homogenous nodule is consequently a mean value of the different CT numbers present in the nodule. Thereby it can be argued that the attenuation used for the corresponding simulated nodules does reflect the overall contrast of the real nodule in a tomosynthesis section image. This argument is supported by the results from the present study, as it was shown that the detection sensitivity was relatively equal for the real and simulated nodules, indicating that the overall nodule contrast is not affected by the fact that the non-homogenous structure of the real nodules are not accounted for in the simulation process.
One might be surprised by the low detection rates reported for the real and simulated nodules in the present study (24.2% and 29.3%, respectively), compared to previously reported values for chest tomosynthesis by, for example, Vikgren et al. (44) and Dobbins et al. (45). However, in Vikgren et al. the creation of reference was made using CT slices with a nominal thickness of 4 mm or higher and in Dobbins et al. all nodules smaller than 3 mm in diameter were excluded from the study. In the present work a combination of CAD software and thin-section CT images was used for the creation of the reference and all nodules found in the patient material were included in the study. As a consequence, the study material in the present work included a large proportion of small nodules, as can be seen in Fig. 1, which to some extent can explain the relatively low detection rates as smaller nodules in general are more difficult to detect in chest tomosynthesis (44). According to the Fleischner Society (46) nodules smaller or equal to 4 mm are of small clinical interest, unless found in patients with known risk factors for malignancy. For nodules larger than 4 mm follow-up within 12 months is recommended, regardless of patient history. In Vikgren et al. it was found that over 80% of all lung nodules larger than 8 mm in diameter were detected using chest tomosynthesis. It was also found that all nodules larger than 6 mm in diameter could be identified in retrospect. Dobbins et al. reported that 74% of nodules larger than 4 mm in diameter could be identified in retrospect using chest tomosynthesis. These results indicate that chest tomosynthesis has a large potential for detection and follow-up of clinically relevant lung nodules.
In the present study the CAD software Lung VCAR was used by one of the radiologists during the creation of the reference. The Lung VCAR software is a semiautomated program, which uses segmentation algorithms in order to delineate the nodule borders (47). Based on this delineation the software also provides information about nodule size (volume). In the present work the sizes of the real nodules were however determined by performing manual measurements in three orthogonal planes. It has been shown that CAD software in many cases overestimates the nodule volume, especially for nodules attached to vessels or pleura (47, 48). The visual evaluations of the nodule delineation obtained from the Lung VCAR software in the present study revealed that other anatomical structures were often included in the delineated nodule volume. Furthermore, in a review paper Gavrielides et al. (47) mention that no appropriate software for volumetric measurements of non-solid pulmonary nodules is available. As the study material included in the present study consisted of solid, partly solid as well as non-solid pulmonary nodules, it was therefore determined that the manual measurements of the nodule sizes on CT would give more accurate results for the simulations. As previously described, no discrepancy in size existed between real and simulated nodules in the tomosynthesis images.
In conclusion, the present paper describes the results of a human observer performance study with the aim of evaluating a method of simulating lung nodules in chest tomosynthesis. The results show that the simulation method can be used to create artificial lung nodules that have similar detectability as real nodules in chest tomosynthesis, although experienced thoracic radiologists may be able to distinguish them from real nodules.
Footnotes
ACKNOWLEDGEMENTS
The authors would like to acknowledge Sara Asplund for her valuable contribution to the present work. This work was supported by the Swedish Research Council [2011-488]; the Swedish Radiation Safety Authority [2008/2232, 2009/1689, 2010/4363, 2012/2021]; the King Gustav V Jubilee Clinic Cancer Research Foundation [2007:28, 2008:50]; the Swedish Federal Government under the LUA/ALF agreement [ALFGBG-136281]; and the Health & Medical Care Committee of the Region Västra Götaland [VGFOUREG-12046, VGFOUREG-27551, VGFOUREG-81341].